an audit of high resolution coastal elevation data in ... · an audit of high resolution coastal...
TRANSCRIPT

An Audit of High Resolution Coastal Elevation Data in Australia GEOSCIENCE AUSTRALIA RECORD 2011/15 MAY 2011, VERSION 1 by N. Wilson1 and P. Tickle1.
1. Natural Resource Information Section, National Geographic Information Group, Geospatial & Earth Monitoring Division,
Geoscience Australia, GPO Box 378 Canberra ACT 2601, or Email: [email protected]

Department of Resources, Energy and Tourism Minister for Resources and Energy: The Hon. Martin Ferguson, AM MP Secretary: Mr Drew Clarke Geoscience Australia Chief Executive Officer: Dr Chris Pigram
© Commonwealth of Australia (Geoscience Australia) 2011 Geoscience Australia has tried to make the information in this product as accurate as possible. However, it does not guarantee that the information is totally accurate or complete. Therefore, you should not solely rely on this information when making a commercial decision. ISSN 1448-2177 ISBN (web) 978-1-921781-98-8 GeoCat # 71567 Bibliographic reference: Wilson, N., and Tickle, P., 2011. An Audit of High Resolution Coastal Elevation Data in Australia. Geoscience Australia Record 2011/15 (GeoCat Number 71567), 27pp.

An Audit of High Resolution Coastal Elevation Data in Australia
iii
Contents Acknowledgements ......................................................................................... 1 Background and Objectives ............................................................................. 1 Methodology ................................................................................................... 2 Data Findings ................................................................................................ 3 National........................................................................................................................................... 3
Topography ............................................................................................................................... 3 Bathymetry ................................................................................................................................ 4
State Summaries ............................................................................................................................. 5 New South Wales ...................................................................................................................... 5 Northern Territory ..................................................................................................................... 6 Queensland ................................................................................................................................ 7 South Australia .......................................................................................................................... 7 Tasmania ................................................................................................................................... 8 Victoria...................................................................................................................................... 9 Western Australia .................................................................................................................... 10
References .................................................................................................. 12 Appendices ............................................................................................................ 13 Appendix A - National Remoteness Index Map ........................................................................... 13 Appendix B - National Status Map............................................................................................... 14 Appendix C................................................................................................................................... 15
National Topography Summary Table .................................................................................... 15 National Bathymetry Summary Table..................................................................................... 16
Appendix D - State Maps.............................................................................................................. 17 New South Wales .................................................................................................................... 17 Northern Territory ................................................................................................................... 18 Queensland .............................................................................................................................. 19 South Australia ........................................................................................................................ 20 Tasmania ................................................................................................................................. 21 Victoria.................................................................................................................................... 22 Western Australia .................................................................................................................... 23


An Audit of High Resolution Coastal Elevation Data in Australia
1
Acknowledgements Geoscience Australia would like to thank all those individuals and organisations, particularly state and federal governments who contributed to the source data used in this analysis. These include and not limited to the Australian Hydrographic Service (AHS), New South Wales Land & Property Management Authority (LPMA), Northern Territory Department of Lands and Planning (DLP), Queensland Department of Environment and Resource Management (DERM), South Australian Department of Environment and Natural Resources (DENR), Tasmanian Department of Primary Industries and Water (DPIW), Victorian Department Sustainability and Environment (DSE), Western Australian Landgate. Special acknowledgement to the Australian Department of Climate Change and Energy Efficiency (DCCEE) for funding the Urban Digital Elevation Modelling in High Priority Regions Project, which is managed by the Cooperative Research Centre for Spatial Information (CRC-SI).
Background and Objectives The National Elevation Data Framework (NEDF) is a collaborative framework aimed at increasing the quality of elevation data and derived products such as digital elevation models describing Australia’s landform and seabed. The NEDF intends to optimise investment and access to existing and future data collections and ensure this investment is directed at policy and operational needs at national, state/territory and local levels. The NEDF Strategic Plan (2009-2011) (http://www.ga.gov.au/topographic-mapping/digital-elevation-data/nedf-strategic-plan-2009-11.html) is addressing a number of issues in relation to: • governance structures that enhance coordination and cooperation across all levels of
government and industry and define the roles and responsibilities of stakeholders • mechanisms for funding which promote cost sharing, and coordination of data acquisitions
which meet whole of government requirements. These strategies will be seeking value for the taxpayer and promotion of industry development
• technical standards which maximise the utility and interoperability of data to meet local, regional, national and international needs
• access, distribution and use arrangements which ensure information is discoverable, accessible and able to be used (without restriction) by government, industry and the community for improved decision making. These strategies will be underpinned by the expectation that data collected using public monies will reside within the NEDF
• industry development and capacity building to help grow the ability of industry to meet the expanding needs of Australia in this area of technology. This will also involve getting the right market drivers and the appropriate training programs.
With around 85% of Australia's population living in the coastal zone, rising sea levels and storm surges will have significant impacts on many of our coastal towns and cities. In recent years all levels of government have been investing heavily in the development of high resolution digital elevation models (largely acquired using airborne LiDAR) to better understand the risks to infrastructure and private property is particularly important for highly populated urban areas. The objectives of this data audit and gap analysis are to: • provide an overview of the status of high resolution elevation data acquisition around the coastal
zone. • highlight areas for potential acquisition or further processing based on priorities identified
through consultation with Commonwealth and State jurisdictions.

An Audit of High Resolution Coastal Elevation Data in Australia
2
Methodology In order to provide a framework for auditing existing or planned high resolution elevation (HRE) surveys in the coastal zone, and to prioritise potential future surveys a number of key inputs were considered including:
• a simple definition of the coastal zone based on any areas +30m in elevation above Mean Sea Level (MSL) (topography) or -30m below MSL (using a combined topography/bathymetry elevation model);
• a surrogate for population density and associated infrastructure based on the Australian Bureau of Statistics Remoteness Index
• Information on the extent of existing, current or planned surveys The coastal zone boundary was derived from the best available complete national DEM, the Australian Topographic and Bathymetric Grid (AusBathy) at a 250m resolution. The coastal zone for this analysis was defined as any area +30m in elevation above MSL (topography) or -30m below MSL (bathymetry). Most islands were excluded from analysis as well as any small erroneous areas in the data. For Queensland the coastal zone was clipped at the Exclusive Economic Zone (EEZ) to ensure it was within Australia maritime boundary jurisdiction. The Remoteness classification (index) was developed by the ABS in response to a demand for a statistical geography that allowed quantitative comparisons between 'city' and 'country' Australia where the defining difference between 'city' and 'country' is physical remoteness from goods and services. While other geographical and non-geographical classifications have included similar concepts, no such categorisation existed in the Australian Standard Geographic Classification ASGC prior to 2001. For the purposes of this study the 2006 Remoteness Index provided a reasonable approximation of population density and associated infrastructure although it is noted that some capital cities are not classified as expected. For example, Darwin is considered Outer Regional (medium density population) and Adelaide is a Major City with the same classification as Sydney. The Remoteness Index is also only available for “onshore areas”. Given the need to assess the current completeness of bathymetric mapping in a similar manner to topographic mapping, the Remoteness Index was simply extended “offshore” to classify areas adjacent to the coast to a depth of 30m (see appendix A). HRE surveys used in the audit are current to February 2011, and are based on information collected from state and federal government agencies, and from previous revisions of the National Elevation Data Framework Data Audits (2007-08, 2008-09; Anderson & Tickle 2007). Elevation surveys were categorised as completed or current. The current elevation survey category includes any known surveys that will be completed between December 2010 and December 2012 and have already had funding approved or set aside. In many cases these surveys are under way or waiting for appropriate seasonal conditions (dry-season in northern Australia and summer in southern Australia). Any proposed surveys that are awaiting funding or approval were not classified as current. Not completed was considered to be the area where there is no current and completed surveys, i.e. areas that have no identified high resolution elevation data acquired, funded or planned to be acquired before December 2012. Topographic elevation surveys from airborne LiDAR with an accuracy of 0.5m or better were considered in the analysis, unless otherwise stated. However the majority of the surveys are within

An Audit of High Resolution Coastal Elevation Data in Australia
3
the ±30cm vertical accuracy range (95% confidence) with the exception of one South Australian dataset which is within the 30-50cm range. These are considered to be HRE datasets and suitable for coastal modelling. Bathymetry elevation (depth) data extents were provided by the Australian Hydrographic Service (AHS). The specific vertical accuracy of the AHS data is unknown however, all data provided by the AHS was considered as “high accuracy data”. For the purpose of this study the bathymetric data was assumed to be within 0.5m. At the time of this analysis there had been no formal listing of the surveys accuracy and information will need to be verified with the data custodians as required. Overlapping survey extents were dissolved, depending on their completeness. Completed surveys were given priority over current and not completed surveys. This was to ensure areas were not double counted if survey areas overlapped. Area calculations have been rounded to the nearest square kilometre. The extracted depth range, clipped remoteness index layer and elevation survey status were combined into one output layer completed on a state by state basis. Area calculations (to the nearest square kilometre) and percentages were computed for both the topography and bathymetry for each combination of remoteness index (population density measure) and survey status (completed, current and not completed).
Data Findings NATIONAL Refer to Appendix B for a map of national completeness and status of HRE data acquisition in the coastal zone. Topography Australia has over 330,000km² of coastal zone with an elevation of <30m. Refer to Table 1. Major Cities only cover around 7,000km² (2%); Inner Regional areas cover about 25,000km²; Outer Regional areas cover around 44,000km² and Remote or Very Remote areas make up about 80 percent of the remaining low lying coastal regions. Significant investment in LiDAR acquisition within the coastal zone has dramatically increased coverage within the last 3-5 years with some 57,000km² of LiDAR completed and another 8000km² planned for acquisition within the next 12-18 months. The low lying areas of all our major coastal cities have effectively been completed. The 80% of the 25,000km² of Inner Regional areas now have high resolution DEM coverage. However, gaps remain in approximately 4,000km² primarily on the outer reaches of a Major Cities or regional centres such as Adelaide Hills region (SA), Hobart (Tas), Devonport (Tas), Gosford (NSW), Wonthaggi/Leongatha district (Vic) and northern Geelong (Vic). Almost two thirds of the medium population density Outer Regional areas have been captured, with 14,930km² still to be acquired. The most significant gaps are in south-east corner of Western Australia (2515km²), Northern Territory (2037km²), South Australia (5986km²) and Tasmania (988km²). Australia’s Remote and Very Remote coastal areas are have very little high resolution DEM coverage. Refer to Appendix C for the summary of topography data.

An Audit of High Resolution Coastal Elevation Data in Australia
4
Table 1: Acquisition of HRE data in Australia in relation to population density. Completed Not completed Current
Topography Total Area (km²) %
Area (km²) %
Area (km²) %
Area (km²)
Major Cities Australia 7028 97 6795 2 147 1 87Inner Regional Australia 24703 79 19605 16 3997 4 1102Outer Regional Australia 43984 58 25674 34 14930 8 3379Remote Australia 37328 13 4845 80 29815 7 2668Very Remote Australia 214177 0 82 100 213628 0 467
National Total 327220 17 57001 80 262517 2 7703 Bathymetry Australia has 528,786km² of coastal waters with a depth <30m (refer to Table 2). To date approximately 20 percent of the area has been covered by high resolution bathymetry with around 60 percent of the capture occurring in Remote or Very Remote regions associated with shipping lanes or exploration activities. Around 50 percent of the waters adjacent to Major City areas have been completed, with around 4,500km² still to be acquired. Current capture is occurring in the high population density areas along the east coast from northern NSW to near Cape York Peninsula in QLD. Victoria has the highest percentage of capture with the majority of the coast completed. The Major City region of Perth also has complete coverage with around 1,400km² of bathymetry data acquired using LADS. Whilst the bathymetry information was sourced from the Australian Hydrographic Service’s audit, there are still data acquisitions that have not been included from sources such as privatised port corporations. Refer to Appendix C for the summary of bathymetry data. Table 2: Acquisition of HRE data in Australia in relation to population density. Completed Not completed Current
Bathymetry Total Area (km²) %
Area (km²) %
Area (km²) %
Area (km²)
Major Cities Australia 8617 47 4049 53 4533 0 39Inner Regional Australia 29417 56 16341 35 10234 10 2843Outer Regional Australia 57642 37 21220 62 35962 1 460Remote Australia 69015 21 14822 77 53243 1 950Very Remote Australia 364095 13 48676 86 314869 0 550
National Total 528786 20 105107 79 418841 1 4842

An Audit of High Resolution Coastal Elevation Data in Australia
5
STATE SUMMARIES Refer to Appendix D state maps showing status of surveys for the coastal zone. New South Wales Approximately 15,000km² were identified as low coastal areas <30m elevation, with over 90% completed or currently being acquired. Refer to Table 3. Over 90 percent of the ~2000km² associated with Major Cities has been completed. Over 90 percent of the Inner and Outer regional and remote areas have been completed or currently being completed. 1279km² identified as not completed is mainly adjacent to inland river systems near Gosford and Newcastle where elevation is <30m but more than 50km from the coast. NSW Land and Property Management Authority (LPMA) are capturing LiDAR within the 10m contour line which results in some gaps in the upper reaches of major river systems draining to the coast. Bathymetry has been completed for approximately 50 percent of the 971km² identified as <30m depth and adjacent to Major Cities with 35 percent of the 3029km² of Inner Regional areas completed. 2881km² has been identified as a gap, with approximately 2,200km² uncompleted adjacent to Major Cities and Inner Regional areas. The state is expected to complete 273km² by the end of 2012 based on current and funded survey plans. Table 3: Acquisition of HRE data in NSW in relation to population density.
Completed Not completed Current New South Wales
Total Area (km²) %
Area (km²) %
Area (km²) %
Area (km²)
Major Cities Australia 2228 91 2021 5 120 4 87Inner Regional Australia 8769 82 7180 9 783 9 806Outer Regional Australia 3572 83 2981 10 356 7 235Remote Australia 102 38 38 21 21 42 42
Topo
grap
hy
Very Remote Australia 0 0 0 0 0 0 0
All Topography 14670 83 12220 9 1279 8 1170Major Cities Australia 971 51 491 45 441 4 39Inner Regional Australia 3029 35 1061 60 1818 5 150Outer Regional Australia 872 32 278 62 545 6 50Remote Australia 122 8 10 64 77 28 34
Bat
hym
etry
Very Remote Australia 0 0 0 0 0 0 0
All Bathymetry 4994 37 1840 58 2881 5 273
Total 19664 72 14060 21 4161 7 1443 The current LPMA capture program extends into 2014 and is estimated to total approximately 40,000 sq km of new LiDAR surveys over the full extent of the coastline, the Sydney basin and some 10,000 sq km over flood-prone inland locations. The immediate priority is to capture coastal data where none exists, and to this end approximately 10,500 sq km was flown on the North Coast during 2010 with an additional 3,300km² planned over coming months for the coast south of Wollongong. Much of the existing NSW data is restricted as it is not available under a whole of government licence and will be re-flown as part of LPMA’s ongoing program to improve access, maintain currency and accuracy, and product standards. This includes the Sydney basin, Wollongong, Gosford, Great Lakes, Taree, Port Macquarie, Coffs Harbour and Tweed LGA’s. LPMA’s LiDAR Product Specification (July 2010) details Level 3 classification as the minimum standard for distribution of LiDAR data, which requires significant (usually manual) effort to ensure

An Audit of High Resolution Coastal Elevation Data in Australia
6
that ground data is correctly classified consistent with the National ICSM LiDAR Acquisition Specifications (http://www.icsm.gov.au/icsm/elevation/index.html). LPMA recognises that it does not currently have sufficient resources to complete level 3 classification for all data captured, and has an estimated backlog of 9,000 sq km (2,250 tiles) requiring classification in the North Coast regions of Kempsey, Bellingen, Richmond Valley, Lismore, Ballina and Byron Bay. Additional funding is required to out-source this work and LPMA is seeking additional resources over the life of the current program to keep pace with capture, processing and classification tasks. Northern Territory Northern Territory has over 200,000km² within the defined coastal zone, of which 80,000km² is below 30m in elevation (refer to Table 4). The major population centre of Darwin is classified as Outer Regional by the ABS Remoteness Index. Approximately 1500km² of LiDAR has recently been acquired, effectively covering the major populated and adjacent coastal area. Bathurst Island and Melville Island (Tiwi Islands) were included in this analysis and have no HRE data acquisitions. Due to the remoteness of Northern Territory, bathymetry data is largely limited to major shipping lanes and areas of interest for petroleum and mining activities. 3000km² has been acquired in the Darwin area and a further 4683km² in remote northern shipping lane and exploration areas. The bathymetric data has primarily been captured in Beagle Gulf, Van Diemen Gulf and Anson. In total only about 6% of the near shore coastline has high resolution bathymetric data. No current or future LiDAR acquisitions are planned for 2011 by Northern Territory’s Department Lands and Planning. Table 4: Acquisition of HRE data in NT in relation to population density.
Completed Not completed Northern Territory
Total Area (km²) %
Area (km²) %
Area (km²)
Major Cities Australia 0 0 0 0 0Inner Regional Australia 0 0 0 0 0Outer Regional Australia 2939 31 901 69 2037Remote Australia 20421 3 655 97 19766
Topo
grap
hy
Very Remote Australia 59317 0 0 100 59317
All Topography 82677 2 1556 98 81121Major Cities Australia 0 0 0 0 0Inner Regional Australia 0 0 0 0 0Outer Regional Australia 11204 24 2708 76 8495Remote Australia 13940 10 1368 90 12572
Bat
hym
etry
Very Remote Australia 97972 3 3315 97 94657
All Bathymetry 123116 6 7392 94 115725
Total 205793 4 8948 96 196845

An Audit of High Resolution Coastal Elevation Data in Australia
7
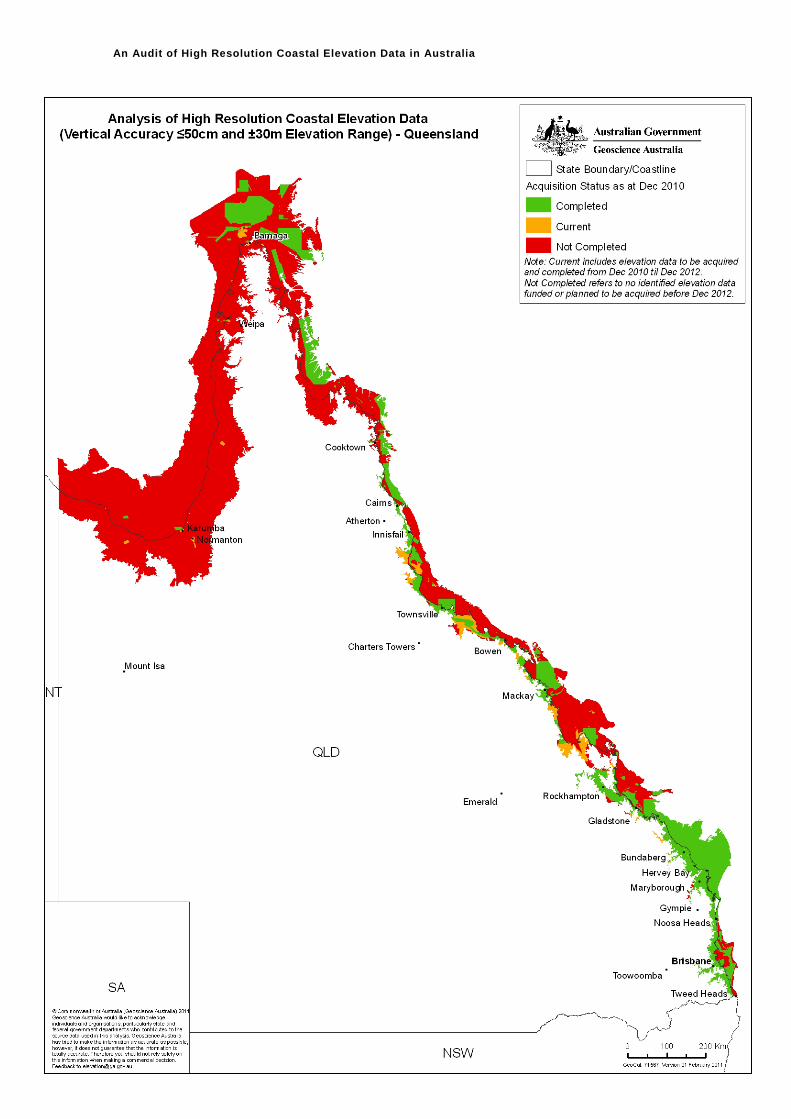
Queensland Queensland has around 106,000km² of land below 30m elevation and a further 211,000km² of nearshore area with a depth of <30m. Refer to Table 5. All major city and Inner Regional coastal areas <30m elevation have effectively been completed or are on program for completion during the 2011 dry season following 2-3 years of intensive data acquisition. The most remote areas north of Cooktown and around Cape York Peninsula to the Northern Territory border have not been captured, however there are current projects planned for completion by mid 2011 for numerous remote Gulf communities including: Kowanyama, Burketown, Normanton, Karumba, Weipa/Napranum, Bamaga, and several Islands off the Cape York Peninsula. Approximately 50,000km² or 25 percent of bathymetric survey areas have been completed in the <30m depth coastal water. 50% of coastal bathymetry of Major Cities has been completed and a further 8000km² of coastal bathymetry in high population density regions of adjoining capital cities and major shipping channels. The majority of bathymetry data that has not been completed is in the very remote parts of Queensland, from the Cape York to Northern Territory, south of MacKay and Bowen regions. Work has commenced on further processing and integration of existing datasets into a Queensland coastal DEM using the base level data acquired. Additional scoping is required to assess the need for hydrological conditioning of DEMs over high priority areas. Table 5: Acquisition of HRE data in QLD in relation to population density.
Completed Not completed Current Queensland
Total Area (km²) %
Area (km²) %
Area (km²) %
Area (km²)
Major Cities Australia 2163100 2163 0 0 0 0
Inner Regional Australia 5692 95 5416 3 180 2 96Outer Regional Australia 12809 65 8367 12 1571 22 2871Remote Australia 4444 21 921 20 897 59 2626To
pogr
aphy
Very Remote Australia 81320 0 16 99 80837 1 467
All Topography 106429 16 16883 78 83485 6 6061Major Cities Australia 2415 47 1129 53 1287 0 0Inner Regional Australia 10601 75 7905 0 3 25 2692Outer Regional Australia 29068 39 11378 59 17279 1 411Remote Australia 24922 33 8231 63 15775 4 916
Bat
hym
etry
Very Remote Australia 144344 15 21195 85 122598 0 550
All Bathymetry 211350 24 49838 74 156942 2 4569
Total 317779 21 66722 76 240427 3 10630 South Australia Over 30,000km² of South Australia were identified as low coastal areas with an elevation <30m (refer to Table 6). Almost 14,00km² has been completed, with 100% of the Major Cities completed. Approximately 2580km² of the Inner Regional areas have not completed, with approximately 500km² adjoining metropolitan Adelaide that has not been completed. Half of South Australia’s coastal area occurs in Outer Regional areas and almost 6000km² this area has not been completed. The south eastern part of the state was covered by the 2008 South East Region Information Centre’s

An Audit of High Resolution Coastal Elevation Data in Australia
8
LiDAR survey (from the mouth of the Murray River to the Victorian border) although the vertical accuracy of this is in the order of 30-50cm. Further investigation is required to confirm if it is possible to improve the quality of the LiDAR data to the 15cm vertical elevation standard. Some 40,000km² of near shore area with a depth of <30m were identified with approximately 6500km² completed. Bathymetric data has generally been completed in shipping channels up to Whyalla in Spencer Gulf, Ardrossan in Gulf St Vincent and Backstairs Passage between Kangaroo Island and the mainland. The gap analysis highlights the lack of bathymetry data over Major Cities with only 8 percent of the 2000km² adjacent to Major Cities completed. Islands were not included in this analysis although Kangaroo Island has not had any HRE data acquired. A proposed Adelaide Hills Region LiDAR Project was sent to the Office of the Information Officer in 2010. Although no funding is currently allocated to fund it the SA map (Appendix D) omits a significant portion of the populated parts of the state has been flown by IFSAR with a vertical accuracy of ~0.5m which may be improved with further processing. Planning is underway to acquire LiDAR over Victor Harbour and to extent coastal coverage around Adelaide through the Urban DEM Project funded by the Commonwealth Department of Climate Change and Energy Efficiency. Table 6: Acquisition of HRE data in SA in relation to population density.
Completed Not completed South Australia
Total Area (km²) %
Area (km²) %
Area (km²)
Major Cities Australia 380 100 379 0 1Inner Regional Australia 3088 16 508 84 2580Outer Regional Australia 16259 63 10273 37 5986Remote Australia 7607 35 2667 65 4940
Topo
grap
hy
Very Remote Australia 4491 0 0 100 4491
All Topography 31824 43 13827 57 17997Major Cities Australia 1964 8 155 92 1808Inner Regional Australia 10028 30 3015 70 7012Outer Regional Australia 2768 9 237 91 2530Remote Australia 19584 15 3013 85 16572
Bat
hym
etry
Very Remote Australia 4129 1 54 99 4075
All Bathymetry 38472 17 6475 83 31997
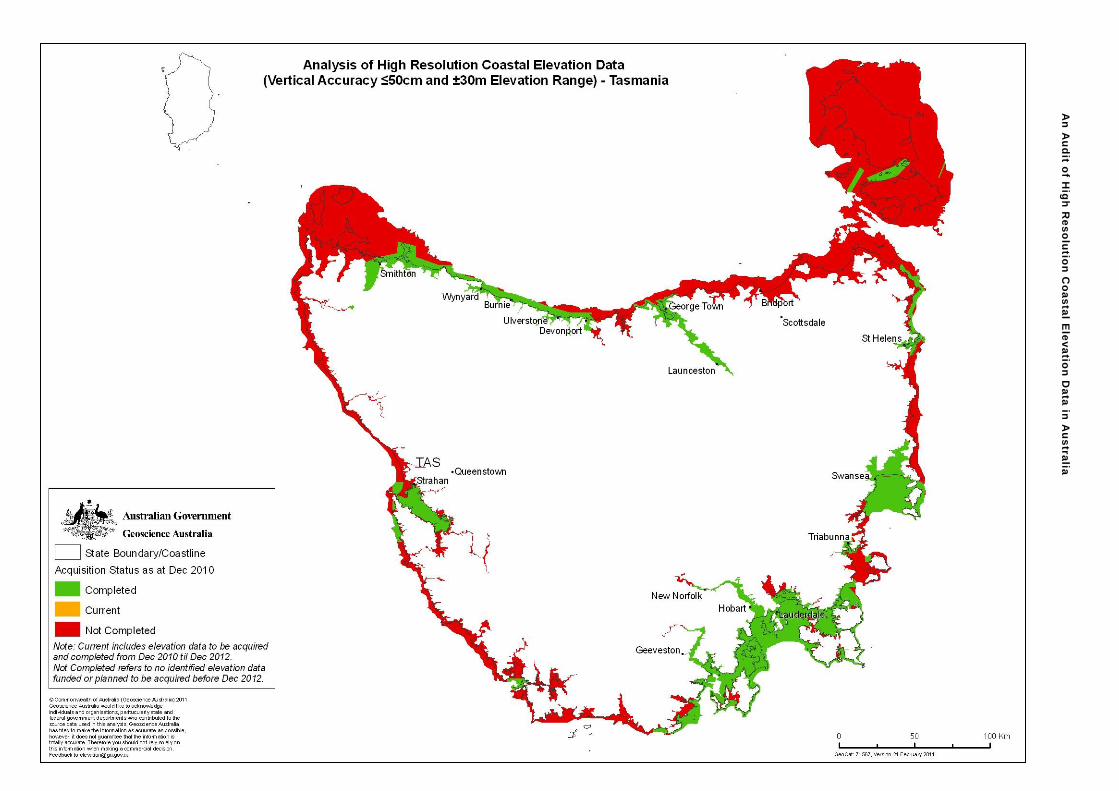
Total 70296 29 20302 71 49994 Tasmania The major populated areas of Tasmania are classified as Inner Regional areas. Around 90 percent of the estimated 376km² has been completed. 270km2 around the greater Hobart area was re-flown in February 2011. Refer to Table 7. Overall, a third of the coastal topography of Tasmania <30m elevation has been captured (1333km² out of 3815km²). Islands around Hobart were not part of the analysis except for North Bruny Island. The Tamar River into Launceston has been completed and Devonport area has been completed as well as the coastline from Smithton to Devonport with a vertical accuracy of 0.15m.

An Audit of High Resolution Coastal Elevation Data in Australia
9
Areas of low population density along the western coast and part of the eastern coast (1450km²) coastal topography (1450km²) and bathymetry (3583km²) have not been captured. Cape Barren, Flinders and Clarke Islands were included in the analysis. The quality of the processing of the Tasmanian survey from Smithton to Devonport to Launceston on the northern coast is currently under review. Depending on the review this area may need to be reprocessed or reflown. Approximately a third of coastal bathymetry <30m depth has been completed (3919km² out of 15,228km²). The Major Cities and medium population density areas around Hobart, Devonport and Launceston have been completed. The bays and inlets around Strahan (Queenstown) and Swansea have been completed. Areas that have not been completed are distance from the populated areas and are situated next to National Parks and protected areas, particularly on the west coast. Around the greater Hobart area, 270km2 was re-flown in February 2011. Tasmania has no other plans for HRE data acquisition in coastal areas except for the Smithton Launceston project pending a decision from the review. Table 7: Acquisition of HRE data in Tasmania in relation to population density.
Completed Not completed Tasmania
Total Area (km²) %
Area (km²) %
Area (km²)
Major Cities Australia 0 0 0 0 0Inner Regional Australia 376 88 332 12 44Outer Regional Australia 1743 43 755 57 988Remote Australia 1696 15 246 85 1450
Topo
grap
hy
Very Remote Australia 0 0 0 0 0
All Topography 3815 35 1333 65 2482Major Cities Australia 0 0 0 0 0Inner Regional Australia 317 88 280 12 37Outer Regional Australia 4071 58 2363 42 1708Remote Australia 4675 23 1092 77 3583
Bat
hym
etry
Very Remote Australia 6166 3 184 97 5982
All Bathymetry 15228 26 3919 74 11310
Total 19043 28 5252 72 13791 Victoria Victoria has over 18,000km² of coastal topography with <30m elevation, with 73 % of the area completed and a further 5% or 6428km² to be completed by the end of 2011 and 2012. Refer to Table 8. The 1851km² not completed are dispersed along the coast further inland than the extents of Victoria’s Coastal LiDAR Project which aimed to cover to 10m elevation inland. 98 percent of the Major City areas, and 85 percent of the Inner Regional areas have been completed. Only 274km² of the Inner Regional areas adjacent to high density population areas of Geelong and Melbourne have not been completed. Areas not completed in the Outer Regional areas are largely in the westernmost part of the state and the Gippsland region which accounts for almost 1500km².

An Audit of High Resolution Coastal Elevation Data in Australia
10
Victoria has the most comprehensive bathymetric mapping of any state with 5710km² completed along the entire coastline. The areas shown as not completed are largely to variations in water depth in relation to <30m used for the audit. Whilst Port Phillip Bay is shown mainly as not completed, it is understood that there are several sonar surveys that were undertaken by the Port of Melbourne Corporation that were not used in the analysis and that a significant portion of the bay is likely to be over the 30m depth range used in this study.. Victoria currently has 472km² of funded topography surveys planned for completion within the next year through the Victorian State Wide Rivers LiDAR, NW LiDAR Augmentation, West Gippsland LiDAR and the Melbourne Water State Parks LiDAR Projects. Victoria do not require future funding for data acquisition however there may need to be some provision for allowing the current data to be made available under whole of government licensing and for additional hydrological conditioning of the DEM’s. Table 8: Acquisition of HRE data in Victoria in relation to population density.
Completed Not completed Current Victoria
Total Area (km²) %
Area (km²) %
Area (km²) %
Area (km²)
Major Cities Australia 1126 98 1100 2 26 0 0Inner Regional Australia 3248 85 2775 8 274 6 199Outer Regional Australia 3996 56 2247 37 1478 7 272Remote Australia 380 81 307 19 73 0 0
Topo
grap
hy
Very Remote Australia 0 0 0 0 0 0 0
All Topography 8750 73 6428 21 1851 5 472Major Cities Australia 1834 47 854 53 980 0 0Inner Regional Australia 1985 74 1477 26 508 0 0Outer Regional Australia 5116 59 3026 41 2090 0 0Remote Australia 450 79 354 21 96 0 0
Bat
hym
etry
Very Remote Australia 0 0 0 0 0 0 0
All Bathymetry 9385 61 5710 39 3675 0 0
Total 18136 67 12138 30 5526 3 472 Western Australia 100 percent of the estimated 1132km² of major city area <30m elevation has been completed, in addition to 96 percent of the 3500km² of Inner Regional areas. Refer to Table 9. These areas include the Swan Coast area from Perth, in addition to the area from Yanchep south to Cape Naturaliste (west of Busselton). Western Australia has a vast area of Very Remote coastline with very little topographic LiDAR coverage outside major population areas. The major city areas have been completed, in addition to 75 percent of the 3500km² of Inner Regional areas. 21 percent of the 111,000km² of Remote Coast along the Carnarvon to Port Headland region has been covered due to the intensity of shipping lanes and petroleum exploration. There is significant bathymetric coverage with nearly 30,000km² or 24 percent near shore waters <30m depth completed. The major population areas have almost entirely been captured including 1400km² over the capital city Perth. Areas that have not completed are primarily in the most isolated

An Audit of High Resolution Coastal Elevation Data in Australia
11
parts located in the northern half of the state and the Nullarbor plains area where there is little habitation. Western Australia has no current or planned surveys for 2011. The government of Western Australia would like to head towards completing the whole coastline of WA with HRE data, but this is no small task. The area of this which is of the most interest is the Broome to Esperance part of the coast. Table 9: Acquisition of HRE data in WA in relation to population density.
Completed Not completed Western Australia
Total Area (km²) %
Area (km²) %
Area (km²)
Major Cities Australia 1132 100 1132 0 0Inner Regional Australia 3530 96 3394 4 136Outer Regional Australia 2666 6 151 94 2515Remote Australia 2678 0 11 100 2667
Topo
grap
hy
Very Remote Australia 69049 0 66 100 68984
All Topography 79055 6 4753 94 74302Major Cities Australia 1433 99 1421 1 12Inner Regional Australia 3458 75 2603 25 855Outer Regional Australia 4544 27 1229 73 3315Remote Australia 5322 14 755 86 4567
Bat
hym
etry
Very Remote Australia 111484 21 23927 79 87557
All Bathymetry 126241 24 29934 76 96307
Total 205296 17 34687 83 170609

An Audit of High Resolution Coastal Elevation Data in Australia
12
References Australian Bureau of Statistics, 2006. Australian Standard Geographical Classification (ASGC)
Remoteness Structure (RA) Digital Boundaries, Australia, 2006. Australian Bureau of Statistics, Cat. No. 1259.0.30.004, 3pp. See http://www.abs.gov.au/websitedbs/D3310114.nsf/home/remoteness+structure
Anderson, H. and Tickle, P, 2009. National Elevation Data Audit 0809. Geoscience Australia Maps, GeoCat number 70126, See https://www.ga.gov.au/products/servlet/controller?event=GEOCAT_DETAILS&catno=70126
Anderson, H. and Tickle, P, 2007. 2008 National Elevation Data Audit, The Shared Digital Representation of Australia’s Landform and Seabed. Geoscience Australia Record, 2009/625, 28pp, See https://www.ga.gov.au/products/servlet/controller?event=GEOCAT_DETAILS&catno=70125
Land & Property Management Authority, 2010. LPMA Standard LiDAR Product Specifications (Including RCD105 Imagery) Version 2.0 July 2010. Land & Property Management Authority, 15pp.

An A
udit of High R
esolution Coastal E
levation Data in A
ustralia
13 A
ppendix A
Appendix A

An A
udit of High R
esolution Coastal E
levation Data in A
ustralia
14
Appendix B

An Audit of High Resolution Coastal Elevation Data in Australia
15
Appendix C National Topography Results Summary Table
Completed Not completed Current
Topography State
Total Area (km²)
% Area (km²) % Area
(km²) % Area (km²)
Major Cities Australia NSW 2228 91 2021 5 120 4 87 NT 0 0 0 0 0 0 0 QLD 2163 100 2163 0 0 0 0 SA 380 100 379 0 1 0 0 TAS 0 0 0 0 0 0 0 VIC 1126 98 1100 2 26 0 0 WA 1132 100 1132 0 0 0 0
Total 7028 97 6795 2 147 1 87Inner Regional Australia NSW 3248 85 2775 8 274 6 199 NT 0 0 0 0 0 0 0 QLD 5692 95 5416 3 180 2 96 SA 3088 16 508 84 2580 0 0 TAS 376 88 332 12 44 0 0 VIC 8769 82 7180 9 783 9 806 WA 3530 96 3394 4 136 0 0
Total 24703 79 19605 16 3997 4 1102Outer Regional Australia NSW 3572 83 2981 10 356 7 235 NT 2939 31 901 69 2037 0 0 QLD 12809 65 8367 12 1571 22 2871 SA 16259 63 10273 37 5986 0 0 TAS 1743 43 755 57 988 0 0 VIC 3996 56 2247 37 1478 7 272 WA 2666 6 151 94 2515 0 0
Total 43984 58 25674 34 14930 8 3379Remote Australia NSW 102 38 38 21 21 42 42 NT 20421 3 655 97 19766 0 0 QLD 4444 21 921 20 897 59 2626 SA 7607 35 2667 65 4940 0 0 TAS 1696 15 246 85 1450 0 0 VIC 380 81 307 19 73 0 0 WA 2678 0 11 100 2667 0 0
Total 37328 13 4845 80 29815 7 2668Very Remote Australia NSW 0 0 0 0 0 0 0 NT 59317 0 0 100 59317 0 0 QLD 81320 0 16 99 80837 1 467 SA 4491 0 0 100 4491 0 0 TAS 0 0 0 0 0 0 0 VIC 0 0 0 0 0 0 0 WA 69049 0 66 100 68984 0 0
Total 214177 0 82 100 213628 0 467National Total 327220 17 57001 80 262517 2 7703

An Audit of High Resolution Coastal Elevation Data in Australia
16
Appendix C National Bathymetry Results Summary Table
Completed Not completed Current
Bathymetry State
Total Area (km²) %
Area (km²) %
Area (km²) %
Area (km²)
Major Cities Australia NSW 971 51 491 45 441 4 39 NT 0 0 0 0 0 0 0 QLD 2415 47 1129 53 1291 0 0 SA 1964 8 155 92 1808 0 0 TAS 0 0 0 0 0 0 0 VIC 1834 47 854 53 980 0 0 WA 1433 99 1421 1 12 0 0
Total 8617 47 4049 53 4533 0 39Inner Regional Australia NSW 3029 35 1061 60 1818 5 150 NT 0 0 0 0 0 0 0 QLD 10601 75 7905 0 3 25 2692 SA 10028 30 3015 70 7012 0 0 TAS 317 88 280 12 37 0 0 VIC 1985 74 1477 26 508 0 0 WA 3458 75 2603 25 855 0 0
Total 29417 56 16341 35 10234 10 2843Outer Regional Australia NSW 872 32 278 62 545 6 50 NT 11204 24 2708 76 8495 0 0 QLD 29068 39 11378 59 17279 1 411 SA 2768 9 237 91 2530 0 0 TAS 4071 58 2363 42 1708 0 0 VIC 5116 59 3026 41 2090 0 0 WA 4544 27 1229 73 3315 0 0
Total 57642 37 21220 62 35962 1 460Remote Australia NSW 122 8 10 64 77 28 34 NT 13940 10 1368 90 12572 0 0 QLD 24922 33 8231 63 15775 4 916 SA 19584 15 3013 85 16572 0 0 TAS 4675 23 1092 77 3583 0 0 VIC 450 79 354 21 96 0 0 WA 5322 14 755 86 4567 0 0
Total 69015 21 14822 77 53243 1 950Very Remote Australia NSW 0 0 0 0 0 0 0 NT 97972 3 3315 97 94657 0 0 QLD 144344 15 21195 85 122598 0 550 SA 4129 1 54 99 4075 0 0 TAS 6166 3 184 97 5982 0 0 VIC 0 0 0 0 0 0 0 WA 111484 21 23927 79 87557 0 0
Total 364095 13 48676 86 314869 0 550National Total 528786 20 105107 79 418841 1 4842

An Audit of High Resolution Coastal Elevation Data in Australia
17
Appendix D
Appendix D

An A
udit of High R
esolution Coastal E
levation Data in A
ustralia
18
An Audit of High Resolution Coastal Elevation Data in Australia
19

An A
udit of High R
esolution Coastal E
levation Data in A
ustralia
20
An A
udit of High R
esolution Coastal E
levation Data in A
ustralia
21

An A
udit of High R
esolution Coastal E
levation Data in A
ustralia
22

An Audit of High Resolution Coastal Elevation Data in Australia
23