basin-level digital elevation models · deriving high resolution digital elevation models ... north...
TRANSCRIPT

i
BASIN-LEVEL DIGITAL ELEVATION MODELS
AVAILABILITY AND APPLICATIONS
THE RED RIVER OF THE NORTH BASIN CASE STUDY
January 2004 IWR Report 04-R-1

ii

iii
________________________________________________________________________
PREFACE
This report is prepared as a product of the U.S. Army Corps of Engineers (Corps) Civil Works Research and Development Program. It was undertaken as a result of discussions between representatives of the Corps and the Red River Basin Commission. ________________________________________________________________________
ACKNOWLEDGMENTS
This report was developed by Paul Bourget, Programs Analysis Division, Institute for Water Resources (IWR), U.S. Army Corps of Engineers (USACE). Substantial input was provided by Mark Deutschman, and Brian Fischer of Houston Engineering, Inc. Other key contributors to the report included Carlton Daniel, USACE, Engineering Research and Development Center; and Terry Birkenstock, Scott Jutila and Tom Raster, St. Paul District, USACE.
________________________________________________________________________

iv

v
EXECUTIVE SUMMARY
Significant strides have been made in recent years in relation to our ability to
derive high resolution terrain data for environmental analyses. The increased availability of these high resolution data sources is dramatically enhancing our ability to characterize the earth’s surface and thus support process modeling. Remote sensing techniques for deriving high resolution Digital Elevation Models (DEMs) such as Light Detection and Ranging and Interferometric Synthetic Aperture Radar have proven to be particularly successful in support of hydrological and hydraulic model applications. However, the costs for collecting and processing these data types are extremely high and therefore unavailable for large portions of the U.S.
This report was prepared to assess the user requirements for a specific geographic
region where data of this quality are only sparsely available. User requirements were needed to more fully determine regional data voids and to devise practical approaches for addressing them. In addition to the requirements, this report describes the remote sensing based data types used to derive DEMs, as well as data processing and dissemination considerations. This information, in turn, provides the foundation for determining broad area data collection needs. Given the current high costs and processing times for high resolution data, multiple data set approaches – ones related to medium and high resolution data - were considered since the principle focus is large geographical coverage. For the purposes of this report, therefore, medium resolution is defined as data with a ± 3 feet vertical accuracy, while high resolution is data of ± 0.5 feet vertical accuracy.
The case study region for this report is the U.S. portion of the Red River of the
North drainage basin. This region has experienced a high number of extreme flood events for as long as hydro-meteorological records have been logged. Since this is such a high risk area a great deal of attention has been placed on finding ways to improve flood predictions and forecasts. The extremely flat terrain that defines the region’s character translates into the need for extremely precise and accurate terrain data in order to carry out representative flood risk and vulnerability analyses. Put another way, standard data sources, such as those provided by the United States Geological Survey, do not yield topographic detail sufficient to support state-of-the-art environmental modeling needs.
This study stemmed from discussions between basin stakeholders and the U.S.
Army Corps of Engineers. Representatives from the Red River Institute and Red River Basin Commission, acting on the findings of an International Joint Commission-sponsored task force, approached USACE to secure funding for a basin-wide DEM. The task force report, which was commissioned following the Red River Flood of 1997, recommended that new geo-spatial data sets be produced at the basin scale. The purpose of this particular report, therefore, is to determine, as best possible, the optimum scale for topographic data for this particular region based on available user needs.

vi
The user needs that form the basis of this study were derived from a series of formal and informal meetings held within the basin throughout much of 2003. Input was solicited from a broad range of water resource practitioners within the basin and emerging hydrologic and hydraulic models were subsequently reviewed in an attempt to project future application needs that warrant the use of highly resolved geo-spatial data sets.
The results suggest that regional stakeholders feel that high resolution topographic data is integral to the development of more accurate models. Model developers within the Red River Basin, for instance, have been faced with using the best available topographic data - typically a 30-meter DEM. The best available topographic data are then supplemented using traditional survey methods to obtain the topographic detail necessary to address specific situations, e.g., an area where flow breaks out, for model development and application.
For instance, within the Minnesota portion of the Red River Basin the State of Minnesota, through the Board of Water and Soil Resources, has and continues to fund the development of tributary scale hydrologic models. These models are typically HEC-1 or more recently, HEC-HMS1. The development of these models involves considerable effort to define watershed boundaries at a scale ranging from 1 to 5 mi2. The Red River Basin Commission is also sponsoring the development of unsteady hydraulic modeling of the Red River of the North using MIKE-11. Additionally, North Dakota’s Environmental & Energy Research Center has an aggressive basin-wide modeling effort underway.
Topographic data needs for model development vary and are dependent upon the spatial and temporal scale of the problem being modeled. Several generalizations apply to the need for topographic data for current model development activities within the Red River Basin, and they are as follows:
• A 30 m DEM, with an accuracy of equal to or less than one-half the contour interval, is commonly used for the development of most tributary scale hydrologic models. Although sufficient for determining hydrologic boundaries in many areas, higher resolution data are useful for determining the hydrologic boundary in difficult areas with little slope;
• Medium resolution (± 3 feet vertical accuracy) topographic data are needed to define shallow depressions and storage areas for the development of hydrologic models. Medium resolution data are also used to define overbank and storage areas for 1-d steady and unsteady flow models. Currently, these data are collected using traditional survey methods.
• High resolution data (± 0.5 feet vertical accuracy) are needed to define weir flow over roads, railroads, and levees to define the infrastructure and for the purposes of inundation and floodplain mapping. Currently, these data are collected using a combination of traditional survey methods and high resolution data collect, i.e.,
1 HEC models are developed by the Hydrologic Engineering Center, whereas MIKE models are developed by the Danish Hydrological Institute. Refer to Appendix 4 for a summary of the most widely used hydrologic and hydraulic models used within the Red River Basin.

vii
LiDAR. More advanced hydrodynamic modeling efforts, i.e., two-dimensional or three-dimensional modeling, require high resolution data.
The trend in modeling is towards the integration of Geographic Information
Systems and hydrologic and hydraulic models. These newer models, such as HEC-GeoHMS and HEC-GeoRAS, include tools that rely heavily upon a DEM. The current 30-m DEM is incapable of supporting these new tools within the Red River Basin, as it lacks the accuracy necessary to use the tools within HEC-GeoHMS to define the watershed boundaries and watercourses. Similarly, a 30-m DEM lacks the accuracy to use the flood inundation mapping tools within HEC-GeoRAS. High resolution topographic data are also a necessity for two-dimensional (or multidimensional) flow modeling. This type of modeling is periodically needed in areas along the Sheyenne and Red Rivers to properly define the flow field.
Based on these findings, the following three primary recommendations are provided in terms of future data collections:
- Formation of a basin-wide data focus group. Its charter would be to: 1) better
coordinate future data collections within the basin area; 2) develop a strategy for obtaining and disseminating current and future DEM data; and 3) facilitate continuing research activities throughout the basin, involving government, academic and private partnerships.
- Development of a 10-meter DEM for the entire Red River Basin. The U.S.
Geological Survey, working in conjunction with their Canadian counterparts, continue the development of a seamless 10-meter DEM for the entire Red River Basin. The data focus group’s responsibilities would be to explore funding options, data dissemination means, and data standardization. This option would be performed in partial fulfillment to the recommendation of the International Red River Basin Task Force for the generation of basin-wide data sets.
- Development of a high resolution data (± 0.5 feet vertical accuracy) DEM
collection for the 1997 flood boundary, plus safety factor. At a minimum, collect and process LiDAR data for the 1997 flood boundary, along with an arbitrary 5 mile buffer as a safety factor. The purpose of the safety factor is to reasonably ensure coverage into surrounding areas of interest. The area covered by the 1997 flood boundary plus the safety factor is approximately 4,450 mi2.
The Red River Basin poses unique challenges in terms of our ability to map the
terrain with current technologies. The lessons learned from this region should prove beneficial to other regions with a stated need for detailed topographic data involving broad area coverage.

viii

ix
TABLE OF CONTENTS Preface............................................................................................................................... iii Acknowledgements .......................................................................................................... iii Executive Summary ...........................................................................................................v Table of Contents ............................................................................................................. ix BACKGROUND ................................................................................................................1 RED RIVER BASIN SUMMARY....................................................................................5 STANDARD NATIONAL ELEVATION DATA SETS.................................................9
• Low Resolution Data Sets......................................................................................10 • Medium Resolution Data Sets ...............................................................................10
HIGH RESOLUTION DEM DATA ..............................................................................13
• Operational Data Collection Systems ....................................................................13 • Related Studies and Collection Planning Performed Elsewhere ..........................21
THE MAP MODERNIZATION PROGRAM ..............................................................25 DIGITAL ELEVATION MODEL APPLICATIONS ..................................................27
• Water Resources and Watershed Planning ...........................................................27 • Modeling ...............................................................................................................30 • Engineering Analysis .............................................................................................34 • Web Mapping Tools and Applications ..................................................................35
NON- STANDARD BASIN DATA.................................................................................39
• High Resolution Collections to Date .....................................................................39 • Pending High Resolution Collections within the Basin.........................................39
HIGH AND MEDIUM-RESOLUTION DATA GAPS ................................................43
• Background............................................................................................................43 • Geographical Extent for Future High Resolution Coverage..................................45 • Geographical Considerations .................................................................................48

x
DATA PROCESSING CONSIDERATIONS................................................................49 DATA DISSEMINATION CONSIDERATIONS .........................................................51
• Overview ..............................................................................................................51 • Distribution Examples ...........................................................................................51 • Demand ..............................................................................................................52 • Distribution Methods .............................................................................................52 • Distribution Costs ..................................................................................................55
CONCULSIONS AND RECOMMENDATIONS.........................................................57
• Technical Considerations.......................................................................................57 • Organizational Considerations...............................................................................59
REFERENCES.................................................................................................................61 FIGURES Figure 1: The Red River of the North Basin........................................................................6 Figure 2. Visual depiction of the detail provided at five different spatial resolutions.........9 Figure 3. Data source index for NED dataset. ...................................................................11 Figure 4. Merger of LiDAR and IFSAR DEMs ...............................................................20 Figure 5. Location map of IFSAR DEM data .......................................................................... 22 Figure 6: 1997 Red River flood outline downstream of Grand Forks, ND ......................33 Figure 7. LiDAR collects within the Red River Basin. ....................................................41 Figure 8. Geographic extent options map. .........................................................................45 Figure 9. As-needed distribution method..........................................................................53 Figure 10. FTP download method ....................................................................................54 Figure 11. Interactive map download method. .................................................................54 Figure 12. Advanced interactive map download method. ................................................55 TABLES Table 1 - Summarizes the known collections to date within the U.S ................................40 Table 2. Data dissemination pros and cons.......................................................................53 APPENDICES ..................................................................................................................63 1. Hydrologic Models: Determination of Flood Hydrographs..........................................63 2. Hydraulic Models: Determination of Water-Surface Elevations for Riverine Analysis.........................................................................................................67 3. Summary of U.S. LiDAR Collects in the Red River Basin ..........................................73 4. Relevant Websites.........................................................................................................79 5. Abbreviations and Acronyms .......................................................................................81

BASIN-LEVEL DIGITAL ELEVATION MODELS
1
BACKGROUND
Decision makers throughout the water resources community are cognizant of the value that information technologies such as Geographic Information Systems (GIS) and Global Positioning Satellites (GPS) provide. GIS is a primary example of an enabling technology that is being readily applied as a decision aid for a variety of water resources applications, including risk and vulnerability assessments, flood forecasting, water quality monitoring, land use management, and recreational planning.
To generate GIS products for local and regional applications and decision making it is essential that accurate and reliable baseline topographic information be available. However, it is extremely difficult to define the optimum spatial resolution of the topographic information for this diverse decision-making community. Currently, it is largely the various hydrologic and hydraulic models in use that determine the scale. Hydrologic and hydraulic models are becoming increasingly reliant upon medium (± 0.5 feet vertical accuracy) and high (± 0.1 feet vertical accuracy) resolution digital elevation data. Data that are that highly resolved have been historically extremely costly to collect and process and, as such, normally unavailable for large geographic areas.
At the local governmental level - where many of the key decisions are made – standard, national coverage topographic data sets, such as those typically produced by the U.S. Geological Survey (USGS), lack the detail necessary to support the decision- making process. New products and services have been introduced in recent years to fill these emerging data voids. As an augmentation to national topographic data sources, data derived from Light Detection and Ranging (LiDAR), Interferometric Synthetic Aperture Radar (IFSAR), and Differential GPS (DGPS) are being operationally used for a widening range of applications. Unfortunately, these data products are often collected and processed on a fragmentary basis and, as such, are not routinely coordinated at the regional level.
This study was conducted to evaluate the collective need for highly resolved digital elevation data for a specific region – the Red River of the North Basin. Owing to its unique geographic and hydro-meteorological character, this is an area that is highly susceptible to significant flood events. The impact that the 1997 flood had on this region has since generated high levels of interest in terms of developing basin-wide approaches to water resources management, highlighting the need for better topographic data.
Interest in a basin-wide Digital Elevation Model (DEM) can largely be attributed to
the work of three separate groups formed following the 1997 flood - the International Red River Basin Task Force (IRRBTF), the International Flood Mitigation Initiative (IFMI),

BASIN-LEVEL DIGITAL ELEVATION MODELS
2
and the Red River Basin Board (RRBB1). The IRRBTF was formed after the governments of Canada and the United States requested that the International Joint Commission (IJC) assess the causes and effects of the 1997 flood and make risk reduction recommendations. The IJC is a bi-national organization that assists Canada and the U.S. in addressing trans-boundary water resources issues. The IRRBTF was charged by the IJC to report on the current state of flood forecasting practices, capabilities, and technologies, including data sharing among agencies and governments (IJC, 2000). The IRRBTF concluded that the development of a consolidated database containing hydrometric, climatic, topographic and other technical data within the Basin was needed to improve regional forecasting and modeling capabilities2.
Concurrent to the IJC deliberations, a wholly separate initiative was led by the Federal Emergency Management Agency (FEMA) - the International Flood Mitigation Initiative (IFMI). The IFMI Final Report and Executive Summary (IFMI, 2000) describes the various initiatives that stemmed from this task force. IFMI was a short-term “Project Impact” initiative that promoted fourteen different mitigation activities, one of which led to the formation of the Red River Basin Institute (RRBI). The RRBI is responsible for coordinating research, mapping, and watershed education within the Basin. Throughout its deliberations the Institute has encouraged the advancement of basin-wide mapping initiatives, with special attention paid to a basin-level DEM.
Finally, the Red River Basin Board (RRBB) was formed as "an international, non-
profit, grassroots organization in response to the need for a single entity to coordinate and facilitate water management activities on a basin-wide scale" (RRBB, 2000, Q). It recently combined with The International Coalition to become the Red River Basin Commission (RRBC). In response to the IJC and RRBI recommendations, the Director of the Red River Basin Commission appealed to the U.S. Army Corps of Engineers in an attempt to secure funds for a comprehensive topographic data collection within the US portion of the Red River Basin.
The USACE subsequently determined further study was warranted to:
• More fully articulate local user needs; • Assess available data sources and associated collection, processing and
dissemination costs; • Identify high resolution data collections made within the Basin to date; • Identify modeling and planning needs that would potentially serve as the
basis for data collects of a broad geographical character; and • Make technical and institutional recommendations related to the next steps
for data collection The Institute for Water Resources took the lead in drafting a scope of work and
subsequently solicited contributions from the Topographic Engineering Center, the St. 1 Now called the Red River Basin Commission after merging with The International Coalition. 2 This recommendation resulted in the development of the Red River Basin Decision Inforamtion Network (RRBDIN) www.rrbdin.org

BASIN-LEVEL DIGITAL ELEVATION MODELS
3
Paul District of the Corps, and Houston Engineering, Inc. Soon thereafter, the RRBC and the RRBI convened a Hydrologic and Hydraulic (H&H) modeling meeting in Fargo, ND to evaluate existing and planned models. Those deliberations provided the framework for this report. Since Canadian interests have already collected high resolution topographic data for the areas flooded in 1997, it should be noted much of the findings and recommendations included within this report relate solely to the US portion of the Basin. However, a seamless US-Canadian would further facilitate the development and implementation of a seamless flood forecast application within the Basin.

BASIN-LEVEL DIGITAL ELEVATION MODELS
4

BASIN-LEVEL DIGITAL ELEVATION MODELS
5
RED RIVER BASIN SUMMARY
The Red River of the North (hereafter termed Red River Basin) Basin (Figure 1) encompasses large portions of Minnesota, North Dakota and Manitoba. It is largely an agricultural area with rich soils that were originally deposited some 9,000 years ago as the lakebed of Glacial Lake Agassiz (Harris, 1997). Periodic flooding deposits sediment within the floodplain along the main stem of the Red River and its tributaries. The Basin’s eastern portion consists of a number of lakes and wetlands. The western portion is marked by "prairie potholes" that are ecologically rich depressional wetlands.
Since the Basin itself is actually the remnants of an ancient lakebed the
topography is extremely flat, with a slope averaging less than one-half foot per mile along a distance of 545 river miles (Leitch and Krenz, 1998). The floodplain extends over vast areas of land threatened by frequent flooding. The slope also adds to extreme flow variability. At some locations zero flow conditions have been recorded, while during periods of extreme flooding flows have neared 100,000 cubic feet per second (Emergency Preparedness Canada, 1999). The main stem of the Red River flows in a northerly direction, with Lake Winnipeg at its terminus.
Historical and geological records indicate the Red River Basin is particularly prone to major flood events, particularly when the following conditions are met (Bluemle, 1997):
• A wet fall followed by; • A cold winter with; • Heavy winter snow accumulation; and • A late, cool, wet spring followed by sudden warming with • Widespread, heavy, warm rainfall during the thawing period.
Since the Basin is shared between Minnesota and the Dakotas and the U.S. and Canada it poses a number of challenges in terms of how the various jurisdictions coordinate their respective floodplain management activities.
Topography is clearly a critical factor that determines the extent of flooding in the Red River Basin. Due to the terrain aspects floods approach in a slowly moving manner, with the floodwaters eventually transforming the region into a proverbial "Red Sea". Under

BASIN-LEVEL DIGITAL ELEVATION MODELS
6
Figure 1: The Red River of the North Basin.

BASIN-LEVEL DIGITAL ELEVATION MODELS
7
extreme hydro-meteorological conditions the overland flooding in the Red River Basin can result in areas the size of 1000 to 2000 square miles being inundated for periods lasting from 4 to 6 weeks (Krenz and Leitch, 1998). Soils contribute to the longevity of these extreme flood events. The rich topsoil is underlain by 4 to 60 feet of clay, which has a low capacity to absorb floodwaters (Emergency Preparedness Canada, 1999).
Rannie conducted a very extensive pheno-climatological study of the region (1998). He attributed the unusually high occurrence of floods that occurred in the nineteenth century - when records were just starting to be gathered - to the terminus of the Little Ice Age. The 1826 flood is believed to be the greatest flood in the Red River Valley since settlement in the area began. The twentieth century, however, also experienced particularly large and damaging floods in 1950, 1966, 1979, and 1997.
The Flood of 1997 was the worst flood of the twentieth century. It has been
labeled the "most culturally destructive event to impact the Red River of the North Basin in recorded history" resulting in “the largest per capita evacuation of people in the history of the United States" (Mayer, 1997 ). The major flooding took place that year along the main stem of the river devastating the cities of Grand Forks, North Dakota and East Grand Forks, Minnesota. Some 75,000 people had to be relocated with the flood inundating approximately 80% of these two urban areas (Bluemle, 1997). The waters spread outwards up to 25 miles during the course of this springtime flood event.
Given the unique geomorphic and hydro-climatic character of the region, it
is likely that extreme flood events will recur. These combined qualities make the Red River Basin an excellent region in which to assess the need for wide geographic coverage of highly resolved topographic data.

BASIN-LEVEL DIGITAL ELEVATION MODELS
8

BASIN-LEVEL DIGITAL ELEVATION MODELS
9
STANDARD NATIONAL ELEVATION DATA SETS
There are several sources of elevation1 data for the Red River Basin ranging from low resolution to high resolution. Resolution is a loosely defined term relating to the level of horizontal and/or vertical accuracy. Greater vertical accuracy is a result of more closely spaced elevation points or “postings”. A DEM created from elevations posted every two feet has a higher resolution, i.e., large scale, than a DEM created from elevations posted every ten feet (small scale). Figure 2 provides a graphic representation of the spatial detail that is provided for five different scales of low to medium resolutions. The “levels” in the figure refer to resolution standards developed by the National Imagery and Mapping Agency. The following sections describe the various types of low to medium resolution topographic products that are available within the Red River Basin.
Figure 2. Visual depiction of the detail provided at five different spatial resolutions (Image courtesy of the Engineer Topographic Laboratories)
1 The terms elevation and topographic are used interchangeably within this report
Level I
Level II
Level III
Level IV
Level V
90 m
30 m
10 m
3 m
1 m

BASIN-LEVEL DIGITAL ELEVATION MODELS
10
LOW RESOLUTION DATA SETS GTOPO30: This is a global DEM with a horizontal grid spacing of 30 arc
seconds (approximately 1 kilometer). GTOPO30 data have global coverage and are distributed by the USGS ( http://edcdaac.usgs.gov/gtopo30/gtopo30.html). The vertical accuracy of these data is approximately 30 meters, with a 90% confidence. The reporting standard for the vertical component of accuracy is a linear uncertainty value, such that the true or theoretical location of the point falls within plus or minus that linear uncertainty value 95 percent of the time.
1-Degree DEMs: These correspond to the 3 arc-second (or 1:250,000-scale) USGS topographic map series. These are also distributed by the USGS, with coverage of the contiguous U.S. and most of Alaska (http://edc.usgs.gov/products/elevation/dem.html). The 1-degree DEM data have an absolute accuracy of 130 meters horizontally and 30 meters vertically.
30-Minute DEMs: These correspond to the east half or west half of the USGS 30-minute by 60-minute topographic quadrangle map (approximately 90 meters) and are available at http://edc.usgs.gov/products/elevation/dem.html for the conterminous U.S. and Hawaii. The 30-minute DEM accuracy is equal to or better than one-half of a contour interval of the 30- by 60-minute topographic quadrangle map.
MEDIUM RESOLUTION DATA SETS 7.5-Minute DEMs (30 meter): These correspond to the USGS 1:24,000 and 1:25,000 scale topographic quadrangle maps and are available for all of the U.S. and its territories (http://edc.usgs.gov/products/elevation/dem.html). Most files contain a post spacing of 30 meters, but 10-meter postings are also available for some locations. The average file size of a 30-meter DEM is 1.1 megabytes and 9.9 megabytes for a 10 meter DEM. The 7.5-minute DEM data have an accuracy of seven meters vertically at 90% confidence.
Shuttle Radar Topography Mission (SRTM): This is a joint project between the National Imagery and Mapping Agency (NIMA) and the National Aeronautics and Space Administration (NASA). The objective is to produce digital topographic data for 80% of the Earth's land surface (all land areas between 60° north and 56° south latitude) with data points located every 1-arc second (approximately 30 meters) on a latitude/longitude grid. The absolute vertical accuracy of the elevation data will be 16 meters (at 90% confidence) (see http://srtm.usgs.gov/).
National Elevation Dataset (NED): NED is being developed by the USGS by merging data of the highest-resolution, best-quality elevation data available across the United States into a seamless raster format. The accuracy varies depending on the data source for a particular area, but usually ranges between that of a 7.5-minute DEM and a 1/3 arc second (10 meter) DEM. The vertical accuracy of a 10 meter DEM is approximately ½ the elevation contour interval. Figure 3 shows the source of NED data for the U.S. portion of the Basin (also see http://gisdata.usgs.net/ned/default.asp).

BASIN-LEVEL DIGITAL ELEVATION MODELS
11
Figure 3. Data source index for NED dataset.
No high-resolution standard national elevation data sets have been collected within the Red River Basin. Individual collects have been made at several locations, and these are described in the next chapter.

BASIN-LEVEL DIGITAL ELEVATION MODELS
12

BASIN-LEVEL DIGITAL ELEVATION MODELS
13
HIGH RESOLUTION DEM DATA
This section describes the various data collection methods that are currently available for producing high resolution digital elevation models. Photogrammetrcally derived DEMs are described, along with those produced with LiDAR and IFSAR. Following the descriptions of these data collection methods are descriptions of various programs that are producing high resolution DEMs with wide geographic coverage. OPERATIONAL DATA COLLECTION SYSTEMS Photogrammetrically Collected DEMs
Photogrammetrically compiled DEMs are comprised of mass points (location and elevation), three-dimensional line strings (break lines for topographic features) and points of special significance. These three-dimensional features may also be supplemented with photogrammetric control solution and spot heights collected for map-making (cartographic) purposes. Conventional photogrammetric procedures for generating DEMs involve taking stereoscopic measurements of the elevation of terrain points with a precision stereo photogrammetric instrument. The point distribution may be regular, quasi-regular, or irregular, with a certain average density. The character and density of the DEM is dictated by the applications that it must support and to an extent the application software. The most common practice is to collect break lines, add mass points to provide an adequate density of points in areas not properly described by the breaklines, and finally to include points of special significance, typically hilltops and low points in depressions and saddles.
The density and distribution of points is generally designed to facilitate modeling
within a Triangulated Irregular Network (TIN) and is influenced by the requirement to generate contours from the DEM. Contour generation generally requires more dense DEM datasets with comprehensive break lines if the final product is to adhere to accepted cartographic standards. When surface modeling is to be performed within a TIN, the DEM collection is designed to minimize the formation of long, narrow triangles that produce stilted contours. Point separation along breaklines is maintained at an interval such that a disproportionate number of long, thin triangles do not form on either side of the breakline. When contours must be generated from the DEM, breaklines are placed along all watercourses on the shorelines or on the centerline in the case of narrow streams. Similarly, breaklines are placed on the edges of road and railway embankments to ensure that the contours accurately depict the surface. These breaklines also have the effect of minimizing distortions within orthorectified imagery on these linear features.

BASIN-LEVEL DIGITAL ELEVATION MODELS
14
When these breaklines are absent in variable terrain, it is common to see “wavy” road edges or railway lines in orthorectified imagery.
Tools for automated photogrammetric DEM generation are now available. These
tools employ image-matching techniques, or autocorrelation, to automate the measurement of DEM points. They generally produce surface models posted on a regular grid that incorporate vegetation and buildings within the model. DEMs that have been produced through autocorrelation are subject to random errors and must be examined and edited while superimposed on the imagery. The correlation software can produce erroneous results in areas of relatively uniform tone and texture and in areas of vegetation (Daniel, 2001).
Like other spatial datasets, a photogrammetrically compiled DEM may also suffer from three different types of errors, namely, random errors, blunders and systematic errors. Each of these errors influences the DEM in terms of planimetry and height.
• Random errors result from accidental or unknown combinations of problems. Random errors remain in the data after blunders and systematic errors are removed (USGS, 1997).
• Blunders are vertical errors that exceed the maximum absolute error permitted and are associated with the data collection process. Blunders can be easily identified and removed through visualization and editing.
• Systematic errors have fixed patterns and are usually related to collection procedures or photogrammetric systems used in the DEM generation. These errors are not easily detectable and can introduce significant bias or artifacts in the final DEM product (Wechsler, 1999). If the error can be identified, systematic error can be modeled, reduced or even eliminated.
LiDAR Collected DEMs
LiDAR uses the same principle for collecting data as RADAR, transmitting light to a target. As the LiDAR instrument transmits light to a target its changing properties allow the target to be determined. Due to the high level of precision and accuracy of the data, this measurement technique is becoming increasingly used for the generation of DEMs.
As the performance of LiDAR systems is being driven to higher levels, there are a
number of design factors that need particular consideration. For instance, a system designed for high-altitude operation at fast scan rates must have a receiver field-of-view (often called the instantaneous field-of-view in imaging sensors) wide enough to ensure that the return reflection from the ground is intercepted, even though the scanner has now moved onto a different position. In another scenario, a high-altitude system designed for operation at high pulse rates must allow for the possibility that a return reflection from the previous laser pulse will be received after the current outgoing pulse.

BASIN-LEVEL DIGITAL ELEVATION MODELS
15
Some of these scenarios will result in design changes in LiDAR systems, while some may result in only parametric changes. Interestingly, it is the parametric changes that are most likely to have a negative impact on system accuracy. Changes in parameters such as field-of-view typically affect rangefinder subsystem signal-to-noise levels that, in turn, can affect rangefinder error. The performance of the rangefinder is perhaps the most difficult to model, due to the number of parameters under the designer’s control, as well as the need to provide a reasonable atmospheric model.
When evaluating errors in LiDAR data, it is convenient to consider errors in planimetric (x/y) data separately from errors in output height (z) data. This is not to say that the two categories of error result from mutually exclusive sources in the system design. Most of the sources of error in any LiDAR system contribute to both planimetric and height error, but manifest more strongly as either one or the other.
The user will instinctively think of planimetric error in terms of latitude and longitude. It is more logical to think in terms of along-track and cross-track error. Along-track error is defined as error in the direction of the flight path of the aircraft carrying the LiDAR system. Cross-track error is defined as error perpendicular to the flight path. This re-casting into along-track and cross-track components evolves from the design of a typical LiDAR system, where the scan pattern runs perpendicular to the flight direction.
Statistical verification of LiDAR system error can be readily accomplished by employing test flights over surveyed terrain. For height error, which is of primary concern to most LiDAR users, a series of flight lines with a variety of altitudes, headings, fields-of-view and scan rates can be flown over the calibrated site. The site should have calibration data at spatial intervals sufficiently close to prevent aliasing of terrain features with higher spatial frequencies. (Aliasing is the loss of detail caused by using fewer data points than truly needed to clearly represent a three-dimensional surface with breaklines, for example, if the average point spacing is too wide, the dataset may "jump over" a small stream centerline or the edge of a critical feature.) The number and location of calibration points used should also be adequate to characterize system performance over the entire FOV. All ground survey data should be acquired using a geodetic-quality GPS system and/or conventional survey equipment that yield the desired results.
After collecting calibration survey data for the site, the DEM created from the
airborne LiDAR data can be compared with the calibration DEM (i.e., a DEM surface subtraction). The height differences between the two DEMs for individual LiDAR points falling over the calibrated site can then be analyzed using standard statistical means to determine the mean error as well as the standard deviation about the mean.
Verification of planimetric accuracy can be done in a similar way, but requires the
use of a specialized target to avoid the aliasing that occurs when looking at contour lines created from a relatively coarse DEM. In particular, planimetric error evaluation should be done using an area of constant slope, such as the gabled rooflines found on many medium-sized industrial buildings, or large flat buildings with known coordinates

BASIN-LEVEL DIGITAL ELEVATION MODELS
16
defining the perimeter and height. Analogous to the method described for evaluating height errors, the lateral displacement of LiDAR data points with respect to the known surface can be measured and then processed using statistical techniques. The LiDAR data points used must be far enough inside the borders of the calibration surface to ensure that they are from the calibration surface (e.g., rooftop), not points from another adjacent surface (Daniel, 2001).
IFSAR Collected DEMs
IFSAR is less intuitive than LiDAR or photographic DEM collection. An understanding of signal processing is necessary to fully understand SAR and IFSAR. The effort is worthwhile because IFSAR systems are capable of directly measuring precise terrain information. The DEM post derived from IFSAR, unlike LiDAR or photo, is based on the average height within the resolution element of the cell. As with other technologies, IFSAR systems come in many configurations with different engineering tradeoffs to achieve the desired results, from decimeter performance of airborne systems to less accurate but fast global coverage of the Shuttle Radar Topography Mission (SRTM).
Most of the error sources contribute to both the systematic or relative error performance of the system. However, the largest contributors to systematic errors are:
• Atmospheric errors (space borne systems); • Navigation errors, including baseline estimate errors; • Range Measurement errors; and • Multipath or radome (antennae shelter) induced effects to the return phase.
Typically systematic errors will have very long periods and thus will be
represented as long-term distortions within the DEM. These distortions will typically be present in either the along track or across track dimension. Across track distortions are induced by differential phase errors including multi-path or radome effects as well as baseline attitude errors. Along track distortions are the result of motion compensation issues.
Random errors within the data are attributed to the thermal noise present in the
scene, the signal to noise of the measurement and the target height variation within the resolution cell. In addition, baseline measurement errors that occur within one synthetic aperture will also manifest as relative errors. All random errors regardless of source will be represented in the correlation of the two IFSAR images.
The production quality control system for IFSAR sensors must be designed to monitor the performance of the key parameters to ensure system performance. This monitoring will provide indications of the stability of the system. These quality control processes must cover all facets of an IFSAR collection from planning, to acquisition, processing and editing. Monitoring the expected performance allows for interpretation of

BASIN-LEVEL DIGITAL ELEVATION MODELS
17
independent validation results. A bad validation would be indicative of an error in either the design or design of the metrics used to ensure quality. It is good practice to independently validate a system that relies on engineering analysis and quality control of engineering parameters. This should be done on an ongoing basis – it provides the best tradeoff between testing and acquisition costs to the end user.
Some examples of engineering quality control that would be implemented specific
to an IFSAR system are as follows:
• Validation of flight planning -- this includes many facets such as coverage, fill of data loss areas (shadow and layover) with second look, tie line coverage for error evaluation, ground control acquisition dependent on data specification;
• Quality control of navigational accuracy -- this is INS/DGPS processing performance for airborne sensors, orbital position recovery for space borne sensors
• Quality control of platform dynamics -- baseline motions must be measured and the corrections properly implemented
• Quality control of sensor phase stability -- channel-to-channel stability needs to be assessed and monitored
• Calibration of the sensor involves measuring system parameters including range delay, navigation sensor, radar sensor orientation parameters and differential phase errors (radome, multi-path). The product specifications, system design and long term stability will determine the calibration procedures necessary for any particular system. At present there is no “factory” from which to purchase IFSAR systems, leaving the developer and operator responsible for calibration; and
• Quality control of strip model adjustments and consistency. Again, properly designed quality control ensures consistency of the product. This
control is based on engineering analysis and must be coupled to independent observations of performance (Daniel, 2001).
Comparing LiDAR to IFSAR
IFSAR DEMs are less expensive but also less accurate than LiDAR DEMs.
IFSAR DEMs are satisfactory for some applications, but users must remember that Root Mean Square Error (RMSE)z values, as good as 60 cm, pertain to rooftops and treetops, and not bare-earth DEMs. In time, this value is expected to improve to 30 cm.
LiDAR DEMs are more expensive but also more accurate than IFSAR DEMs. Last-return LiDAR data can yield bare-earth DEMs with RMSEz values of 15-cm or better (after post-processing to remove data points that fall on buildings and vegetation not penetrated by the LiDAR). When bare-earth DEMs are required, LiDAR data should be acquired during leaf-off conditions, and also during low-water conditions when used for floodplain modeling. Natural data voids over water (and some asphalt), and man-

BASIN-LEVEL DIGITAL ELEVATION MODELS
18
made data voids caused by post-processing, may seriously degrade the utility of LiDAR data.
LiDAR TINs (with non-uniform point spacing) are generally more accurate than DEMs (with uniform point spacing), making TINs superior to DEMs for hydraulic modeling, for example. The post-processing of LiDAR data causes the “removal” of LiDAR points that hit rooftops or treetops and did not penetrate to the ground. This causes data voids that need to be filled in by an interpolation process necessary to generate DEMs. This interpolation process causes the DEM points to be artificially generated from surrounding data that may inaccurately depict the shape of the terrain in the area that previously contained data voids.
The effects of terrain slope on LiDAR and IFSAR are not fully understood. Some researchers have reported an increase in LiDAR vertical error that is proportional to the slope of the terrain; this could be caused by systematic horizontal errors translating into vertical errors at steeper slopes. Effects with IFSAR are reportedly similar, though less pronounced.
Both IFSAR and LiDAR provide the opportunity to generate new DEMs on the NAVD 88 vertical datum at costs significantly less than photogrammetrically compiled DEMs. However, neither IFSAR nor LiDAR are as good as photogrammetry in generating breaklines. Unwanted artifacts and “corn rowing” can occur with either IFSAR or LiDAR data. (Damron, 2000)

BASIN-LEVEL DIGITAL ELEVATION MODELS
19
Vignette: The TEC LiDAR/IFSAR study for the Red River
The 1997 Red River flood resulted in catastrophic damages to residential,
commercial, industrial, agricultural, and public properties in large portions of the Red River Valley in the States of Minnesota and North Dakota and in the Province of Manitoba. In the aftermath of the flood, the governments of the U.S. and Canada asked the International Joint Commission (IJC) to analyze the cause and effects and to recommend ways to reduce the impact of future floods. In support of the IJC study, the Saint Paul District of USACE requested assistance from the U.S. Army Topographic Engineering Center to evaluate emerging airborne remote sensing technologies for application to crisis management support. A pilot study was conducted utilizing both IFSAR and LiDAR collection systems to determine the correct mix of technologies required. A major objective of the study was to develop and implement a data fusion technique to merge IFSAR and LIDAR DEMs.
The IFSAR DEM was found to have an RMSEz of 82-centimeters for approximately 500 check points that were within the area overlapping the LiDAR DEM and not under vegetation canopy. This was the best independently-verified accuracy achieved to date by an IFSAR solution. The LiDAR DEM was found to have an RMSEz of 32-centimeters for approximately 500 check points. GPS data were collected along the major routes of transportation for the area. Data fusion or merging of the LiDAR and IFSAR DEM was accomplished and a corrected IFSAR DEM surface was merged with the LiDAR DEM (See Figure 4). Recognizing that IFSAR does not penetrate vegetation, the accuracy of the IFSAR DEM was not evaluated under vegetation canopies. (Damron, 2000)

BASIN-LEVEL DIGITAL ELEVATION MODELS
20
Figure 4. Merger of LiDAR and IFSAR DEMs (Pembina Sub-basin).
Less expensive IFSAR DEMs could be acquired for broad areas for hydrologic modeling and
other applications where sub-meter level accuracy is acceptable. The areas to the northeast in
this image show IFSAR first-return (tree top) DEMs. More expensive LIDAR DEMs could be
acquired for limited areas for hydraulic modeling and other applications where decimeter-level
accuracy is required. The areas in the center and to the southwest in this image are LiDAR last-
return DEMs that approximate bare-earth. The LiDAR data can also be used to improve the
accuracy of the IFSAR data.

BASIN-LEVEL DIGITAL ELEVATION MODELS
21
RELATED STUDIES AND COLLECTION PLANNING PERFORMED ELSEWHERE North Carolina State Wide LiDAR Collection
The State of North Carolina’s Floodplain Mapping Program is the result of the State’s designation by the Federal Emergency Management Agency (FEMA) as the first Cooperating Technical Partner (CTP). Under this designation, North Carolina has full responsibility over the Digital Flood Insurance Rate Maps (DFIRMs) within its state boundaries. In carrying out this responsibility, the State of North Carolina is producing specifications for advanced surveying techniques needed for LiDAR derived products such as the Digital Elevation Model (DEM).
An important application for LiDAR derived DEMs is the prediction of flood risk using hydraulic and hydrologic (H&H) models. The State of North Carolina is in the process of using LiDAR to create better flood plain models than are currently available from other sources. Development of this technology is of increasing importance to other local, regional, and state governments. H&H (notably hydraulic) models are increasingly dependent upon high accuracy DEMs. In the case of flood risk mapping, large dollar amounts associated with development planning, insurance, and flood disaster recovery make the DEM accuracy issue paramount.
Posting density is especially important because it is the greatest cost factor in LiDAR data acquisition/processing and because it often improves accuracy. A higher posting density requires a more sophisticated sensor system with a higher pulse rate, e.g. 50,000 pulses per second, lower elevation flights (and therefore more flight lines), a narrower scan angle, or a combination of these. These cause acquisition for a given aerial coverage to become more expensive. Beyond acquisition costs, significantly more computing resources (processor speed, RAM, storage space, etc.) and technical personnel time are required to process higher posting densities during the DEM creation process.
H&H models depend on suitable accuracy, and are preferable if the costs of developing these models are minimized. In hydrologic modeling applications, there is evidence that higher resolution DEMs, i.e., from high posting densities, result in estimates of higher mean slopes. In other words, the modeled mean slope of a basin will be greater for a DEM created from 1 × 1 m LiDAR data than from 5 × 5 m data. In hydraulic applications, higher resolution DEM data means that smaller features are identifiable. Central California Valley IFSAR Collection
During the winter of 1996, severe flooding occurred in the Sacramento and San Joaquin Valleys in California. Many communities experienced extensive property damage due to flooding. During the height of these floods, a situation developed which demonstrated the shortcomings of existing topographic maps and pointed to a need for computer modeling of a flooding situation.

BASIN-LEVEL DIGITAL ELEVATION MODELS
22
The California Department of Conservation (CalDoC) assisted the Office of Emergency Services, Department of Water Resources and other responding agencies, by providing two-dimensional computerized support maps using a GIS to respond to the situation. The question was posed, “could a computer model have been used to predict the inundation area as the water flowed through the levee break?” Also, “could a computer model have determined how high to construct the Meridian levee?” The answer was, “yes, but better maps were needed with more accurate elevations.”
A proposal was developed by CalDoC to use the STAR-3i airborne X-band radar terrain mapping system operated by Intermap Technologies, to acquire the IFSAR DEM data. The proposal was funded by FEMA, with TEC as the project manager and CalDoC providing user input. The planned project area is shown in Figure 5.
Figure 5. Location map of IFSAR DEM data
Coverage of the flood data set extends from north of Sacramento south to Fresno, following the Sacramento and San Joaquin Rivers. The project area covers about 17,000 square kilometers (or 6,564 square miles). Data were initially collected during September 1997 in two flights, one each for a northern and southern area. Strong turbulence caused the southern mission to be aborted, so it was re-flown in July 1998. Intermap Technologies began processing data in early 1998 with completion planned for January 1999.
While there appears to be much promise in using IFSAR DEMs for terrain modeling and in flood applications, the limitations need to be better understood in order to exploit the data to its full potential. The following caveats are provided so that future users and researchers of the IFSAR data products can better understand some of the operating characteristics that are associated with this technology.
As previously mentioned, radar DEMs do not portray a “bald” earth, as vegetation and large cultural features are included in the final product. In some cases this may be desirable, such as for locating trees or riparian vegetation along a stream. In other cases,
FEMA Flood ProjectRadar Terrain Data
BASIN-LEVEL DIGITAL ELEVATION MODELS
23
such as dense forest or where buildings are mapped, the ground surface will be obscured and the DEM height will be that of the features. Various approaches are being developed and investigated to generate a true ground surface or bald earth DEM derived from IFSAR.
Flight path orientation is an important factor, in which two problems with the return signal can occur: 1) no return signal or “dropouts” from terrain shadowing; and, 2) an overly strong reflected signal, or “blossoming” from manmade structures. Radar has a tendency for shadowing, just as with optical photography. The flight path should be aligned to minimize terrain shadowing, which is affected by a combination of sensor altitude, slant range angle and terrain height. In addition, the flight path should be at a slight angle to the urban pattern, to minimize what can be described as a blossoming of the return signal from structures facing the radar antenna. If buildings or structures are perpendicular to the flight path, this will produce a reflected signal that is too strong for the system to process. Areas with buildings can be “whited out”. This was first noticed in an image of Burbank, California, and has since been termed, “the Burbank effect.” Both these problems can be minimized or eliminated with forethought and careful flight line planning.

BASIN-LEVEL DIGITAL ELEVATION MODELS
24

BASIN-LEVEL DIGITAL ELEVATION MODELS
25
THE MAP MODERNIZATION PROGRAM
As a consequence of the high incidence of natural disasters throughout the 1990s, the Federal Emergency Management Agency (FEMA) devised a plan in 1997 to modernize the FEMA flood-mapping program. The plan has evolved as new airborne remote sensing products, processes, and technical specifications have been developed and implemented. Since the information element of “elevation” is so critically important in flood mitigation planning and preparation, the collection, processing, and use of multi-use information has the highest priority. Another parallel objective for this effort is to evolve a suite of remote sensing system options that can be used during a single flight pass to collect many types of data which could be combined to support multi-hazard mitigation and rapid response needs (Bryant, 1998).
FEMA has started the Map Modernization Program (MMP) to address updating the existing backlog of outdated flood maps. Concomitantly, FEMA recognized that states play a significant role in floodplain management. FEMA has implemented a CTPs initiative to establish partnerships with state, regional and local agencies.
The combined goal of the MMP and CTP is to make use of available state, regional and local resources to produce more accurate Digital Flood Insurance Rate Maps (DFIRMs). These initiatives envision augmenting federal resources in the development of higher quality, digital floodplain maps that can be made available on demand to the public via the World Wide Web. Implementing these initiatives will result in the ability to produce timely revisions to the modernized flood hazard maps, which will prevent the current problem of outdated maps.
Many state legislatures have established state floodplain management programs that work in parallel to the federal government. These states document mapping needs, conduct engineering reviews of and approve floodplain engineering studies, review and approve proposed floodway and floodplain maps, address community concerns associated with proposed floodplain maps, archive floodplain models, studies and maps and respond to public inquiries regarding floodplain engineering studies and floodplain maps. FEMA conducts many of these same activities as part of the National Flood Insurance Program (NFIP). These duplicative activities can result in conflicts between the state and federal government and delays in the map development process. Several pilot projects have been initiated in the CTP program to take advantage of state floodplain management capabilities.

BASIN-LEVEL DIGITAL ELEVATION MODELS
26

BASIN-LEVEL DIGITAL ELEVATION MODELS
27
DIGITAL ELEVATION MODEL APPLICATIONS WATER RESOURCES AND WATERSHED PLANNING
Corps of Engineers Perspective The Corps of Engineers coordinates with non-Federal interests to look for ways to complement and leverage non-Federal efforts dealing with water resource-related problems and needs. The Corps’ collaborative efforts encompass the entire spectrum of stakeholders including international organizations, other Federal agencies, State agencies, regional organizations, local units of government, special interest groups and NGOs, and the general public.
A small sampling of some of these stakeholders in the Red River Basin includes the International Joint Commission, International Red River Board, U.S. Fish and Wildlife Service, Natural Resources Conservation Service, the Federal Emergency Management Agency, North Dakota State Water Commission, North Dakota Game and Fish Department, Minnesota Department of Natural Resources, Minnesota Pollution Control Agency, Red River Basin Commission, Red River Watershed Management Board, Wild Rice Watershed District, Devils Lake Basin Joint Water Resource Board, Red River Basin Institute, Energy & Environmental Research Center, Audubon Society, and the Minnesota Center for Environmental Advocacy.
The Corps’ programs provide a variety of services that include constructing emergency flood works during floods, providing assistance during the post-flood recovery period, issuing permits under Section 404 of the Clean Water Act and Section 10 of the Rivers and Harbors Act, stabilizing stream banks under the Section 14 (Bank Protection) program, constructing flood damage reduction projects under Section 205 (Small Flood Control Projects) and the Congressionally-authorized General Investigation (GI) approach, restoring the aquatic ecosystem under Section 206 (Aquatic Ecosystem Restoration) and Section 1135 (Cost-Sharing for Small Environmental Restoration Projects), partnering in basin wide feasibility studies that provide a comprehensive, long-term, holistic perspective of water resource issues and opportunities under a GI authority, and responding to one-of-a-kind requests.
Virtually all of these efforts would benefit from universal DEM coverage. Unfortunately, the standard 30-meter DEM can miss the detail of important features, e.g., section line (township) roads and legal drains that largely control overland flow in the Red River Valley. Therefore, high resolution DEM data is a requisite for optimal project execution in the Red River Basin.

BASIN-LEVEL DIGITAL ELEVATION MODELS
28
The availability of higher resolution DEM would reduce the envelope of uncertainty surrounding reconnaissance phase analyses and, thus, improve the reliability of the findings. In some cases, this would help the reconnaissance study to identify and eliminate infeasible projects in lieu of expending limited staff time and Federal and non-Federal funds proceeding with more detailed, more costly feasibility studies before being able to reach that conclusion. The bottom-line would be a faster and more reliable study process that would, concomitantly, increase the efficiency and cost effectiveness of Corps, consultant, and non-Federal technical resources.
A higher resolution DEM offers a number of other advantages. Lacking a universal, enhanced DEM, the Corps’ practice has been to collect LiDAR-based topography and DEM on an as-needed basis. However, it is much more cost effective to generate detailed DEM on an upfront, large-scale basis than on a fragmentary one that, to date, has produced a thinly populated checkerboard of higher quality DEM. A central databank of available widespread DEM coverage would reduce the risk of replicating prior efforts. A readily accessible high resolution DEM allows faster and more efficient completion of a project’s study phase and, in some cases, the design phase.
Local authorities generally lack the financial resources to undertake studies on their own because detailed topography is too costly without a Federal or State agency partnering in the study. This makes local authorities constrained by State and Federal budget priorities, limitations, and study or design criteria that perhaps go beyond local needs. The widespread availability of high resolution DEM allows communities, watershed districts, and other local authorities to undertake more investigations and projects on their own behalf. This relieves some of the burden from State and Federal agencies. The St. Paul District has a backlog of requests for many of its projects. Some of them may proceed without Federal attention if local interests were empowered to initiate the study phase because of the availability of universal, detailed DEM coverage.
Universal, high resolution DEM also can result in the more equitable treatment of
non-Federal Sponsors. For example, the detailed topography needed for comprehensive analyses of upper basin floodwater storage is beyond the budget for most small communities, even with a 50/50 cost-shared study. Therefore, there is a built-in bias in the quality of technical studies favoring larger communities with their larger tax base. Upfront availability of high resolution DEM goes a long way toward leveling the playing field in terms of availability of critical baseline data.
More detailed DEMs could be used by the Corps and local authorities to identify
ecosystem restoration candidates, e.g., riparian areas that might be well suited for land use changes to restore the floodway and/or create a buffer strip by removing flood prone uses and providing a riverine corridor that functions more naturally. High resolution DEM could also be used by watershed districts for decisions regarding local drainage disputes, culvert sizing, local floodwater retention, and land use changes, e.g., flood prone farmland candidates for CRP or CREP.

BASIN-LEVEL DIGITAL ELEVATION MODELS
29
From the perspective of Section 404 permit applications, universal, detailed DEM would facilitate identification of mitigation needs, e.g., potential wetland depressions that would be affected by the proposed effort and suitable sites for mitigating unavoidable impacts.
The Municipal, County and Watershed District Perspective The local government’s need for high resolution topographic data is directly related to local government’s responsibilities. Within the states of North Dakota and Minnesota these generally include:
• Transportation planning – locating, designing and constructing roads and bridges and designing culverts and bridges to ensure adequate opening area for the safe conveyance of flood flows;
• Zoning and land use planning – planning development, the implementation and enforcement of zoning ordinances and building codes, storm water management planning, and implementation and enforcement of the NFIP for participating communities. Included within this category are the development and implementation of additional municipal ordinances related to establishing bluff or riparian protection areas and shoreline management;
• Drainage system administration – the planning, design, construction, maintenance and administration of public drainage systems, primarily for the purpose of providing agricultural drainage;
• Water and natural resources planning and plan implementation – the development and implementation of plans to locally manage surface and groundwater resources and enhance natural resources. This includes the development of wetland management plans within the State of Minnesota in accordance with the Wetland Conservation Act. Included in this category is resolving hydrologic boundary issues among local units of government;
• Regulatory – permitting plans and projects in accordance with the Wetland Conservation Act (within the State of Minnesota only);
• Emergency response planning and disaster response – planning for and responding to disasters (e.g., natural and accidental chemical spills); and
• Engineering design – the conceptual, preliminary and final design of infrastructure such as roads, storm and sanitary sewer systems, water distribution facilities, drainage systems, etc.
Topographic data of varying vertical resolution and accuracy are routinely used for these purposes. Local government typically uses the “best available” information when implementing their responsibilities.
Historically, low-resolution topographic data available from state or federal sources have been used for planning related activities, primarily due to cost constraints associated with higher resolution data. Site-specific data using traditional survey methods are needed for the design and construction of infrastructure.

BASIN-LEVEL DIGITAL ELEVATION MODELS
30
A recent trend is for the collection of high-resolution topographic data at the municipal or county level. Funding for these collects is either solely borne by the local government or in partnership with the federal government (usually FEMA). The local government’s need for high resolution topographic data seems related to the complexity of issues it must address. Local governments generally pursue the collection of high-resolution topographic data as development pressure increases and the complexity of issues associated with growth and development become more difficult. Technological improvements during the last several years make high-resolution data more affordable to local government. FEMA’s CTP Program also encourages local government to take a leadership role in the development and refinement of flood hazard boundaries. Due to the reduced cost and availability of funding through FEMA, several local governments have and are pursuing high-resolution topographic data collects. Once high-resolution data are available to local government, it replaces the use of lower resolution data and becomes the “standard” for implementing local government’s responsibilities. High-resolution topographic data provides many ancillary benefits to local government for implementing their responsibilities. MODELING
A primary focus of the need for high resolution topographic data is the development of hydrologic and hydraulic models. Some believe that high resolution topographic data are integral to the development of more accurate models. Practitioners developing models within the Red River Basin are currently “forced” to use the best available topographic data, usually a 30 m DEM. The best available topographic data are then supplemented using traditional survey methods to obtain the topographic detail necessary to address specific situations (e.g., an area where flow breaks out) for model development and application.
Within the Minnesota portion of the Red River Basin the State of Minnesota, through the Board of Water and Soil Resources, has and continues to fund the development of tributary scale hydrologic models. These models are typically HEC-1 or more recently, HEC-HMS. The development of these models includes considerable effort to define watershed boundaries at a scale ranging from 1 to 5 mi2. The Red River Basin Commission has also undertaken unsteady hydraulic modeling of the Red River of the North using MIKE-11. The Environmental & Energy Research Center has an aggressive basin-wide modeling effort underway.
Topographic data needs for model development differ depending upon the spatial and temporal scale of the problem being modeled. Several generalizations apply to the need for topographic data for current model development activities within the Red River Basin:
• A 30-m DEM, with an accuracy of equal to or less than one-half the contour interval, is commonly used for the development of most tributary scale hydrologic models. Although sufficient for determining hydrologic boundaries in many areas,

BASIN-LEVEL DIGITAL ELEVATION MODELS
31
higher resolution data are useful for determining the hydrologic boundary in difficult areas with little slope;
• Medium resolution (± 3 feet vertical accuracy) topographic data are needed to define shallow depressions and storage areas for the development of hydrologic models. Medium resolution data are also used to define overbank and storage areas for 1-d steady and unsteady flow models. Currently, these data are collected using traditional survey methods.
• High-resolution data (± 0.5 feet vertical accuracy) are needed to define weir flow over roads, railroads, levees, to define the infrastructure and for the purposes of inundation and floodplain mapping. Currently, these data are collected using a combination of traditional survey methods and high-resolution data collect (i.e., LIDAR). More advanced hydrodynamic modeling effort (i.e., 2-d or 3-d hydrodynamic modeling) requires high-resolution data.
The trend in modeling is the integration of GIS and hydrologic and hydraulic
models. These newer models like HEC-GoeHMS and HEC-GeoRAS include tools that rely heavily upon a DEM. The current 30-m DEM is incapable of supporting these new tools within the Red River Basin. A 30-m DEM lacks the accuracy necessary to use the tools within HEC-GeoHMS to define the watershed boundaries and watercourses. Similarly, a 30-m DEM lacks the accuracy to use the flood inundation mapping tools within HEC-GEO-RAS. High-resolution topographic data are also a necessity for 2-dimensional (or multidimensional) flow modeling. This type of modeling is periodically needed in areas along the Sheyenne and Red Rivers to properly define the flow field.
HEC-RAS and HEC-2 (refer to Appendices 1 and 2 for an explanation the various hydrologic and hydraulic models used within the Basin) one-dimensional steady state models have been developed for the Red River and most of the Red River tributaries. These models were developed using surveyed cross sections and USGS 7.5-minute topographic quadrangle maps with 5-foot contour intervals. More recent models have been developed and refined using High Resolution LiDAR and GPS survey data in limited areas.
Unsteady flow models using MIKE-11, UNET, FLDWAV and HEC-RAS have also been developed mostly along the Pembina, Sheyenne, and Red Rivers. They were developed using data from the steady state models. Cross sections were extended to include the floodplain using USGS 7.5-minute topographic quadrangle maps with 5-foot contour intervals. The width of the 1997 Red River Floodplain in the United States varied from one to twelve miles (Figure 6). The existing USGS topographic mapping is not precise enough to adequately define the floodplain storage for the unsteady flow models.
Two-dimensional hydrodynamic models using RMA-2 and FESWMS have been
developed for a few limited areas along the Red River. They are being used to study the effects of bridge replacements and floodplain encroachments.

BASIN-LEVEL DIGITAL ELEVATION MODELS
32
Various hydrologic models are also being in the Red River Basin. The most recent models use ge-spatial data derived from the GIS procedure known as TIN (tri-angulated irregular network) or USGS 30-meter DEMs. Hydrologic Modeling Watershed boundaries and stream networks are defined using USGS 30-meter DEMs. In the lower ends of the tributaries watersheds, the topography is typically very flat, and the 30-meter DEM does not adequately define the stream network. Errors in the stream networks can be corrected using 24K USGS Digital Line Graphs (DLGs) when they are available. DEMs are also used to define depressions that store runoff. The existing 30-meter DEM lacks the vertical accuracy to adequately define small and shallow depressions. 30-Meter USGS DEM are adequate for coarse Red River Basin Tributary models. However, for detailed modeling of wetland restoration and creation, a more accurate DEM is necessary to define numerous scattered, small, and shallow depressions.
Hydraulic Modeling One-Dimensional Steady State One-dimensional steady state modeling using HEC-RAS is the industry standard for modeling flood insurance studies, flood damage reduction projects and hydraulic design of bridges. One-dimensional models assume that the water surface is constant across the cross-section. This assumption is not sufficiently accurate for wide-floodplains, near rapid changes in the width of the floodplain near bridges, or in areas where the flow is divided by a linear feature such as a road or levee. Steady state models are used to model the water surface profile for a peak flow. They are not able to directly compute the changes in flow due to flood plain storage. HEC-GeoRas is an ArcView GIS extension that allows a modeler to create a HEC-RAS model using data from a DEM. HEC-GeoRAS requires a high resolution DEM. HEC-RAS models are created using channel, road, and over bank surveys. Often the cost of over bank surveys is high, so data for over bank areas is obtained from USGS 7.5 minute quadrangles. The cost of channel cross section data often limits the number of cross sections that are surveyed. HEC-GeoRAS allows the modeler to use a high resolution DEM to extend cross sections more accurately. During the modeling process, numerical stability often requires interpolating artificial cross section in the model. HEC-GeoRAS allows the modeler to use a high resolution DEM to interpolate cross sections more accurately.

BASIN-LEVEL DIGITAL ELEVATION MODELS
33
Figure 6: 1997 Red River flood outline downstream of Grand Forks, ND. One-Dimensional Unsteady State Unsteady flow models like MIKE-11, UNET, FLDWAV and HEC-RAS have also been developed along the Pembina, Sheyenne, and Red Rivers. They were developed using data from the steady state models. Cross sections were extended to include the floodplain using USGS 7.5-minute topographic quadrangle maps with 5-foot contour intervals. The width of the 1997 Red River Floodplain in the United States varied from one to twelve miles. The existing USGS topographic mapping is not precise enough to adequately define floodplain storage for the unsteady flow models. One-dimensional unsteady state models are used to route a flood hydrograph. They have the same limitations that one-dimensional steady state models have, that they assume that the water surface is constant across the cross-section. Unsteady models are

BASIN-LEVEL DIGITAL ELEVATION MODELS
34
used to model a flood hydrograph. They can be used to compute changes in the hydrograph that occur due to flood plain storage. As previously noted, the Red River has a very wide floodplain, thus flood plain storage has very significant effect on flood peaks. Roads, railroads, levees and other long linear features also divide the Red River floodplain. These features act as weirs and barriers to flow during flood events. Accurate modeling of the floodplain requires an accuracy of 0.1 to 0.2–feet for the elevation of these features. Two-Dimensional Hydrodynamic Two-dimensional hydrodynamic models like RMA-2 and FESWMS have been developed for a few limited areas along the Red River. They are being used to study the effects of bridge replacements and floodplain encroachments. Two-dimensional models require a grid that can define road profiles to a vertical accuracy of 0.1 to 0.2-feet. The required accuracy of the DEM in open fields is about 0.5-feet. Flood Forecasting
Flood forecast models used by the National Weather Service include FLDWAV, an unsteady flow model. The FLDWAV model developed for the Red River used the same geometry data as the HEC-RAS models. Any improvements to the geometry data can be used to improve the accuracy of the NWS FLDWAV model. The FLDWAV model can also be used to forecast the flood profile along the entire Red River. The previous forecast models gave forecast at specific USGS gage locations along the Red River. An accurate DEM would allow the forecast to be shown as a flooded outline along the Red River. The existing DEM is not accurate enough to show a flood inundation map. ENGINEERING ANALYSIS
The Corps’ process leading to project implementation starts with a reconnaissance study/initial assessment based on readily available information. Preliminary designs and cost estimates have traditionally used data interpolated from USGS quadrangle maps with 5- or 10-foot contours. The floor of the Red River valley is too flat to determine an accurate flooded area outline by interpolating from quadrangle maps because an error of just 1 or 2 feet can translate into several square miles of flooded area. This, in turn, can result in large errors in estimates of agriculture-related flood damages and, conversely, benefits from for example, a proposed floodwater storage facility.
In many instances a feasibility study has been expanded during the investigation, beyond the original geographical LiDAR limits. Remobilizing the LiDAR contractor for the additional study area is cost prohibitive, this means relying on poorer quality 30-meter DEM or interpolating from 5- or 10-foot contours on USGS quadrangle maps. Universal, high resolution DEM coverage will ensure that the same high quality topography is available for all study areas in the Red River Basin.

BASIN-LEVEL DIGITAL ELEVATION MODELS
35
In some cases, high resolution DEM may be sufficient for final design, i.e., in the
development of construction plans, particularly in the Red River valley where the topography is relatively flat. Enhanced DEM could be ideal for design-build type contracts where, for example, the topography is fairly uniform and a generic cross section would suffice.
Full coverage, detailed DEM would also fit directly into the University of North Dakota’s Energy and Environmental Research Center (EERC) study of the “waffle plan.” The waffle plan is based on the concept that the grid of raised section-line roads crisscrossing the Red River Basin’s farmland could be used to temporarily store runoff and, thus, reduce the flood peak on the Red River main stem. Phase 1 of EERC’s effort is to collect accurate xyz coordinates for road crests, drainage structures, bridges, and land surface elevations in areas thought to have floodwater storage potential. Phase 1 would be accomplished quicker and at a substantial cost savings if universal, high-resolution DEM data were available. WEB MAPPING TOOLS AND APPLICATIONS
A number of web mapping initiatives in the Red River Basin, as well as across the country, are receiving considerable attention from a broad stakeholder community. In many instances, however, the science is well understood but the data are lacking to properly assess opportunities or project impacts. Due to the large number of stakeholders involved in these projects, web mapping tools and applications are being increasingly used to collaborate and share information to improve the decision-making process. The ability to share and distribute DEM data across a broad stakeholder community is addressed in other sections of this report.
Considerable effort since the 1997 flood has occurred within the Red River Basin to develop web-based tools, which support decision-making. The RRBDIN is the primary outcome of this effort (www.rrbdin.org). Many additional tools and applications for implementation through the RRBDIN have been developed conceptually (Houston Engineering and Golder Associates, 1999a, 199b). These applications include:
1) Basin management planning;
2) Flood risk assessment;
3) Flood proofing;
4) Conceptual planning and remediation of flood control measures;
5) Hydrology of small watersheds;
6) Disaster emergency response;
7) Real-time reservoir operation;
8) Communication tools for emergency management personnel;
9) Real-time status of ice and debris jams; and

BASIN-LEVEL DIGITAL ELEVATION MODELS
36
10) Flood recovery and cleanup.
The lack of an accurate DEM has proven to be the critical, limiting technical factor in the development of many of these applications and tools.
Recent discussions for web-based mapping tool and application development have focused on near-real time flood inundation mapping based on NWS flood forecasts. The concept is to develop a web-based mapping tool to present and display NWS hydrologic forecast data for the Red River Basin, building upon the previous efforts of the RRBDIN. The RRBDIN presently contains an interactive mapping tool coined “BasinViewer”, which displays Federal Emergency Management Agency (FEMA) flood hazard (Q3) boundaries from the Flood Insurance Rate Maps (FIRMs). These data are currently the best available resource to present flood risk information. However, these maps only show flood inundation areas based on selected floods, typically the 1% and the 0.2% chance floods and differ fundamentally from the hydrologic forecasts provided by the NWS. The NWS hydrologic forecasts represent the best estimate of the discharge and stage based upon actual current conditions. These forecast can truly be used to represent the risk of flood (and drought) The ability to visually provide these hydrologic forecast data is critical to decision making.
The intent of this effort is develop a general demonstration tool for the Fargo-Moorhead area (where a current high resolution DEM exists) that can be implemented by other NWS offices, which use the flood wave (FLDWAV) model for developing hydrologic forecasts. The unique aspect of this approach is capitalizing on the previous effort to development RRBDIN and the use of this excellent tool.
Greenway on the Red is an outgrowth of the IFMI process. An issue of critical importance to this effort is the identification and prioritization of land for inclusion in the greenway. Although specific technical criteria are yet to be develop to prioritize areas for inclusion, one factor is certainly depressional areas adjacent to the Red River, capable of storing some runoff. Implementation of a mapping tool on the RRBDIN to prioritize these areas has been discussed. The lack of an accurate high resolution DEM for the area adjacent to the Red River has hampered this effort.
One fairly new initiative is Section 206 of the Water Resources Development Act
of 1996, as amended, which provides authority for the Corps of Engineers to construct aquatic ecosystem restoration and protection projects. Such projects will usually include the manipulation of hydrologic processes in and along bodies of water, including wetlands and riparian areas. A project is adopted for construction only after a detailed investigation determines that the project will improve the quality of the environment, is in the best interest of the public, and clearly shows the engineering feasibility and environmental justification of the improvement. In many instances it is challenging to pursue these projects in a timely and low cost fashion because the detailed elevation data are not available that would allow for the identification of ponding areas or appropriate riparian zones and prioritization of those areas, relative to their contribution to ecosystem structure and function. Subtle differences in elevation can have a major impact on wetland hydrology and successional characteristics and the ability to accurately quantify ecosystem benefits would be greatly improved with more accurate and systemic elevation data.

BASIN-LEVEL DIGITAL ELEVATION MODELS
37
Land set-aside programs would also stand to benefit from high-resolution
elevation data. Again, the ability to define the impacts of restoring or converting a piece of land and to prioritize how those various land units are acquired would be more efficiently carried out if accurate assessments using high resolution data could be performed. The Greenway on the Red project is one example of this. The overriding purpose of this contiguous Greenway will be to mitigate the destruction and hardship caused by inevitable flooding in the Red River Basin. The Greenway on the Red will coordinate the establishment of a 600-mile continuous Greenway on the Red River collaboratively with partners in North and South Dakota, Minnesota, and Manitoba. This type of effort that crosses multiple jurisdictional areas would greatly benefit from a seamless, systemic, and easily accessible high-resolution dataset.
A capability that is of great interest to communities in general as well as individual land/home owners is the ability to visualize the results of different plans or model output and readily see how their specific interests may be impacted. Examples include web-based mapping tools that can allow aerial photographs to be overlain with hydraulic model output to help visualize the extent of potential flood events. Given the proper high-resolution elevation data, similar applications could allow a landowner to see the impacts of a flood control project, ring-levee, or a riparian restoration project, on their own land/structure, and more importantly to visualize the potential impacts on upstream and downstream communities and landowners. Existing 10- or 30-meter DEM data simply do not provide the detail required to build these applications in a reliable way. These tools and applications can be built with existing technology, but require detailed high-resolution elevation data.

BASIN-LEVEL DIGITAL ELEVATION MODELS
38

BASIN-LEVEL DIGITAL ELEVATION MODELS
39
NON-STANDARD BASIN DATA HIGH RESOLUTION COLLECTIONS TO DATE
Several high-resolution elevation data collections have occurred within the U.S. and Canada since approximately 1997. High-resolution elevation data are those generally capable of producing 1-foot or 2-foot contour intervals with a vertical accuracy of one-half the contour interval. The collections, which have been completed within the Red River Basin, are typically “isolated” in geographic extent and completed for a specific purpose. The primary purposes of these collects have been for the development of regulatory floodplains or the planning and design of specific water resource development projects. (See Table 1)
These data are generally available for use within the Red River Basin. However, adjacent collects have not been processed into a seamless product for general use. Figure 7 illustrates the geographic coverage of these collects, and a summary of the details for each collect is provided in Appendix 3.
PENDING HIGH RESOLUTION COLLECTIONS WITHIN THE BASIN There are presently two known planned collections within the U.S. portion of the
basin; i.e. the Maple River and South Branch Buffalo River near Sabin, MN. The Maple River collection is approximately 91.9 square miles and the South Branch Buffalo River is approximately 10-15 square miles (See Figure 7). Future collections will most likely occur on an as-needed basis for specific projects, as they have in the past unless funding becomes available for a regional collection.

BASIN-LEVEL DIGITAL ELEVATION MODELS
40
Table 1 - Summarizes the known collections to date within the U.S. Collect Name Date Area Data Distribution
Restrictions Products Metadata
Southern Cass County ND and Clay County, MN
April 1999 138 mi2 None bare earth mass points and break lines, 1 foot contours, and black and white digital orthophotos
Yes
City of Fargo May 2002 164.5 mi2 None bare earth mass points and break lines, 1 foot contours, and color digital orthophotos
Yes
FM COG May 2002 86 mi2 None bare earth mass points and color digital orthophotos
Yes
Sheyenne River FIS
Spring 2002 74 mi2 None bare earth mass points and break lines, 1 foot contours, and black and white digital orthophotos
Yes
Clay County CTP
Nov. 2002 86 mi2 None bare earth mass points and break lines, 1 foot contours, and black and white digital orthophotos
Yes
Manston WMA Spring 2002 16.5 mi2 None bare earth mass points and break lines, 1 foot contours, and black and white digital orthophotos
Yes
Wild Rice River Spring 2002 81 mi2 None bare earth mass points and break lines, 1 foot contours, and black and white digital orthophotos
Yes
Wahpeton, ND/Breckenridge, MN
May 1998 39.5 mi2 EagleScan retains ownership
bare earth mass points and break lines, 2 foot contours, and black and white digital orthophotos
No
Pembina River June 1999 and May 2000
60.5 mi2 None LiDAR mass points and bare earth mass points
No
Sheyenne River Corridor
Nov. 2000 360 mi2 None bare earth DTM, spot elevations, contours, and vegetation heights
No
Devils Lake, ND Nov. 2000? 782 mi2 None bare earth DTM and 1 foot contours
No
Roseau County, MN (Near City of Roseau and City of Warroad)
Nov. 5, 6, 7 2002
87 mi2
(Collects took place at two separate locations)
None pre-processed and bare-earth x,y,z ASCII files, pre-processed and bare-earth DEMs with 2-meter grid spacing, and break lines
Yes

BASIN-LEVEL DIGITAL ELEVATION MODELS
41
Figure 7. LiDAR collects within the Red River Basin.

BASIN-LEVEL DIGITAL ELEVATION MODELS
42

BASIN-LEVEL DIGITAL ELEVATION MODELS
43
HIGH AND MEDIUM RESOLUTION DATA GAPS
BACKGROUND
The terms ‘high’ or ‘medium’ resolution are not consistently used across the
country or among different types of applications, e.g. medium resolution data for a snowmelt runoff model may be considered low resolution for a flood insurance mapping application. There are also many ways to represent elevation, including evenly spaced grids, contour topography lines, and irregular networks. The discussion in this section generalizes on the representation and focuses on the vertical resolution of the data.
Very small changes in elevation (6 inches) can have major influence on flood water movement in extremely low relief areas such as the floodplain of the Red River Basin. Modeling or predicting water movement in these areas is extremely difficult without detailed elevation data especially on controlling features such as roads (the dominant vertical feature across the landscape) and culverts. Since LiDAR technology became operationally available, it has often been seen as a panacea. Finally there is a quick and cost-effective way (usually) to obtain the + 6 inch vertical accuracy elevation data that engineers and planners believe is needed to effectively model and assess floodplain and flooding processes. However, there are many issues that remain unresolved to define the appropriate role of LiDAR in water resource applications. Many of these issues are discussed in other sections of this report but include development/accuracy of bare earth models, data density and file size, data distribution, and licensing issues. Resources for obtaining and processing LiDAR data are often unavailable for many smaller scale projects and studies and thus alternative sources of elevation data are still relevant and should be considered for their applicability. In practice there is always a trade off between required accuracy and costs (collection, processing, maintenance).
For purposes of floodplain mapping and flood damage reduction studies high-resolution elevation data is typically expressed as data equivalent to a 2-foot contour interval or finer. These data have usually been derived from photogrammetric procedures or more recently through the use of LiDAR. Medium resolution data can be considered any data that is equivalent to or more accurate than the standard 30 meter USGS DEM (elevation model developed using 30 meter post spacing of point elevations) but less detailed than LiDAR or photogrammetrically derived contours. Although DEM data representing the equivalent of 5-foot contours are available in a majority of upland areas across the United States, floodplains are typically of low relief and both high and medium resolution topographic data are frequently lacking in these critical areas where flood

BASIN-LEVEL DIGITAL ELEVATION MODELS
44
damage reduction and ecosystem restoration projects are focused (see Section 2.5 for availability of various data sources in the Red River Basin).
Stakeholders in the Red River Basin were asked in a recent workshop about their specific needs as they relate to elevation data resolution/accuracy. Specifically, questions including to what extent the existing national programs fulfill their needs, what level of detail is required for modeling, and how to link existing efforts with those such as the FEMA Map Modernization Program were discussed with the goal of trying to identify gaps and priorities for filling those gaps.
Considerable discussion revolved around the comparison of 10- meter USGS DEM and higher resolution data such as LiDAR. There was consensus that the 10-meter DEM data would be a significant improvement over the 30-meter DEMs that currently exist. An important factor in this assessment appears to be the lower cost than for extensive LiDAR coverage and therefore the greater likelihood that it could be realistically obtained, even if done in a piecemeal fashion. Better and continual coordination of elevation data collection or enhancement projects will be valuable in any case. These data would be most valuable for hydrologic modeling but would do less to further hydraulic modeling efforts.
There was no agreement on what amount of improvement in model results would occur with the 10-meter data versus higher resolution data. Workshop participants indicated there would be little gain in using 10-meter DEMs for extending cross-sections and little improvement in the display of flood inundated areas over the existing 30-meter DEM. Higher resolution data are critical for these users. A high resolution DEM would help modelers make better decisions about cross-section placement, enable link elevations to be more accurate and provide for better overall model results (better inputs = better outputs). This suggests that highest priority areas would include at least the main stem of the Red River and the tributaries that need to be modeled.
Priority areas for future collection would also include urban areas that currently lack high-resolution data because such data will provide better capability to document impacts on flood prone or vulnerable structures and in defining emergency evacuation routes. However, because of the potential vast extent of floodwaters, detailed elevation data on roads in rural areas is also critical to allow emergency and flood fighting personnel to safely navigate around floodwaters. Because roads and culverts are an important controlling factor on flood routing and timing, these features are also considered high priority for high resolution collects. In this case, spot elevations may be best collected using GPS technology rather then LiDAR or other airborne systems.
The diversity of applications and priorities for high resolution data suggests that an extensive and coordinated effort to gather this information at least across the floodplain and other critical areas would be most efficient and provide maximum benefits. The existing data gaps are consistent across the Basin and collects that are based on political boundaries will prove less beneficial, i.e., data only on one side of the river. However, there are also applications for medium resolution data and further

BASIN-LEVEL DIGITAL ELEVATION MODELS
45
consideration should be given to possible efficiencies of a multi-resolution data set that could fill the data gaps and meet the needs of the array of potential applications and projects. GEOGRAPHICAL EXTENT FOR FUTURE HIGH RESOLUTION COVERAGE
The geographical extent of future high-resolution collections is related to need, priority and cost. Economy of scale is realized as the collection area increases, because the cost per unit area decreases. The ideal situation in the absence of fiscal issues is a basin-wide collection that uses the same collection technology and meets one specification. This approach ensures the final product is geographically consistent and easier to use. The disadvantage is the cost and the fact that the collect may occur in areas with little need for the data. Several options are available to complete the collection. Figure 8 illustrates the geographic extent of three options.
Figure 8. Geographic extent options map.
As-Needed Coverage: A project or as-needed approach is the current approach taking place in the Basin. The advantage of this approach is cost savings if there are a

BASIN-LEVEL DIGITAL ELEVATION MODELS
46
limited number of projects that do not exceed the cost of a basin-wide collect and the collection does not occur where there is little need for the data. The disadvantage of this approach is the use of differing specification, sensors, data holders and contractors and deliverables for the collects. Merging the final deliverables from each collect as they occur means it is costly to obtain consistent and seamless products. This can also result in gaps in coverage. Therefore, cost may occur to process data than for a larger geographic area.
The volume of data generated from this method has and will vary by project area and deliverable end products. End-project deliverables may include digital orthophotography, pre-processed spot elevations, bare-earth model spot elevations, height of vegetation spot elevations, DTM (mass points and breaklines), contours (varying intervals), TINs and DEMs (varying resolutions). Below are estimates of the volume of data based on Cass/Clay County LIDAR collection deliverables. The volume of data can change based on a number of factors like data format, density of features, amount of overlap between tiles, and LIDAR technology used.
• Black/White Color Orthophotos (TIFF format at 0.7ft pixels) – 56 mb per mi2
• Bare-earth spot elevations (ASCII format) – 25 mb per mi2
• 1-ft Contours (AutoCAD format) – 8 mb per mi2
• DTM (spot elevations and breaklines) - 40 mb per mi2
The LiDAR cost is estimated at a range of $1,000 to $1,500 per square mile for a project-based approach with final deliverables of bare-earth spot elevations, contours, DTM, and digital black/white orthophotography. This cost is based on a regional engineering firm’s experience within the basin. Costs would likely be more expensive for smaller project areas and less expensive for larger project areas. Costs also vary by end product deliverables and point spacing during the collection.
Basin-Wide Collection: This approach requires the collection of high-resolution
data for the entire U.S. portion of the Red River Basin of the North. The advantages of this approach are getting the lowest cost per unit area and getting consistent end products because the collect would be to one specification using the same LiDAR sensor and technology. The disadvantage of this method is it would be the most expensive approach for the initial collection because of the size of the collect. The area for this collect including the Devils Lake basin is 39,300 mi2.
Using the Clay/Cass county LIDAR collect as a basis, the estimated volume of data for end products is:
• Black/White Color Orthophotos (TIFF format at 0.7ft pixels) – 2.1 terabytes
• Bare-earth spot elevations (ASCII format) – 0.9 terabytes
• 1-ft Contours (AutoCAD format) – 0.3 terabytes
• DTM (spot elevations and breaklines) - 1.5 terabytes

BASIN-LEVEL DIGITAL ELEVATION MODELS
47
The cost estimate for a basin-wide LiDAR collect ranges between $12 million to $20 million using a $300 to $500 per square mile range. The cost was estimated based on an estimate provided by a regional LiDAR collection consultant and includes LiDAR acquisition at 4-meter spacing, ground survey, production of DTM, contour generation, and black and white digital orthophotography.
Valley-Wide Collection This approach would be very similar to the Basin-wide
approach, but the collect limited to the valley of the Red River Basin. The valley of the basin was delineated using all land adjacent to the Red River of the North less than 1,000 ft mean sea level (See Figure 8). One disadvantage with this approach is the tributaries would be excluded. The estimated area for the valley is 9,326 mi2. A slight alternative to this approach would be to follow county boundaries as much as possible. The advantage of using county boundaries is potentially better support by counties and municipalities included in the area. This area includes 13 complete counties and 3 partial counties. The area for this alternative is 17,300 mi2. Using the Clay/Cass county LiDAR collect as a basis, the estimated volume of data for the valley-wide option is:
• Black/White Color Orthophotos (TIFF format at 0.7ft pixels) – 510 gigabytes
• Bare-earth spot elevations (ASCII format) – 228 gigabytes
• 1-ft Contours (AutoCAD format) – 74 gigabytes
• DTM (spot elevations and breaklines) - 364 gigabytes
The cost estimate for a valley-wide LiDAR collect ranges between $5 million to $7.5 million, using a $500 to $800 per square mile range. The cost estimate for the county alternative ranges between $5 million to $9 million, using a $300 to $500 per square mile range. The cost was estimated based on an estimate provided by a regional LiDAR collection company and includes LiDAR acquisition at 4-meter spacing, ground survey, production of DTM, contour generation, and black and white digital orthophotography.
1997 Flood Boundary Plus Safety Factor: This approach would be very similar to the valley-wide approach, but with the data collection limited to the 1997 flood boundary and an arbitrary 5-mile buffer as a safety factor. The purpose of the safety factor is to reasonably ensure coverage into areas of interest. The area covered by the 1997 flood boundary plus the safety factor is approximately 4,450 mi2. The advantage to this approach is it would cover all of the land flooded adjacent to the Red River in 1997. The disadvantage to this approach is it would exclude all of the land adjacent to the tributaries that flood. Also it would be of less value to local governmental units because it does not include entire counties.
Using the Clay/Cass county LiDAR collect as a basis, the estimated volume of data for the 1997 flood boundary plus safety factor option is:

BASIN-LEVEL DIGITAL ELEVATION MODELS
48
• Black/White Color Orthophotos (TIFF format at 0.7ft pixels) – 243 gigabytes
• Bare-earth spot elevations (ASCII format) – 109 gigabytes
• 1-ft Contours (AutoCAD format) – 35 gigabytes
• DTM (spot elevations and breaklines) - 174 gigabytes
The cost estimate for a flood boundary plus safety factor LiDAR collect ranges between $3.5 million and $4.5 million using an $800 to $1000 per square mile range. The cost was estimated based on an estimate provided by a regional LiDAR collection company and includes LiDAR acquisition at 4 meter spacing, ground survey, production of DTM, contour generation, and black and white digital orthophotography.
GEOGRAPHICAL CONSIDERATIONS
The actual collect will likely follow some jurisdictional line, for ease of collection. Potential jurisdictional boundaries could include counties, townships or the public land survey system. This factor could change the size of each option slightly.
If a basin-wide, valley-wide, or 1997-flood boundary option is recommended, there should be consideration given to exclude the areas that have already been collected if it is more cost beneficial to use what has already been collected in the past for LiDAR data. It would also be assumed most vendors would have to acquire and process these collects in multiple phases due to the size of the collect.

BASIN-LEVEL DIGITAL ELEVATION MODELS
49
DATA PROCESSING CONSIDERATIONS
LiDAR and IFSAR have recently become the technologies of choice in mass production of DEMs, DTMs, and TINs.
The Topographic Engineering Center (TEC), one of the laboratories of the Engineer Research and Development Center (ERDC) of the U.S. Army Corps of Engineers, provided technical support to FEMA-initiated projects to perform a comprehensive evaluation of remote sensing technologies applied to multi-hazard management requirements. One emphasis within this project has been to use LiDAR in an operational manner to reduce the cost of flood map production. A specific area of evaluation has been the use of Digital Elevation Model (DEM) results produced by these sensors to improve the accuracy and completeness of useable DEMs over required geographic regions. Different levels of vertical accuracies are often required within the same DEM. Areas within the flood zones often need to show a finer degree of vertical change between DEM points than is required in areas outside the flood zones. FEMA Map Modernization requires bare earth DEMs accuracies in the sub-foot range.
Presently, LiDAR data can be processed using several methods: manual editing, spatial and statistical filtering, and techniques using multiple return analysis. Manual editing techniques are time-consuming and expensive, primarily due to the large number of points that need to be removed. Spatial and statistical filters tend to physically alter and/or smooth the derived LiDAR elevation values, resulting in an overall loss of data accuracy. Multiple LiDAR return techniques, as they are generally used, involve the use of 2 or 3 returns as a best-fit representation of the bare earth surface. These returns are then edited for the removal of non-bare earth features. These techniques appear to work well in low to moderately vegetated areas and where the density of cultural features is relatively low. The disadvantage of using this technique is that large amounts of representative ground surface points are being excluded from the data, due to the fact that all multiple return layers contain bare earth surface points.
Many of the developed LiDAR processing applications have focused on supporting the generation of two-dimensional data sets (surface generation for the development of digital orthophotography and the generation of digital elevation contours). These processing algorithms have quickly become overwhelmed by the large volumes of data generated by the LiDAR collection systems and by the complex data processing requirements. There needs to be a higher focus on the extraction of digital elevations outside the context of the bare earth surface (Bryant, 2002).

BASIN-LEVEL DIGITAL ELEVATION MODELS
50
In support of FEMA and the Corps of Engineers bare earth DEM mapping requirements, TEC initiated a Small Business Innovation Research (SBIR) topic under the auspices of the U.S. Army Research Office. The SBIR topic was initiated to address the automated filtering of feature data from LiDAR technologies. During the Phase I effort the SBIR evaluated several aspects of LiDAR data processing that relate directly to digital feature extraction, classification and LiDAR filtering techniques. The development of data integration tools within an image processing and GIS environment provided the capability to digitally extract 3-D earth surface feature information from LiDAR data. This included digital elevations of bare earth surfaces, vegetation, cultural features, 3-D tree canopy structures, 3-D building footprints; and other man-made structures processed within an automated environment over varying terrains. The initial SBIR Phase I and Phase I Option were used to evaluate the proposed techniques, and to design and implement a functional and commercially viable data processing workstation using real-time LiDAR data. Each technique was evaluated to document its functionality and limits as a function of terrain type, vegetation type and density, and cultural features.
The SBIR Phase II focused on developing a prototype system that post-processes LiDAR data within a database management, image processing, and GIS environment. The initial challenges in dealing with LiDAR data is the ability to rapidly and efficiently access, import, reformat, display and query the data. Without this capability later processing and analysis is at best cumbersome. The Phase II design and implementation of a LiDAR Database Management System, structured around a LiDAR Map Library and 2-D/3-D display capabilities were critical components in the development of the prototype system. The Phase II effort contained a series of technical tasks and milestones linked to a set of systematic software testing. All aspects of the Corps Civil Works end user mapping requirements that require high-resolution terrain were incorporated into the prototype system and were tested through the alpha, beta, and first release levels with the New Orleans, Mobile, Saint Louis and Jacksonville Districts.
BASIN-LEVEL DIGITAL ELEVATION MODELS
51
DATA DISSEMINATION CONSIDERATIONS
OVERVIEW The distribution technology for any resolution product is important. Collecting
the data is of limited value if distribution to the end user is problematic. Without an efficient, standardized method to deliver the data to potential users the value of the collection is reduced. There is currently no single method to distribute high-resolution elevation data collected in the Red River Basin. Each data owner distributes the data on an as-requested basis, recovering the cost for duplication. Only the Wahpeton-Breckenridge LiDAR collect has restricted distribution. This collection is owned by the original contractor and cannot be distributed without written consent from them.
The products from a high resolution topographic data collect are large when in an electronic format and are usually gigabytes in size. The final products include DEMs, mass points, break lines, and contours. For example, the City of Fargo used LiDAR to collect elevation data for approximately 146 square miles. The products from the collect included bare-earth x,y,z ascii files, break lines, 1-foot contour drawings in AutoCAD format, and color digital orthophotos. These deliverables currently require 120 gigabytes of hard drive storage.
When evaluating distribution methods for high-resolution elevation data it is important to consider the volume of data, evaluate current working distribution examples, understand the distribution cost and the demand for the different types of products. A summary of these issues follows.
DISTRIBUTION EXAMPLES Only one example of a large high-resolution (LiDAR) collect and data
distribution system is available. As discussed previously, the State of North Carolina collected LiDAR data for the entire State over three years in three separate phases. The data collection occurred as part of the FEMA CTP Program to update flood insurance rate maps. The State developed an interactive mapping website that allows users to view and download the data.
The interactive system currently allows a user to download DFIRMs & FIS Reports in PDF format; Bare Earth Terrain (Mass Points and Breaklines as ESRI shapefiles), 20 foot ascii DEMs, 50 foot hydro-enforced ascii DEMs as Zip files, and Imagery in TIFF format. For distribution of the data, the State was divided into non-overlapping 10,000 by 10,000-foot grid panels to ensure the distribution is manageable for the user (http://www.ncfloodmaps.com/).

BASIN-LEVEL DIGITAL ELEVATION MODELS
52
The USGS has created the National Elevation Dataset, which is of medium resolution. The approach used by the USGS consists of ESRI’s ArcIMS product. This approach is seamless, but probably not feasible for the large volume of data associated with high-resolution topographic data (http://gisdata.usgs.net/ned/default.asp).
DEMAND The current demand for the existing LiDAR collects among stakeholders within the
Red River Basin has been minimal. One regional engineering consultant involved in many of the local collects received three requests for LiDAR data during the past year. The lack of demand is probably most related to a lack of knowledge about the potential uses, the difficulties with distribution and challenges associated with working with a large volume of data. In this case, therefore, previous demand is of limited value in predicting future demand. In all likelihood, demand for the high-resolution data will increase if the data are:
• in a uniform format and projection,
• users become aware the data exists;
• the data can be easily downloaded in a manageable file from the Internet; and
• there are data for a large portion of the Basin.
DISTRIBUTION METHODS There are a number of distribution methods that can be used for the high-
resolution topographic data. The following summarizes the pros & cons of each method (Table 2).
As-Requested: An as-requested distribution method (Figure 9) is the simplest method. This method consists of one entity responsible for fulfilling the data requests. The content and geographic extent of the request would need to be defined by the user. A charge for the cost of reproduction is sent to the user along with the data. The charge is intended to recover the labor and expenses associated with the cost of providing the data. An additional cost may be incurred for data processing services. A simple Internet based request form could be used for initiating the request. The approach is generally used by local government units and previously by the USGS. This approach is most applicable when the demand is low, but becomes more costly as the demand increases.

BASIN-LEVEL DIGITAL ELEVATION MODELS
53
Table 2. Data dissemination pros and cons.
Figure 9. As-needed distribution method.
Method Pro’s Con’s As-Requested Most cost effective if
demand is low. Only the data that is requested has to be processed.
Can become inefficient if the same area is request multiple times or the demand surpasses the cost to automate the distribution over time. All data has to be processed.
FTP Download Least cost method to automate distribution.
Difficult for users to find the panels they need. Difficult to sift through the files on an FTP site. All data has to be processed.
Interactive Map Download Least cost method to provide an easy to use interface for a user requesting data. May allow a user to view the data online.
Additional cost of developing an interface and configure web mapping software. All data has to be processed. This first cost may be offset by processing cost as demand increases.
Advance Interactive Map Download
The user may define an area to extract data from. They are not limited to map panels.
Most expensive option for software and hardware. All data has to be processed.
Data is requested by user via phone, mail, email or online web form.
Request is processed by public or private sector.
Data is processed and assembled into format requested by user.
Data returned to requestor via CD or FTP.
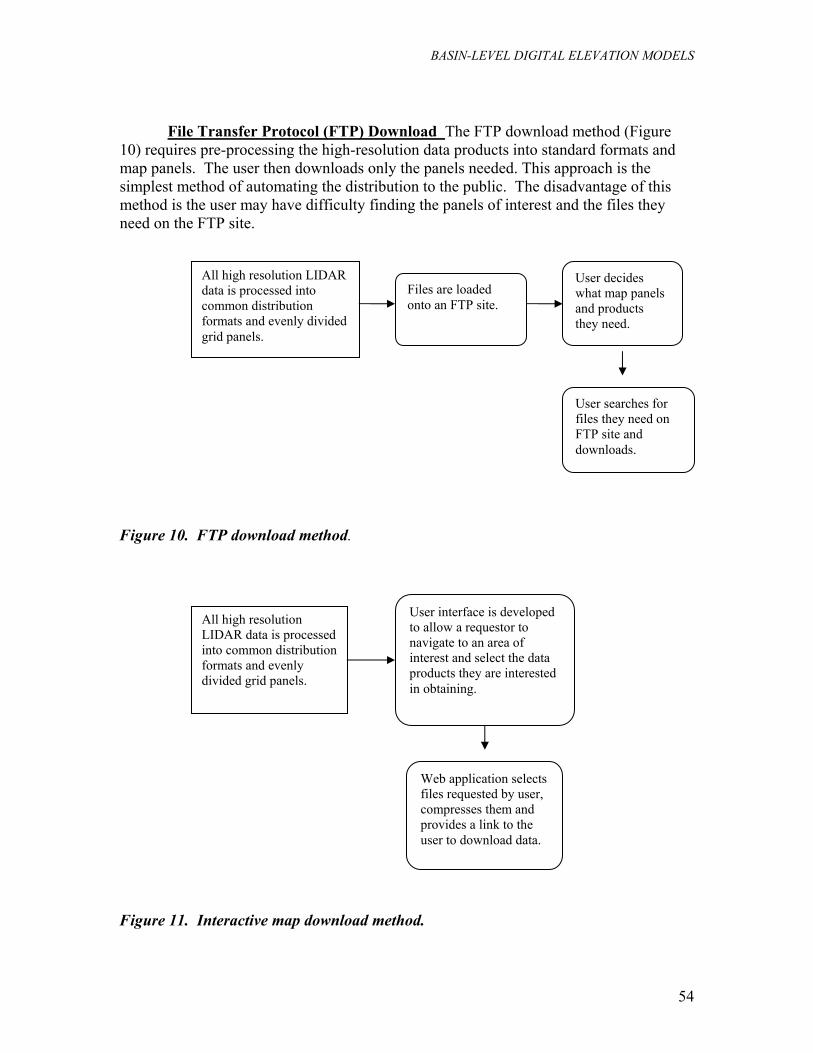
BASIN-LEVEL DIGITAL ELEVATION MODELS
54
File Transfer Protocol (FTP) Download The FTP download method (Figure
10) requires pre-processing the high-resolution data products into standard formats and map panels. The user then downloads only the panels needed. This approach is the simplest method of automating the distribution to the public. The disadvantage of this method is the user may have difficulty finding the panels of interest and the files they need on the FTP site.
Figure 10. FTP download method.
Figure 11. Interactive map download method.
All high resolution LIDAR data is processed into common distribution formats and evenly divided grid panels.
Files are loaded onto an FTP site.
User decides what map panels and products they need.
All high resolution LIDAR data is processed into common distribution formats and evenly divided grid panels.
User interface is developed to allow a requestor to navigate to an area of interest and select the data products they are interested in obtaining.
Web application selects files requested by user, compresses them and provides a link to the user to download data.
User searches for files they need on FTP site and downloads.

BASIN-LEVEL DIGITAL ELEVATION MODELS
55
Advanced Interactive Map Download The Advanced Interactive Map
Download method (Figure 12) would store the elevation data in a relational database management system (RDBMS) that is spatially enabled. Examples include Oracle Spatial and Microsoft SQL Server with ArcSDE. Data would be accessed by an interactive mapping system, which allows the user to define an area and extract the data products needed. This option may not be feasible because the volume of data may exceed the maximum storage capabilities of the RDBMS.
Figure 12. Advanced interactive map download method.
DISTRIBUTION COSTS Cost is an important issue when evaluating the preferred method for data
distribution. The cost includes not only the capital cost for the hardware and software but the labor cost for processing and data maintenance. Hardware is needed to store the large volume of data. Software is needed to run a web server and a user interface to disseminate the data to the public. Labor is needed to process the deliverables from a LiDAR vendor. The labor costs could vary significantly depending on what the LiDAR vendor can provide. A LiDAR vendor may be able to supply the data in user ready map tiles and in a data format suitable for public consumption.
The specific costs are difficult to estimate without knowing exact volume and data products planned to be distributed. It is also difficult to estimate costs for hardware and software without knowing the requests that need to be fulfilled per day. It is likely the
All high resolution LIDAR data is processed and loaded into a RDBMS.
User interface is developed to allow a requestor to define an area of interest and select the data products they are interested in obtaining.
Web application extracts the data from the RDBMS, converts it to a common file format, compresses the files and provides a link to the user to download data.

BASIN-LEVEL DIGITAL ELEVATION MODELS
56
costs would initially be a rough estimate and need to be adjusted once the collect was completed and the numbers of user requests were determined.

BASIN-LEVEL DIGITAL ELEVATION MODELS
57
CONCLUSIONS AND RECOMMENDATIONS
This section is a summary of the various findings and recommendations related to the filling of baseline data voids within the case study area. Technical and organizational concerns are addressed related to the collection, processing and dissemination of data to augment what already exists.
TECHNICAL CONSIDERATIONS
Basin-Wide Data
At a minimum, significant high-resolution data gaps remain along the US portion of the main stem of the Red River. On the Canadian side sufficient funds were secured following the 1997 flood to complete that portion. In addition to the main stem, other critical portions of the basin still are without data that can be used for modeling and planning needs.
The cost of developing a high resolution DEM across a large geographic area continues to decline. This makes acquiring high-resolution topographic data considerably more economical than only a few years ago. Whether the USACE should support the collection of a high resolution DEM primarily depends upon the extent of federal interest and involvement relative to the Corps mission and its companion federal agencies, within the area and region. The USACE is extensively involved in planning, evaluating and designing flood control works within the region. FEMA is also actively working with local sponsors to better define floodplain boundaries and reduce the damages associated with flooding. Other federal agencies like the U.S. Fish and Wildlife Service are also active in acquiring and protecting wetlands and native prairie agencies. Each of these agencies has an immediate need for high-resolution topographic data.
A second consideration relative to supporting a high resolution DEM pertains to the extent and degree of involvement within local and state agencies. Greater support is reasonable where there is an active state and local community working to address water management issues. This is the case within the Red River Valley.
Recommendation: A data collection plan for securing LiDAR data that, at a minimum, complements the Canadian approach in order to complete the planned mainstem basin-model that covers the 1997 flood zone Collection of high resolution topographic data within the US portion of the basin, using LiDAR technology, should occur for the area comprising the 1997 flood boundary plus a margin of safety. This area should be extended to include beyond the 1997 flood boundary to include whole counties and tributary areas up to the most downstream USGS gages. This approach increases the

BASIN-LEVEL DIGITAL ELEVATION MODELS
58
probability of interest and use at the local (county) level and the use of these data for hydrologic and hydraulic analysis and floodplain mapping.
Red River Basin interests should work with representatives from the U.S. Geological Survey and the Canadian Centre for Remote Sensing and to secure funding to complete the Seamless Data Server project for the Basin that was undertaken in the late 1990s. The RRBDIN is the tool for developing the Seamless Data Server.
Data Distribution Based on the current and projected demand we recommend a moderate technical
approach with mid-level costs. This means we recommend developing an interactive mapping system that allows users to zoom to an area of interest and download data products by predefined panels, similar to the North Carolina approach.
Recommendation: Based on the current and projected demand we recommend a moderate technical approach with mid-level costs. This means we recommend developing an interactive mapping system that allows users to zoom to an area of interest, select the data products and download the data products by predefined panels, similar to the North Carolina approach. The existing RRBDIN (www.rrbdin.org) is the logical vehicle for data distribution. This approach is the most effective for eliminating duplication and provides the end-user with the easiest method for finding the data they need. We would recommend providing orthophotos (if obtained), bare earth DTM (mass points and 3D breaklines) as shapefiles, and DEM (at one resolution) for distribution to the public. All other data request would be treated as a custom data request and could be fulfilled for a media and labor recovery cost. It would be recommend one agency or consultant is responsible for the data distribution system and maintenance. There would likely be a labor maintenance cost to maintain the software, hardware and data.
Research
Since basin-wide approaches to digital elevation modeling that have been derived from remote sensing are still in the developmental stages, there will most likely continue to be applied research needs related to both data base development and its various applications. Examples of areas where further research could be directed include:
• Interpolative research options as an interim substitute. Researchers and GIS firms, for instance, are developing conflation tools that allow for the merging of data from various sources into an improved version that is designed to meet widespread needs.
• Continue the advancement of web-based mapping tools, such as those being developed by the Red River Basin Decision Information Network team.
• Evaluate how the use of high-resolution topographic data affects the results of hydrologic and hydraulic model predictions. Specifically, the difference in water surface elevations between a hydraulic model developed using high-resolution

BASIN-LEVEL DIGITAL ELEVATION MODELS
59
topographic data and more traditional methods, i.e., field survey and cross-section interpolation from quadrangle maps, seems warranted. The research should be conducted for an area similar to the RRN where flat topography and storage adjacent to the channel necessitates unsteady hydraulic modeling.
Recommendation: Establish a directed research program, with input from public and private interests, within the Red River Basin that would identify and prioritize research needs and develop a multi-year funding strategy and peer-review process.
ORGANIZATIONAL CONSIDERATIONS Presently, the means by which the H&H modeling and data development are
coordinated within the Red River Basin is in a loosely based manner. The Red River Institute, which is the most logical organization for addressing DEM development issues, meets on an irregular basis with generally weak Canadian representation.
Recommendation: Create a locally sponsored geo-spatial coordination committee under the auspices of RRBI, RRBC, and the IRRB. The coordination committee should promote active Canadian interest to increase the likelihood of success for a seamless high-resolution topographic dataset along the Red River of the North.
Specific tasks to be performed by the geo-spatial coordination committee include:
• Developing and agreeing upon future collection requirements and specifications;
• Coordinating with state and federal interests (MN DNR, State Water Commission, and Map Modernization)
• Developing a strategy to obtain sponsorship (cost-shared approach); and
• Ensuring a coordinated research program.
This group should also integrate the continued development and use of the RRBDIN for data distribution.

BASIN-LEVEL DIGITAL ELEVATION MODELS
60

BASIN-LEVEL DIGITAL ELEVATION MODELS
61
REFERENCES Bluemle, J. 1997. "Factors affecting flooding in the Red River Valley." Proceedings of the North Dakota Academy of Science, Supplement 1 51: 17-20. Bryant, P., Campos-Marquetti, R., Daniel, C., 2002, “LiDAR Derived Elevation Data to Support Flood Plain Modeling”, ISPRS International Symposium on “Integrated System for Spatial Data Production, Custodian and Decision Support”, Xi’an, China. Bryant, P., Daniel, C., Hovey, S., 1998, “Complementing Remote Sensing Systems in Flood Mitigation and Preparation”, Association of State Floodplain Managers (ASFPM), Milwaukee, Wisconsin. Damron, J., Daniel, C., Maune D. 2000, “LIDAR and IFSAR: Pitfalls and Opportunities for our Future”, ASPRS, Washington DC,. Daniel, C. and Tennant, K., 2001, “DEM Quality Assessment” Chapter 12, reference book titled “Digital Elevation Models: New Technologies and Applications”, Reproduced with permission, the American Society for Photogrammetry and Remote Sensing: 395-440. ASPRS Conference Measuring the Earth, Saint Petersburg, Florida. Daniel, C. and Yoha, R., 1999, “Interferometric Synthetic Aperture Radar (IFSAR) Applications to Crisis Support”, NASA/FEMA sponsored GIS and Remote Sensing Conference, Washington DC. Harris, K. 1997. "Geologic setting and prehistoric record of the Red River Valley." Proceedings of the North Dakota Academy of Science, Supplement 1 51: 6-11. International Flood Mitigation Initiative for the Red River Basin. 2000. Final Report and Executive Summary. Bismark, North Dakota: The Consensus Council. International Joint Commission (IJC). 2000. Living with the Red: A Report to the Governments of Canada and the United States on Reducing Flood Impacts in the Red River Basin. Ottawa, Canada and Washington, D.C.: IJC. Krenz, G., and J. Leitch. 1998. A River Runs North: Managing an International River. Red River Water Resources Council.

BASIN-LEVEL DIGITAL ELEVATION MODELS
62
Mayer, G. 1997. "Involving science in future watershed management decisions." Proceedings of the North Dakota Academy of Science, Supplement 1 51: 5. Rannie, W.F. 1998. A Survey of Hydroclimate, Flooding and Runoff in the Red River Basin Prior to 1870. Prepared for the Geological Survey of Canada. Winnipeg, Manitoba: University of Winnipeg. Wechsler, S. P., 1999, Digital Elevation Model (DEM) Uncertainty: Evaluation and Effect on Topographic Parameters, Proceedings of ESRI User Conference.

BASIN-LEVEL DIGITAL ELEVATION MODELS
63
Appendix 1:
Hydrologic Models: Determination of Flood Hydrographs
TYPE PROGRAM DEVELOPED BY AVAILABLE FROM COMMENTS PUBLIC DOMAIN
HEC-1 4.0.1 and up2 (May 1991)
U.S. Army Corps of Engineers
U.S. Army Corps of Engineers, Institute for Water Resources Hydrologic Engineering Center (HEC) 609 Second Street Davis, CA 95616-4687
Flood hydrographs at different locations along streams. Calibration runs preferred to determine model parameters.
Yes
HEC-HMS 1.1 and up (March 1998)
U.S. Army Corps of Engineers
U.S. Army Corps of Engineers, Institute for Water Resources Hydrologic Engineering Center 609 Second Street Davis, CA 95616-4687 http://www.hec.usace.army.mil/
The Hydrologic Modeling System provides a variety of options for simulating precipitation-runoff processes. It has a capability to use gridded rainfall data to simulate runoff. It does not provide snowmelt and snowfall functions; it cannot be used for areas where snowmelt is an important flood hazard source and must be considered in estimation of flood discharges.
Yes
TR-20 (February 1992)
U.S. Department of Agriculture, Natural Resources Conservation Service
U.S. Department of Commerce National Technical Information Service 5285 Port Royal Road Springfield, VA 22161
Flood hydrographs at different locations along streams. Calibration runs preferred to determine model parameters.
Yes
Single Event
TR-55 (June 1986)
U.S. Department of Agriculture, Natural Resources Conservation Service
U.S. Department of Commerce National Technical Information Service 5285 Port Royal Road Springfield, VA 22161 http://www.wcc.nrcs.usda.gov/hydro/hydro-tools-models-tr55.html
Peak discharges and flood hydrographs at a single location.
Yes

BASIN-LEVEL DIGITAL ELEVATION MODELS
64
SWMM (RUNOFF) 4.30 (May 1994), and 4.31 (January 1997)
U.S. Environmental Protection Agency and Oregon State University
Center for Exposure Assessment Modeling U.S. Environmental Protection Agency Office of Research and Development Environmental Research Laboratory 960 College Station Road Athens, GA 30605-2720 http://www.epa.gov/ceampubl/swater/ Department of Civil, Construction, and Environmental Engineering Oregon State University 202 Apperson Hall Corvallis, OR 97331-2302 http://ccee.oregonstate.edu/swmm/ ftp://ftp.engr.orst.edu/pub/swmm/pc/
Calibration or verification to the actual flood events highly recommended.
Yes
MIKE 11 UHM (June 1999 and 2002D)
DHI Water and Environment DHI Inc. 301 South State StreetNewton, PA 18940
Simulates flood hydrographs at different locations along streams using unit hydrograph techniques. Three methods are available for calculating infiltration losses and three methods for converting rainfall excess to runoff, including SCS Unit hydrograph method. The web page is at: http://www.dhisoftware.com/mike11/Description/RR_module.htm
No
DBRM 3.0 (1993)
Bernard L. Golding, P.E. Consulting Water Resources Engineer Orlando, FL
Center for Microcomputers in Transportation (McTrans)University of Florida 512 Weil Hall Gainesville, FL 32611-6585
Flood hydrographs at different locations along streams. Calibration runs preferred to determine model parameters.
No
HYMO U.S. Department of Agriculture,Natural Resources Conservation Service
U.S. Department of Commerce National Technical Information Service 5285 Port Royal Road Springfield, VA 22161
Flood hydrographs at different locations along streams. Calibration runs preferred to determine model parameters.
Yes
PondPack v.8 (May 2002)
Haestad Methods, Inc. Haestad Methods, Inc. 37 Brookside Road Waterbury, CT 06708-1499 http://www.haestad.com
The program is for analyzing watershed networks and aiding in sizing detention or retention ponds. Only the NRCS Unit Hydrograph method and NRCS Tc calculation formulas are acceptable. Other hydrograph generation methods or Tc formulas approved by State agencies in charge of flood control or floodplain management are acceptable for use within the subject State.
No

BASIN-LEVEL DIGITAL ELEVATION MODELS
65
XP-SWMM 8.52 and up
XP Software XP-Software 2000 NE 42nd Ave. #214Portland, OR 97213-1305http://www.xpsoftware.com
Model must be calibrated to observed flows, or discharge per unit area must be shown to be reasonable in comparison to nearby gage data, regression equations, or other accepted standards for 1% annual chance events.
No
DR3M (October 1993)
U.S. Geological Survey U.S. Geological Survey National Center 12201 Sunrise Valley Drive Reston, VA 22092
Calibration to actual flood events required. The web page is at: http://water.usgs.gov/software/surface_water.html
Yes
HSPF 10.10 and up (December 1993)
U.S. Environmental Protection Agency, U.S. Geological Survey
Center for Exposure Assessment Modeling U.S. Environmental Protection Agency Office of Research and Development Environmental Research Laboratory 960 College Station RoadAthens, GA 30605-2720
Calibration to actual flood events required. The web page is at: http://water.usgs.gov/software/surface_water.html
Yes
MIKE 11 RR (June 1999 and 2002D)
DHI Water and Environment DHI Inc. 301 South State Street Newton, PA 18940
The Rainfall-Runoff Module (RR, formerly NAM) is a lumped-parameter hydrologic model capable of continuously accounting for water storage in surface and sub-surface zones. Flood hydrographs are estimated at different locations along streams. Calibration to actual flood events is required. The web page is at: http://www.dhisoftware.com/mike11/Description/RR_module.htm
No
Continuous Event
PRMS Version 2.1 (January 1996)
U.S. Geological Survey U.S. Geological Survey 12201 Sunshine Valley Drive Reston, VA 22092 http://water.usgs.gov/software/surface_water.htmlU.S. Geological Survey P.O. Box 25046, Mail Stop 412 Denver Federal Center Lakewood, CO 80225-0046 http://wwwbrr.cr.usgs.gov/mms/
PRMS is a modular-designed, deterministic, distributed-parameter modeling system that can be used to estimate flood peaks and volumes for floodplain mapping studies. Calibration to actual flood events required. The program can be implemented within the Modular Modeling System (MMS) that facilitates the user interface with PRMS, input and output of data, graphical display of the data, and an interface with GIS.
Yes
Interior Drainage Analysis
HEC-IFH 1.03 and up
U.S. Army Corps of Engineers U.S. Army Corps of Engineers, Institute for Water Resources Hydrologic Engineering Center 609 Second Street Davis, CA 95616-4687
Provides both continuous simulation and hypothetical event analyses. Coincidence frequency analysis (not included in the model) may be needed for some cases. Supporting documentation is available at: http://www.fema.gov/fhm/dl_ifh.shtm
Yes
2The enhancement of these programs in editing and graphical presentation can be obtained from several private companies. 3Program is typically distributed by vendors and may not be available through HEC. A list of vendors may be obtained through HEC.

BASIN-LEVEL DIGITAL ELEVATION MODELS
66
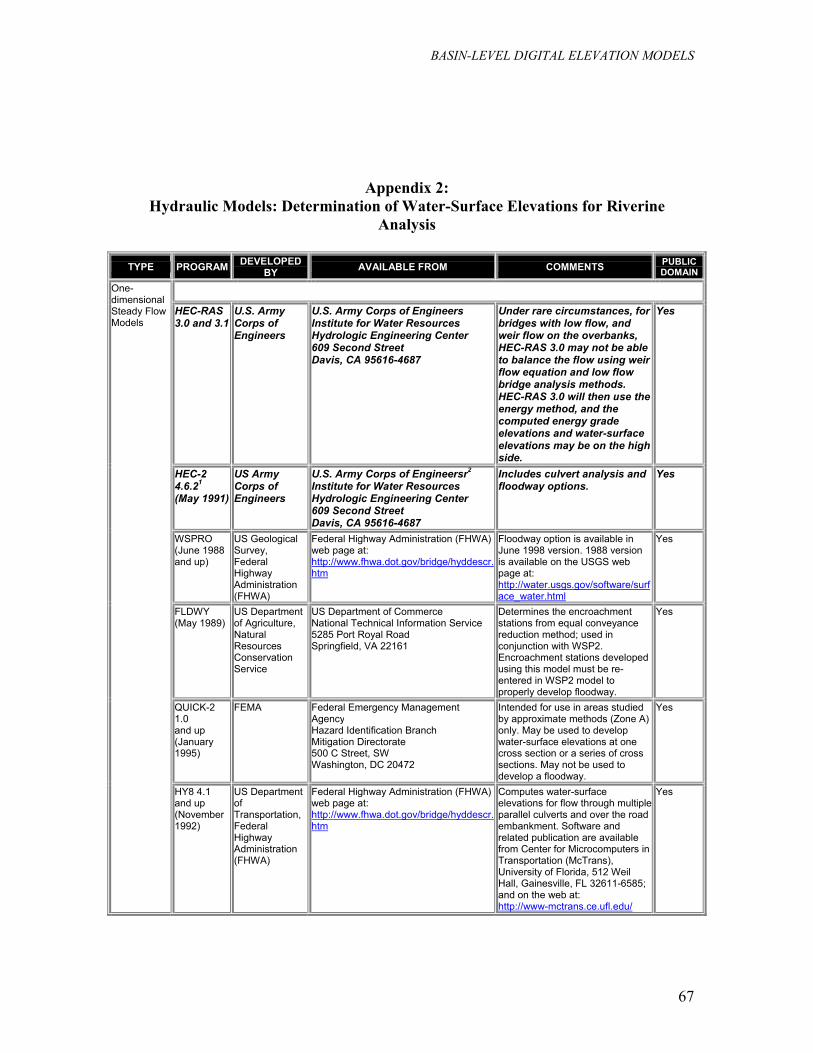
BASIN-LEVEL DIGITAL ELEVATION MODELS
67
Appendix 2: Hydraulic Models: Determination of Water-Surface Elevations for Riverine
Analysis
TYPE PROGRAM DEVELOPED
BY AVAILABLE FROM COMMENTS PUBLIC
DOMAIN
HEC-RAS 3.0 and 3.1
U.S. Army Corps of Engineers
U.S. Army Corps of Engineers Institute for Water Resources Hydrologic Engineering Center 609 Second Street Davis, CA 95616-4687
Under rare circumstances, for bridges with low flow, and weir flow on the overbanks, HEC-RAS 3.0 may not be able to balance the flow using weir flow equation and low flow bridge analysis methods. HEC-RAS 3.0 will then use the energy method, and the computed energy grade elevations and water-surface elevations may be on the high side.
Yes
HEC-2 4.6.21
(May 1991)
US Army Corps of Engineers
U.S. Army Corps of Engineersr2
Institute for Water Resources Hydrologic Engineering Center 609 Second Street Davis, CA 95616-4687
Includes culvert analysis and floodway options.
Yes
WSPRO (June 1988 and up)
US Geological Survey, Federal Highway Administration (FHWA)
Federal Highway Administration (FHWA)web page at: http://www.fhwa.dot.gov/bridge/hyddescr.htm
Floodway option is available in June 1998 version. 1988 version is available on the USGS web page at: http://water.usgs.gov/software/surface_water.html
Yes
FLDWY (May 1989)
US Department of Agriculture, Natural Resources Conservation Service
US Department of Commerce National Technical Information Service 5285 Port Royal Road Springfield, VA 22161
Determines the encroachment stations from equal conveyance reduction method; used in conjunction with WSP2. Encroachment stations developed using this model must be re-entered in WSP2 model to properly develop floodway.
Yes
QUICK-2 1.0 and up (January 1995)
FEMA Federal Emergency Management Agency Hazard Identification Branch Mitigation Directorate 500 C Street, SW Washington, DC 20472
Intended for use in areas studied by approximate methods (Zone A) only. May be used to develop water-surface elevations at one cross section or a series of cross sections. May not be used to develop a floodway.
Yes
One-dimensional Steady Flow Models
HY8 4.1 and up (November 1992)
US Department of Transportation, Federal Highway Administration (FHWA)
Federal Highway Administration (FHWA)web page at: http://www.fhwa.dot.gov/bridge/hyddescr.htm
Computes water-surface elevations for flow through multiple parallel culverts and over the road embankment. Software and related publication are available from Center for Microcomputers in Transportation (McTrans), University of Florida, 512 Weil Hall, Gainesville, FL 32611-6585; and on the web at: http://www-mctrans.ce.ufl.edu/
Yes

BASIN-LEVEL DIGITAL ELEVATION MODELS
68
WSPGW 12.96 (October 2000)
Los Angeles Flood Control District and Joseph E. Bonadiman & Associates, Inc.
Joseph E. Bonadiman & Associates, Inc.588 West 6th Street San Bernardino, CA 92410 http://www.bonadiman.com
Windows version of WSPG. Computes water-surface profiles and pressure gradients for open channels and closed conduits. Can analyze multiple parallel pipes. Road overtopping cannot be computed. Open channels are analyzed using the standard step method but roughness coefficient can not vary across the channel. Overbank analyses cannot be done. Multiple parallel pipe analysis assumes equal distribution between pipes so pipes must be of similar material, geometry, slope, and inlet configuration. Floodway function is not available. Demo version available from: http://www.civildesign.com
No
StormCAD v.4 (June 2002) and v.5 (Jan. 2003)
Haestad Methods, Inc.
Haestad Methods, Inc. 37 Brookside Road Waterbury, CT 06708-1499 http://www.haestad.com
Perform backwater calculations. Should not be used for systems with more than two steep pipes (e.g. supercritical conditions). Inflow is computed by using the Rational Method; the program is only applicable to watershed which has the drainage area to each inlet less than 300 acres.
No
PondPack v.8 (May 2002)
Haestad Methods, Inc.
Haestad Methods, Inc. 37 Brookside Road Waterbury, CT 06708-1499 http://www.haestad.com
Cannot model ineffective flow areas. HEC-RAS or an equivalent program must be used to model tail water conditions when ineffective flow areas must be considered.
No
Culvert Master v.2.0 (September 2000)
Haestad Methods, Inc.
Haestad Methods, Inc. 37 Brookside Road Waterbury, CT 06708-1499 http://www.haestad.com
Compute headwater elevations for circular concrete and RCB culverts for various flow conditions.
No
XP-SWMM 8.52 and up
XP Software XP-Software 2000 NE 42nd Ave. #214 Portland, OR 97213-1305 http://www.xpsoftware.com
XP-SWMM cannot represent more than three Manning's n values per channel section. Where more than this number of values per section are required, the user must demonstrate that the three n values used accurately depict the composite n value for the entire section at various depth.
No
One-dimensional Unsteady Flow Models
HEC-RAS 3.0 and 3.1
US Army Corps of Engineers
U.S. Army Corps of Engineers Institute for Water Resources Hydrologic Engineering Center (HEC) 609 Second Street Davis, CA 95616-4687 http://www.hec.usace.army.mil
Calibration or verification to the actual flood events highly recommended. Floodway concept formulation unavailable. Version 3.1 cannot create detailed output for multiple profiles in the report file. CHECK-RAS cannot extract data.
Yes

BASIN-LEVEL DIGITAL ELEVATION MODELS
69
FEQ 8.92 and FEQUTL 4.68 (1997, both)
Delbert D. Franz, Linsley, Kraeger Associates; and Charles S. Melching, USGS
US Geological Survey 221 North Broadway Avenue Urbana, IL 61801 http://water.usgs.gov/software/surface_water.html and technical support available at http://www-il.usgs.gov/proj/feq/
The FEQ model is a computer program for the solution of full, dynamic equations of motion for one-dimensional unsteady flow in open channels and control structures. The hydraulic characteristics for the floodplain (including the channel, overbanks, and all control structures affecting the movement of flow) are computed by its companion program FEQUTL and used by the FEQ program. Calibration or verification to the actual flood events highly recommended. Type 5 culvert flow computations of FEQUTL need verification with results obtained using methodology or models accepted for NFIP use. Floodway concept formulation is unavailable.
Yes
ICPR 2.20 (October 2000) and 3.02 (November 2002)
Streamline Technologies, Inc.
Streamline Technologies, Inc. 6961 University Boulevard Winter Park, FL 32792 http://www.streamnologies.com
Calibration or verification to the actual flood events highly recommended. Floodway concept formulation unavailable; however, version 3 allows user to specify encroachment stations to cut off the cross section.
No
SWMM 4.30 (May 1994), and 4.31 (January 1997)
US Environmental Protection Agency and Oregon State University
Center for Exposure Assessment Modeling US Environmental Protection Agency Office of Research and Development Environmental Research Laboratory 960 College Station Road Athens, GA 30605-2720 http://www.epa.gov/ceampubl/swater/ Department of Civil, Construction, and Environmental Engineering Oregon State University 202 Apperson Hall Corvallis, OR 97331-2302 http://ccee.oregonstate.edu/swmm/ ftp://ftp.engr.orst.edu/pub/swmm/pc/
Calibration or verification to the actual flood events highly recommended. Structural loss calculations unavailable and must be accommodated via roughness factor manipulation. Floodway concept formulation unavailable. Preferably, for NFIP purposes, head losses at bridges should be verified using WSPRO; losses at culverts should be verified using the US Geological Survey's six equations for culvert analysis. Losses at storm sewer junctions should also be verified with separate calculations; contact FEMA for guidance with these calculations. Supporting documentation for floodway calculations is available at: http://www.fema.gov/fhm/dl_swmm.shtm.
Yes
UNET 4.0 (April 2001)
US Army Corps of Engineers
U.S. Army Corps of Engineers Institute for Water Resources Hydrologic Engineering Center (HEC) 609 Second Street Davis, CA 95616-4687
Calibration or verification to the actual flood events highly recommended. Comparison of bridge and culvert modeling to other numerical models reveals significant differences in results; these differences may be investigated in the near future. Floodway option currently under review, not accepted for NFIP usage.
Yes

BASIN-LEVEL DIGITAL ELEVATION MODELS
70
FLDWAV (November 1998)
National Weather Service
Hydrologic Research Laboratory Office of Hydrology National Weather Service, NOAA 1345 East-West Highway Silver Spring, MD 20910
Includes all the features of DAMBRK and DWOPER plus additional capabilities. It is a computer program for the solution of the fully dynamic equations of motion for one-dimensional flow in open channels and control structures. Floodway concept formulation is unavailable. Calibration to actual flood events required. This model has the capability to model sediment transport. Program is supported by NWS. Supporting documentation is available at: http://www.fema.gov/fhm/dl_fdwv.shtm
Yes
MIKE 11 HD (2002D)
DHI Water and Environment
DHI Inc. 301 South State Street Newton, PA 18940
Hydrodynamic model for the solution of the fully dynamic equations of motion for one-dimensional flow in open channels and control structures. The floodplain can be modeled separately from the main channel. Calibration to actual flood events highly recommended. Floodway concept formulation is available for steady flow conditions. This model has the capability to model sediment transport. The web page is at: http://www.dhisoftware.com/mike11/
No
FLO-2D v. 2000.11 (December 2000)
Jimmy S. O'Brien, Ph.D., P.E.
FLO-2D Software, Inc. Tetra Tech, ISG P.O. Box 66 Nutrioso, AZ 85932
Hydrodynamic model for the solution of the fully dynamic equations of motion for one-dimensional flow in open channels and two-dimensional flow in the floodplain. Bridge or culvert computations must be accomplished external to FLO-2D using methodologies or models accepted for NFIP usage. Calibration to actual flood events required. Floodway computation is unavailable.
Yes
XP-SWMM 8.52 and up
XP Software XP-Software 2000 NE 42nd Ave. #214 Portland, OR 97213-1305 http://www.xpsoftware.com
XP-SWMM cannot represent more than three Manning's n values per channel section. Where more than this number of values per section are required, the user must demonstrate that the three n values used accurately depict the composite n value for the entire section at various depth. Calibration to actual flood events required. The floodway procedures are for steady flow purposes only. Use the procedure posted on the FEMA website at http://www.fema.gov/fhm/en_modl.shtm for unsteady flow floodway calculation.
No

BASIN-LEVEL DIGITAL ELEVATION MODELS
71
TABS RMA2 v. 4.3 (October 1996) RMA4 v. 4.5 (July 2000)
US Army Corps of Engineers
Coastal Engineering Research Center Department of the Army Waterways Experiment Station Corps of Engineers 3909 Halls Ferry Road Vicksburg, MS 39180-6199
Limitations on split flows. Floodway concept formulation unavailable. More review anticipated for treatment of structures.
Yes
FESWMS 2DH 1.1 and up (June 1995)
US Geological Survey
US Geological Survey National Center 12201 Sunrise Valley Drive Reston, VA 22092 http://water.usgs.gov/software/surface_water.html
Region 10 has conducted study in Oregon. Floodway concept formulation unavailable. This model has the capability to model sediment transport.
Yes
FLO-2D v. 2000.11 (December 2000)
Jimmy S. O'Brien, Ph.D., P.E.
FLO-2D Software, Inc. Tetra Tech, ISG P.O. Box 66 Nutrioso, AZ 85932
Hydrodynamic model that has the capabilities of modeling unconfined flows, complex channels, sediment transport, and mud and debris flows. It can be used for alluvial fan modeling.
No
Two-dimensional Steady/Unsteady Flow Models
MIKE Flood HD (2002 B and 2002 D)
DHI Water and Environment
DHI Inc. 301 South State Street Newton, PA 18940
A package that facilitates the dynamic coupling of MIKE 11 (one dimensional) and MIKE 21 (two-dimensional) hydrodynamic models. Solves the fully dynamic equations of motion for one- and two-dimensional flow in open channels, riverine flood plains, alluvial fans and in coastal zones. Control structures are modeled with one-dimensional flow using bridge and culvert routines in MIKE 11 HD. This combination allows users to model some areas in 2D detail, while other areas can be modeled in 1D. Calibration for actual flood events is highly recommended. The model has the capability to model sediment transport. The web page is at http://www.dhisoftware.com/mikeflood/
No
SFD US Army Corps of Engineers/FEMA
Federal Emergency Management Agency Hazard Identification Branch Mitigation Directorate 500 C Street, SW Washington, DC 20472
Simplified floodway procedure for streams with no regulatory floodway limits.
Yes Floodway Analysis
PSUPRO Pennsylvania State University/ US Army Corps of Engineers/FEMA
Federal Emergency Management Agency Hazard Identification Branch Mitigation Directorate 500 C Street, SW Washington, DC 20472
Encroachment analysis for streams with no regulatory floodway limits.
Yes
1The enhancement of these programs in editing and graphical presentation can be obtained from several private companies. 2Program is typically distributed by vendors and may not be available through HEC. A list of vendors may be obtained through HEC.

BASIN-LEVEL DIGITAL ELEVATION MODELS
72

BASIN-LEVEL DIGITAL ELEVATION MODELS
73
APPENDIX 3: SUMMARY OF U.S. LiDAR COLLECTS IN THE RED RIVER BASIN
1. Southern Cass County, North Dakota and Clay County, Minnesota: LiDAR and black and white imagery were acquired for a 138 square mile area in southern Cass County, North Dakota and Clay County, Minnesota, for use in a FEMA funded Flood Insurance Restudy for the Red River of the North, Wild Rice River (ND), and Wolverton Creek. Houston Engineering, Inc. contracted with Horizons, Inc. to acquire the data. The City of Fargo, Cass County, North Dakota State Water Commission, Buffalo-Red River Watershed District, and Clay County provided funding for the project. The data was collected during two flight operations in April 1999. The first flight operation was conducted to obtain black and white aerial photography for planimetric mapping and orthophoto production. The second flight operation was conducted to obtain the LiDAR data. Final deliverables included LiDAR bare-earth x,y,z ASCII files, break lines, 1-foot contour drawings in AutoCAD format, and black and white digital orthophotos. There are no restrictions on data distribution for his project. 2. City of Fargo Mapping: LIDAR and digital imagery (color) were acquired for a 164.5 square mile area including the cities of Fargo, North Dakota and Moorhead, Minnesota. The data was obtained for use in updating the existing hydraulic model for the Red River through Fargo-Moorhead and for floodplain mapping for the City of Fargo. Houston Engineering, Inc. contracted with Merrick & Co. to acquire the data. FEMA Region VIII under the Cooperating Technical Partners (CTP) Program provided a portion of the funding for the project. Additional funding was provided by the City of Fargo and other state and local entities. The data was collected during a single flight operation in May 2002. Final deliverables included LIDAR bare-earth x,y,z ASCII files, break lines, 1-foot contour drawings in AutoCAD format, and color digital orthophotos. There are no restrictions on data distribution for this project. 3. FM COG Imagery Collection: This project was an extension of the City of Fargo Mapping project and included the acquisition of additional color imagery for an approximately 86 square mile area for the Fargo-Moorhead Council of Government (FM COG). The imagery was acquired by Merrick and Co. during the same flight as the LiDAR acquisition. The data was collected during a single flight operation in May 2002. Final deliverables included color digital orthophotos and bare earth LiDAR bare-earth x,y,z binary files. No

BASIN-LEVEL DIGITAL ELEVATION MODELS
74
contours or break lines were generated for this area. There are no restrictions on data distribution for this project. 4. Sheyenne River FIS: LIDAR and black and white imagery were acquired for a 74 square mile area in southern Cass County, North Dakota, for use in a FEMA funded Flood Insurance Study for the Sheyenne River and breakout corridors. Pacific International Engineering, contracted with Horizons, Inc. to acquire the data. FEMA Region VIII provided funding for the project. The data was collected during two flight operations in the spring of 2002. The first flight operation was conducted to obtain black and white aerial photography for planimetric mapping and orthophoto production. The second flight operation was conducted to obtain the LiDAR data. Final deliverables included LiDAR bare-earth x,y,z ASCII files, break lines, 1-foot contour drawings in AutoCAD format, and black and white digital orthophotos. There are no restrictions on data distribution for his project. 5. Clay County CTP Mapping: LiDAR and black and white imagery were acquired for an 86 square mile area in southwest Clay County, Minnesota, for use in a Flood Insurance Study for the Buffalo River. Clay County contracted with Horizons, Inc. to acquire the data. FEMA Region V through the Cooperating Technical Partners (CTP) Program provided funding for the project. The data was collected during two flight operations. The first flight operation was conducted in November 2002 to obtain the LiDAR data. The second flight operation was conducted in December 2002 to obtain black and white aerial photography for planimetric mapping and orthophoto production. Final deliverables included LIDAR bare-earth x,y,z ASCII files, break lines, 1-foot contour drawings in AutoCAD format, and black and white digital orthophotos. There are no restrictions on data distribution for his project. 6. Manston Water Management Area Mapping: LIDAR and black and white imagery were acquired for an approximately 16.5 square mile area in north central Wilkin County, Minnesota, for use in analyzing water retention and wetland restoration scenarios on the Manston Water Management Area (WMA). Houston Engineering, Inc. contracted with Horizons, Inc. to acquire the data. The Buffalo-Red River Watershed District, Minnesota Department of Natural Resources, U.S. Fish and Wildlife Service, and Ducks Unlimited provided funding for the project. The data was collected during two flight operations in the spring of 2002. The first flight operation was conducted to obtain black and white aerial photography for planimetric mapping and orthophoto production. The second flight operation was conducted to

BASIN-LEVEL DIGITAL ELEVATION MODELS
75
obtain the LiDAR data. Final deliverables included LiDAR bare-earth x,y,z ASCII files, break lines, 1-foot contour drawings in AutoCAD format, and black and white digital orthophotos. There are no restrictions on data distribution for his project. 7. Wild Rice River Feasibility Study LiDAR Project: LiDAR and black and white imagery were acquired for an approximately 81 square mile area in the Wild Rice River Watershed District, for use in hydraulic modeling and analyzing flood reduction alternatives for the Wild Rice River. Houston Engineering, Inc. contracted with Horizons, Inc. to acquire the data. The St. Paul District, U.S. Army Corps of Engineers, Wild Rice River Watershed District, and Red River Watershed Management Board provided project funding. The data was collected during two flight operations in the spring of 2002. The first flight operation was conducted to obtain black and white aerial photography for planimetric mapping and orthophoto production. The second flight operation was conducted to obtain the LIDAR data. Final deliverables included LIDAR bare-earth x,y,z ASCII files, break lines, 1-foot contour drawings in AutoCAD format, and black and white digital orthophotos. There are no restrictions on data distribution for his project. 8. Wahpeton, ND/Breckenridge, MN LiDAR Survey: LIDAR and black and white imagery were acquired for an approximately 39.5 square mile area to develop a topographic surface model of the Wahpeton/Breckenridge project area for Emergency Operations/Flood Control. The Cities of Wahpeton and Breckenridge contracted with EagleScan Inc. (3DI) to acquire the data. The data was collected in May 1998. Final deliverables included LiDAR bare-earth x,y,z ASCII files (Note: St. Paul District does not have the ‘bare-earth’ DEM of this data), 2-foot contour drawings in AutoCAD format, and black and white digital orthophotos. EagleScan retains ownership of the data. 9. Pembina River, North Dakota LiDAR Survey: LiDAR was acquired for an approximately 60.5 square mile area as part of a Red River Pilot study to evaluate remote sensing technologies for topographic mapping. The St. Paul District, U.S. Army Corps of Engineers provided funds to the Topographic Engineering Center who contracted with EarthData, Inc. to acquire the data. Funding for the project was provided through General Investigation appropriations to the St. Paul District, Corps of Engineers. The data was collected in June 1999 and May 2000. Final deliverables include pre-processed and bare-earth x,y,z ASCII files, and 3-meter bare-earth DEM. There are no restrictions on data distribution for this project. The data has many deficiencies associated with collection and post-processing which the contractor was unable to resolve.

BASIN-LEVEL DIGITAL ELEVATION MODELS
76
10. Sheyenne River Corridor LiDAR Survey: LiDAR was acquired for an approximately 360 square mile area along the Sheyenne River, from where the Sheyenne River and Peterson Coulee meet in Benson County to the confluence of the Sheyenne River and Red River of the North. The LiDAR was acquired to provide a high-resolution digital elevation model along the Sheyenne River. The data was used to generate contours for use in hydraulic/hydrologic model development and for assessing environmental impacts. The St. Louis District, U.S. Army Corps of Engineers contracted with 3001, Inc. to acquire the data. Funding for the project was provided by USACE - Devils Lake, ND Project. The data was acquired in November 2000. Final deliverables include pre-processed and bare-earth x,y,z ASCII files, pre-processed and bare-earth DEMs with 5-meter grid spacing, and break lines. There are no restrictions on data distribution for this project. 11. Devils Lake, North Dakota 2001 LiDAR Mosaic: LiDAR was acquired for an approximately 782 square mile area in the Devils Lake Basin to support project planning and engineering applications for flood mitigation. FEMA contracted with TerraPoint, Inc. to acquire the data. Funding for the project was provided by FEMA. The data was acquired in November 2000. The St. Paul District - Army Corps of Engineers has 1-foot contours, 5-meter (quarter-quad) integer grids, and an in-house developed grid mosaic. There are no restrictions on data distribution for this project. The data has many deficiencies associated with collection and post-processing. 12. Canadian LiDAR Collects: The detailed information about these LIDAR collects is currently not known. For more information please contact: Lindsay Donnelly GIS Specialist Manitoba Conservation 200 Saulteaux Cres. WINNIPEG, Manitoba R3J 3W3 Phone: 204-945-5526 Email: [email protected] 13. LiDAR Data for Roseau County Minnesota: This project consists of approximately 87 square miles of LiDAR mapping in Roseau County, Minnesota at two sites: area 1, near Roseau, consists of 32,300 acres and area 2, near Warroad, consists of 23,100 acres. The St. Paul District - US Army Corps of

BASIN-LEVEL DIGITAL ELEVATION MODELS
77
Engineers contracted with ULTEIG Engineers, Inc. (Primary) and 3Di, Inc. to acquire the data. Funding was provided under authority of Section 22 - Planning Assistance to States in an agreement with the State of Minnesota. LiDAR data acquisition was successfully completed in three flights, November 5, 6, and 7, 2002. Final deliverables include pre-processed and bare-earth x,y,z ASCII files, pre-processed and bare-earth DEMs with 2-meter grid spacing, and break lines. The processed bare-earth DEM has no distribution restrictions. 14. LiIDAR Data for the Maple River: The Maple River collection is approximately 91.85 square miles and is scheduled to be collected in the fall of 2003. 15. LiDAR Data for the South Branch Buffalo River: The South Branch Buffalo River collection near Sabin is approximately 10-15 square miles. The collection is scheduled to take place in the fall of 2003.

BASIN-LEVEL DIGITAL ELEVATION MODELS
78

BASIN-LEVEL DIGITAL ELEVATION MODELS
79
APPENDIX 4: RELEVANT WEBSITES
Danish Hydraulic Institute http://www.dhi.dk/ EROS Data Center http://edc.usgs.gov/ Greenway on the Red http://www.riverwatchonline.org/greenway/ Hydrologic Engineering Center https://cwms.hec.usace.army.mil/hec-coe/public_website/default.html International Joint Commission http://www.ijc.org/ LIDAR Tutorial (NASA) http://www.ghcc.msfc.nasa.gov/sparcle/sparcle_tutorial.html Living with the Red (IJC Report) http://www.ijc.org/php/publications/html/living.html Map Modernization Program http://www.fema.gov/fhm/mm_main.shtm National Flood Insurance Program (NFIP) http://www.fema.gov/nfip/ Red River Basin Commission http://www.redriverbasincommission.org/ Red River Basin Decision Information Network http://www.rrbdin.org/ Red River Basin Institute http://www.tri-college.org/watershed/ Shuttle Radar Topography Mission http://www.jpl.nasa.gov/srtm/

BASIN-LEVEL DIGITAL ELEVATION MODELS
80

BASIN-LEVEL DIGITAL ELEVATION MODELS
81
APPENDIX 5: ABBREVIATIONS AND ACRONYMS CTP Cooperating Technical Partners CTTP Cooperative Technical Partnership Program DEM Digital Elevation Model DFIRM Digital Flood Insurance Rate Map DGPS Differential Global Positioning Satellite DHI Danish Hydraulic Institute DLG Digital Line Graphs DNR Department of Natural Resources DTD Digital Terrain Data DTM Digital Topographic Map EERC Energy and Environmental Research Center ERDC Engineering Research and Development Center ESRI Environmental Systems Research Institute FEMA Federal Emergency Management Agency FTP File Transfer Protocol GIS Geographic Information System GPS Global Positioning Satellite H&H Hydrologic and Hydraulic HEC Hydrologic Engineering Center IFMI International Flood Mitigation Initiative IFSAR Interferometric Synthetic Aperture Radar IJC International Joint Commission IRRBTF International Red River Basin Task Force IWR Institute for Water Resources LiDAR Light Detection and Ranging MMP Map Modernization Program NASA National Aeronautics and Space Administration NED National Elevation Data NFIP National Flood Insurance Program NIMA National Imagery and Mapping Agency RDBMS Relational Data Base Management System RRBB Red River Basin Board RRBDIN Red River Basin Decision Information Network RRBI Red River Basin Institute RRBC Red River Basin Commission SBIR Small Business Innovative Research SRTM Shuttle Radar Topography Mission TEC Topographic Engineering Center TIN Triangulated Irregular Network USACE United States Army Corps of Engineers USGS United States Geological Survey WRDA Water Resources Development Act

BASIN-LEVEL DIGITAL ELEVATION MODELS
82