application of high-resolution (10 m) dem on flood ... · application of high-resolution (10 m) ......
TRANSCRIPT

Application of high-resolution (10 m) DEM on Flood Disaster in 3D-GIS
M. Mori Department of Information and Computer Science, Kinki University, Japan
Abstract
Over the two-day period of 19–20 July, 2003, the Kyushu area of Japan was hit with heavy rainfall, causing many kinds of disasters in various areas. A total of 1,352 houses were flooded in Fukuoka City when the Mikasa River overflowed its banks. For our research, the flooded area was estimated by a three-dimensional (3D) Geographic Information Systems (GIS).
A high-resolution Digital Elevation Model (DEM) (10 m meshed grid) has been integrated with GIS so as to construct a 3D GIS model in the region around the Mikasa River Basin. An area of 10 m DEM has been developed by a commercial company, which offers up to 0.1 m resolution in a vertical direction, and also covers the entire country of Japan. Resolution in the vertical direction is sufficient for construction of our model. The three-dimensional buildings database in Fukuoka City is used to construct the model, which includes 3D structure.
The flooded area is estimated with great precision based on 10 m DEM according to water levels from 3.6 m to 5.0 m of the Mikasa River. Three-dimensional views of the flooded area were obtained from several view angles by this system. Keywords: flood, 3D GIS, Digital Elevation Model, 3D view, remote sensing, DEM/DTM, high resolution, graphics.
1 Introduction
The heavy rainfall occurred in Fukuoka Prefecture, Japan, on July 19, 2003 [1]. Maximum hourly and accumulated rainfalls were recorded at approximately 90 mm/h and 320 mm. As a result of the storms, the Mikasa River overflowed its
Risk Analysis V: Simulation and Hazard Mitigation 263
www.witpress.com, ISSN 1743-3541 (on-line)
© 2006 WIT PressWIT Transactions on Ecology and the Environment, Vol 91,
doi:10.2495/RISK060251

banks, and the floodwaters moved down the roads to the Hakata railway station. In Fukuoka City, 1,352 houses were flooded, and many office buildings and the Hakata subway station were inundated with muddy water. The Mikasa River also overflowed in June 1999, leaving one resident dead in an inundated basement [2]. Figure 1 shows the flooded area around the Mikasa River Basin in 1999, in which the Hakata railway station is located at the center in the figure. The flooded area forms the shape of a polygon due to the topographic discontinuity of roads, railways, channels etc.
Figure 1: The flooded area around the Mikasa River Basin in 1999.
It is quite important to generate a three-dimensional topographic map to enable flood risk assessment of damages.
Geographic Information Systems (GIS) has become an effective tool for analyzing flood disasters, especially for three-dimensional (3D) analysis. 3D GIS requires Digital Elevation Model (DEM) for analysis, which can construct a surface model around flood disaster. Also, a three-dimensional (3D) buildings database is necessary to generate Digital Terrain Model (DTM) to DEM. A 3D buildings database around the Mikasa River Basin is provided by the Fukuoka City Office. The flooded area is estimated extremely precisely based on DTM according to water levels from 3.6 m to 5.0 m of the Mikasa River.
For this research report, ArcGIS 8.2 (ESRI) is mainly used as a GIS analysis system for PC Windows.
264 Risk Analysis V: Simulation and Hazard Mitigation
www.witpress.com, ISSN 1743-3541 (on-line)
© 2006 WIT PressWIT Transactions on Ecology and the Environment, Vol 91,

2 Digital Elevation Model in Japan
2.1 50 m DEM
50 m-meshed DEM by the Geological Survey of Japan (GSJ) is widely used for various GIS applications such as constructing 3D systems to create three-dimensional representations of the land in Japan, with 50 m DEM covering the entire country. The pixels stand at 16 bit levels, which correspond to 0.1 m resolution in a vertical direction. 50 m DEM data are available at very low cost. The spatial resolution of 50 m DEM is, however, insufficient for the precise requirements of cartographic designers, developers, and civil engineers.
In the United State, the National Elevation Dataset (NED) is available through the U.S. Geological Survey. NED has a resolution of one arc-second (approximately 30 m) for the conterminous United States. Although this data is extremely useful for 3D GIS analysis, 30 m resolution is insufficient for precise analysis.
2.2 10 m DEM
Recently, a commercial company (Hokkaido Chizu [3]) has developed high-resolution DEM for up to 10 m horizontal meshed model with 0.1 m resolution in a vertical direction, which also covers the entire country of Japan. 10 m DEM is quite effective for various applications of GIS. A unit file of 10 m DEM in 1000 pixels by 1000 lines corresponds exactly to one unit of 50 m DEM, which is the second meshed code by the GSJ standard.
A comparison of the difference between 50 m DEM and 10 m DEM is shown in Figure 2. Figure 2(a) shows a color coded 3D visualization of 50 m DEM, and Figure 2(b) shows one of 10 m DEM. The difference in spatial resolutions is very clear. The spatial resolution of 10 m DEM is comparable to 4 m of multispectral IKONOS imagery.
(a) 50 m (b) 10 m
Figure 2: A comparison of the difference between DEMs.
Recently, an airborne laser scanning system was used for generating DEM with high resolution. The sensor is able to measure distances between the sensor and
Risk Analysis V: Simulation and Hazard Mitigation 265
www.witpress.com, ISSN 1743-3541 (on-line)
© 2006 WIT PressWIT Transactions on Ecology and the Environment, Vol 91,

the ground surface. However, it is quite difficult to obtain accurate topographic data with this kind of laser profiling in urban area due to the significant impact of laser beam reflections on walls of high-buildings. This indicates that data collected by airborne laser scanning is generally not stable for generating DEM in urban areas.
Figure 3: An aerial photo image around the Mikasa River.
3 Integration of DEM and buildings database with 3D GIS
Figure 3 shows an aerial photo image around the Mikasa River Basin including the Hakata Station in Fukuoka City, which is integrated with the GIS system after geometric corrections. The pixel size of the image is 50 cm square. This image is in a basic scheme for GIS analysis.
3.1 Integration of 10 m DEM
There are two ways to integrate 10 m DEM with a digital map. The first is to integrate 10 m DEM in a shape-file format, the format of which is basically a vector type, so it is easy to perform. Integration from a shape file is suitable for visualizing a 3D image using TIN (Triangulated Irregular Network) as a global surface model. Although the triangulated network is highly dense in areas with high undulation of land surface, it is not dense in areas with low undulation.
The other method is to use a raster data format as original Tiff file. This method is direct processing of all points, which assesses each point. When processing from raster data, elevation data is given even in plane areas. However, processing time in raster data is much larger than that using TIN.
266 Risk Analysis V: Simulation and Hazard Mitigation
www.witpress.com, ISSN 1743-3541 (on-line)
© 2006 WIT PressWIT Transactions on Ecology and the Environment, Vol 91,

Figure 4: A 3D view with buildings around the Hakata Station.
3.2 Integration of buildings database
Secondly, the buildings database is integrated with the GIS system. The three-dimensional buildings database consists of 2D polygon data, height, usage, update-time, quality of the material, and so on, which are provided by the Fukuoka City Office. That database file is a standard shape-file format, but it is originally in 2D structure, so we must transform 2D structure to 3D. The 3D buildings database is one of the next generation projects of Fukuoka City. We have reconstructed the 3D structure of the buildings database using 2D polygon data and height data on GIS. Buildings are assumed to have planar roof surface for purposes of simplicity.
A 3D view with buildings around the Hakata Station is shown in Figure 4, in which the Mikasa River is shown at right. Every building is reconstructed, whether small or large, and each building is color coded depending on its usage, such as commercial, business office, public service, residential and so on.
4 Estimate of flooded area
4.1 Contour lines
Contour lines are generated using by 10 m DEM data in GIS system so as to estimate flooded areas. Generated contour lines in intervals of 20 cm are shown in Figure 5. The ground surface around the river is seen very clearly from the contour lines. However, a portion of roads seems not to coincide with contour lines due to the topographic discontinuities. It is quite difficult to take these roads and railways into account in generating DEM precisely.
Risk Analysis V: Simulation and Hazard Mitigation 267
www.witpress.com, ISSN 1743-3541 (on-line)
© 2006 WIT PressWIT Transactions on Ecology and the Environment, Vol 91,

Figure 5: Generated contour lines in intervals of 20 cm.
4.2 Flooded areas
According to the previous research [1], the highest water level at the left-side bank of the Mikasa River that overflowed was 5.3 m on June 29, 1999. The flood inundation had continued around the Mikasa River Basin from 9:00 to 15:00 on 29th, at which time the damage to the subway entrance hall and hotel basement floors was quite serious. The flooded area is estimated precisely based to water levels from 3.6 m to 5.0 m. We show an estimated flooded area with water level of 5.0 m in Figure 6. Several parts of the estimated area are different from the flooded area.
Figure 6: An estimated flooded area with water level of 5.0 m.
268 Risk Analysis V: Simulation and Hazard Mitigation
www.witpress.com, ISSN 1743-3541 (on-line)
© 2006 WIT PressWIT Transactions on Ecology and the Environment, Vol 91,
Firstly, the difference between them is quite large in the right side of the Mikasa River, where flood inundation was not observed. The reason for this is that the right side bank of the river is higher than the left side, and the right side bank was not broken at that time. However, it is quite difficult to take into account factors such the narrow bank in generating contour lines. Secondly, flood inundation was not observed in the south side area of Chikushi Street, but the estimated flood area contains this area. The Chikushi Street is one of the major wide streets in Fukuoka City.
4.3 3D simulation imaging
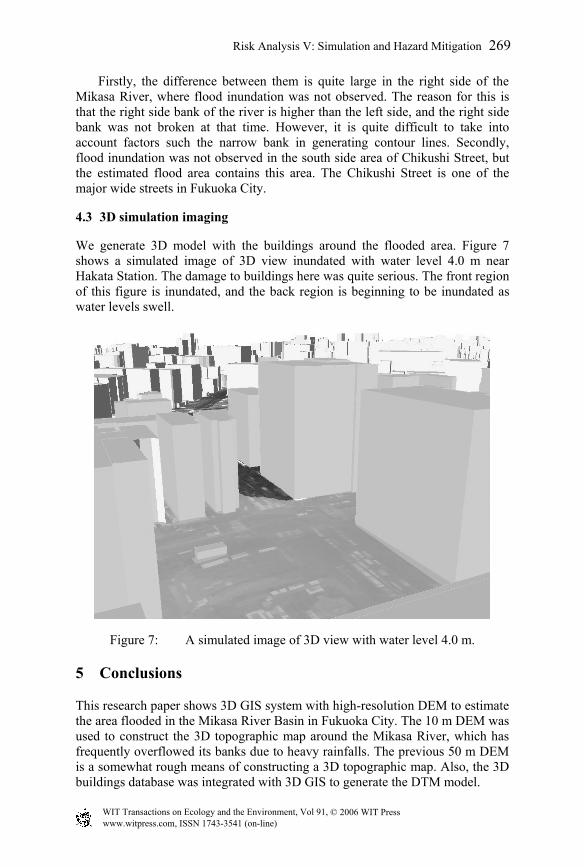
We generate 3D model with the buildings around the flooded area. Figure 7 shows a simulated image of 3D view inundated with water level 4.0 m near Hakata Station. The damage to buildings here was quite serious. The front region of this figure is inundated, and the back region is beginning to be inundated as water levels swell.
Figure 7: A simulated image of 3D view with water level 4.0 m.
5 Conclusions
This research paper shows 3D GIS system with high-resolution DEM to estimate the area flooded in the Mikasa River Basin in Fukuoka City. The 10 m DEM was used to construct the 3D topographic map around the Mikasa River, which has frequently overflowed its banks due to heavy rainfalls. The previous 50 m DEM is a somewhat rough means of constructing a 3D topographic map. Also, the 3D buildings database was integrated with 3D GIS to generate the DTM model.
Risk Analysis V: Simulation and Hazard Mitigation 269
www.witpress.com, ISSN 1743-3541 (on-line)
© 2006 WIT PressWIT Transactions on Ecology and the Environment, Vol 91,

The flooded area around the Mikasa River including the buildings model was estimated precisely at water levels ranging from 3.6 m to 5.0 m above the Mikasa River. The flooded area was compared with previous incidents such as that occurring in 1999. The estimated area did not coincide with the flooded area partially because of topographic discontinuities, which are caused by roads, railways, and narrow riverbanks.
Acknowledgements
The present work was partially supported by Mr. I. Komatsu, and also by the Grant-in-Aid for Scientific Research (C) No.16510141 from of the Ministry of Education, Science and Culture of Japan.
References
[1] Hashimoto, H., Park, K., and Watanabe, M., Overland flood flow around the JR Hakata-eki Station from the Misaka and Sanno-Channel River in Fukuoka City on June 29, 1999. Journal of Japan Society for Natural Disaster Science, Vol.21, No.4, pp.369-384, 2003.
[2] Ushiyama, M., Characteristics of heavy rainfall disaster in Kyushu district from July 19 to 21, 2003. Journal of Japan Society for Natural Disaster Science, Vol.22, No.4, pp.373-385, 2004.
[3] Hokkaido Chizu Co. http://www.hcc.co.jp/index.html.
270 Risk Analysis V: Simulation and Hazard Mitigation
www.witpress.com, ISSN 1743-3541 (on-line)
© 2006 WIT PressWIT Transactions on Ecology and the Environment, Vol 91,