aligning climate change mitigation and agricultural ... · aligning climate change mitigation . and...
TRANSCRIPT

Policy Research Working Paper 6080
Aligning Climate Change Mitigation and Agricultural Policies
in Eastern Europe and Central AsiaDonald F. Larson
Ariel Dinar Brian Blankespoor
The World BankDevelopment Research GroupAgriculture and Rural Development TeamJune 2012
WPS6080P
ublic
Dis
clos
ure
Aut
horiz
edP
ublic
Dis
clos
ure
Aut
horiz
edP
ublic
Dis
clos
ure
Aut
horiz
edP
ublic
Dis
clos
ure
Aut
horiz
edP
ublic
Dis
clos
ure
Aut
horiz
edP
ublic
Dis
clos
ure
Aut
horiz
edP
ublic
Dis
clos
ure
Aut
horiz
edP
ublic
Dis
clos
ure
Aut
horiz
ed

Produced by the Research Support Team
Abstract
The Policy Research Working Paper Series disseminates the findings of work in progress to encourage the exchange of ideas about development issues. An objective of the series is to get the findings out quickly, even if the presentations are less than fully polished. The papers carry the names of the authors and should be cited accordingly. The findings, interpretations, and conclusions expressed in this paper are entirely those of the authors. They do not necessarily represent the views of the International Bank for Reconstruction and Development/World Bank and its affiliated organizations, or those of the Executive Directors of the World Bank or the governments they represent.
Policy Research Working Paper 6080
Greenhouse gas emissions are largely determined by how energy is created and used, and policies designed to encourage mitigation efforts reflect this reality. However, an unintended consequence of an energy-focused strategy is that the set of policy instruments needed to tap mitigation opportunities in agriculture is incomplete. In particular, market-linked incentives to achieve mitigation targets are disconnected from efforts to better manage carbon sequestered in agricultural land. This is especially important for many countries in Eastern Europe and Central Asia where once-productive land has been degraded through poor agricultural practices. Often good agricultural policies and prudent natural resource management can
This paper is a product of the Agriculture and Rural Development Team, Development Research Group. It is part of a larger effort by the World Bank to provide open access to its research and make a contribution to development policy discussions around the world. Policy Research Working Papers are also posted on the Web at http://econ.worldbank.org. The author may be contacted at [email protected].
compensate for missing links to mitigation incentives, but only partially. At the same time, two international project-based programs, Joint Implementation and the Clean Development Mechanism, have been used to finance other types of agricultural mitigation efforts worldwide. Even so, a review of projects suggests that few countries in Eastern Europe and Central Asia take full advantage of these financing paths. This paper discusses mitigation opportunities in the region, the reach of current mitigation incentives, and missed mitigation opportunities in agriculture. The paper concludes with a discussion of alternative policies designed to jointly promote mitigation and co-benefits for agriculture and the environment.

Aligning climate change mitigation and agricultural policies in Eastern Europe and Central Asia
Donald F. Larson, Ariel Dinar and Brian Blankespoor
The authors would like to thank Polly Means for creatively improving the graphic figures, Uwe Deichmann
for providing helpful comments on earlier drafts, and also Gregorz Peszko and Janina Ketterer, and
Emanuele Massetti for providing the authors with detailed results from their respective contributions to ―The
Low Carbon Transition‖ (EBRD, 2011). The paper received support from the Chief Economist‘s Office of
the Europe and Central Asia Region of the World Bank.
Keywords: Agriculture, climate change, degraded land, greenhouse gases, mitigation, soil carbon sequestration.
JEL classification: F53, Q18, Q24, Q54, Q58.
Sector Board: Agriculture and Rural Development
Donald F. Larson and Brian Blankespoor, Development Research Group, World Bank; and Ariel Dinar, Department of Environmental Sciences, University of California, Riverside.

2
Aligning climate change mitigation and agricultural policies in Eastern Europe and Central Asia
Donald F. Larson, Ariel Dinar and Brian Blankespoor
I. Introduction
Greenhouse gas emissions are primarily determined by how energy is created and used. Necessarily, policies
to slow climate change focus on this dominant source. However, discussions centered on the energy sector
frame policy tradeoffs in general terms that can obscure differences among sectors and can lead to policy
instruments that do not suit significant but less dominant sectors. This is especially true for agriculture where
complementary relationships among mitigation activities, agricultural productivity, climate resiliency and
resource management are key. Specifically, mitigation activities in the agricultural sector often generate co-
benefits of various kinds. Sometimes, the mitigation benefits of the activity dominate and general climate
change instruments work well. Often however, large co-benefits are associated with mitigation activities and
when this is the case, general climate change instruments by themselves may be insufficient for good policy.
An example of this dichotomous set of policy outcomes is found in the types of projects that emerged from
the two Kyoto project investment mechanisms, Joint Implementation (JI) and the Clean Development
Mechanism (CDM). As we explore in this paper, the twin mechanisms have proven effective in mobilizing
private investment in mitigation activities in general and have worked well for certain types of bio-energy
projects in the agricultural sector. In contrast, other mitigation activities, especially those related to how land
is used, are poorly suited for the program and largely absent. This matters since there is abundant potential
for both types of mitigation projects worldwide and especially in Eastern Europe and Central Asia (ECA).
A related consequence of a climate change policy debate centered on energy has to do with real and perceived
tradeoffs. Because changing the way energy is produced and used is costly, economic growth and climate
polices are linked as competing objectives, and comparisons of policy instruments are cast in terms of lost
growth. 1 This characterization obscures areas where tradeoffs are not stark and can encourage entrenched
positions that preclude progress on any front.
While policies designed to tap significant mitigation and adaptation opportunities in agriculture fit uneasily
within a general policy framework for climate change, components of a good agricultural policy framework
often contribute to mitigation and adaptation objectives, even when such objectives are not a policy priority.
For example, promoting institutions that secure land rights can help promote sustainable land management
practices and investing in agricultural research can boost land productivity. Both are key components of a
sound agricultural policy since they can help improve the livelihoods of the rural poor and help protect
valuable core environmental resources. Both also work to boost the sequestration of carbon in soils and
forests and help improve the reliance of the agricultural sector to forecasted changes in climate. Still, even
when policy makers actively promote these types of actions within agricultural policy, incentives to fully
pursue such activities will be of a second-best nature and likely fail to elicit the scale of investment that a full
accounting of benefits would bring.
1 For example, a recent report, the European Bank for Reconstruction and Development (EBRD 2011, p27) estimates that achieving a goal of 500-550 ppm CO2e would reduce the GDP of ECA economies by about 5.7 percent for the period 2010-2050, compared to a business-as-usual counterfactual. The estimated costs are higher for the transitional economies of ECA at about 8.3 percent for oil-exporters and about 6.2 percent for the non-oil exporters.

3
As we discuss later in the paper, much scope remains to extend the reach of the current climate change policy
framework – especially in promoting CDM and JI investments. In addition, there are areas where improved
agricultural policies and resource management policies could promote mitigation and adaptation objectives,
especially in the area of land rights and land management. And there are old and new sources of financing
that could be tapped to devise domestic policies and activities that jointly pursue mitigation, adaption and
agricultural productivity goals. Even so, there is also scope for parties to the UNFCCC to take action that
recognizes the special features of the agricultural sector and remedies shortcomings the in the current
agreement.
The remainder of the paper is organized as follows. In the next section we examine sources of greenhouse gas
emissions in the ECA region and the world. Section III looks at mitigation opportunities in the region.
Section IV examines the policy environment that shapes decisions about which mitigation opportunities in
agriculture are tapped and examines project investment outcomes. Section V looks at how policies, project
characteristics and markets work to favor some types of investments over others. Section VI discusses the set
of ancillary benefits that come with land-use mitigation activities. Section VII describes the potential for
finding complementary climate change and resource management policies to promote two complementary
sets of mitigation activities in agriculture. A final section concludes.
II. Sources of greenhouse gas emissions
The ECA region is a significant emitter of greenhouse gases, with combined emissions in excess of 4 billion
tons CO2 equivalent (GtCO2e) in 2005, or roughly 12 percent of global emissions, according to estimates
from the World Resource Institute (WRI 2011). This is comparable to the emissions from Western Europe
for the period and greater than the emissions from Latin America (table 1.) Emissions are relatively high on a
per capita basis as well, averaging about 9.6 tons CO2e (tCO2e) per capita in 2005. This is well below the US-
Canadian average of 23.3 tons, but well above the Latin American per capita average of 5.4 tons. Emissions
fell sharply as the economies of ECA restructured following the dissolution of the Soviet Union from 14
tCO2e per capita in 1990 to 9.1 tCO2e per capita in 2000, only to climb slightly from 2000 to 2005.
As with most regions, the energy sector accounts for most of the region‘s emissions – about 85 percent in
2005. In this respect, the sector composition of emissions is similar to Western Europe. Agriculture accounts
for 16 percent of global emissions, although this accounting excludes net changes to sequestered carbon due
to land-use – a topic to which we return later. Within the ECA region, agriculture‘s role is smaller and
accounts for about 9 percent, a share similar to agriculture‘s 10 percent share in Western Europe (figure 1).
Most ECA emissions (74 percent) are in the form of carbon dioxide (figure 2). At around 20 percent,
methane‘s share of emissions in ECA is more than twice as high as its share in Western Europe and about
two-thirds of the gas‘ share of emissions in Latin America. Though the overall level of emissions has changed
significantly since 1990, the aggregate composition of emissions by sector and gas have remained broadly
constant over time, as has been the case with global emissions in general (table 2).
The countries in the ECA region comprise a set of highly diverse economies, which is reflected in the scale of
emissions for the countries (table 3). Measured in the aggregate, emissions from the Russian Federation dwarf
those from other countries in the region. However, a different picture emerges once the emissions are scaled
by population (table 4). Per capita emissions are similar in Turkmenistan, Estonia, the Czech Republic, the
Russian Federation and Kazakhstan. The figure and graphs also show how differences in the relative
emission-intensity of the countries over time, with per capita emissions falling rapidly in many ECA
countries.
Because a few countries produce most of the region‘s greenhouse gas emissions, regional averages mask a
greater variation in the composition of emission sources at the country level and differences in how emissions

4
have changed over time. In general, sectors other than energy and gases other than CO2 are less important
sources of emissions. However, in some countries emissions from agriculture are an important source of total
emissions and this affects the composition of greenhouse gases by type of gas.
More than half of the methane and more than 80 percent of the nitrous oxide released into the atmosphere
by human activities originate in agriculture. Both are potent greenhouse gases, with a ton of methane
equivalent to 23 tons of carbon dioxide and a ton of nitrous oxide equivalent to 296 tons of carbon dioxide in
the short run. Consequently some types of agricultural activities, especially those related to how manure and
other agricultural wastes are managed, have a disproportionate effect on aggregate greenhouse gas emissions
from the sector. Consequently agriculture is a significant contributor to GHG emissions in places like
Albania, Georgia and Tajikistan, where methane and nitrous oxide emissions are relatively high. (See table 5.)
A key characteristic of the region has been the structural realignment of the region‘s economies. This is
reflected in the changing composition of emissions by sector and by the type of gases emitted. Figure 3 shows
the relationship between agricultural income, methane and nitrous oxide. Figures 4 and 5 show how the
composition of emissions changed between 1990 and 2005. Figure 4 shows the percentage change by country
by type of gas and figure 5 shows the same type of information by emitting sector.2 The two are related. For
example, figure 4 shows that carbon dioxide emissions fell by nearly 50 percent in Albania while methane and
nitrous oxide emissions rose. Figure 5 shows that emissions from the energy fell significantly – a sector that
mostly emits CO2 – while emissions from agriculture – a sector that produces significant quantities of
methane and nitrous oxide emissions – grew.
III. Mitigation opportunities3
In this section we examine potential mitigation opportunities for agriculture in the ECA region. Broadly,
mitigation potential is an economic concept associated with the cost of sequestering greenhouse gases or
avoiding greenhouse gas emissions. It is a key feature of mitigation assessments, including those produced by
the Intergovernmental Panel on Climate Change (IPCC)4. Mitigation opportunities are calculated against a
counter-factual scenario, usually a forward-looking projection based on a continuation of existing practices
and policies. The assessments often rely on models built up from estimates of the costs of deploying different
production technologies, shifting consumer preferences, and encouraging activities that permanently store
greenhouse gases. Typically, this results in a schedule, called a marginal abatement cost (MAC) curve, that
relates feasible mitigation opportunities with a range of ―carbon prices,‖ where the prices of carbon indicates
a value that would cover the investment and other costs associated with marginal reductions in emissions vis-
à-vis a baseline counter-factual.
In 2007 the IPCC reviewed projections across a range of modeling efforts to assess potential sources of
mitigation by sector (Barker et al., 2007). Table 6 summarizes the report‘s assessment of mitigation
opportunities at US$20 per tCO2e.5 The assessment reports that global mitigation opportunities are greatest
in the building, industry and agricultural sectors. Moreover, the report concludes that most energy-saving
efforts in the building sector are ―win-win‖ opportunities – that is, investments related to the identified
improving energy efficiencies in buildings would be profitable without additional carbon payments. Because
2 Gases of all types are expressed in terms of CO2 equivalents. 3 This section draws partly on material published in Larson, Dinar and Aapris (2011). 4 The IPCC is a scientific body, established by the United Nations Environment Program and the World Meteorological Organization, to develop an expert view about the causes and consequences of climate change. 5 By convention, measures of greenhouse gas emissions cover the six Kyoto Protocol gases: carbon dioxide (CO2), methane (CH4), nitrous oxide (N2O), hydrofluorocarbons (HFCs), perfluorocarbons (PFCs), and sulfur hexafluoride (SF6). Aggregate emission and mitigation amounts are expressed in terms of CO2e, the amount of CO2 needed to produce the same global warming potential.

5
―win-win‖ projects are ineligible under most domestic and international payment-based mitigation programs,
this suggests that the agricultural sector should feature prominently under policy regimes that encourage
payments for mitigation efforts. As we discuss later, this is not the case.
As the agricultural chapter of the IPCC report makes clear, the consensus estimate of 1.6 GtCO2e in
mitigation potential is based on models in which the agricultural sector is narrowly defined, focusing on on-
farm activities primarily involving crops and livestock and the handling of animal wastes (Smith et al., 2007).
As a consequence, additional opportunities linked to the use of organic agricultural wastes, such as bagasse or
rice husks, as a renewable fuel are not counted toward reported mitigation potentials in agriculture, but are
attributed to sectors in which the fuel-switching takes place. Top-down studies referenced in the report
suggest that this class of opportunities for mitigation is nearly as large as agriculture‘s on-farm potential, with
mitigation estimates ranging from 0.7 to 1.26 gtCO2e per year by 2030 at costs of US$20 or below.
The mitigation potential from changing how agricultural land is used is included in the IPCC estimates.
However, as Smith et al. (2008) emphasize, measuring the mitigation potential for agricultural land-use is
complex because a single activity can initiate a chain of emission outcomes among a portfolio of greenhouse
gasses that also depend on local soils and local climate conditions. As an example, the authors cite evidence
presented in Paustian et al. (2004) showing that composting manure can suppress methane emissions while
simultaneously accelerating emissions of another greenhouse gas, nitrous oxide. Similarly, soil restoration can
encourage carbon uptake in plants and soils, while stimulating the release of carbon through the
decomposition of organic matter.
After accounting for interrelated effects, the authors provide a further breakdown of the mitigation potential
for a set of agricultural activities under a range of carbon prices, shown in figure 6. Keeping in mind that
mitigation activities linked to agricultural biomass are excluded, the reported literature suggests that most
mitigation opportunities are related to soil and land management practices that generate net sequestration
gains. At low carbon prices (less than US$20), cropland management practices are key sources of mitigation,
along with other land management practices, including the restoration of organic soils, degraded lands and
improved management of grazing.
It is worth emphasizing that the types of mitigation activities identified are those often undertaken to enhance
agricultural productivity or better manage agricultural resources even when mitigation incentives are absent.
In particular the report notes that improved agronomic practices designed to improve yields, such as
expanding crop rotations or adding nutrients when they are deficient, can lead to greater carbon sequestration
in soils. Utilizing vegetative cover between rows of trees or vines both protects against erosion and enhances
carbon storage. The authors also note that improved nutrient management on crop and grazing land can
sequester carbon while holding down production costs. Adding organic matter or controlling erosion in order
to restoring degraded lands increases the stock of land usable for agriculture and while stockpiling carbon in
the soils. Smaller but important mitigation opportunities are tied to efforts designed to reduce methane
emissions from wetland rice, livestock and manure.
The IPCC report provides estimates of the full set of technically feasible mitigation potential from agriculture
by region, but does not further distinguish among the projects by cost. The mean estimates for selected
regions are given in figure 7. For ECA, the mean estimated technical potential mitigation is about 781million
tonsCO2 equivalent (MtCO2e) per year by 2030, which works out to more than 13 percent of the estimated
mitigation potential of agriculture world-wide.

6
Soil carbon pools
In 1982, Post and colleagues (1982) estimated that soil organic carbon contains about two-thirds of the
carbon in terrestrial ecosystems. This is a remarkable figure and it is perhaps surprising that the preservation
of rich carbon pools have not garnered greater attention. There are several shared characteristics between
below-ground carbon pools and above ground forests that are important for policy. Often forests and carbon
pools are situated on lands where use rights are unclear and access to the resources are not easily limited by
governments or private groups. In addition, while both land restoration and reforestation were included as
features of early climate change treaties, including the Kyoto Protocol, the preservation of forests and carbon
pools were not. To date, while the so-called REDD (Reducing Emissions from Deforestation in Developing
Countries) agenda is expected to be a key component of post-2012 climate change treaties, the preservation
of carbon in soils has been given less political urgency.6
A geographic dataset of organic carbon pooled in the topsoil constructed by FAO-UNESCO (2007) shows
that immense stores of carbon are held in ECA‘s soils (Map 1). The Russian Federation has vast areas of
relatively high-carbon pools most notably in the boreal forests of Siberia and nearby environments. In
addition, Central Asia has a few carbon hotspots surrounded by relatively lower concentrations of soil carbon.
Eastern Europe is mixed with all categories of terrain represented.
FAO (2010) also produced a dataset on land use, based on data from 1998-2008 (Map 2). A closer look at
land use map reveals large forest area in the north and large area of crops and agriculture in mid-latitudes and
the Eastern Europe. Central Asia has a few hotspots of agricultural and crop use.
By combining the two datasets, it is possible to say something about how the land containing carbon pools is
used and managed. Aggregated data for the region as a whole is reported in Table 7.7 Measuring the carbon
content of soils is difficult, but the FAO estimates indicate the scale of the carbon pools in ECA. Overall,
topsoils in ECA are estimated to contain the carbon equivalent of consuming 428 to 933 billion barrels of
crude oil.8
According to FAO‘s classification, roughly 47 percent of the area is used for agricultural purposes, and only
about 24 percent is used for moderate to high intensity crop or livestock activities. FAO estimates that topsoil
carbon contained in land put to these agricultural purposes ranges from 20,735 to 46,694 million tons of
carbon (MtC), or roughly, 37-39 percent of the total. Remarkably, more than half the soil carbon is contained
in soils that are unmanaged. Moreover, of the 28 to 60 thousand MtC of carbon in unmanaged soils, roughly
half is contained in the soils beneath unprotected virgin forests. This means that policies aimed at protecting
forests will have an additional benefit for climate change since the policy would also protect the soil
contained in forest floors. Still, even if virgin forests received adequate protection, roughly 25 percent of the
of the region‘s large reserves of soil carbon would remain in land that is neither managed by farmers nor
protected in forests.
Russia and Turkey
In this section, we examine differences in the composition of mitigation opportunities in Turkey and Russia,
the two largest economies in the region, to illustrate how agriculture‘s role in the economy and its potential
role in a country‘s mitigation strategy can differ. Both economies are of similar size; Turkey‘s GDP averaged
6 See Lal (2009) for a good discussion of the links between soil carbon and land use. See CBD (2009) discussion on the need to link forest, biodiversity and land-use policies. 7 FAO‘s original categories were aggregated to produce the table and the key to the aggregation is given in Annex table 1. The data is given at a country level in Annex table 2. 8 Based on EPA (2007) estimates that 1 ton of carbon is emitted for every 7.7 barrels of crude oil consumed. To lend perspective, the IEA (2012) estimates that global consumption of crude oil equaled 32.5 billion barrels in 2011.

7
about $US 359 billion, adjusted to 2000 dollars, between 2005 and 2009, while Russia‘s averaged $394 billion.
At 8 percent, agriculture‘s share of GDP for the period in Turkey was slightly larger than in Russia where it
was 5 percent. However, a recent report by the European Bank for Reconstruction and Development
(EBRD, 2011) suggests there may be much greater mitigation potential for agriculture and forestry in Russia
than in Turkey.
Based on input from McKinsey and Company, National Economic Research Associates, and Bloomberg
New Energy Finance, the IBRD study reports marginal abatement curves for Turkey and Russia. The MAC
curves rely on the assumptions that the policy frameworks in both countries remain unchanged from 2009 to
2030, the period of the analysis. They were built-up using country-specific sector practices and show, on a per
ton basis, the incremental cost of switching from a status-quo technology to a less polluting one. Results from
selected portions of the baseline MACs for each county are given in figures 8 and 9. The figures report the
annualized abatement potentials by 2030 for three low-cost ranges: win-win opportunities where the costs
associated from switching technologies are covered from future savings – for example, reduced energy
expenditures. The second category includes the mitigation potential associated with low-positive carbon
prices, ranging from zero to €20 per tCO2e. The next category shows the mitigation potential triggered by
carbon prices ranging from €20 to €100 per tCO2e.
More than 40 million hectares, or roughly 52 percent of Turkey‘s land area is devoted to agricultural uses
(FAO, 2011). Yet a striking feature of the figure for Turkey is the relative lack of significant mitigation
opportunities in agriculture, despite agriculture‘s significant role in the economy and the landscape. The
combined potential for the sector for costs of €100 per tCO2e and below is estimated to be a mere 1.52
MtCO2e.
Although a smaller share of Russia‘s land is devoted to agriculture (about 13 percent), the scale of Russia‘s
landscape is vastly different, with nearly 215 million hectares of land used for agricultural purposes.
Moreover, the identified potential within the agricultural sector is also of a different scale; the study identifies
more than 149 MtCO2e in mitigation potential from the sector. Much of the potential identified for the
economy as a whole falls into the win-win category of activities that can be financed via cost savings –
including nearly 40 MtCO2e in agriculture. Moving to the low-cost category, most identified projects are in
agriculture and forestry, at 108 and 228 MtCO2e respectively. Moreover, the potential in forestry and
agriculture are closely linked. Of the low-cost sources of mitigation, more than 80 MtCO2e of agricultural
potential is related to managing or restoring soils; of the forestry projects, more than 141 MtCO2e are based
on the afforestation and another 33 MtCO2e comes from converting land to agro-forestry purposes. As we
explain below, there is great potential for restoring degraded land in many other ECA countries as well.
Land use, agronomy, livestock waste and aligned resource management objectives
The example of Russia highlights the strong links between mitigation potential and agricultural resource use.
Returning to the IPCC report, the study identifies three core areas for low cost mitigation opportunities in
agriculture: i) improving agronomic practices; ii) improving land management and restoring degraded lands;
and iii) better managing of animal waste products. In this section we look at these types of activities in the
context of the ECA countries.
Degraded lands
In 2000, FAO conducted an analysis of lands degraded by agriculture and other human activities. Totals from
that report are shown in figure 10 for ECA and other regions (FAO, 2000). In total, degraded land in ECA
accounted for 6.8 million km2, an area one-and-a-half times the agricultural area of the United States.9 About
9 FAO (2011) reports agricultural area in the United States in 2008 equaled 4.04 million km2.

8
24 percent of the land degradation is attributed to poor agricultural practices. Table 8 gives a breakdown by
country. Dominated by the Russian Federation, the scale of land degraded by agricultural practices is
remarkable, with an estimated 100 million hectares in Russia and another 11 million hectares in the relatively
small country of Romania. The problem is endemic for the region as a whole, as Map 3 illustrates.
A better-scaled measure looks at degraded land relative to land that is currently used for agricultural purposes
plus land that could be potentially brought into agricultural uses. This number is reported in the far-right
column of table 8. Not all land is equally well suited for agriculture, so the number is a rough one. Still, it is
clear that there are significant differences among countries as to how poor agricultural practices threaten
agricultural productivity. In some countries, including Azerbaijan, Turkmenistan and Uzbekistan, degraded
land area far exceeds the area that is currently suitable for agriculture.
Improved agronomy
As detailed in the IPCC report, the adoption of new technologies can provide direct and indirect mitigation
benefits. For example, better agronomy and better resource management can result in greater accumulations
of soil carbon. There are likely positive spillovers as well, or reverse leakages in mitigation parlance, that occur
when individuals, motivated by better profits, adopt farming methods that boost land productivity. For
example, using improved seeds and inputs are expected to slow or reverse the conversion of land from
forests and pastures to cropland.
In general, this is what is currently happening in ECA. Since the early 1990s, productivity gains have been
significant in many countries. Table 9 reports cereal grain yields in the region, and reports yields in Argentina,
Canada, China, and Colombia for comparison. With the continued adoption of new seeds and farming
practices, yields in the region have improved substantially and, for some countries, now rival yields found
among the most advanced agricultural sectors. As with other aspects of the region, the gains have been
uneven, with smaller increases in the Central Asian countries. Figure 11 reports the average percentage
change in cereal yields and production based on three-year average yields centered on 1993 and 2008. Despite
differences, the figure shows that yield gains exceeded production gains in most of the ECA countries. Only
in the cases of Tajikistan and Turkmenistan has area expansion largely driven production growth.
As discussed later, a key determinant of yield growth and productivity growth in general is adaptive research
that modifies crop characteristics to local conditions. Although this type of research is rarely motivated by
climate policy, the spillover effects of research that leads to improved agronomy can be considerable for
mitigation and for improving adaptation capacity.
Livestock grazing and waste
There are two primary links between climate change and livestock production. The first link has to do with
how pasture lands are used. In cases where land property rights are weak and animal husbandry practices are
poor, lands can be over grazed, leading to degradation, erosion and the depletion of the carbon stored in
plants and the soil. Grazing animals are also a source of methane, a powerful greenhouse gas; however in well
managed pastures; however, the manure from grazing animals adds organic material to soils, facilitating
sequestration and partly offsetting the negative effects of released methane on the climate. In the last decades,
the relationship between livestock production and land-use has changed significantly in the region. Figure 12
shows how land has shifted out of crop production and into pasture and grazing lands. This is consistent with
improved production technologies that are land preserving discussed in the previous section. This has also
been accompanied by a decline in livestock herd size – as measured in animal units. As an aside, animal units
are a way of standardizing the environmental impact of animals on land. The coefficients adopted here are
those used by state agencies in the United States, based on recommendations of the US environmental

9
protection agency.10 Overall, there has been a shift away from cattle and other larger animals to poultry
production in the region (figure 13). Moreover, the trend is expected to continue. For example, poultry
production is expected to grow by 50 percent in Russia by 2015 and pig meat production is expected to grow
by 70 percent during the same period in the eight European Union members from Eastern Europe (Sutton et
al., 2008). Figure 14 breaks down the change in livestock herd sizes by country.11 In general, the shift places
less pressure on grazing lands and creates greater opportunities for rotating crops and fallowing. The switch
away from ruminants also promotes a more efficient conversion of feed and lower methane emissions from
belching and flatulence.
The second link has to do with the commercialization of livestock production. In general, commercialized
livestock operations rely more on feed lots, slaughter houses and other production methods that concentrate
animals into smaller and more confined areas of land. The changing composition of livestock production in
favor of pork and poultry operations reinforces this as well, since these animals are raised in more
concentrated settings. Commercialized livestock production creates its own set of problems, for example it
can lead to water contamination, overloaded soils and other problems; however the production methods also
lend themselves more readily to methane capture, organic fertilization systems and biomass production, all of
which create mitigation opportunities. Indeed, mitigation projects that improve the management of manure
and other organic wastes are among the few types of agricultural projects financed under JI and the CDM.
IV. Policy instruments and mitigation outcomes
To this point, the discussion has focused on the sources of greenhouse gas emissions in ECA and
opportunities to reduce net emissions at low cost. In this section, we turn to the sets of policies that give rise
to mitigation outcomes. As the previous section on mitigation potential makes clear, greenhouse gas
emissions in agriculture are closely tied to the choices farmers make about how they employ natural
resources, especially land and water, decisions that are influenced by policies affecting agricultural markets
and natural resource management. Increasingly, these decisions are affected by climate change and climate
change policies as well. The relationships among climate change policy, agricultural policy and natural
resource management policies are complex and varied, but the most visible change in the mix of policies has
been the rise of policy-induced carbon markets that finance mitigation projects in agriculture and other
sectors.
Looking ahead, what is striking is how current policies and the markets they engender are effective in tapping
some sources of mitigation potential in agriculture but not others. Moreover, mitigation outcomes are only
loosely tied to mitigation potential. This is partly because the methodologies used to build-up abatement cost
curves that are used to quantify potential do not fully account for transaction costs – that is, the practical
costs of moving from one type of technology use to another. In turn, there are significant differences in
transaction costs among countries and across project types. Some differences have to do with national
institutions and apply equally to all types of investments. Others are quite specific to the prevailing rules
governing mitigation projects. Good policy can reduce transaction costs, but not eliminate them altogether,
so fundamental differences in transaction costs will still affect mitigation outcomes. However it is also the
case that design features of current institutions have practical implications for mitigation activities, especially
in agriculture and, as a consequence, promote certain types of activities over others.
10 For more detail visit the Minnesota Department of Agriculture animal unit calculation worksheet, available on the Internet at http://www.mda.state.mn.us/animals/feedlots/feedlot-dmt/feedlot-dmt-animal-units.aspx. 11 Data is reported in Annex 3.

10
Carbon markets and carbon market institutions12
The market for financial instruments tied to greenhouse gas emissions was valued at approximately $US 142
billion in 2010, a market that arguably did not exist before the World Bank launched its Prototype Carbon
Fund in 1999. A set of tradable instruments established under the Kyoto Protocol, and a set of instruments
under a European cap that are also related to emission targets pledged under the Kyoto Protocol form the
basis for most of the market.
Two project-based mechanisms, the Clean Development Mechanism and Joint Implementation, are
important components of the first set of instruments. The programs were established under the Kyoto
Protocol and created a framework for investments by government and private entities in mitigation projects
in developing countries and transition economies. Additional rules set out in the Kyoto Protocol and
subsequent agreements allowed offsets created under the mechanisms to be traded and used to meet treaty
obligations. A subsequent agreement among European countries established a cap-and-trade program for
GHG emissions, the European Union Emission Trading Scheme (EU ETS).
Setting explicit goals and using markets to achieve the goals efficiently are important components of the
programs. It is the establishment of binding constraints on greenhouse gas emissions, either through treaty
obligations or the setting of the cap, and the subsequent investments in mitigation projects that provide
environmental benefits from both programs. In turn, secondary markets are important for price discovery
and thereby provide incentives for undertaking cost-effective mitigation activities. Increasingly, carbon-
market transactions involve the secondary market for EU ETS or CDM instruments. And it is trading in the
secondary markets that has driven market growth overall from around $US 11 billion in 2005 to nearly $US
144 billion in 2009. For new projects, the CDM slice of the market is the largest; however the CDM‘s share
of the market has declined from around 24 percent to just over 1 percent of the market in 2010 (figure 22).
The evolution of program rules
The JI, CDM and EU ETS institutions are all relevant for the ECA countries and all three programs have
their origins in an evolving set of agreements under the United Nations Framework Convention for Climate
Change (UNFCCC). The objective of stabilizing greenhouse gas concentration in the atmosphere to avert
dangerous changes in the Earth‘s climate is set out in a portion of the UNFCCC that went into force in 1994.
Meetings among treaty negotiators are known as Conferences of the Parties (COP). At the third COP, in
Kyoto Japan, a set of additions to the UNFCCC, referred to as the Kyoto Protocol, laid out the framework
for an international mechanism for reducing greenhouse gas emissions.
A guiding principle of the Kyoto Protocol is the notion of common but differentiated responsibility.
Commonality comes from the physical property that greenhouse gases have a uniform effect on global
warming independent of the source of emission; differentiation stems from the historical nature of current
levels of accumulated long-lived anthropogenic greenhouse gases, which are primarily the consequence of
emissions from developed countries. The cost of achieving emission reduction goals shaped the treaty as well,
especially the notion of differing abatement costs.
Under current rules, the treaty sets out three levels of obligation among party participants. Over the first
commitment period 2008 to 2012, industrialized countries, generally referred to as Annex I countries in
reference to the annexed list in the Kyoto Protocol, are obligated to take specific steps to bring their overall
carbon emissions below a 1990 baseline.13 Commitments are listed in Annex B of the Kyoto Protocol and
12 This section relies on Larson et al. (2008). 13 The term is commonly used and inaccurate. The United States is listed in Annex I of the Protocol, but has not ratified the agreement. Belarus and Turkey are also listed but have withdrawn their offer to cap emission levels. Kazakhstan is listed in neither Annex I nor Annex B, but has pledged to limit emissions.

11
vary among the countries. By way of example, targets for the European Union and many transitional
economies are set at 8 percent below 1990 levels, Russian targets are set at 1990 levels and Australian
emission targets are 8 percent above 1990 levels. In addition, a wealthier subset of the Annex I countries,
known as Annex II Parties, pledged to provide new and additional financial resources to facilitate and finance
technology transfer and cover the costs of compliance incurred by developing country Parties.14 Developing
countries, known as Non-Annex I Parties, are obliged to develop and periodically update their national
inventories of greenhouse gas emissions by sources and removals by sinks, but are not committed to reduce
emissions during the first commitment period. 15
To complete some key definitions associated with the framework, the amount to which an Annex I Party
must reduce its emissions over the commitment period is known as its ―assigned amount.‖ These Parties are
allocated ―assigned amount units‖ (AAUs) up to the level of their assigned amount, corresponding to the
quantity of greenhouse gases they can release in accordance with the Kyoto Protocol (Article 3), during the
first commitment period. One AAU equals one ton of emissions, expressed as a carbon-equivalent (tCO2e).
Parties may offset their emissions by enhancing greenhouse gas sinks in the land use, land-use change and
forestry (LULUCF) sector. Greenhouse gases removed from the atmosphere through eligible activities within
this sector generate credits known as ―removal units‖ (RMUs).
In addition to domestic actions, the Kyoto Protocol allows for three flexibility mechanisms intended to
reduce the overall cost of the treaty. First, countries facing emission limits can purchase AAUs from other
Annex B countries under the International Emission Trading provision (Article 17). In addition, as
mentioned earlier, countries can invest directly in mitigation projects abroad. The Protocol distinguishes
between, Joint Implementation, the framework for projects hosted in Annex B countries that have pledged to
limit emissions, and the Clean Development Mechanism, the program for projects in and non-Annex I
countries that have not pledged emission reductions.
Though conceptually similar, there are important practical differences in how the programs are administered
and implemented. Offsets (credits) arising under JI are known as Emission Reduction Units (ERUs), while
credits generated by CDM are known as Certified Emissions Reductions (CERs). Each CER and ERU
represents one tCO2e of greenhouse gas emission. All three Kyoto units (CERs, ERUs, and AAUs) can be
traded and used to meet treaty obligations.16
Solving pollution problems through international cooperation had several precedents prior to Kyoto, but key
aspects of the framework having to do with project credits were unique and have been controversial.17 To
start, credits emanating from projects are based on a hypothetical baseline of emissions that would have
occurred absent the CDM or JI investment. Judging an appropriate counter-factual is difficult at best and
entails both economic and engineering challenges. As a practical consequence, the rules and procedures for
approving and implementing CDM and JI projects have grown complex. In addition, CDM projects are
expected to also advance development objectives. The criterion is loosely defined and judging whether it is
met is difficult. Moreover, the twin objectives imply tradeoffs, since setting a high development objective for
CDM projects can slow investment transfers and hamper the scope of the flexibility mechanisms to lower
implementation costs. And finally, the flexibility mechanisms are expected to be supplemental to domestic
14 Current Annex II countries that have ratified the Protocol are: Australia, Austria, Belgium, Canada, Denmark, Finland, France, Germany, Greece, Iceland, Ireland, Italy, Japan, Luxembourg, Netherlands, New Zealand, Norway, Portugal, Spain, Sweden, Switzerland, and the United Kingdom. 15 Sinks are natural or man-made systems that absorb and store more greenhouse gases than they emit. 16Only sovereign entities can trade AAUs, while both private and public entities can trade and own CERs and ERUs. 17 Examples of international cooperative action include the 1976 Convention Concerning the Protection of the Rhine River against Pollution by Chlorides and the 1985 Vienna Convention for the Protection of the Ozone Layer (Hanafi, 1998).

12
action and this has prompted debates about domestic policies governing the use of offsets. We return to
these topics below.
As discussed, the Kyoto Protocol established two mechanisms by which countries facing emission limits to
meet those obligations by investing in projects that reduce emissions elsewhere. Broadly, credits generated by
CDM and JI projects are calculated by comparing the emissions or reductions from each project against a
business-as-usual scenario, or baseline. Consequently, a significant portion of the project cycle entails
developing arguments about why low-emission outcomes would not occur without investments associated
with the project. Because this process is rule-based and because there are arguably incentives for both
investor and host to exaggerate the environmental consequences of the project, the mechanisms were viewed
with suspicion. Delegates and observers worried that weak controls and imprecise baselines might allow
countries that had pledged reductions to purchase water-downed credits cheaply from developing countries,
thereby attenuating the environmental benefits of the treaty and forestalling the development of new
technologies. In addition, delegates from developing countries expressed concern that donor countries would
meet emission reduction targets by redirecting existing aid flows to joint implementation projects (Ghosh and
Puri, 1994; Parikh, 1995).18 One consequence was an extended period of rule making and details of the
programs were left unfinished until the announcement of the Marrakesh Accords in 2001. 19 The concerns
also affected the design of the programs and have given rise to a specific set of national and international
institutions that, in turn, shape private markets for carbon projects.
In particular, the final rules called for a centralized project-by-project review process and a conservative
approach to validation. Less specific language in the treaty and in the implementation rules calls for projects
to promote sustainable development and asks developed countries to ensure that Overseas Development
Assistance (ODA) is not diverted to finance CDM projects. Language calling on countries not to depend too
heavily on project-derived credits to meet treaty obligations, and specific rules limiting the use of credits from
sinks reflects the qualified support given to the CDM by negotiators.
We return to these topics when we discuss how the rules governing projects affect decisions about investing
in agricultural mitigation. Before doing so, we describe the process of creating projects under the twin Kyoto
mechanisms and also discuss the markets that have grown up around them.
The CDM project cycle
In order to generate certified credits, projects located in developing countries must materially reduce or
remove atmospheric greenhouse gas emissions and also contribute to sustainable development. In practice,
most aspects of the CDM project cycles fall under the supervision of host national regulatory agencies –
known as Designated National Agencies in UNFCCC parlance. And, in general, it is up to the host
government to determine whether projects meet its sustainable development goals. This determination is part
of the CDM project cycle and is signaled by a project-specific letter from the host country to the UNFCCC.20
18 Lecocq and Ambrosi (2007) provide a good historical account of the CDM. Gulbrandsen and Andresen (2004) discuss the role played by nongovernmental organizations in this debate Grubb, Vrolijk and Brack (1999) provide a good account of the negotiations. See also criticisms in Cullet and Kameri-Mbote (1998). Chomitz (1999) discusses moral hazard problems relating to baselines. 19 Werksman (1998) gives an account of the CDM negotiations. den Elzen and de Moor (2002) discuss rules emerging from the Marrakesh Accords. 20 Of course, additional criteria can be applied. For example, the Gold Standard Foundation requires additional stakeholder consultations for projects to qualify for its voluntary certification. In February 2008, the British government announced plans for a voluntary certification for CDM projects that conform to its Code of Best Practice for Carbon Offsetting. The Code is voluntary is administered by an Accreditation Board. The Code may be extended to Voluntary Emission Reductions soon (DEFRA 2008).

13
In contrast, the environmental integrity of a CDM project is subject to specific supervision rules and a series
of checks along the project cycle by the UNFCC Secretariat. To start, methodologies for establishing
baselines must be approved on behalf of the UNFCCC by an international supervisory group, known as the
CDM Executive Board. Approved methodologies are published and these can be drawn on by project
developers. However, projects relying on new methods face the additional task of gaining approval. In either
case, whether new or established methods are employed, developers must also convince the CDM board that
their project methodology has been appropriately applied.
The project cycle also contains checks carried out by an independent firm or organization that has been
accredited by a CDM Board. This entity, known as a Designated Operational Entity (DOE), initially validates
the baseline design and the project‘s plan to monitor and measure outcomes.21 This occurs before the project
is registered -- that is officially recognized by the CDM Board. For large CDM projects, a separate
independent entity carries out the project‘s monitoring protocol, the process by which emissions or
sequestrations are measured. The DOE is also responsible for certifying all emission reductions, although it is
the CDM Board that issues and tracks the ownership all CERs. To boost the contribution of the CDM to
sustainable development, a two percent levy on CERs goes toward an Adaptation Fund, designed to cover
the CDM‘s administrative costs and to fund projects that help the poorest countries adapt to climate
change.22
The JI project cycle
Conceptually, Joint Implementation, the second project-based mechanism established by the Kyoto Protocol
is less controversial since, because of an overall cap on allowed emissions from the JI host, any projects that
abate greenhouse gases potentially lead to tradable units of carbon. Domestically financed projects do so by
creating more headroom under the cap of allowed emissions, potentially contributing to a surplus that could
be traded to other countries in the form of AAUs. The JI program provides an additional mechanism for
foreign investment projects that directly create tradable carbon units in the form of ERUs. At the end of the
Convention‘s accounting period, all types of carbon units are balanced, so the primary distinction between
traded AAUs and traded ERUs has to do with how the underlying projects were financed.
Notionally, the practical hurdles of implementing JI projects are also lower. Since Annex I countries have
pledged to cap domestic emissions, national guidelines used to measure emissions from wholly domestic
projects can be applied to JI projects as well. Moreover, in contrast to the CDM project cycle, the JI program
is designed to place full responsibility for the environmental integrity of the projects in the hands of hosting
countries. In practical terms, Annex I countries that have the necessary national guidelines in place to track,
measure and report emissions and reductions are able to issue and transfer ERUs without recourse to an
international body for approval. 23
Many Annex I countries were late putting in place the domestic institutions needed to fully comply with
UNFCC JI eligibility rules.24 And, rather than preclude projects in countries that have pledged emission
ceilings while permitting them in countries that have not, the UNFCCC devised a second Track Two
procedure for JI similar in structure to the CDM project cycles. Track Two projects are monitored by the
Article 6 supervisory committee, also known as the Joint Implementation Supervisory Committee (JISC),
21 The overall design of the project is laid out in a Project Design Document (PDD). 22 The levy is not assessed against projects hosted by developing countries. 23 To be eligible for participation in either project-based mechanism, Annex I countries: ratify the Kyoto Protocol; calculate their assigned amount; establish a national system for estimating emissions and removals; put in place a national registry to record and track the creation and movement of related tradable assets. 24 As of May 2012, Track 1 projects had been implemented in Bulgaria, the Czech Republic, Estonia, Germany, Hungary, Latvia, Lithuania, Poland, Romania, Russia, Slovakia, Sweden, and the Ukraine.

14
which plays a role similar to the CDM Board. ERUs generated by track-two projects are measured against a
baseline, whose methodology has been approved, as determined by an accredited independent entity (AIE)
recognized by the JISC. In practice, several of the firms certified to validate CDM baselines (as DOEs) are
also certified to validate Joint Implementation baselines (as AIEs).
EU Emissions Trading Scheme
The European Union‘s Emissions Trading Scheme (EU ETS) is one of the principal instruments that the EU
relies on to meet its GHG emissions reduction requirements under the Protocol – an 8 percent reduction
compared to 1990 levels by the first commitment period. Presently, the plan covers carbon dioxide emissions
from more than 10,000 installations from the EU‘s 27 Member States plus, as of 2008, Norway, Iceland and
Liechtenstein, members of the European Economic Area. 25 Together the installations account for about 40
percent of the EUs greenhouse gas emissions. Legislation that eventual launched the EU ETS in 2005 was
approved by the European Council and the European Parliament in 2003.26
To date, the policy has covered two periods. Phase 1 (2005-2007) of the cap-and-trade program was intended
as a trial prior to the first commitment period of the Kyoto Protocol, which coincides with Phase 2 (2008-
2012). Emission allowances, called EU allowances (EUAs), are permits equivalent to one ton of emitted
carbon dioxide. During the first two phases, Member States allocated allowances to their regulated installation
in accordance with a National Allocation Plan (NAP). At the end of each year, regulated installations must
surrender allowances equivalent to their emissions. Surpluses and short-falls can be matched through sales
and purchases.
Under current rules, NAPs are subject to European Commission oversight and the Commission can (and
has) reduced the number of overall EUAs under national plans if the plans appear inconsistent with business-
as-usual scenarios and climate change framework obligations. The back and forth between national planners
and the Commission has generated delays and regulatory uncertainties.27 Moreover, differences and
inconsistencies in the process by which national governments allocated allowances created distortions and
inefficiencies, which are discussed later in this section. Under a current proposal national plans would be
abolished and replaced with an EU-wide cap based on harmonized rules. The proposal would also extend the
system beyond 2012 and cover additional industries and two additional greenhouse gases, nitrous oxide and
perfluorocarbons. Proposed rules would also allow Phase II EUAs to be carried forward into future periods.
The EU ETS allows firms to supplement their allocation of EUAs with credits from CDM or JI projects,
although as discussed later there are restrictions that work against land-use projects. Moreover, although
important, the EU ETS is not the only mechanism by which EU governments intend to meet their
obligations under Kyoto. Still, the EU ETS cap provides the primary incentive for purely private sector
engagements with JI and CDM projects.
The nexus of carbon market institutions and ECA
Table 10 shows how countries in the ECA region are distributed among the three regulatory settings. Ten
countries are participants in the EU-ETS and also have pledged to reduce greenhouse gas emissions under
the Kyoto Protocol by 6 to 8 percent. Four more remain outside of the EU ETS, but have committed to
25 Currently, the sectors covered include energy activities (e.g. electric-power generation greater than 20 megawatts), ferrous metals industries (iron and steel), mineral industries (cement, glass, ceramics, oil refineries, etc.), and pulp and paper industries. 26 For background information on the EU ETS see Watanabe and Robinson (2005), Convery and Redmond (2007) and Europa (2007). 27 For example the Commission‘s review of Member NAPs required for the start of Phase II in January 2008, did not conclude until the fourth quarter of 2007.

15
reduce emissions (Croatia), or constrain them at base year levels (Kazakhstan, Russia and the Ukraine).
Turkey‘s relationship within the UNFCCC has shifted over time. As part of the OECD, Turkey was originally
listed in the Kyoto Protocol‘s Annex I and Annex II, but did not commit to emission reductions. Turkey
became a party to the UNFCCC in 2004 and a party to the Kyoto Protocol in 2009. Turkey was removed
from the Annex II list in 2007. Consequently, Turkey is an Annex I signatory of the Kyoto Protocol not
included in Annex B.
Projects outcomes under Joint Implementation and the Clean Development Mechanism
As discussed, under current rules, the only formal way that developed countries can tap mitigation
opportunities in developed countries and transition economies to meet their Kyoto commitments is through
project-based mitigation efforts under Joint Implementation and the Clean Development Mechanism. This is
especially important for agriculture since, according to IPCC, most low-cost mitigation opportunities are
located in developing countries (recall table 6).
In the aggregate, the two project-based programs have successfully encouraged global investments in
mitigation projects in developing countries and economies in transition. In fact, the CDM has exceeded
projections made reported in the peer-reviewed literature before its launch (Rahman, Dinar and Larson,
2010). Still, analysis reported in Larson, Dinar and Aaparis (2011) suggests that the CDM was able to tap less
than 3 percent of the low-cost agricultural potential in developing countries identified by the IPCC. In this
section, we look at project-based investments in the ECA region relative to the full set of global investments.
We do so with the expectation that the programs, or alternative project-based programs, will continue in
some form beyond 2012, which is the end of the first-commitment period under the Kyoto Protocol.
The first step in the analysis is settling on a definition of what constitutes an agricultural JI or CDM project.
There is some confusion in reported studies since the classification systems used by the IPCC in the
mitigation reports discussed earlier differ from how the United Nations Environment Programme Risoe
Center on Energy, Climate and Sustainable Development (Risoe) reports projects in their widely used project
data base.
Indeed as of July 1, 2011, there were no JI projects and only two active CDM projects classified by Risoe as
agricultural.28 This is superficial since many of the projects do relate to agriculture; however Risoe‘s
classification choices are also indicative of the energy-sector focus of climate change policy discussions.
Projects related to land use, the primary focus of the IPCC chapter on agriculture, are included under
afforestation/reforestation projects, which we refer to as land-use-forestry projects.29 Other projects related
to agriculture – for example systems to manage animal wastes or projects that use agricultural waste products
to generate energy -- fall into other aggregate categories in the Risoe classification system, such as biomass
energy or methane avoidance; however, these groups include non-agricultural projects as well. Consequently,
we are left to sort the projects in a way that better suits our purpose.
In this we follow the lead of the United Nations‘ Food and Agriculture Organization (FAO) and define an
agricultural project as a project that uses agricultural residuals, outputs or agricultural processes to directly or
indirectly reduce greenhouse gas emissions (FAO, 2010a). This definition is broad enough to include projects
that sequester carbon in soils. We include projects that reduce methane emissions from composting
agricultural waste products and also include waste water projects when the projects are linked to agricultural
products – for example palm oil, cassava or distilleries. In general, the use of ethanol or biodiesel made from
28 The two projects are, using Risoe project identification numbers, CDM6938 and POA0011. 29 In UNFCCC parlance, the class of mitigation projects that sequester carbon in soils and forests are known as land use, land use change and forestry (LULUCF) projects, since the net mitigation comes from changing how land is used.

16
vegetable oils do not meet CDM additionality rules, although there are biodiesel projects under the JI. More
common are projects in which residual agricultural organic matter is used to produce energy.
For the purpose of this paper, we focus on 6,961 CDM and JI projects that were active as of July 1, 2011. Of
these, we classify about 19 percent as agricultural. Another 2.4 percent are forestry projects, and a category
that includes agro-forestry projects. Taken together, these projects are expected to produce almost 3.3 million
CERs and ERUs. The pipeline includes 1,304 agricultural projects that are expected to mitigate the equivalent
of almost 250 million tons of carbon dioxide. Mitigation projects are highly concentrated in a handful of
countries under the two Kyoto mechanisms. China, India and Brazil account for more than two-thirds of the
projects overall and more than half of the agricultural projects (table 11). However, because of differences in
the average scale of projects, the ranking changes when it is based on the expected mitigation impact of the
projects – that is, the total offsets, CERs and ERUs, the projects are expected to produce by 2012. Measured
in this way, Russia and the Ukraine are among the top five hosts, which together account for more than
three-fourths of all expected offsets. Agricultural projects are also concentrated among a few hosts; China,
India, Brazil and Malaysia account for 61 percent of the projects and 64 percent of agricultural offsets.
Hungary and the Ukraine make appearances in the top twenty hosts, but represent small portions of the
market overall. The make-up of the countries hosting forestry projects is somewhat different. Brazil, China
and India are again leading hosts, as is Russia. However, within the small enclave of countries hosting forestry
projects, other ECA countries, including Hungary, Moldova and Romania are significant.
As shown in table 12, there are 461 projects are located in ECA countries, less than 7 percent of all projects
worldwide. However, the projects are larger scale and account for 16 percent of the offsets expected by 2012.
There are only 17 agricultural projects in the region and these are expected to generate just under 3,781 CERs
and ERUs, accounting for about 1.5 percent of the mitigation impact of all agricultural projects. In
comparison to countries outside the region, the portfolio of investments under the two mechanisms is more
heavily weighted in projects that deal with industrial gases and with projects that aim to increase energy
efficiency.
Table 13 shows the breakdown by country. Together, Russia and the Ukraine account for about 47 percent of
the projects, but more than 77 percent of the expected offsets. The Czech Republic accounts for just fewer
than 13 percent of the projects, but only about 1 percent of expected offsets. In part, the concentration of
mitigation efforts in Russia and the Ukraine reflects the relative size of those economies and the opportunities
for mitigation, but other factors are important as well. There are no projects in Turkey as a result of policy
decisions already discussed. Other countries are eligible to host projects, but have had mixed success in
attracting investments. Figure 16 reports on a rough relative measure of investment activity. The measure is
constructed by taking the annual average tons of GHG mitigated by projects hosted by the country for the
2008-2012 period and dividing the average by GHG emissions in 1990, the reference year for most Kyoto
commitments. By this measure, the two investment programs show considerable impact in several countries.
The CDM countries of Armenia, Azerbaijan, Georgia, Macedonia, Moldova, Romania, and Uzbekistan have
not pledged reductions; nevertheless, should planned projects come to full fruition, the projects would
produce mitigation impacts ranging from 1 to 4 percent of their 1990 emissions. Expected offsets from
projects in Bulgaria, Lithuania, Hungary and Russia, countries that have pledged to reduce or freeze emission
levels, account for similarly scaled reductions.
At the same time, despite the significant scale of CDM and JI projects in some countries, the relative
importance of project investment for the country‘s emission growth path is hard to gauge from the data. To
start, there were no successful investment projects in 11 of the ECA countries. Moreover, the strength of
project investment and eventual mitigation outcomes are not straightforward. For example, the total
annualized flow of CERs expected from Azerbaijan‘s seven CDM projects are equivalent to roughly 4 percent

17
of total GHG emissions in 1990 and exceed the annualized 2.8 percent decline is emissions from 1990 to
2005, and the two rates were roughly matched in Lithuania and Russia. At the same time, the figure shows
that overall GHG emissions fell just as fast rapidly in Latvia, Kyrgyzstan and Tajikistan, where there were no
CDM or JI projects.
As mentioned, there are few agricultural or forestry projects in the region. In addition, there is little diversity
in the types of projects Of the 17 projects classified as agricultural, 9 of the projects are based on improving
the management of manure from livestock operations. This group of projects includes two of the Hungarian
projects, three of the projects hosted by the Ukraine, as well as projects in Armenia, Estonia, Poland and
Serbia. The projects are mostly organized around hog or dairy operations. The remaining 8 projects have to
do with converting agricultural residuals to energy, mostly the remains from sugar beet or sunflower
operations. This list includes three sunflower projects in the Ukraine, two projects in Russia and projects in
Bulgaria, Hungary and Moldova.
The range of forestry projects in the region is also quite limited. Of the 25 forestry projects in the region, 21
have to do with converting forest residuals, mostly from sawmill operations, into energy. This includes all
eight projects in Russia, four projects each in Estonia and Hungary, and projects in Bulgaria, Macedonia,
Romania, Serbia and the Ukraine.
Of the 461 active projects under the CDM and JI programs in ECA, only four projects were related to how
land is used: two reforestation and afforestation projects in Moldova, and one project each in Albania and
Romania. All four projects deal with the problem of restoring agricultural land that has been overgrazed or
degraded by poor land management. All of the projects involve land that is publicly owned, either by the state
or by local communities. Significantly, two of the projects are organized under the World Bank‘s first carbon
financing fund, the Prototype Carbon Fund, while the remaining two projects operate under the World
Bank‘s BioCarbon Fund.
Project markets outside the Kyoto mechanisms
Not all projects designed to mitigate greenhouse gas emissions from agriculture operate under the UN
Framework. Voluntary markets offer an alternative way of financing agricultural land-use projects. Overall,
these markets are small relative to regulated markets, including the CDM (recall figure 22). However, they are
significant and collectively finance a greater volume of offsets than Joint Implementation.30 Most voluntary
market transactions originate in the United States, which is not a party to the Kyoto Protocol.31 Projects
traded in voluntary markets are not subject to the same types of review and public disclosure that characterize
the CDM market; however the application of third-party standards is common. In their annual review of
voluntary markets, Hamilton et al. (2010) estimated that over 90 percent of voluntary transactions in 2008
and 2009 adhered to third-party standards, but also counted 18 competing standards active in voluntary
markets. Still, some third-party standards are more frequently used. Among 676 voluntary projects surveyed
by Peters-Stanley et al. (2011), 38 percent of the projects used Verified Carbon Standards, 19 percent use
Climate, Community and Biodiversity Standards, and another 16 percent used Climate Action Reserve
standards. 32
In some cases, the types of projects financed by voluntary markets are similar to classes of projects eligible for
financing under the Kyoto mechanisms. For example, in 2009 landfill and wind projects accounted for 39
30 Joint Implementation is a second project-based mechanisms established by the Kyoto Protocol for projects based in countries that have pledged reductions. 31 Hamilton et al. (2010) estimates that 56 percent of voluntary project transactions took place in the United States. 32 The Climate, Community and Biodiversity Standards are not used to quantify offsets; rather they are used to address sustainability and social impact.

18
percent of the offsets financed by voluntary markets (Hamilton et al., 2010). Still, investors have been
attracted to the voluntary market as a way to invest in land-use projects that are difficult to finance or have
been excluded from financing under the Kyoto mechanisms. For example, Peters-Stanley et al. (2011) report
that 29 percent of the over-the-counter (OTC) transactions in 2010 involved so-called reducing-emissions-
from-deforestation-and-forest-degradation (REDD) projects, most of which originated in Latin America.
Another 11 percent were other forestry-based, while agricultural soils and livestock methane projects were the
bases for another 3 percent and 2 percent of OTC projects.
The distribution of OTC project locations is heavily centered in North and South America, including 65
percent of all projects in 2011. This distribution is partly due to the fact that the US remains outside of the
Kyoto Protocol and that REDD projects are outside the Kyoto mechanisms. In general, project developers
appear to prefer projects under the CDM or JI programs where possible, although voluntary projects in
China and India are on the rise. ECA countries remain outside voluntary markets, with the exception of
Turkey (Peters-Stanley et al., 2011).
V. Hurdles to agricultural land-use projects under the Kyoto mechanisms
In the previous sections we documented the gap between the available mitigation opportunities in
agricultural projects and capital flows into the region under CDM, JI and voluntary markets. In this section,
we examine specific design features of agricultural projects and specific rules under the CDM and JI that
work against land-use projects. We then explore how these also work to limit funding from markets outside
of the Kyoto mechanisms.
Purposely, the twin Kyoto project programs are designed to facilitate capital flows to developing countries to
tap low-cost mitigation opportunities and to promote sustainable development in developing and transition
countries some of which have not themselves pledged emission reductions. But this basic design tenet of the
mechanism has vocal critics and support for the mechanism, even among some signatories of the Kyoto
Protocol, has been equivocal. One consequence is a set of varied national policies and a complex set of
international implementation rules that try to remediate concerns about the environmental efficacy of the
projects and their impact on development. Additionally and separate from the underlying questions that
motivated their genesis, the mechanism‘s implementation rules give the CDM a particular institutional
structure that has practical consequences, influencing the type of mitigation efforts feasible in developing
countries within the UNFCCC. For the most part, this structure works against the development of projects
related to how land is used and this, in turn, works to preclude the types of projects that would target the
largest sources of low-cost mitigation opportunities within agricultural sectors. More generally, it also explains
why the country and sector composition of the projects that now constitute the CDM project cycle pipeline
differ from estimates of the sector-distribution of low-cost mitigation opportunities discussed earlier.
Objections to project mechanisms and their influence on its design
Although the JI and CDM programs were outlined in broad strokes in the 1997 Kyoto Protocol, the practical
design of the mechanism was worked out in a protracted set of negotiations, which were not fully concluded
until 2003. The rules that emerged partly reflected the early divergent views that had made negotiation over
the mechanism so difficult. But they also reflected the difficult and technical challenges of designing and
verifying project-based mitigation efforts when only one of the parties faces emission limits.33
33 The mechanics of project-based mitigation had been explored prior to Kyoto in a series of national pilot programs known collectively as Activities Implemented Jointly, with mixed results. See Larson and Breustedt (2007) and references therein.

19
Flexibility mechanisms
In the lead-up to the Kyoto Protocol, flexibility mechanisms were strongly opposed by several NGOs and
some European negotiators, largely on normative grounds. For these groups, developed countries that
contributed most to the accumulative of greenhouse gases over time were morally bound to redress the
problem by acting within their own borders. Other groups went further, arguing that CDM would be
exploitive and erode the authority of developing country governments. 34
The value of using offsets and other tradable permits to reduce the cost of mitigation was questioned on
positive grounds as well, as some modeling work suggested that low carbon prices would reduce incentives
for new innovative technologies and result in long-run welfare losses.35 The basic logic of the argument is that
investments made when carbon prices are high are more likely to be associated with innovative technologies
that generate positive externalities that, in turn, improve the productivity of other firms. Said differently,
advocates maintained that innovation increases as the shadow-price of capital devoted to mitigation increases
– at least for a relevant set of carbon prices—and, over time, the benefits of improving the productivity of the
mitigation function exceed the initially high costs of abatement.
In Kyoto, negotiators divided into separate camps and a coalition led by the EU and Swiss delegations
pushed to place quantitative limits on the use of tradable credits. Language emerged in the final draft of the
Protocol stating that the flexibility mechanisms would be ―supplemental‖ to domestic actions, but, with the
exception of forestry credits, quantitative restrictions were never imposed in subsequent rounds of rule
making (Platjouw, 2009).36 Nevertheless, national governments have leeway in how the flexibility mechanisms
can be used within their borders, and several countries have imposed quantitative restrictions.
In the case of the European Emission Trading Scheme (EU-ETS), the aggregate use of Kyoto units is limited
to 13.36 percent of the 2008-12 emission allocations; national rules vary. For example, Estonia forbids the use
of Kyoto units, while Lithuania, Norway and Spain place a cap at 20 percent (Larson et al., 2008).37 Moreover,
in additions to general restrictions on CDM offsets, CERs originating from land- use projects are completely
excluded from the EU-ETS, which has additional implications for pricing and finance, a topic that we return
to latter.
Creating new credits
There was also great skepticism about project-based mitigation (Lecocq and Ambrosi, 2007). A core concern
had to do with the idea of using a hypothetical business-as-usual counterfactual scenario to determine the
number of credits earned by a particular project. As discussed, elements of the counterfactual cannot be
observed and the full implications of the project are to a degree speculative, opening the evaluation process to
strategic manipulation.
Conceptually, firms that face binding constraints under cap-and-trade or in the form of a carbon tax will
undertake mitigation efforts to the degree that the costs are matched by the added revenue associated with
additional emissions. Importantly, the firms make their own judgment about the efficacy of capital invested in
mitigation. Outside of the cap, a different set of incentives are in place. Firms that fail to take mitigation
efforts are not penalized, but can be induced to mitigate if it is profitable to do so. Indeed, this is the
34 Harvey and Bush (1997) provide an early discussion of normative issues. 35 Conceptual and numerical models suggest that this construct holds under special circumstances. Arguments related to the long-term benefits, via induced innovation, of restricting emission trading are discussed in Matschoss and Welsch (2006) and Weber and Neuhoff (2010). 36 See in particular Articles 6, 12 and 17 of the Kyoto Protocol. 37 Operating since 2005, the EU-ETS mandates an overall limit or cap on carbon emissions that originate from large industrial facilities and electric power generating plants and allows the trading of emission permits under the cap. The program affects firms in the EU‘s 27 member states, plus Iceland, Liechtenstein and. Norway.

20
underlying essence of the CDM, since many low-cost mitigation opportunities are located in countries where
greenhouse gas emissions are not regulated.
In this case, a judgment external to the firm must be made about how an investment affects emissions, and
this leads to potential problems of information asymmetry. This is because firms both inside and outside of
the cap stand to benefit from an exaggerated evaluation of an investment‘s impact since they can share a
larger number of credits. A related difficulty is that new investments often affect emissions and production
costs jointly. In this case, the private benefits from the investment (for example, from energy efficiency gains)
must be subtracted from the cost of the investment used in the mitigation calculations. This becomes
especially complex for projects where host firms face restricted access to capital, since the cost of capital
enters into the calculation of economic additionality.38
A final difficulty has to do with indirect ―leakages,‖ that is, when a portion of the mitigation gains from a
project are lost via general equilibrium effects. This can occur when actions taken by firms in the aggregate
influence the set of relevant input and output prices, inducing a change in the behavior of others. As a
consequence, a set of unexaggerated mitigation claims can be over-valued in the aggregate when the business-
as-usual baseline analysis is performed on a firm-by-firm basis. Burniaux and Martins (2000), Barker et al.
(2007), and Larson et al. (2008) provide reviews of the literature.
Because of the incentives for firms to exaggerate their mitigation claims and the technical challenges of fully
accounting for the secondary effects of project investments, negotiators decided that environmental
additionality would be tested on a project-by-project basis, rather than at a program level as some negotiators
had proposed.39 Moreover, the review would be undertaken under the guidance of an independent Executive
Board. This resulted in the current rules whereby the creation of credits requires both an initial approval of
the baseline (counter-factual) methodology and monitoring methodology by the Executive Board, and a final
certification of ex-post evidence that the mitigation had occurred.
The development objective and bilateral approval
As negotiations proceeded, there were several calls for a mechanism that would provide developing countries
with a stream of revenue that could be used to promote mitigation activities. Most notable was the 1997
―Brazilian proposal,‖ which envisioned penalties for countries that exceeded their pledged emission targets to
be paid into a clean development fund to support mitigation efforts in non-Annex I countries (Matsuo, 2003).
As the negotiations progressed, the idea of a central fund managed under the UNFCCC gave way to the
notion that individual projects would likely benefit developing countries by improving access to capital and by
fostering technology transfer. Consequently, it was left to host countries to determine on a case-by-case basis
whether an individual project contributed to the host country‘s development objectives.40
The decision resulted in a series of implementation protocols. For a project to go forward, project developers
must obtain a letter of approval from the host country government stating that the proposed CDM project
activity contributes to sustainable development. Project developers must seek approval from the investor
38 These questions have to do with economic additionality, the situation where the mitigation benefits exceed the private benefits of the investment. In so-called win-win projects, this is not the case. 39 Later rules were adopted to permit project developers to group coordinated action under in a single-project format, for both JI and CDM projects. The sets of actions, called a Program of Activities, usually involve small municipalities that coordinate mitigation efforts, for example, upgrading municipal waste facilities. A decision regarding the program was taken by the CDM Executive Board in June 2007. A similar program was established under JI in October 2009. See the UNFCCC website at http://cdm.unfccc.int/ProgrammeOfActivities/index.html and http://ji.unfccc.int/JI_PoA/index.html. 40 Though separate from the CDM, special funds such provisions of the Global Environment Facility and the Clean Technology Fund have been established to assist mitigation efforts in developing countries.

21
country as well, although it is only the host country that makes a determination of the project‘s
developmental impact. To make this practical, each country designates a responsible agency (known as the
designated national authority) to formally certify the project‘s contribution.
Not all designated authorities are equally efficient, so country-specific differences in transaction costs emerge.
Moreover, not all host countries were equally prompt in establishing a designated authority. Both factors have
likely influenced the skewed geographic distribution of projects discussed earlier.
Although the potential for the CDM to promote technology transfers motivated the mechanism‘s late
inclusion in the Kyoto Protocol, no formal mandate merged. Still, some project organizers claim to promote
transfers in the documents they present to the Executive Board. Based on an examination of 854 early
projects, Haites, Duan and Seres (2006) found that 81 percent of projects related to agriculture claim
technology transfer. By way of comparison, only 41 percent of wind-energy projects and 15 percent of hydro
projects in their sample claimed to have transferred technology.
Land management projects
Rule-making for sinks and land-use projects proved especially difficult. While most rules for the CDM were
in place following conferences in Bonn and Marrakech in 2001, it was not until a final set of rule-making in
2003 that the full set of guidelines for Land Use, Land-Use Change and Forestry (LULUCF) projects
emerged (Lecocq and Abrosi, 2007). The rules that did eventually emerge were cautious and restrictive, and
placed strict limits on the creation of land-use credits, and special restrictions that distinguished land-use
credits from the credits produced in other sectors.41
As discussed, land-use projects are technically complex since changes made to capture greenhouse gases can
initially release carbon into the atmosphere. A full accounting of the type required for most CDM projects
involves measuring the net change in carbon stocks for particular sites as well as any related increases in
emissions off-site, taking into account above-on-and-below-ground biomass and soil organic carbon. The
projects are also long-lived and subject to reversibility because of human activity such as logging or natural
events such as forest fires or disease. Consequently, many negotiators held deep reservations about whether
the projects would deliver sound and permanent environmental benefits. Added to this was a concern that
CDM-market economics would favor projects based on fast-growing industrial plantations, crowding out
projects that are community-based and that promote biodiversity (Hunt, 2008; Boyd, 2009).
In particular, current rules permit afforestation and reforestation projects but exclude projects designed to
slow deforestation.42 Moreover, rules limit the total amount of land-use CERs that can be used to meet Kyoto
obligations during the first commitment period to 5 percent of their base-year emissions; Bernoux et al.
(2002) estimate that this limits the market for CDM land-use credits to 11 MtCO2e for the first commitment
period.
To address reversibility, a new set of credits was created with a special set of rules. To start, net removals
from the project are certified every five years. Project developers can choose between two types of CERs:
Long-term CERs (lCERs), which expire at the end of the project‘s crediting periods, or temporary CERs
(tCERs) that expire at the end of the next commitment period. (For example, tCERs issued during the first
commitment period would expire at the end of the second commitment period.) If the project performs as
planned, new tCERs are issued to replace expiring ones until the end of the project‘s crediting period.
However, Annex B countries that use tCERs during the first commitment period have to replace them during
41 The fact that rules for LULUCF projects came late penalized this class of projects as well, since it left less time for the project to generate offsets by 2012, the close of the first commitment period. 42 Reforestation is the restoration of depleted forests, while afforestation is the conversion of other lands to forestlands.

22
the next commitment period with so-called permanent credits (for example AAUs or CERs from non-
LULUCF projects). The same restriction does not apply to the use of lCERs; however if the accumulated
stocks of stored carbon from a projects for which lCERs have been issued declines during the five-year
certifications, Annex-B countries must replace a proportional share of the lCERs that they used. If a project
fails to submit a certification report, all lCERs issued to the project must be replaced.
Consequences for pricing and profitability
Built to redress weaknesses related to business-as-usual counterfactuals, features of the project cycles also
influence a set of transaction costs that vary among types of projects. Because of this, the overall cost of
operating a project can be high even when abatement costs are themselves low. This is the case for
agricultural land-use projects, where the design of the CDM, the complex biochemistry of soil carbon
sequestration and the frequent need to coordinate the activities of many land-users combine to inflate
transactions costs. Moreover, many transaction costs are fixed and this works against small-scale projects in
general, and smallholder and community-based projects in particular (Michaelowa et al., 2003; Skutsch, 2005).
Drawing on Dudek and Wiener (1996) and Cacho, Marshall and Milne (2005), Cahco and Lipper (2007)
provide a topology of transaction costs for soil sequestration projects based on five categories: i) search and
negotiation; ii) board approval; iii) project management; iv) monitoring and v) enforcement and insurance.
Using this framework, the authors draw on published project reports for smallholder reforestation and
afforestation projects to calculate project transaction costs by category. They find disparate results with wide
differences among projects across all categories. They report search and negotiation costs ranging from
US$22,000 to $160,000; and approval costs from $12,000 to $120,000. Differences in monitoring costs were
remarkable, ranging from $5,000 to $270,000.43
As discussed, the formal rules associated with implementing projects also work to limit demand. For example,
in the case of CDM projects, limits on how CERs can be used under the EU ETS prevent full arbitrage
between the markets and consequently CDM credits trade at a discount to their European counter-parts.44
The restriction spills into formal markets for price discovery and risk management as well; for example, CERs
originating from land-use projects are excluded from the European Climate Exchange. Rules that exclude
projects from the CDM also shift some projects to voluntary markets where credits trade at a steep discount
to credits traded under the European Union ETS (EU ETS) or the CDM. For example while all carbon prices
fell dramatically in 2008 as global economic conditions worsened, spot prices for CDM offsets still remained
above US$15 tCO2e for most of 2009. By comparison, the World Bank (2010a) estimates that the price for
voluntary credits averaged less than US$5 per ton.
In addition, market sentiment disfavoring land-use projects appears to extend beyond the effects of the
formal rules. Outside of the CDM, this is revealed in the voluntary markets where offsets from land-use
projects sell at a discount to other types of mitigation projects. In their review, Hamilton et al. (2010) noted
that all of the over-the-counter agricultural soil credits they tracked originated on the Chicago Climate
Exchange and, in line with that market, traded for an average price of US$1.20 per ton; forest carbon offsets
sold for just under US$3 per ton and afforestation and reforestation credits sold for just over US$4 per ton,
on average.45
43 The authors found that enforcement and insurance costs were largely unreported. 44 For example, the EUA-CER price spread ranged between 2-3 Euros during the first 9 months of 2010. (CDM Climate Reserach, 2010) 45 As global economies slowed along with prospects for a US cap-and-trade, prices collapsed further and the Chicago Climate Exchange closed its doors in 2010.

23
Evidence of revealed preferences for particular types of projects can be found within formal CDM markets as
well, even though all types of tradable Kyoto offset units are notionally equivalent for the purpose of meeting
treaty obligations. For example, State and Trends of the Carbon Market (World Bank, 2010a) reports that
owners of the most desirable renewable energy projects often by pass exchange platforms where no
distinction made among CERs by origin in order to retain premiums of roughly 5 Euros per CER. A similar
price differentiation occurs via the private branding of CDM projects, as land-use projects are frequently
ineligible for some well-known third-party certification programs, including Gold Standard certification (Gold
Standard Foundation, 2010).
Taken together, the restrictions land-use projects face during the CDM cycle, the formal restrictions placed
on their use by governments, their disfavor among buyers, and higher transaction costs all work against the
economic viability of land-use projects.
VI. The links between ancillary benefits and sustainable rural development
For many, the limited scope for agricultural land-use projects under the CDM represents a missed
opportunity to finance sustainable development. This argument rests on two foundations. The first is the
already discussed normative view that has to do with the sector composition of current investment flows. The
notion here is that while the benefits of slowing climate change are especially important to the rural poor, the
current composition of projects favor the energy sectors and manufacturing and consequently have little
impact on this generation of the rural poor.46 The second set of arguments, explored in the next section, has
to do with the fundamental role played by soil carbon for agriculture, adaptation and soil fertility
management.
Soil carbon sequestration and productivity
Numeric studies suggest that the ancillary productivity benefits of adopting carbon sequestering farming
practices that come via higher yields are the dominant source of welfare gains for farmers working degraded
soils. This ordering of benefits results from a confluence of factors, primarily assumptions about the price of
agricultural outputs and inputs, the sequestration capacity of the soils, the price of carbon credits, and the
costs of monitoring sequestered carbon. Using indicative numbers, Graff-Zivin and Lipper (2008) estimated
that carbon-market related returns associated with switching from traditional to carbon-sequestering
conservation methods ranged from US$0.90 to $15 per hectare, amounts that are unlikely to motivate
changes in farming practices. To emphasize their point, the authors reference a study set in Senegal (FAO,
2004) that estimated the returns from marketable soil carbon credits amounted to less than four percent of
household income. In contrast, productivity benefits are often large. This is illustrated in table14. The table is
constructed from a study by Tennigkeit et al. (2009) that looks at a stylized carbon sequestration problem for
African maize on degraded soils under four farming practices. In all cases, the returns from improved yields
exceed the gains from carbon credit sales.
Another way to measure the ancillary benefits of land restoration is to examine the rate of return on land
restoration projects that do not include carbon financing. Sutton et al. (2008) give s two examples from the
region: the Anatolia watershed rehabilitation project in Turkey, and a project in Uzbekistan to reduce soil
salinity. The project in Turkey combines a World Bank loan and a GEF grant to promote new farming and
forestry production practices, to raise land productivity, and to reduce nutrient discharge from agricultural
sources into the Black Sea and to strengthen related institutions for planning and resource management,
especially community-based groups. The land management activities are likely to generate mitigation gains,
but these benefits are not included when the project returns are calculated. Nonetheless, the economic return
46 See, for example, Sirohi (2007) who looks at the composition of CDM investments in India.

24
to the project is estimated at 19 percent. The second project, in Uzbekistan, aims to restores soils by reducing
salinity levels on about 100,000 hectares and expanding protective wetlands. Increases in soil carbon are likely
to result from the project; however, the project still generates a 20 percent economic rate of return even when
soil sequestration benefits are excluded.
It is also worth mentioning that carbon sequestration can be an ancillary benefit of research and extension
efforts activities focused on other objectives. For example, the development of farming approaches that
conserve soil moisture or soil nutrients can generate costs savings for farmers and deliver sequestration as
well. Developing new high-yielding seeds that promote intensification can lead also to positive ―leakages‖
when, in the aggregate, they reduce the conversion of forests to farmland. Moreover, though a sharp
distinction is made between mitigation and adaptation under the UNFCCC framework, the distinctions blur
in the case of land-use activities, since approaches that conserve soil nutrients or results in better soil moisture
management also contribute to greater resilience in the face of climate change. This implies an important role
for government-supported agricultural research that has resource management and sustainability objectives in
mind. A recent World Bank (2010b) points to Brazil‘s efforts in low fertility Cerrados areas as an example of
sponsored research that jointly promotes productivity, adaptation and mitigation. However, even without
accounting for positive co-benefits for mitigation and adaptation, the returns to agricultural research and
extension are high. Sutton et al. (2008) note that rates of return for agricultural extension in the twelve
countries of Eastern Europe, Caucasus and Central Asia ranged from 16 percent to an astounding 200
percent.
Carbon sequestration and other environmental services
Daily (1997), cited in Heal and Small (2002: 1347), provides a taxonomy for the types of benefits or services,
that ecosystems provide. Most are closely associated with agriculture. Some are better measured than others
and most of them are also interconnected.47 Broadly, ecosystem services are divided into four different types
(MEA 2005): i) provisioning services, mainly associated with production of food, fiber, fresh water, and
hydropower; ii) regulating services, mainly associated with affecting environmental conditions that include
flow regulation, recharge groundwater basins, water quality regulation, climate regulation, air quality, and
carbon sequestration; iii) cultural services, mainly associated with recreation and ecotourism, aesthetic values,
spiritual renewal, religious and cultural values; and supporting services, mainly associated with soil formation
and fertility, photosynthesis, nutrient cycling and water cycling.
Because agriculture depends on ecosystem services, differences among farming practices have different
consequences for related services. And in some instances, positive externalities associated with farming
practices can be used to earn a premium based on consumer preferences – for example, ―bird-friendly‖ coffee
grown in a way that encourages biodiversity can command a higher price in niche markets. Even so, there are
often disparities between what consumers are willing to pay and the notional values of the associated
environmental service or the cost of providing it. 48. Efforts have been made to market carbon in a similar
way and some third-party certifications focus on processes that safeguard the environmental integrity of the
project credits. However, early evidence suggests that labels or certifications are of secondary importance for
project credit pricing (Conte and Kotchen, 2009).
47 The list includes: control of the vast majority of potential agricultural pests; cycling and movement of nutrients; detoxification and decomposition of wastes; dispersal of seeds; generation and preservation of soils and renewal of their fertility; maintenance of biodiversity; mitigation of droughts and floods; moderation of weather extremes and their impacts; pollination of crops and natural vegetation; protection from the sun's harmful ultraviolet rays; protection of coastal shores from erosion by waves; provision of aesthetic beauty and intellectual stimulation that lift the human spirit; purification of air and water; stabilization of the climate. 48 See, for example, the discussion in Moon et al. (2002).

25
As Antle and Capalbo (2002) point out, many important phenomena in agriculture involve the behavior of
complex systems whose behavior is affected by the interactions of two or more subsystems. In turn, because
ecosystem services are interweaved, policies that address only one particular service or a subset of services
may lead to distortive outcomes. Said in a different way, because agriculture is a complex and interactive
system, creating an incentive mechanism that pays for only one stream of natural resource services may lead
to perverse and unexpected outcomes when the payments affect other services adversely. In the particular
context of carbon sequestration, the modification of management practices changes the overall economic
profitability of their business as well as the level of externality impact on the natural system (Antle and
Diagana, 2003; Pfaff et al. 2000). In some instances, the positive aspects of improving soil carbon
complement other environmental services such as the provision of water resources. However, this is not
guaranteed.
A generalization of the idea of paying for greenhouse gas mitigation is the idea of paying farmers or
communities directly for undertaking a range of activities that safeguard environmental resources. For
example, payments for environmental services (PES) have been used for protecting municipal water supplies
in Colombia, Mexico, Ecuador and El Salvador (Pagiola, Arcenas and Platais, 2004). And in the case of Costa
Rica, PES programs have been used to encourage carbon sequestration while simultaneously protecting
watersheds, biodiversity and scenic beauty (Wunder, Engel and Pagiola, 2008).49 The approach is attractive
since conservation outcomes are rewarded directly. Moreover, it also provides a mechanism for harnessing
revenue from dispersed beneficiaries to pay for local activities that generate positive externalities, which is
itself an underlying motive for the CDM.
A case study of how carbon income incentives affect projects with multiple objectives is given by Nelson and
de Jong (2003) and Lövbrand, Rindefjäll and Nordqvist (2009); both papers discuss Scolel Té, a land-use
agro-forestry sequestration project in Chiapas, Mexico established under a United States sponsored pilot
project and part of the UNFCCC‘s Activities Implemented Jointly (AIJ) program.50 The pilot featured a mix
of community development and environmental objectives organized around a local trust fund (Fondo
Bilclimatico), established in 1997 to broker carbon contracts between farmers and the voluntary carbon
market. Under the AIJ, carbon credits were not eligible for credit against future greenhouse gas reduction
commitments, but long-lived programs were eligible for conversion under the CDM once it was established.
An effort was made in 2002 to assess the project‘s eligibility for conversion. Although the project currently
remains outside of the CDM, Lövbrand, Rindefjäll and Nordqvist (2009) argue that efforts to make the
project viable under the CDM have resulted in a shift in emphasis away from the social and environmental
objectives toward the provisioning of carbon sequestration.
As discussed, one of the hurdles with carbon sequestration projects has to do with the cost of coordinating
actions among a large number of project participants. And one characteristic of PES systems is that they
provide a shared mechanism for delivering payments for services. Shared organizational structures can be put
to other uses as well. An example is Niger‘s Community Action plan, designed to organize local government
to deliver services that promote development. In this case, the program promotes social protection, the build-
up of local infrastructure, in addition to pilot soil conservation and afforestation projects (World Bank, 2010).
49 See also a comparative analysis pf PES systems by Wunder, Engel and Pagiola (2008) and a review of PES efforts in Brazil‘s Amazonia by Hall (2008). 50 The AIJ program was a voluntary predecessor of the CDM, established as an umbrella framework for national voluntary mitigation pilot projects. See Larson and Breustedt (2009).

26
To date, most PES programs are located in Latin America and Africa, with few examples in ECA. The World
Bank has invested in 14 PES projects, but none are located in ECA. 51 And, while the theory of PES projects
systems is straightforward, broad evidence as to their efficacy is limited (Pattanayak, et al., 2010). Still, several
studies regional studies report many opportunities for land and water resource management programs that
take advantage of PES systems, a portion of which could be financed by carbon offset payments. This is
especially true in dryland areas and in places where soils are degraded (IFPRI, 2007; Thomas, 2008).
Blending PES and carbon markets
In this section we explore three land restoration and soil conservation projects hosted in ECA that blend
features of PES systems with carbon financing and standard development project approaches long used by
multilateral investment banks. The three projects are expected to lead to carbon sequestration while
generating significant co-benefits, including improvements in agricultural productivity. As discussed, the
sequestration of carbon through improved land management represents a large portion of low-cost mitigation
potential globally. Moreover, land degradation is a pervasive problem in the ECA region, so there ample
opportunity to replicate the projects described in this section. Even so, land restoration and soil conservation
projects are rare among the CDM and JI projects.
The three projects are: the Assisted Natural Regeneration of Degraded Lands in Albania; the Moldova Soil
Conservation Project; and the Moldova Community Forestry Development Project. The first two projects are
registered under the CDM, while the Moldova Community Forestry Development project is in the CDM
pipeline, but awaits registration (as of August 2011).
A core task of the Albanian project is to transform badly eroded lands into broadleaf forests of native species
(World Bank, 2005, 2011a). The project is expected to benefit over 80,000 people in a variety of ways,
including directly through the sale of project carbon credits, short-term and long-term (up to 20 years)
employment, improved productivity, access to firewood and other forest products, cleaner water, reduced
siltation in reservoirs, and protection from flooding and erosion. Broader public goods include an improved
habitat for native flora and fauna and reduced sediment runoff to the Adriatic Sea. The challenges of
coordinating stakeholders are significant, since 218 communes are involved in the project. Even so, the
mitigation component of the Albanian project is relatively small. The project is expected to sequester 140,000
tCO2e by 2012 and 250,000 tCO2e by 2017. This is because the sequestration is measured on only 6,000
hectares managed by 30 communes, even though the project itself is expected to result in the better
management of 660,000 of forest and pasture land. The expected project costs totaled $US 19.4 million, made
up of contributions by the Government of Albania, the Swedish International development cooperation
Agency, the GEF, and the World Bank.
The Soil Conservation project in Moldova is expected to establish forests on nearly 15,000 hectares of
degraded agricultural land on nearly 1,900 plots located in 151 local communities (World Bank, 2004 and
2011a). The project‘s main objective is to conserve and improve the productivity of agricultural soils by
planting shrubs and trees, but the project is expected to generate other benefits, including access to fuel wood
and other forestry products by household in nearby communities, and global biodiversity benefits. The
project would also sequester 1.22 MtCO2e by 2012 and 2.51 MtCO2e by 2017. The project includes financing
from a World Bank loan, and grants from the Government of Japan and funding from one of the Bank‘s
carbon funds.
51For more, visit: http://go.worldbank.org/51KUO12O50. However, the GEF, which the Bank co-hosts with UNEP, has partially funded a project, managed by the World Wildlife Fund, that works with local communities in Bulgaria and Romania to protect the Danube watershed.

27
The second project in Moldova is largely a replication of the first project, which was viewed as highly
successful by the Government of Moldova (World Bank, 2009 and 2011a). Again the main objective of the
project is to provide protective forest belts in order to reduce erosions, landslides and thereby protect
agricultural soils, but co-benefits from access to forestry products and restored habitats are expected as well.
The project involves the coordination action of 264 local communities and is expected to sequester 229,000
tCO2e by 2012 and 697,000 tCO2e by 2017.
The projects have common features that the Kyoto project structure cannot easily accommodate. To start,
the projects deal with reforestation, afforestation and soil sequestration which entail measurement hurdles.
The credits that they produce are subject to special rules and face discrimination among eventual end-users.
They all involve a large number of stakeholders. Moreover, because some of the land was abandoned or went
unclaimed during land privatization, ownership remains with public entities, some of which have little
capacity to adequately manage and monitor project activities and the disbursement of credit funds. Both the
large number of participants and weak capacity of the governing entities add to transaction costs. At the same
time, the projects generate significant direct and indirect benefits, even though these are hard to value. To
make the projects work, the Governments of Albania and Moldova, together with the World Bank and other
donors funded the projects primarily from non-carbon-market sources, using the relatively small flow of
revenue from carbon sales as a source of supplemental funding or as a source of payments to communities as
an incentive to pursue land management protocols.
VII. The potential for complementary climate change and resource management policies
To summarize from the previous sections, there is a consensus view that agriculture contributes significantly
to flow of greenhouse gases emitted from Eastern Europe and Central Asia countries, although for most
countries in the region emissions from the energy sector dwarf those from agriculture. Similarly, there is
considerable potential for mitigation in the sector, especially at low costs. During the last decade, the
international community has relied heavily on project-based investments to slow GHG emissions, primarily
via the twin Kyoto project mechanisms, Joint Implementation and the Clean Development Mechanism. Both
mechanisms are relevant for ECA and have successfully promoted investment flows in the region. With
respect to agriculture, project-mitigation works well on a global scale for certain types of mitigation efforts in
agriculture, mostly projects that manage organic wastes from livestock and agricultural processing, and
projects that use agricultural by-products to produce energy. Land-use projects are less well suited to the
project format and therefore subject to high transaction costs. This is due to the complex nature of carbon
sequestration in soils and also the frequent need to coordinate actions across many households in areas where
land institutions are weak. Moreover, current rules about creating land-use credits and using them work
against soil carbon sequestration projects.
Evidence suggests that the gains from carbon sequestration, a global benefit, are small relative to local
benefits to communities and agricultural households. Consequently, it makes little sense to organize land-use
projects around carbon benefits per se. At the same time, what distinguishes carbon mitigation efforts from
the provision of other ecosystem services from land and water resources is the availability of global markets
and financing mechanisms for funding carbon mitigation services.
Taken altogether, this suggests countries in the region pursue separate but coordinated policies in which
governments actively facilitate private-sector investment in mitigation projects to manage the region‘s
growing need to manage methane and other emissions from livestock operations and agricultural processors,
while also pursuing a policy that uses carbon financing to supplement natural resource management and the
restoration of degraded lands. A key component of the first leg of the coordinated strategy is to promote a
business environment that facilitates private investment, domestic or foreign, in mitigation projects. A key

28
component of the second strategy will be finding a comprehensive approach to landscape management that
overcomes coordination problems and opportunistically takes advantage of carbon finance streams.
Promoting private project investment
Early on, negotiators of the Kyoto Protocol saw the two project-based mechanisms as a form of direct
bilateral foreign investment, with firms or governments in countries with pledged commitments acquiring
offsets by participating directly in projects hosted in developing countries under the CDM and transition
countries under JI. As discussed in the section on new markets, alternative investment structures emerged.
Often, companies and governments purchase shares of a pool of projects in order to better manage project
risks and to avoid the direct costs of managing individual projects. In the case of large projects, funding
frequently comes from multiple sources as well. Consequently, in a strictest sense, an ―investing country‖ is
the country responsible for certifying the conditions for a CDM or JI projects have been met, rather than the
source of funding. In addition, there have been a number of so-called ―unilateral‖ projects, where the project
is organized and often financed by firms, governments or other entities in the host country. In the case of
CDM projects, the investments are speculative, since the underlying CERs have no domestic use.
The pie charts in figures 17 and 18 show the sources of investment for the CDM and JI offsets expected
from current projects by 2012.52 Globally, about 62 percent of project offsets are funded by financing flowing
through the UK, Switzerland, Japan, or the Netherlands; another 15 percent of offsets come from unilateral
projects. For ECA projects, unilateral projects account for about 27 percent of anticipated offsets. The
Netherlands, the UK, Denmark, Japan and Switzerland account for another 56 percent.
It seems reasonable to think that both the general investment environment and the specific institutions
related to carbon markets should influence the location of investments. However, in the case of ECA these
relationships are hard to discern. For example, figure 19 reports on six key business environment indicators
that are based on firm surveys. Two of the indicators reflect firm views about governance: whether the head
of the firm thinks that the domestic court system is fair and impartial; and whether corruption is a problem
for doing business. The remaining four indicators have to do with firm characteristics: whether any foreign
investors have an ownership stake in the firm; whether a third-party certifies the quality of the goods or
services produced by the firm; whether the firm has a line of credit available to it; and whether the firm
reports a financial statement that has been audited by an outside accounting firm. The bars in the graph
correspond to the percentage of surveyed firms that answer in the affirmative.
All things equal, direct foreign investment should be higher when governance is good and where firms have
access to credit and where third parties verify the quality of their output and the veracity of their financial
statements. The number of firms with foreign participation is an outcome, which hints at the overall climate
for foreign investors. However, when averages are calculated over the countries that host investment projects
and those that do not, it is difficult to distinguish between the two sets of averages. Nor is there a clear
distinction between ECA and other regions.
The same is true when a measure of climate-related institutions is used. Figure 20 reports on the Climate
Laws, Institutions and Measures (CLIM) index, ―a comparative assessment of the extensiveness and quality of
climate change mitigation legislation, policies, measures and institutions project investment under the CDM
and JI programs‖ (EBRD 2011, p. 61).53 The index is bounded between zero and one, with a higher value
indicated an institutional environment more conducive to project investment. The figure ranks the ECA
52 In the case of multiple investing countries, the expected offsets were allocated equally among countries to facilitate calculations. 53 For details about the index, seeTeytelboym and Steves (forthcoming).

29
countries by the value of the index, separated into two groups. The upper portion of the figure (starting with
the Czech Republic and ending with Azerbaijan) includes the countries that host projects, while the lower
portion reports on countries do not. The countries with projects report a higher average score (0.35 versus
0.28), but there is considerably more variability within each group than there is between the groups.
One possible explanation why it is difficult to see a link between good institutions, which are expected to
influence direct investment outcomes, is that private firms often take a back seat to governments and
international organizations in the preparation of projects under JI and the CDM. Figure 21 reports on the
participation of foreign investors in CDM and JI projects by region. For the purpose of the graph, projects
were divided into three classifications. Keeping in mind that projects can have multiple investors, the three
categories include: a) projects where the buyers are all private foreign firms; b) projects in which private firms
did not participate; and c) partnership projects in which private firms purchased a portion of the credits and
governments or multilateral public institutions, such as the World Bank, purchased the remaining shares. As
the figure shows, about half of the projects were structured as foreign direct investments. Another 2 percent
of the projects were partnerships. The remaining projects were structured as unilateral projects. The figure
also shows that the investment structure in ECA is not so different from other sectors. Indeed, it is only in
East Asia Pacific region where most projects are organized around foreign investors.
When the CDM and JI mechanisms were first introduced, proponents argued that the two programs would
benefit developing and transitional economies in two ways: first, by providing an inflow of foreign capital
and, second, by facilitation a transfer of technology. The prevalence of unilateral projects suggests that project
organizers were often able to raise capital locally. However, it is hard to determine whether know-how
accompanied the capital. In contrast, it is clear that foreign project investors brought considerable experience
with them.
Table 15 reports on the 15 most frequently found investment structures in the region. Together, unilateral
projects in the three countries at the top of the figure and the governments, multilateral agencies and private
firms reported in the lower sections account for about 45 percent of the projects. As discussed, many of the
regions‘ projects are unilateral and the figure indicates that many are in the Czech Republic, Russia and
Lithuania. The Czech projects are mostly landfill projects with the participation of municipalities, while the
projects in Russia and Lithuania are more varied. The Governments of Denmark, the Netherlands and Spain
are all significant investors in ECA projects, as are the World Bank, the EBRD and the Nordic Climate
Facility, a special investment program financed by the Nordic Development Fund. Among the private firms
with significant presence in the region, Global Carbon, Camco, and Stichting Carbon Finance are all firms
that specialize in carbon markets. Carbon-TF specialized in gas emissions from coal mine; the Mitsubishi
Group is a large Japanese Conglomerate and Kommunalkredit is a government-owned Austrian infrastructure
bank with a consulting subsidiary that manages CDM and JI projects.
The column to the far right of the table lists the number of projects outside of ECA that the listed investors
participated in. What the table makes clear is that foreign investors bring with them experience from other
regions. This is not necessarily the same as technical expertise of the type the two mechanisms were intended
to promote, but it does suggest that foreign participation brings with it the potential of lessons learned
through experience.
The same point is illustrated in a different way in figure 22. The graph shows the experience of project
investors in ECA by type of investor. The underlying data is calculated by adding the number of projects that
an investing firm, country or agency had participated in at the start of each CDM or JI project. In the case of
a unilateral project, experience is determined by the number of previous unilateral projects in the host
country. Private firms and public investors (countries and multilateral organizations) may have project

30
experience in regions other than ECA and the figure reports this type of experience as well.54 The graph
shows that private firms and public entities brought considerable experience from projects outside of the
region when they invested in ECA. By the start of 2011, the average firm investing in ECA had participated
in more than 25 projects outside of the region; investing public entities had, on average, invested in more
than 35. Public institutions were also experienced with regional projects as well. At the same time, many of
the private firms investing in ECA did not build up significant regional experience, while experience with
unilateral projects in the region built over time.
Alternative financing for an integrated approach
As discussed earlier, PES systems can be organized to reward multiple objectives, such as the preservation of
biodiversity or the safeguarding of water supplies, and several examples of comprehensive systems are given
in an earlier section. In this sense, CDM, and JI projects can be viewed as a class of PES systems that pays for
carbon mitigation, a particular type of environmental service. However, the funding of carbon mitigation
projects is organized differently, since the Kyoto Protocol creates incentives for private payments. As
discussed, for bio-energy and waste-management projects, there are few co-benefits beyond mitigation
benefits and therefore the pricing mechanism is well suited. At the other extreme, activities and investments
may generate mitigation benefits that are small in comparisons to environmental or poverty-reduction
benefits and, as a practical matter, these can be ignored when policy instruments are designed. Still, evidence
suggests that some agricultural land-use projects fall into an intermediate group with significant mitigation
potential that also provide significant ancillary services whose financing is left to governments, international
organizations and voluntary organizations. These sources are likely constrained, so, as a consequence, land-
use projects will be under-funded even if the private sector adequately funds sequestration. Fortunately, there
are old and new mechanisms that could be harnessed to better fund agricultural land-use projects, which we
explore in this section.55
The first has to do with innovations in carbon funds. While it is difficult to find examples of mechanisms that
leverage carbon revenue streams to finance the full set of benefits from land-use projects, several funds
pursue multiple objectives linked to conservation and the promotion of sustainable agriculture and
development. Examples include the BioCarbon Fund, the Community Development Carbon Fund, both
managed by the World Bank, and the World Wildlife Fund‘s conservation-carbon-finance projects.
In addition, multi-donor financing mechanisms have been established in recent years that can be used to
supplement land-use mitigation activities. The largest and oldest is the Global Environmental Facility (GEF),
a grant-making institution established in 1991 as a pilot project within the World Bank. The institution is now
the financing instrument for the UNFCCC, as well as several other environmental conventions.56 Though the
GEF climate program is diffused across capacity building and adaptation programs, there is scope for
mitigation activities and, in the case of agriculture, there is overlap with land management efforts designed to
slow desertification that are also managed by the GEF.
54 The European Bank for Reconstruction and Development, the World Bank, and the Nordic Climate Facility are the international organizations investing in ECA. 55 One hurdle to any crediting of sequestered carbon is the issue of measurement. As discussed in the context of the Albania and Moldova CDM projects, there are approved CDM methodologies and toolkits available. Those three projects rely on two CDM methodologies, AR-AM002 and AR-AM003. More to the point, all parties to the UNFCCC provide an accounting of the net emissions inclusive of carbon sinks. In the case of the countries that have pledged emission reductions, this accounting has real effects since it helps determine the country‘s net emissions and consequently whether the country has a surplus or deficit of AAUs. Lokupitiya and Paustina (2006) review how carbon in agricultural soil is accounted for when national inventories are calculated. 56 Included are the Convention on Biological Diversity, the Stockholm Convention on Persistent Organic Pollutants, and the UN Convention to Combat Desertification.

31
In 2008, two climate investment funds were established under UNFCCC auspices.57 The Clean Technology
Fund is designed to speed up the transfer and deployment of low-carbon technologies in order to slow
greenhouse gas emissions. The programs are designed and implemented by countries with assistance from the
Regional Development Banks and the World Bank Group. Fourteen country and regional plans were
endorsed through 2010, funding US$4.4 billion in programs. Potentially, the fund could be tapped to address
land-use mitigation efforts, although that has not yet occurred (World Bank, 2010).
The second fund, the Strategic Climate Fund, funds programs in three areas relevant for agriculture. The first
is the Forest Investment Program (FIP), which is intended to support developing countries efforts to stem
deforestation and forest degradation. The program is also meant to build-up experience in anticipation of
REDD (reduced emissions from deforestation and degradation). The program funds efforts to encourage
alternatives to extensive agricultural practices that can drive deforestation. A second pilot program for climate
resilience (PPCR) is meant to integrate adaptation efforts into development planning and implementation.
However, the program has relevance to out discussion, because some adaptation activities also lead to
mitigation outcomes. For example, the Niger program discussed above is partially finance by the PPCR
(World Bank, 2010). The third window, Scaling up Renewable Energy (SREP), promotes renewable energy
projects, including biomass energy pilots in rural areas.
Another potential source of financing is more recent. In the area of mitigation, COPs in Copenhagen and
Cancun have focused on voluntary steps that developing countries can take to slow emissions or improve
sinks, and on new vehicles to finance those mitigation efforts.58 As part of that process, developing countries
have been asked to submit a list of policies, programs and projects designed to mitigate domestic emissions,
which are known as Nationally Appropriate Mitigation Actions (NAMAs). As of March 2012, 45 countries
had signaled their intention to undertake domestic mitigation in some form.59 In the context of NAMAs,
agriculture is a natural area of focus for many of the countries because of the links between land-
management, soil fertility and rural development. For example, in its NAMA, the Government of Ethiopia
proposes projects that would add compost to agricultural lands and implement agro-forestry projects to
improve rural livelihoods and sequester carbon in soils.
A related Green Climate Fund was introduced in Copenhagen and approved in Cancun that might provide
direct funding to developing country governments for adaptation and mitigation efforts under NAMAs.
Another idea, introduced by the Government of New Zealand, would be to finance NAMAs using tradable
credits similar to CERs (Macey, 2009).
Among JI countries, there is also a potential to use revenues generated from the sale of AAUs to finance
broader natural resource management schemes, including land restoration and soil conservation projects. The
approach of pledging the proceeds from AAU sales for investments in environmental projects is often
referred to as a ―green investment scheme‖ (GIS). Doing so tends to boost the value of AAUs and counters
the stigma associated with so-called ―hot air‖ credits generated by the economic restructuring of transition
economies. GIS programs are entirely voluntary and have been implement in a number of ECA countries,
including Bulgaria, the Czech Republic, Estonia, Hungary, Latvia, Poland, Romania, Russia, Slovakia, and the
Ukraine (Tuerk et al. 2010; Boyd and Salzman, 2011). Often, the schemes target areas not well suited for JI
57 The funds operate as trust funds administered by the World Bank. CIF stakeholders include the Multilateral Development Banks, UN and UN agencies, Global Environment Facility (GEF), UN Framework Convention on Climate Change (UNFCCC), Adaptation Fund, Bilateral Development Agencies, Non-Governmental Organizations, Indigenous Peoples, Private Sector Entities, and Scientific and Technical Experts 58 Each year, the UNFCCC holds a meeting of its members, known as a Conference of the Parties (COP). 59An updated list of NAMAs is available on the Internet at: www.unfccc.int/home/items/5265.php.

32
investments, especially improving building energy efficiency and forestry. For example, Bulgaria‘s GIS
program emphasizes land-use.
VIII. Conclusions
The agricultural sectors of ECA offer abundant low-cost opportunities to slow the accumulation of
anthropogenic greenhouse gases in the Earth‘s atmosphere. Moreover, in contrast to activities in other
sectors, mitigation activities in agriculture often generate positive co-benefits rather than stark trade-offs
between mitigation and economic growth. Still, most GHG emissions stem from how energy is created and
used. As a consequence, the international treaties, domestic policies and the institutions that have grown up
around them have been largely shaped by the sector and this, in turn, has influenced the mitigation policy
instruments available to governments.
Of particular importance for mitigation efforts in the region are two project-based mechanisms under the
UNFCCC, Joint Implementation and the Clean Development Mechanism. These programs can be leveraged
by policy to provide a way for governments and private firms to invest in projects that reduce net emissions
in other countries, including ECA countries, and thereby meet a portion of their Kyoto Protocol
commitments. The twin mechanisms have been effective in driving investments in mitigation projects
worldwide, including projects in agriculture sectors, but they are underutilized by many ECA countries.
Among the low-cost mitigation opportunities identified by researchers and reviewed in IPCCC reports, are
two broad classes of agricultural activities of comparable size: the first relates to how residuals and wastes
from agricultural processes are managed and used as alternative sources of energy; the second includes land-
use activities that sequester greenhouse gases in soils and plants. Projects of the first type are well suited to
project-style interventions. This class of projects is a popular investment vehicle in countries outside of the
region and there is significant scope for similar projects in the region if a project framework is extended post
2012. Moreover, this potential for this class of projects will likely grow as the commercialization of the
region‘s livestock industry continues. Still, closing the gap between the region‘s significant mitigation potential
and the currently limited rates of mitigation in agriculture will require tapping the mitigation potential tied to
agricultural land, including agricultural land in ECA that has been abandoned.
For many reasons, land projects fit less well into project framework, and there are few successful land
projects in JI or the CDM worldwide. For one, the sequestration processes can be reversed by future events,
natural or man-made. Moreover, the bio-chemistry of soil sequestration is complex and place-dependent,
making exact measurement difficult. Safeguards put in place intended to address reversibility and
measurement difficulties add to the cost of implementing land-use projects, as does the frequent need to
coordinate land-use activities across many stakeholders. Because of skepticism about the environment
integrity of land-use projects, restrictions have been placed on how land-use credits can be used, under-
cutting demand. Moreover, even in voluntary markets where the effects of formal restrictions are indirect,
buyers discount offsets from land-use projects. Taken together, these multiple factors encourage potential
investors in offset projects to look elsewhere. What‘s more, activities taken to halt losses from already existing
stores of carbon in soils or forests do not qualify for project-based support. This is especially significant in
ECA, where large pools of carbon are stored above and below ground on unmanaged lands.
Potentially, current rules governing land-use mitigation and the preservation of carbon pools could be
modified, an outcome that ECA countries can influence as Parties to the UNFCCC. One anticipated change
is adding incentives to protect against increased emissions due to deforestation, under so-called REDD
initiatives. These initiatives could be extended to protect soil carbon as well. Potentially, the rules governing
UNFCCC land-use projects could also be modified to lower transaction costs. For example, the same
methodologies countries use to calculate the net effects of land-use changes on carbon sinks for national

33
GHG inventories, which in turn influence the net demand for CDM credits, could be adapted to assess the
benefits of land-use projects.
Even so, the task of managing land resources perhaps fits best within a cluster of national policies. This is
especially the case in ECA, where large spans of degraded land, which create ancillary problems for water and
soil resources, could be restored for productive use.
Agricultural policies, natural resource management policies and climate change policies are closely linked, and
actions taken with the intent to influence outcomes in one domain often have consequences for the others,
which is why a coordinated set of policies can be effective. In the case of good agricultural policy, activities
pursued to promote sustainable growth can generate largely unintended mitigation benefits. For example,
strengthen land markets can encourage land owners to better manage their cropland and pastureland for their
own benefits, but with the consequence that soil- carbon is built up as well. Good natural resource
management can work in the same way. For example, setting aside forests in order to preserve endangered
plants and animals also prevents the release of carbon stored in the forest‘s plants and soils.
Even so, GHG mitigation efforts are unique, in that they are supported by carbon markets and incentives to
invest in mitigation projects, a consequence of the Kyoto Protocol‘s flexibility mechanisms. This opens the
door for using mitigation finance streams to supplement the costs of projects designed to deliver multiple
pubic goods. Positive lessons on how to do this can be found in ECA countries, where public and private
financing has been combined to restore degraded lands. National governments have the largest stake in
managing their natural resources, but the global community benefits as well, since these activities promote
biodiversity and reclaim land and water resources that sustain a global food system. Natural resource
management plans, linked with good agricultural policy and national mitigation and adaptation plans, can help
identify local and global needs and benefits and provide a framework for organizing and financing joint
efforts.
Bibliography
Antle, John M. and Bocar Diagana. 2003. Creating incentives for the adoption of sustainable agricultural
practices in developing countries: The Role of Soil Carbon Sequestration. American Journal of
Agricultural Economics 85(5), 1178-1184.
Antle, John M. and Susan Capalbo. 2002. Agriculture as a Managed Ecosystem: Policy Implications, Journal of
Agricultural and Resource Economics 27(1):1–15.
Barker, Terry, Igor Bashmakov, Awwad Alharthi, Markus Amann, Luis Cifuentes, John Drexhage, Maosheng
Duan, Ottmar Edenhofer, Brian Flannery, Michael Grubb, Monique Hoogwijk, Francis I. Ibitoye,
Catrimus J. Jepma, William A. Pizer, Kenji Yamaji. 2007. Mitigation from a cross-sectoral perspective. In
Metz, Bert Ogunlade R. Davidson, Peter R. Bosch, Rutu Dave and Leo A. Meyer (eds). Climate Change
2007: Mitigation. Contribution of Working Group III to the Fourth Assessment Report of the
Intergovernmental Panel on Climated Change. Canbridge Universtiy Press, Cambridge and New York.
Bernoux Martial, Vincent Eschenbrenner, Carlos C. Cerri, Jerry M. Melillo, and Christian Feller. 2002.
LULUCF-based CDM: too much ado for a small carbon market. Climate Policy 2(4), 379-385.
Boyd, Emily. 2009. Governing the Clean Development Mechanism: global rhetoric versus local realities in
carbon sequestration projects. Environment and Planning A 41(10) 2380 – 2395.
Boyd, William and James Salzman. 2011. The curious case of greening in carbon markets. Environmental
Law, 41(73), 73-94.

34
Burniaux, Jean-Marc and Joaquim Oliveira Martins. 2000. Carbon emission leakages: a general equilibrium
view. OECD Economics Department Working Papers: 242. Paris: Organization for Economic Co-
operation and Development.
Cacho, O.J. Marshall, G.R. and Milne, M. 2005. Transaction and abatement costs of carbon-sink projects in
developing countries. Environment and Development Economics. 10(5): 1-18.
Cacho, Oscar J. and Leslie Lipper. 2007. Abatement and transaction costs of carbon-sink projects involving
smallholders. Fondazione Eni Enrico Mattei Working Paper 32. Milano: Fondazione Eni Enrio Mattei.
CBD. 2009. Secretariat of the Convention on Biological Diversity. Connecting Biodiversity and Climate
Change Mitigation and Adaptation: Report of the Second Ad Hoc Technical Expert Group on
Biodiversity and Climate Change. Montreal, Technical Series No. 41.
CDM Climate Research. 2010. Tendances Carbone 51 (October). Arcueil, France.
Chomitz, Kenneth M. 1999. Evaluating carbon offsets from forestry and energy projects: how do they
compare? Policy Research Working Paper Series 2357. World Bank, Washington.
Conte, Marc N. and Matthew J. Kotchen. 2009. Explaining the price of voluntary carbon offsets. NBER
Working Paper 15294. Cambridge, MA: National Bureau of Economic Research.
Convery, Frank J. and Luke Redmond. 2007. Market and price developments in the European Union
Emissions Trading Scheme. Review of Environmental Economics and Policy 1(1), 88-111.
Cullet, Philippe and Annie-Patricia Kameri-Mbote. 1998. Joint Implementation and forestry projects:
conceptual and operational fallacies. International Affairs 74(2), 393-408.
Daily, G.C. (ed.) (1997.) Nature's Services: Societal Dependence on Natural Ecosystems (Island Press,
Washington, DC).
DEFRA. 2008. Draft Code of Best Practice for Carbon Offset Providers Accreditation requirements and
procedures. Department for Environment, Food and Rural Affairs. London.
den Elzen, Michel G. J. and S. Both. 2002. Modeling emissions trading and abatement costs in FAIR 1.1 case
study: the Kyoto Protocol under the Bonn-Marrakesh Agreement. RIVM report 728001021/2002.
National Institute of Public Health and the Environment, Bilthoven, the Netherlands.
Dudek, D.J. and Wienar, J.B. 1996. Joint implementation, transaction costs, and climate change. Paris
Organisation for Economic Co-operation and Development,.
EBRD. 2011. The Low Carbon Transition. London: European Bank for Reconstruction and Development.
EPA. 2007. Inventory of U.S. Greenhouse Gas Emissions and Sinks: Fast Facts 1990-2005. Conversion
Factors to Energy Units (Heat Equivalents) Heat Contents and Carbon Content Coefficients of Various
Fuel Types. Washington: U.S. Environmental Protection Agency, USEPA #430-R-07-002 (PDF)
Europa. 2007. Emission Trading Scheme (EU ETS). Available on the internet at: http:\ec.europa.eu.
FAO. 2000. Land Resource Potential and Constraints at Regional and Country Levels. Rome: Food and
Agriculture Organization.
FAO. 2004. Carbon sequestration in dryland soils, World Soil Resources Report No 102. Rome: Food and
Agricultural Organization.

35
FAO. 2008. Global Change in Net Primary Productivity (1981-2003). Rome: Food and Agricultural
Organization.
FAO. 2010. Global survey of agricultural mitigation projects. Rome: Food and Agricultural Organization.
Available on the internet at http://www.fao.org/docrep/012/al388e/al388e00.pdf.
FAO. 2010. Land use systems of the World – East Europe and Central Asia. Available on the internet at:
www.fao.org/nr/lada/
FAO. 2011. FAO statistical databases. Food and Agriculture Organization. Available on the internet at
faostat.fao.org
FAO-UNESCO. 2007. Soil Map of the World: Organic carbon pool – Topsoil. Available on the internet at
www.fao.org
Ghosh, P. and J. Puri (eds). 1994. Joint implementation of climate change commitments: Opportunities and
apprehensions. Tata Energy Research Institute, New Delhi.
Gold Standard Foundation. 2010. The Gold Standard Premium quality carbon credits requirements. Available
on the Internet at www.cdmgoldstandard.org.
Graff-Zivin, Joshua and Leslie Lipper. 2008. Poverty, risk, and the supply of soil carbon sequestration.
Environment and Development Economics 13(3), 353-73.
Grubb, Michael, Christiaan Vrolijk and Duncan Brack. 1999. The Kyoto Protocol: A Guide and Assessment.
London: Earthscan/ James and James.
Gulbrandsen Lars H. and Steinar Andresen. 2004. NGO influence in the implementation of the Kyoto
Protocol: Compliance, flexibility mechanisms, and sinks. Global Environmental Politics 4(4), 54-75.
Haites, Erik, Maosheng Duan and Stephen Seres. Technology transfer by CDM projects. Climate Policy 6(3),
327-344.
Hall, Anthony. 2008. Paying for environmental services: the case of Brazilian Amazonia. Journal of
Internation Development 20 (7), 965-981.
Hamilton Katherine, Milo Sjardin, Molly Peters-Stanley and Thomas Marcello. 2010. Building bridges: state
of the voluntary carbon markets 2010. Ecosystem Marketplace and Bloomberg New Energy Finance.
New York and Washington.
Hanafi,A. G. 1998. Joint Implementation: legal and institutional issues for an effective international program
to combat climate change. The Harvard Environmental Law Review 22 (2): 441–508.
Harvey, L.D. Danny and Elizabeth Bush. 1997. Joint implementation: an effective strategy for combating
global warming? Environment 39(8), 14-20, 36-44.
Heal, Geoffrey M. and Arthur A Small. 2002. Agriculture and ecosystem services. In Bruce Gardner and
Gordon Rausser (eds.) Handbook of agricultural economics. Volume 2A. Agriculture and its external
linkages. Handbooks in Economics, vol. 18. Amsterdam; London and New York: Elsevier Science,
North-Holland
Hunt, Colin. 2008. Economy and ecology of emerging markets and credits for bio-sequestered carbon on
private land in tropical Australia, Ecological Economics 66(2-3), 309-318.
IEA. 2012. Oil Market Report. March 14, 2012. International Energy Agency. Paris, France.

36
IFPRI 2007. Dutilly-Diane, Celine, Nancy McCarthy, Francis Turkelboom, Adriana Bruggeman, James
Tiedemann, Kenneth Street and Gianluca Serra. 2007. Could Payments for Environmental Services
Improve Rangeland Management in Central Asia, West Asia and North Africa? Capri Working Paper 62.
Washington: International Food Policy Research Institute.
IPCC 2007b. Contribution of Working Group III to the Fourth Assessment Report of the Intergovernmental
Panel on Climate Change, 2007 B. Metz, O.R. Davidson, P.R. Bosch, R. Dave, L.A. Meyer (eds.)
Cambridge University Press, Cambridge, United Kingdom and New York, NY, USA.
IPCC. 2007a: Summary for Policymakers. In: Climate Change 2007: The Physical Science Basis. Contribution
of Working Group I to the Fourth Assessment Report of the Intergovernmental Panel on Climate Change
[Solomon, S., D. Qin, M. Manning, Z. Chen, M. Marquis, K.B. Averyt, M.Tignor and H.L. Miller (eds.)].
Cambridge University Press, Cambridge, United Kingdom and New York, NY, USA.
.Lal, R. 2009. Challenges and opportunities in soil organic matter research. European Journal of Soil Science
60, 158-169.
Larson, Donald F. and Gunnar Breustedt. 2009. Will markets direct investments under the Kyoto Protocol?
Lessons from the activities implemented jointly pilots. Environmental and Resource Economics 43(3),
433-56.
Larson, Donald F. Ariel Dinar, Frisbie Aapris. 2011 The present and future role for agricultural projects
under the Clean Development Mechanism. In Handbook on Climated Change and Agriculture. Ariel
Dinar and Robert Mendelsohn (eds.). Chelteham UK: Edward Elgar.
Larson, Donald F., Philippe Ambrosi, Ariel Dinar, Shaikh Mahfuzur Rahman and Rebecca Entler. 2008. A
review of carbon market policies and research. International Review of Environmental and Resource
Economics 2(3), 177–236.
Lecocq, Franck, and Philippe Ambrosi. 2007. The Clean Development Mechanism: history, status, and
prospects. Review of Environmental Economics and Policy, 1(1), 134-51.
Lokupitiya, Erandathie and Keith Paustian. 2006. Agricultural soil greenhouse gas emissions: A review of
national inventory methods. Journal of Environmental Quality 35, 1413-1427.
Lövbrand, Eva, Teresia Rindefjäll and Joakim Nordqvist. 2009. Closing the legitimacy gap in global
environmental governance? Lessons from the emerging CDM market. Global Environmental Politics 9(2),
74-100.
Macey, Adrian. 2009. Climate change: governance challenges for Copenhagen. Global Governance 15 (4),
443-449.
Matschoss, Patrick, and Heinz Welsch. 2006. International emissions trading and induced carbon-saving
technological change: effects of restricting the trade in carbon rights. Environmental and Resource
Economics, 33(2), 169-198.
Matsuo, Naoki. 2003. CDM in the Kyoto negotiations. Mitigation and Adaptation Strategies for Global
Change 8(3), 191-200.
Millennium Ecosystem Assessment, 2005. Ecosystems and Human Well-being: Biodiversity Synthesis. World
Resources Institute, Washington, DC.

37
Michaelowa, Axel, Marcus Stronzik, Frauke Eckermann and Alistair Hunt. 2003. Transaction costs of the
Kyoto Mechanisms. Climate Policy 3(3), 261-278.
Moon, Wanki, Wojciech J. Florkowski, Bernhard Brückner, and Ilona Schonhof. 2002. Willingness to pay for
environmental practices: implications for eco-labeling. Land Economics 78(1), 88-102.
Morris, Michael, Valerie A. Kelly, Ron J. Kopicki, Derek Byerlee (2007): Fertilizer Use in African Agriculture:
Lessons Learned and Good Practice Guidelines. Washington, World Bank.
Nelson Kristen C., Ben H. J. de Jong. 2003. Making global initiatives local realities: carbon mitigation projects
Pagiola, Stefano, Agustin Arcenas, Gunars Platais. 2004 Can payments for environmental services help reduce
poverty? An exploration of the issues and the evidence to date from Latin America, World Development
33(2), 237-253.
Parikh, Jyoti. 1995. North-South cooperation in climate change through joint implementation. International
Environmental Affairs 7(1), 22-43.
Pattanayak, Subhrendu K., Sven Wunder, and Paul J. Ferraro. 2010. Show me the money: do payments supply
environmental services in developing countries? Review of Environmental Economics and Policy 4(2),
254-74.
Paustian, K., B.A. Babcock, J. Hatfield, R. Lal, B.A. McCarl, S. McLaughlin, A. Mosier, C. Rice, G.P.
Robertson, N.J. Rosenberg, C. Rosenzweig, W.H. Schlesinger, and D. Zilberman. 2004: Agricultural
Mitigation of Greenhouse Gases: Science and Policy Options. CAST (Council on Agricultural Science and
Technology) Report, R141 2004, ISBN 1-887383-26-3.
Peters-Stanley, Katherine Hamilton, Thomas Marcello and Milo Sjardin. 2011. Back to the Future: State of
the Voluntary Carbon Markets 2011. New York and Washington: Ecosystem Marketplace and Bloomberg
New Energy Finance.
Pfaff, A. S. P., S. Kerr, R. F. Hughes, S. Liu, G. A. Sanchez-Azofeifa, D. Schimel, J. Tosi, and V. Watson.
2000. The Kyoto Protocol and payments for tropical forest: an interdisciplinary method for estimating
carbon-offset supply and increasing the feasibility of a carbon market under the CDM. Ecological
Economics 35(2), 203-21.
Platjouw, Froukje Maria. 2009. Reducing greenhouse gas emissions at home or abroad? The implications of
Kyoto's supplementarity requirement for the present and future climate change regime. Review of
European Community and International Environmental Law 18(3), 244-256.
Post, W.M., Emanuel, W.R., Zinke, P.J., Stangenberger, A.G., 1982. Soil carbon pools and world life zones.
Nature 298, 156-159.
Rahman, Shaikh M., Ariel Dinar, Donald F. Larson. 2010. Diffusion of Kyoto's Clean Development
Mechanism. Technological Forecasting and Social Change, 77(8), 1391-1400.
Republic of Turkey. 2011. Ministry Of Environment and Forestry, Climate Change Department
Announement, available on the Internet at:
http://www.iklim.cob.gov.tr/iklim/AnaSayfa/Kyoto.aspx?sflang=en (downloaded July 6, 2011.)
Sirohi, Smita. 2007. CDM: Is it a ‗win–win‘ strategy for rural poverty alleviation in India? Climatic Change
84(1), 91-110.
38
Skutsch, Margaret M. 2005. Reducing carbon transaction costs in community-based forest management.
Climate Policy 5(4), 433-443.
Smith, P., D. Martino, Z. Cai, D. Gwary, H. Janzen, P. Kumar, B. McCarl, S. Ogle, F. O‘Mara, C. Rice, B.
Scholes, O. Sirotenko, 2007: Agriculture. In Climate Change 2007. Mitigation. Contribution of Working
Group III to the Fourth Assessment Report of the Intergovernmental Panel on Climate Change [B. Metz,
O.R. Davidson, P.R. Bosch, R. Dave, L.A. Meyer (eds)], Cambridge University Press, Cambridge, United
Kingdom and New York, NY, USA.
Smith, Pete, Daniel Martino, Zucong Cai, Daniel Gwary, Henry Janzen, Pushpam Kumar, Bruce McCarl,
Stephen Ogle, Frank O'Mara, Charles Rice, Bob Scholes, Oleg Sirotenko, Mark Howden, Tim McAllister,
Genxing Pan, Vladimir Romanenkov, Uwe Schneider, Sirintornthep Towprayoon, Martin Wattenbach and
Jo Smith. 2008. Greenhouse gas mitigation in agriculture. Philosophical transactions of the Royal Society
B: Biological Sciences. 363, 789-813.
Sutton, William R., Peter Whitford, Emanuela Montanari Stephens, Suzette Pedroso Galinato, Bonnie Nevel,
Beata Plonka, and Ebru Karamete. 2008. Integrating Environment into Agriculture and Forestry: Progress
and Prospects in Eastern Europe and Central Asia. Washington, World Bank.
Tennigkeit, Timm, Fredrich Kahrl, Johannes Wölcke and Ken Newcombe. 2009. Agricultural Carbon
Sequestration in Sub-Saharan Africa: Economics and Institutions. Washington: World Bank.
Teytelboym A., and F. Steves, Forthcoming. Introducing the climate laws, institutions and measures index‖,
EBRD Working Paper. London: European Bank for Reconstruction and Development.
Thomas, R.J. 2008. Opportunities to reduce the vulnerability of dryland farmers in Central and West Asia and
North Africa to climate change, Agriculture, Ecosystems and Environment 126 (1-2), 36-45.
Tuerk, D., Frieden, D., Sharmina, M., Schreiber, H., Ürge‐Vorsatz, D., 2010. Green Investment Schemes:
First experiences and lessons learned. Working Paper. Joanneum Research / Center for Climate Change
and Sustainable Energy Policy (3CSEP).
Watanabe, Rie and Guy Robinson. 2005. The European Union Emissions Trading Scheme (EU ETS).
Climate Policy 5(1), 10-14.
Weber, Thomas A., Karsten Neuhoff. 2010. Carbon markets and technological innovation, Journal of
Environmental Economics and Management 60(2), 115-132.
Werksman, Jacob. 1998. The Clean Development Mechanism: unwrapping the ‗Kyoto Surprise‘. Review of
European Community & International Environmental Law, 7: 147–158.
World Bank. 2004. Moldova Soil Conservation Project Updated Project Information Document. Washington,
World Bank.
World Bank. 2005. Natural Resource Development Project, Project information Document Report Number
31791. Washington, World Bank.
World Bank. 2009. Community Forestry Project, Project Information Document. Washington, World Bank.
World Bank. 2010a. State and Trend of Carbon Markets 2010. Washington: World Bank.
World Bank. 2010b. The Hague Conference on agriculture, food security and climate change, opportunities
and challenges for a converging agenda: country examples. Washington, World Bank.

39
World Bank. 2011a. Carbon Finance Unit Website, available on the internet at: wbcarbonfinance.org.
World Bank. 2011b. Enterprise Surveys. Available on the Internet at: http://www.enterprisesurveys.org.
WRI. 2011. Climate Analysis Indicators Tool (CAIT) version 8.0. Washington: World Resources Institute.
Wunder, Sven, Stefanie Engel and Stefano Pagiola. 2008. Taking stock: A comparative analysis of payments
for environmental services programs in developed and developing countries, Ecological Economics 65(4),
834-852.

40
Table 1: Greenhouse gas emission by region, 1990 - 2005
Emissions (GtC02e) Per Capita Emissions (tCO2e) 1990 1995 2000 2005 1990 1995 2000 2005
Australia & New Zealand 0.5 0.5 0.6 0.6 22.5 22.6 25.0 25.9 E. Europe & Central Asia 6.5 4.7 4.3 4.5 14.0 10.0 9.1 9.6 Latin America & Caribbean 2.1 2.3 2.8 3.0 4.8 4.9 5.3 5.4 Middle East & North Africa 1.2 1.5 1.7 2.2 4.4 4.9 5.2 5.9 South & SE Asia Pacific 6.6 8.3 9.1 12.3 2.4 2.8 2.8 3.6 Sub-Saharan Africa 1.4 1.5 1.6 1.8 2.8 2.5 2.4 2.4 US and Canada 6.6 6.9 7.5 7.7 23.6 23.4 24.0 23.3 Western Europe 4.2 4.1 4.1 4.2 11.1 10.8 10.6 10.6 World 30.0 31.1 33.2 37.8 5.7 5.5 5.5 5.8
Source: WRI (2011) and authors‘ calculations.
Table 2: Greenhouse gas emissions in ECA by gas and sector over time, 1990-2005
Type of gas Sector CO2 CH4 N2O Other Energy Agriculture Industry Other
1990 4,890.0 1,212.2 384.3 37.2 5,530.7 623.7 173.6 195.7 1995 3,466.8 959.8 254.6 23.4 3,985.5 439.8 105.0 174.3 2000 3,230.8 824.4 230.8 25.0 3,673.5 364.6 105.7 167.2 2005 3,372.2 885.1 249.3 31.5 3,843.8 394.1 132.4 167.8 ECA’s share of global emissions 1990 0.23 0.21 0.13 0.16 0.25 0.12 0.17 0.15 1995 0.16 0.16 0.09 0.09 0.17 0.08 0.09 0.13 2000 0.14 0.14 0.07 0.07 0.15 0.06 0.08 0.12 2005 0.12 0.14 0.08 0.06 0.14 0.06 0.07 0.12
Note: all gases are expressed in MtCO2e.

41
Table 3: Greenhouse gas emissions in ECA countries, 1990-2005
1990 1995 2000 2005
-------------------------- MtCo2e -------------------------- Russian Federation 2,932.1 2,086.3 1,905.8 1,954.6 Ukraine 941.9 590.1 465.9 493.9 Turkey 260.2 294.0 350.6 390.6 Poland 438.0 415.5 370.2 372.8 Kazakhstan 312.4 225.7 160.3 202.5 Uzbekistan 175.8 157.9 180.3 180.9 Czech Republic 186.9 148.2 143.7 141.8 Romania 240.1 163.7 123.7 131.6 Turkmenistan 71.1 54.9 64.1 91.4 Belarus 145.7 80.3 77.1 83.3 Hungary 100.0 81.7 79.3 82.5 Bulgaria 111.8 77.2 59.3 66.3 Serbia & Montenegro 87.7 58.6 56.6 57.9 Slovakia 71.1 51.9 47.6 50.1 Azerbaijan 83.0 46.6 54.9 47.8 Croatia 31.5 23.4 26.1 30.6 Slovenia 17.6 17.9 18.5 20.3 Bosnia & Herzegovina 32.4 6.2 18.8 19.8 Estonia 42.1 19.2 17.5 19.6 Lithuania 46.2 23.3 18.9 19.6 Moldova 38.7 16.8 10.8 12.5 Macedonia, FYR 12.1 11.1 11.3 11.8 Latvia 25.4 12.3 10.0 10.9 Tajikistan 21.2 11.2 9.5 9.9 Kyrgyzstan 29.4 8.5 8.4 9.7 Albania 9.1 4.5 6.5 9.1 Georgia 35.7 11.9 9.3 8.9 Armenia 24.5 5.7 6.0 7.4
Source: WRI (2011) and authors‘ calculations.

42
Table 4: Per capita greenhouse gas emissions in ECA by country, 1990 to 2005
1990 1995 2000 2005
-------------------------- tCo2e -------------------------- Turkmenistan 19.4 13.1 14.2 18.9 Estonia 26.8 13.4 12.8 14.5 Czech Republic 18.0 14.3 14.0 13.8 Russian Federation 19.8 14.1 13.0 13.7 Kazakhstan 19.1 14.3 10.8 13.4 Ukraine 18.2 11.5 9.5 10.5 Slovenia 8.8 9.0 9.3 10.1 Poland 11.5 10.8 9.6 9.8 Slovakia 13.5 9.7 8.8 9.3 Bulgaria 12.8 9.2 7.4 8.6 Belarus 14.3 7.9 7.7 8.5 Hungary 9.6 7.9 7.8 8.2 Serbia & Montenegro 11.6 7.6 7.5 7.8 Croatia 6.6 5.0 5.9 6.9 Uzbekistan 8.6 6.9 7.3 6.9 Romania 10.3 7.2 5.5 6.1 Macedonia, FYR 6.3 5.7 5.6 5.8 Azerbaijan 11.6 6.1 6.8 5.7 Lithuania 12.5 6.4 5.4 5.7 Turkey 4.6 4.8 5.3 5.5 Bosnia & Herzegovina 7.5 1.9 5.1 5.2 Latvia 9.5 4.9 4.2 4.7 Moldova 8.9 3.9 2.6 3.3 Albania 2.8 1.4 2.1 2.9 Armenia 6.9 1.8 2.0 2.4 Georgia 6.5 2.4 2.0 2.0 Kyrgyzstan 6.6 1.8 1.7 1.9 Tajikistan 4.0 1.9 1.5 1.5
Source: WRI (2011) and authors‘ calculations.

43
Table 5: Emissions by type of gas and by sector, 2005
Emissions by type of gas Emissions by sector
Country CO2 CH4 N2O Other gas Energy Agriculture Industry Other
-------------------------------------------- MtCO2e ------------------------------------------
Albania 4.8 2.9 1.3 0.1 4.6 3.4 0.3 0.8 Armenia 4.4 2.7 0.2 0.1 5.3 1.0 0.3 0.8 Azerbaijan 32.8 14.0 0.8 0.2 39.7 4.5 1.1 2.5 Belarus 62.3 13.7 6.9 0.4 64.0 13.1 2.3 3.9 Bosnia & Herzegovina 16.2 2.6 1.1 0 15.7 0.0 0.5 3.6 Bulgaria 46.8 10.3 8.7 0.5 50.6 6.6 3.9 5.2 Croatia 22.5 4.1 3.8 0.2 22.4 3.8 2.8 1.6 Czech Republic 121.7 10.5 8.1 1.5 126.9 7.7 4.6 2.6 Estonia 16.5 2.5 0.5 0.1 16.9 1.2 0.4 1.1 Georgia 4.1 3.5 1.2 0.1 4.6 2.3 0.5 1.5 Hungary 57.8 10.9 13.0 0.8 61.6 11.9 3.9 5.1 Kazakhstan 167.2 26.9 8.1 0.3 178.4 16.9 2.3 4.9 Kyrgyzstan 5.9 3.7 0.1 0.0 5.7 2.1 0.5 1.4 Latvia 7.7 1.9 1.0 0.3 8.1 1.5 0.4 0.9 Lithuania 13.9 3.9 1.4 0.4 14.5 2.2 1.3 1.6 Macedonia, FYR 9.2 2.0 0.5 0.1 9.1 0.7 0.4 1.6 Moldova 8.2 2.7 1.6 0.0 8.8 2.1 0.4 1.2 Poland 300.4 46.4 25.0 1.0 315.0 26.7 11.8 19.3 Romania 95.2 26.6 9.2 0.6 104.9 14.4 7.0 5.3 Russian Federation 1,562.6 314.5 57.5 20.0 1,744.8 117.8 45.0 47.0 Serbia & Montenegro 46.4 7.4 4.2 0 45.2 0 1.1 11.6 Slovakia 39.8 4.7 5.0 0.6 39.7 5.6 3.0 1.8 Slovenia 16.2 2.1 1.6 0.4 16.3 2.1 1.1 0.8 Tajikistan 5.8 3.0 0.4 0.7 5.8 2.4 0.9 0.8 Turkey 237.7 105.3 46.3 1.3 273.0 76.1 22.7 18.8 Turkmenistan 41.7 49.1 0.6 0.0 87.8 2.4 0.4 0.8 Ukraine 312.1 153.4 27.0 1.4 424.4 44.5 10.1 14.9 Uzbekistan 112.3 53.8 14.2 0.6 150.0 21.1 3.4 6.4
Source WRI (2011)

44
Table 6: Estimated greenhouse gas mitigation potential in 2030 by sector at or below $20/tCO2e.
Total Developing Countries
Agriculture 1.60 1.10 Forestry 1.25 1.05 Energy 1.90 0.80 Buildings 5.50 2.85 Transport 1.75 0.13 Other 1.50 0.97 Total 13.50 6.90
Note: potential given in Gt CO2e per year. Mitigation from burning agricultural residue is attributed to sector in which the fuel-use takes place. The IPCC estimates that mitigation opportunities for this class of project at 1.26 Gt CO2e per year. Source: Barker et al. (2007), Smith et al. (2007)
Table 7: Carbon stored in topsoils by land-use in ECA
Land use Area (Km2) Min. Carbon (Mt) Max. Carbon (Mt)
Low density grazing 2,179,504 3,043 7,863 Mixed agro-forestry 3,331,691 7,777 16,627 Moderate to high density crops and livestock 5,727,060 9,915 22,204 Unprotected virgin forest 5,368,165 14,535 30,730 Unmanaged 4,759,824 13,555 29,443 Other 2,348,108 6,497 13,811 Total 23,714,351 55,322 120,678
Source: FAO-UNESCO (2007); FAO 2010) and authors‘ calculations

45
Table 8: Estimated area of degraded lands in ECA as of 2000
Country Degraded
by agriculture Degraded total area
Land suitable for agriculture
Albania 400 2,700 544 Armenia 300 300 241 Azerbaijan 4,700 4,900 2,434 Belarus 0 1,300 15,274 Bosnia & Herzegovina 0 5,100 1,922 Bulgaria 3,400 11,100 5,975 Croatia 300 5,600 2,934 Czech Republic 7,300 7,900 4,779 Estonia 0 200 1,997 Former Yugoslavia 2,000 12,000 4,605 Georgia 700 700 1,800 Hungary 2,700 6,000 6,929 Kazakhstan 3,500 47,300 3,107 Kyrgyzstan 400 400 414 Latvia 0 4,400 5,258 Lithuania 0 1,200 5,287 Macedonia, FYR 0 2,200 634 Moldova 0 3,400 2,219 Poland 4,600 26,000 22,296 Romania 11,000 23,700 12,238 Russian Federation 100,800 380,800 219,696 Slovenia 100 1,600 665 Tajikistan 900 1,000 1,219 Turkey 3,000 77,000 14,577 Turkmenistan 6,400 6,600 312 Ukraine 3,100 45,900 42,886 Uzbekistan 6,000 6,000 2,027 Total 161,600 685,300 382,269
Source FAO (2000). Note: Area is reported in thousand hectares

46
Table 9: Cereal yields in Argentina, Canada, China, Colombia and ECA, tons per hectare
1992-1994 1997-1999 2007-2009 Argentina 2.91 3.45 3.82 Canada 2.57 2.82 3.22 China 4.48 4.91 5.44 Colombia 2.52 3.04 4.04 Albania 2.47 2.83 4.04 Armenia 1.66 1.65 2.42 Azerbaijan 1.79 1.78 2.67 Belarus 2.60 1.93 3.27 Bosnia and Herzegovina 3.56 3.59 4.06 Bulgaria 2.75 2.88 3.20 Croatia 4.12 4.77 5.77 Czech Republic 4.06 4.15 4.99 Estonia 1.69 1.62 2.85 Georgia 1.93 1.97 2.04 Hungary 3.57 4.68 4.62 Kazakhstan 1.06 0.91 1.20 Kyrgyzstan 2.35 2.45 2.64 Latvia 1.76 2.08 3.04 Lithuania 1.93 2.34 3.27 Republic of Moldova 2.98 2.88 2.17 Romania 2.44 3.10 2.57 Russian Federation 1.61 1.51 2.22 Serbia and Montenegro 3.10 4.05 4.14 Slovakia 4.04 4.10 4.35 Slovenia 4.02 5.54 5.35 Tajikistan 0.95 1.26 2.44 Macedonia, FYR 2.45 2.92 3.18 Turkey 2.10 2.19 2.56 Turkmenistan 2.38 1.87 2.89 Uzbekistan 1.68 2.28 4.34
Source: FAO (2011)

47
Table 10: Regulatory regimes in ECA
ECA Countries Pledged Kyoto commitment for
2008-12 emissions (percentage of base year or period)
2008-2012 EU ETSs Cap (annual million EUAs)
Joint Implementation - EU ETS countries Bulgaria -8 42.30 Czech Republic -8 86.80 Estonia -8 12.72 Hungary -6 26.90 Latvia -8 3.43 Lithuania -8 8.80 Poland -6 208.50 Romania -8 75.90 Slovak Republic -8 30.90 Slovenia -8 8.30 Other Joint Implementation countries Croatia -5 Kazakhstan 0 Russian Federation 0 Ukraine 0 CDM countries Albania Armenia Azerbaijan Belarus Bosnia & Herzegovina FYR Macedonia Georgia Kosovo Kyrgyz Republic Moldova Montenegro Serbia Tajikistan Turkmenistan Uzbekistan Annex I without Annex B commitments Turkey
Source: UNFCCC and Europa (2007). Note: Kazakhstan declared its commitment to limit emissions in September 2009 (UNFCCC, FCCC/SBI/2010/6). Turkey became a party to the UNFCCC in 2004 and to the Kyoto Protocol in 2009 (Government of Turkey, 2011.)

48
Table 11: Host countries ranked by expected offsets from CDM and JI projects by 2012
All project types Agricultural projects Forestry projects
Host country Offsets
(ktco2e) Cumulative
share Host country
Offsets (ktco2e)
Cumulative share
Host country Offsets
(ktco2e) Cumulative
share
Ranked by number of projects 1 China 2,667 0.38 India 380 0.29 Brazil 22 0.13 2 India 1,663 0.62 China 156 0.41 India 16 0.23 3 Brazil 361 0.67 Brazil 136 0.52 China 15 0.32 4 Vietnam 188 0.70 Malaysia 117 0.61 Chile 13 0.40 5 Mexico 186 0.73 Mexico 110 0.69 Kenya 8 0.45 6 Malaysia 148 0.75 Thailand 103 0.77 Russia 8 0.49 7 Thailand 145 0.77 Indonesia 66 0.82 Uganda 7 0.54 8 Russia 134 0.79 Philippines 59 0.86 Colombia 6 0.57 9 Indonesia 124 0.81 Vietnam 30 0.89 Uruguay 5 0.60 10 South Korea 90 0.82 Honduras 10 0.89 Argentina 5 0.63 11 Philippines 87 0.83 Colombia 9 0.90 South Africa 5 0.66 12 Ukraine 83 0.84 Pakistan 8 0.91 Estonia 4 0.69 13 Chile 78 0.86 Chile 8 0.91 Malaysia 4 0.71 14 Colombia 74 0.87 Argentina 7 0.92 Hungary 4 0.73 15 Czech Republic 59 0.87 Ecuador 7 0.92 Indonesia 3 0.75 16 Peru 47 0.88 Kenya 6 0.93 Sri Lanka 3 0.77 17 South Africa 47 0.89 Ukraine 6 0.93 Congo DR 3 0.79 18 Argentina 38 0.89 Morocco 5 0.94 Vietnam 2 0.80 19 Bulgaria 38 0.90 Sri Lanka 5 0.94 Bolivia 2 0.81 20 Israel 32 0.90 Papua New Guinea 5 0.95 Paraguay 2 0.83 Ranked by number of expected offsets 1 China 1,492,697 0.46 India 58,644 0.24 Brazil 20,630 0.38 2 India 420,178 0.58 China 44,067 0.41 Chile 3,939 0.45 3 Russia 301,960 0.68 Brazil 28,493 0.53 India 3,889 0.53 4 Brazil 170,665 0.73 Malaysia 26,695 0.64 Russia 3,638 0.59 5 Ukraine 111,704 0.76 Thailand 18,084 0.71 Colombia 3,227 0.65 6 South Korea 106,108 0.80 Mexico 17,925 0.78 China 3,068 0.71 7 Mexico 63,758 0.81 Indonesia 13,197 0.83 Hungary 2,902 0.76 8 Indonesia 37,390 0.83 Chile 6,990 0.86 South Africa 1,953 0.80 9 Nigeria 36,071 0.84 Philippines 5,561 0.88 Ghana 1,553 0.83 10 Chile 34,266 0.85 Colombia 4,019 0.90 Moldova 1,077 0.85 11 Malaysia 33,867 0.86 Vietnam 3,569 0.91 Congo DR 931 0.86 12 Argentina 30,422 0.87 Nicaragua 1,533 0.92 Romania 866 0.88 13 Vietnam 25,840 0.88 Honduras 1,242 0.93 Argentina 826 0.90 14 Thailand 24,326 0.88 Hungary 1,056 0.93 Uganda 818 0.91 15 South Africa 23,063 0.89 Ukraine 1,005 0.93 Bulgaria 586 0.92 16 Colombia 22,125 0.90 Nepal 1,004 0.94 Tanzania 481 0.93 17 Romania 20,875 0.90 Israel 997 0.94 Uruguay 443 0.94 18 Bulgaria 17,510 0.91 Ghana 921 0.95 South Korea 335 0.95 19 Poland 16,726 0.91 Ecuador 824 0.95 Kenya 304 0.95 20 Azerbaijan 16,545 0.92 Pakistan 816 0.95 Malaysia 271 0.96
Source: Risoe (2011) and authors‘ calculations

Table 12: Number of projects and expected mitigation impact by 2012
ECA region Rest of World Number of
projects Expected mitigation (ktCO2e)
Number of projects
Expected mitigation (ktCO2e)
Agriculture 17 3,781 1,287 244,653 Alternative energy 41 11,398 1,635 347,016 Assorted gases 88 215,850 150 346,987 Biomass energy 13 5,423 34 7,177 Cement 4 2,593 51 34,331 Energy Efficiency 116 172,977 854 292,732 Forest 25 9,579 141 44,556 Fossil fuel switch 20 18,939 131 170,931 HFCs 5 14,202 24 478,199 Hydro 35 12,289 1,674 440,228 Landfill gas 78 18,086 349 203,778 Methane avoidance 19 50,163 131 116,434 Transport 0 0 39 10,342 Total 461 535,280 6,500 2,737,365
Note: The category for assorted gases includes non-agricultural projects designed to capture fugitive gases other than HFCs. Methane avoidance excludes projects to handle methane originating in landfills or agriculture.
Source: Risoe (2011) and authors‘ calculations

50
Table 13: Number of projects and expected mitigation impact by 2012 by ECA host country
Agriculture Forestry All Sectors
Host country Number of
projects
Expected mitigation (ktCO2e)
Number of projects
Expected mitigation (ktCO2e)
Number of projects
Expected mitigation (ktCO2e)
Albania 0 0 1 161 3 215 Armenia 1 377 0 0 8 1,261 Azerbaijan 0 0 0 0 7 16,545 Belarus 0 0 0 0 0 0 Bosnia & Herzegovina 0 0 0 0 0 0 Bulgaria 1 56 1 586 38 17,510 Croatia 0 0 0 0 0 0 Czech Republic 0 0 0 0 59 6,111 Estonia 1 89 4 148 15 1,745 Georgia 0 0 0 0 5 2,398 Hungary 3 1,056 4 2,902 13 9,613 Kazakhstan 0 0 0 0 0 0 Kyrgyzstan 0 0 0 0 0 0 Latvia 0 0 0 0 0 0 Lithuania 0 0 0 0 16 8,150 Macedonia 0 0 1 0 5 1,859 Moldova 1 21 2 1,077 9 3,561 Poland 1 700 0 0 24 16,726 Romania 0 0 2 866 19 20,875 Russia 2 431 8 3,638 134 301,960 Serbia 1 47 1 26 6 990 Slovakia 0 0 0 0 1 63 Slovenia 0 0 0 0 0 0 Tajikistan 0 0 0 0 0 0 Turkey 0 0 0 0 0 0 Turkmenistan 0 0 0 0 0 0 Ukraine 6 1,005 1 176 83 111,704 Uzbekistan 0 0 0 0 16 13,994 Total 17 3,781 25 9,579 461 535,280
Source Risoe (2011) and authors‘ calculations
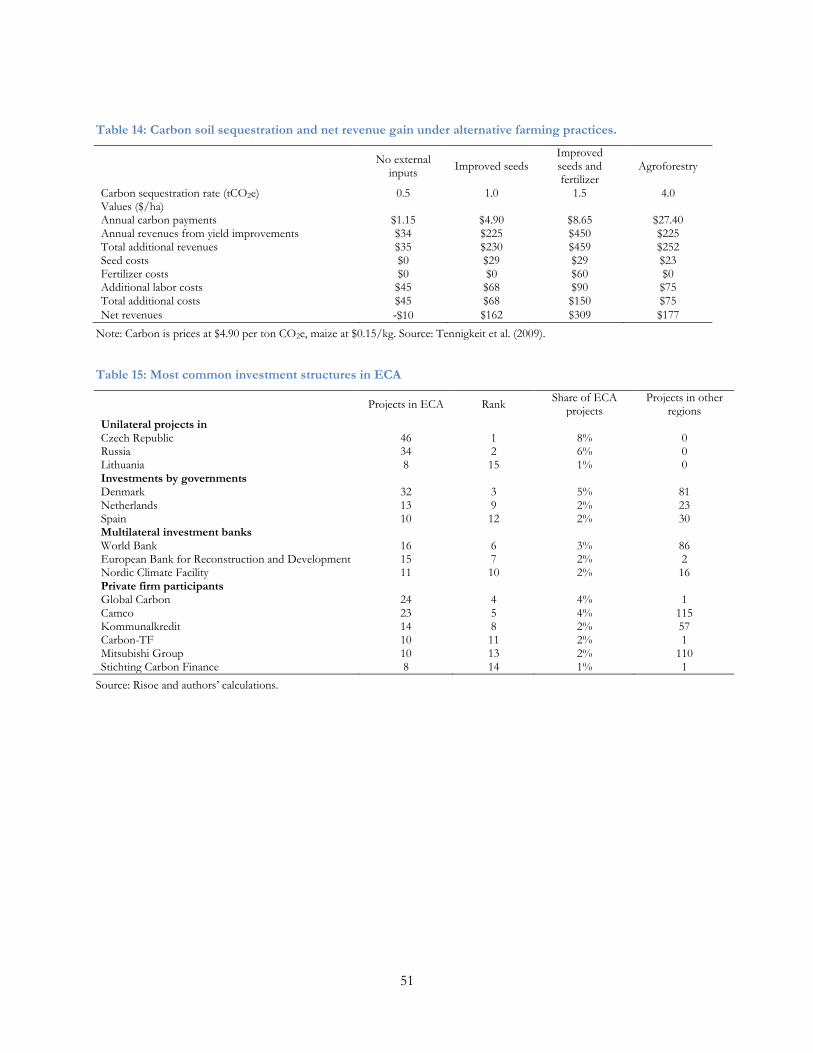
51
Table 14: Carbon soil sequestration and net revenue gain under alternative farming practices.
No external
inputs Improved seeds
Improved seeds and fertilizer
Agroforestry
Carbon sequestration rate (tCO2e) 0.5 1.0 1.5 4.0 Values ($/ha) Annual carbon payments $1.15 $4.90 $8.65 $27.40 Annual revenues from yield improvements $34 $225 $450 $225 Total additional revenues $35 $230 $459 $252 Seed costs $0 $29 $29 $23 Fertilizer costs $0 $0 $60 $0 Additional labor costs $45 $68 $90 $75 Total additional costs $45 $68 $150 $75
Net revenues ‐$10 $162 $309 $177
Note: Carbon is prices at $4.90 per ton CO2e, maize at $0.15/kg. Source: Tennigkeit et al. (2009).
Table 15: Most common investment structures in ECA
Projects in ECA Rank Share of ECA
projects Projects in other
regions Unilateral projects in Czech Republic 46 1 8% 0 Russia 34 2 6% 0 Lithuania 8 15 1% 0 Investments by governments Denmark 32 3 5% 81 Netherlands 13 9 2% 23 Spain 10 12 2% 30 Multilateral investment banks World Bank 16 6 3% 86 European Bank for Reconstruction and Development 15 7 2% 2 Nordic Climate Facility 11 10 2% 16 Private firm participants Global Carbon 24 4 4% 1 Camco 23 5 4% 115 Kommunalkredit 14 8 2% 57 Carbon-TF 10 11 2% 1 Mitsubishi Group 10 13 2% 110 Stichting Carbon Finance 8 14 1% 1
Source: Risoe and authors‘ calculations.

Annex table 1: Original and reclassified land-use data for analysis
Original Landuse Reclassified Landuse
Agriculture - large scale Irrigation Mod. To high density crops and livestock Agriculture - protected Mod. To high density crops and livestock Bare areas - protected PAs with wetlands and forest Bare areas - unmanaged Unmanaged Bare areas - with low livestock density Low density grazing Bare areas - with mod. livestock density Mod. To high density crops and livestock Crops and high livestock density Mod. To high density crops and livestock Crops and mod. intensive livestock density Mod. To high density crops and livestock Crops, large-scale irrig., mod. or higher livestock dens. Mod. To high density crops and livestock Forest - protected PAs with wetlands and forest Forest - virgin Unprotected virgin forest Forest - with agricultural activities Mixed Agro-forestry Forest - with moderate or higher livestock density Mixed Agro-forestry Grasslands - high livestock density Mod. To high density crops and livestock Grasslands - low livestock density Low density grazing Grasslands - moderate livestock density Mod. To high density crops and livestock Grasslands - protected PAs with wetlands and forest Grasslands - unmanaged Unmanaged No data Other Open Water - inland Fisheries Other Open Water - protected Other Open Water - unmanaged Other Rainfed crops (Subsistence/Commercial) Mod. To high density crops and livestock Shrubs - high livestock density Mod. To high density crops and livestock Shrubs - low livestock density Low density grazing Shrubs - moderate livestock density Mod. To high density crops and livestock Shrubs - protected PAs with wetlands and forest Shrubs - unmanaged Unmanaged Sparsely vegetated areas - mod.or high livestock dens. Mod. To high density crops and livestock Sparsely vegetated areas - protected PAs with wetlands and forest Sparsely vegetated areas - unmanaged Unmanaged Sparsely vegetated areas - with low livestock density Low density grazing Undefined Other Urban land Other Wetlands - protected PAs with wetlands and forest Wetlands - unmanaged Unmanaged

53
Annex table 2: A range of carbon estimates by land use and country
Country Land use Area (Km2) Min. Carbon
(MtC) Max. Carbon
(MtC)
Albania Mixed Agro-forestry 4,641.4 4.9 13.2 Albania Moderate to high density crops and livestock 21,714.6 26.1 65.3 Albania Other 1,489.2 1.2 3.9 Albania Unmanaged 319.7 0.4 0.9 Armenia Low density grazing 131.5 0.2 0.5 Armenia Mixed Agro-forestry 1,569.2 2.0 5.2 Armenia Moderate to high density crops and livestock 23,877.8 43.4 95.4 Armenia Other 1,637.0 2.6 5.5 Armenia PAs with forests and wetlands 394.7 0.6 1.3 Armenia Unmanaged 854.4 1.3 2.8 Azerbaijan Low density grazing 783.5 0.6 2.0 Azerbaijan Mixed Agro-forestry 3,646.7 5.0 12.2 Azerbaijan Moderate to high density crops and livestock 68,269.7 71.0 202.7 Azerbaijan Other 7,346.5 4.3 17.5 Azerbaijan PAs with forests and wetlands 2,830.5 3.0 8.6 Azerbaijan Unmanaged 2,874.9 2.5 7.6 Belarus Low density grazing 5,094.6 10.0 20.1 Belarus Mixed Agro-forestry 69,908.9 147.5 298.8 Belarus Moderate to high density crops and livestock 117,042.7 250.9 510.3 Belarus Other 8,080.6 17.9 36.4 Belarus PAs with forests and wetlands 5,509.0 11.3 22.8 Belarus Unmanaged 517.9 1.1 2.3 Belarus Unprotected virgin forest 1,194.2 2.9 6.0 Bosnia and Herzegovina Low density grazing 61.7 0.1 0.2 Bosnia and Herzegovina Mixed Agro-forestry 19,619.2 43.5 92.7 Bosnia and Herzegovina Moderate to high density crops and livestock 30,375.5 51.7 123.6 Bosnia and Herzegovina Other 1,418.5 2.3 5.9 Bulgaria Low density grazing 383.8 1.2 2.4 Bulgaria Mixed Agro-forestry 34,493.0 60.0 127.2 Bulgaria Moderate to high density crops and livestock 68,861.8 90.2 216.9 Bulgaria Other 6,005.6 7.1 18.0 Bulgaria PAs with forests and wetlands 256.7 0.7 1.4 Bulgaria Unmanaged 381.8 0.8 1.6 Croatia Low density grazing 373.5 0.0 0.7 Croatia Mixed Agro-forestry 19,925.8 27.0 72.0 Croatia Moderate to high density crops and livestock 27,944.9 26.2 84.3 Croatia Other 6,707.6 4.6 18.5 Croatia PAs with forests and wetlands 604.2 1.9 4.0 Croatia Unmanaged 803.0 0.3 1.9 Cyprus Mixed Agro-forestry 1,617.6 0.4 3.3 Cyprus Moderate to high density crops and livestock 4,638.3 4.2 12.5 Cyprus Other 2,880.8 2.2 7.3 Cyprus Unmanaged 209.9 0.3 0.6 Czech Republic Mixed Agro-forestry 22,378.0 54.4 114.2 Czech Republic Moderate to high density crops and livestock 37,541.9 71.6 154.9 Czech Republic Other 11,162.0 25.3 53.5 Czech Republic PAs with forests and wetlands 7,587.2 23.3 48.7 Estonia Low density grazing 1,130.4 4.0 8.3 Estonia Mixed Agro-forestry 16,054.7 51.0 105.7 Estonia Moderate to high density crops and livestock 18,975.7 64.1 133.3 Estonia Other 5,390.2 16.7 34.5 Estonia PAs with forests and wetlands 2,638.0 7.3 15.0 Estonia Unmanaged 180.9 0.7 1.4
Source: FAO-Unesco (2007); FAO (2010) and authors‘ calculations

54
Annex table 2: A range of carbon estimates by land use and country (continued)
Country Land use Area (Km2) Min. Carbon
(Mton) Max. Carbon
(Mton)
Georgia Low density grazing 570.4 1.4 2.8 Georgia Mixed Agro-forestry 24,034.2 46.4 98.2 Georgia Moderate to high density crops and livestock 32,961.9 62.9 131.2 Georgia Other 6,589.1 13.0 26.7 Georgia PAs with forests and wetlands 1,081.2 3.1 6.4 Georgia Unmanaged 4,115.6 12.6 26.3 Georgia Unprotected virgin forest 689.8 1.8 3.7 Hungary Mixed Agro-forestry 12,329.3 12.9 37.3 Hungary Moderate to high density crops and livestock 67,174.2 122.8 276.0 Hungary Other 11,345.4 22.9 49.9 Hungary PAs with forests and wetlands 1,394.3 1.8 4.6 Hungary Unmanaged 59.3 0.2 0.4 Kazakhstan Low density grazing 1,228,062.5 974.7 3,251.7 Kazakhstan Mixed Agro-forestry 21,970.7 43.0 98.0 Kazakhstan Moderate to high density crops and livestock 936,615.0 1,480.9 3,383.7 Kazakhstan Other 48,380.0 51.2 151.4 Kazakhstan PAs with forests and wetlands 34,538.3 36.7 105.3 Kazakhstan Unmanaged 383,576.1 108.1 812.0 Kazakhstan Unprotected virgin forest 4,886.0 5.4 16.7 Kosovo Mixed Agro-forestry 2,215.0 6.2 12.9 Kosovo Moderate to high density crops and livestock 7,729.7 21.3 45.6 Kosovo Other 697.1 0.7 2.2 Kyrgyz Republic Low density grazing 41,138.8 63.2 137.3 Kyrgyz Republic Mixed Agro-forestry 5,093.8 7.4 16.6 Kyrgyz Republic Moderate to high density crops and livestock 98,370.5 120.5 300.2 Kyrgyz Republic Other 3,710.4 5.6 13.4 Kyrgyz Republic PAs with forests and wetlands 4,349.0 6.2 14.0 Kyrgyz Republic Unmanaged 31,314.7 43.6 99.9 Latvia Low density grazing 5,545.4 15.5 31.9 Latvia Mixed Agro-forestry 23,142.4 65.2 134.2 Latvia Moderate to high density crops and livestock 29,824.2 85.6 176.5 Latvia Other 4,482.9 10.3 20.9 Latvia PAs with forests and wetlands 1,079.0 2.3 4.6 Latvia Unmanaged 94.2 0.3 0.5 Lithuania Low density grazing 3,773.3 8.6 17.4 Lithuania Mixed Agro-forestry 13,683.0 29.1 59.0 Lithuania Moderate to high density crops and livestock 40,720.6 101.1 207.0 Lithuania Other 5,695.9 13.7 28.0 Lithuania PAs with forests and wetlands 646.4 1.2 2.3 Lithuania Unmanaged 151.8 0.3 0.6 Lithuania Unprotected virgin forest 243.1 0.4 0.9 Macedonia Mixed Agro-forestry 7,595.4 18.8 38.8 Macedonia Moderate to high density crops and livestock 14,200.5 28.6 63.9 Macedonia Other 2,826.0 6.7 14.4 Macedonia PAs with forests and wetlands 322.5 0.8 1.7 Macedonia Unmanaged 64.7 0.1 0.2 Moldova Mixed Agro-forestry 1,110.4 1.9 3.9 Moldova Moderate to high density crops and livestock 29,957.1 49.8 106.0 Moldova Other 2,514.5 4.1 8.6 Moldova Unmanaged 58.7 0.1 0.2 Montenegro Mixed Agro-forestry 4,352.6 7.8 17.1 Montenegro Moderate to high density crops and livestock 7,571.6 11.0 26.6 Montenegro Other 950.9 1.1 3.0 Montenegro PAs with forests and wetlands 251.2 0.5 0.9
Source: FAO-Unesco (2007); FAO (2010) and authors‘ calculations

55
Annex table 2: A range of carbon estimates by land use and country (continued)
Country Land use Area (Km2) Min. Carbon
(Mton) Max. Carbon
(Mton)
Poland Low density grazing 1,841.8 2.5 6.2 Poland Mixed Agro-forestry 71,879.0 122.3 263.7 Poland Moderate to high density crops and livestock 204,767.7 307.1 721.1 Poland Other 28,364.5 40.9 96.1 Poland PAs with forests and wetlands 1,859.8 6.8 13.8 Poland Unmanaged 2,382.0 8.0 16.7 Poland Unprotected virgin forest 50.9 0.2 0.4 Romania Mixed Agro-forestry 80,764.0 175.7 398.4 Romania Moderate to high density crops and livestock 137,828.6 167.3 440.0 Romania Other 15,578.5 18.9 50.7 Romania PAs with forests and wetlands 2,127.6 1.1 5.2 Romania Unmanaged 484.8 0.5 1.5 Russian Federation Low density grazing 757,351.8 1,931.1 4,106.2 Russian Federation Mixed Agro-forestry 2,650,110.9 6,391.2 13,659.0 Russian Federation Moderate to high density crops and livestock 2,176,218.7 4,603.0 9,562.2 Russian Federation Other 553,704.0 1,627.4 3,371.7 Russian Federation PAs with forests and wetlands 1,368,227.8 4,241.5 8,885.4 Russian Federation Unmanaged 3,853,842.4 13,325.1 27,548.6 Russian Federation Unprotected virgin forest 5,360,983.0 14,524.2 30,702.3 Serbia Mixed Agro-forestry 20,246.6 49.6 105.7 Serbia Moderate to high density crops and livestock 51,412.2 125.7 273.0 Serbia Other 6,139.4 15.0 33.0 Serbia PAs with forests and wetlands 121.1 0.3 0.7 Slovak Republic Low density grazing 169.7 0.3 0.6 Slovak Republic Mixed Agro-forestry 16,596.4 35.3 75.8 Slovak Republic Moderate to high density crops and livestock 18,212.3 32.2 71.3 Slovak Republic Other 6,762.3 12.4 26.8 Slovak Republic PAs with forests and wetlands 7,135.2 15.3 31.8 Slovenia Mixed Agro-forestry 14,026.9 30.8 65.0 Slovenia Moderate to high density crops and livestock 3,755.0 7.9 17.0 Slovenia Other 2,743.6 7.3 15.4 Tajikistan Low density grazing 20,074.9 8.2 45.4 Tajikistan Mixed Agro-forestry 804.8 0.1 1.6 Tajikistan Moderate to high density crops and livestock 58,529.7 44.5 172.0 Tajikistan Other 4,199.0 5.1 15.8 Tajikistan PAs with forests and wetlands 4,284.1 1.0 9.1 Tajikistan Unmanaged 44,518.1 20.5 102.9 Turkey Low density grazing 13,198.9 13.7 37.5 Turkey Mixed Agro-forestry 99,232.7 186.3 383.1 Turkey Moderate to high density crops and livestock 599,129.3 666.6 1,777.2 Turkey Other 52,587.4 66.3 166.8 Turkey PAs with forests and wetlands 67.3 0.0 0.1 Turkey Unmanaged 9,875.5 13.1 32.9 Turkmenistan Low density grazing 51,152.2 3.7 98.0 Turkmenistan Moderate to high density crops and livestock 140,128.9 39.7 322.1 Turkmenistan Other 11,696.1 11.2 40.7 Turkmenistan PAs with forests and wetlands 11,550.9 0.0 20.8 Turkmenistan Unmanaged 253,682.6 0.5 457.5 Ukraine Low density grazing 53.1 0.1 0.2 Ukraine Mixed Agro-forestry 68,583.3 151.7 313.7 Ukraine Moderate to high density crops and livestock 479,443.1 914.9 1,849.0 Ukraine Other 34,861.6 63.1 128.2 Ukraine PAs with forests and wetlands 4,431.9 10.6 22.4 Ukraine Unmanaged 4,526.1 7.4 15.8 Ukraine Unprotected virgin forest 117.7 0.1 0.3 Uzbekistan Low density grazing 48,612.1 3.6 93.7 Uzbekistan Mixed Agro-forestry 64.8 0.0 0.1 Uzbekistan Moderate to high density crops and livestock 173,266.3 222.5 683.7 Uzbekistan Other 21,161.9 34.5 97.6 Uzbekistan PAs with forests and wetlands 7,711.5 4.4 18.3 Uzbekistan Unmanaged 164,935.1 7.1 307.3
Source: FAO-Unesco (2007); FAO (2010) and authors‘ calculations.

56
Annex table 3: Number of cattle, chickens, pigs and sheep in ECA countries, 1995, 2000, 2005 and 2009
Cattle (‗000) Chickens (‗000) Country 1995 2000 2005 2009 1995 2000 2005 2009 Albania 840 728 655 494 2,624 4,087 4,671 5,138 Armenia 504 479 573 585 2,700 4,100 4,590 3,950 Azerbaijan 1,341 1,664 2,007 2,281 13,600 14,200 17,500 21,450 Belarus 5,403 4,326 3,963 4,131 29,900 26,400 23,500 29,200 Bosnia & Herzegovina 403 462 460 458 3,700 9,000 9,540 17,260 Bulgaria 638 682 672 565 17,822 13,300 17,159 15,765 Croatia 493 427 471 447 10,724 10,351 7,267 6,707 Czech Republic 2,030 1,574 1,397 1,349 25,522 13,658 14,322 24,042 Estonia 420 267 250 238 3,130 2,414 2,161 1,757 Georgia 944 1,122 1,145 1,028 7,346 8,000 9,300 6,200 Hungary 910 857 723 701 33,906 25,890 32,814 31,165 Kazakhstan 8,073 3,998 5,204 5,992 32,450 17,880 25,530 30,000 Kyrgyzstan 920 932 1,035 1,225 1,978 2,659 4,121 4,000 Latvia 551 378 371 380 3,700 3,100 3,450 4,000 Lithuania 1,152 898 792 771 8,650 6,226 8,227 8,841 Macedonia, FYR 281 270 248 253 4,880 3,350 2,617 2,172 Moldova 832 423 331 218 14,362 12,535 17,420 18,220 Poland 7,306 6,083 5,483 5,700 46,395 49,526 134,424 124,129 Romania 3,481 3,051 2,808 2,684 70,157 69,143 87,014 84,373 Russian Federation 43,296 28,032 22,988 21,038 483,200 339,000 328,707 366,282 Serbia & Montenegro 1,950 1,427 1,196 1,163 23,491 18,948 14,816 17,116 Slovakia 916 664 540 484 7,322 6,080 13,262 13,249 Slovenia 477 471 451 470 5,415 4,256 3,114 4,387 Tajikistan 1,199 1,037 1,303 1,800 1,473 770 2,296 3,682 Turkey 11,901 11,054 10,069 10,860 183,684 239,748 296,876 244,280 Turkmenistan 1,181 1,400 2,025 2,154 4,000 5,500 10,000 14,570 Ukraine 19,624 10,627 6,903 5,079 136,000 118,000 131,976 158,800 Uzbekistan 5,484 5,268 6,571 8,025 18,000 14,407 20,540 29,100
Source: FAO (2011)

57
Annex table 3 (continued): Number of cattle, chickens, pigs and sheep in ECA countries, 1995, 2000, 2005 and 2009 (continued)
Pigs (‗000) Sheep (‗000) Country 1995 2000 2005 2009 1995 2000 2005 2009 Albania 100 103 147 160 2,480 1,939 1,760 1,768 Armenia 82 71 89 85 623 506 557 527 Azerbaijan 33 20 23 10 4,373 5,280 6,887 7,685 Belarus 4,005 3,566 3,407 3,704 230 92 59 53 Bosnia & Herzegovina 400 450 653 529 490 584 903 1,055 Bulgaria 1,986 1,512 931 784 3,398 2,549 1,693 1,475 Croatia 1,175 1,233 1,205 1,250 453 529 796 619 Czech Republic 3,867 3,688 2,877 1,909 134 90 148 197 Estonia 460 286 340 365 62 28 38 78 Georgia 367 411 484 86 754 553 689 690 Hungary 4,356 5,335 4,059 3,383 947 934 1,397 1,236 Kazakhstan 1,983 984 1,292 1,347 24,273 8,725 11,519 14,126 Kyrgyzstan 118 105 83 63 4,924 3,264 2,965 3,606 Latvia 501 394 436 384 86 29 39 67 Lithuania 1,260 936 1,073 897 40 14 22 48 Macedonia, FYR 172 226 156 194 2,466 1,289 1,244 455 Moldova 1,061 683 398 284 1,411 930 823 762 Poland 20,418 17,122 18,112 14,279 713 362 316 286 Romania 7,758 5,848 6,495 6,174 10,897 8,121 7,425 8,882 Russian Federation 24,859 18,271 13,413 16,162 31,818 12,603 15,494 19,602 Serbia & Montenegro 4,192 4,087 3,177 3,604 2,671 1,917 1,837 1,814 Slovakia 2,037 1,562 1,149 741 397 337 321 362 Slovenia 571 558 534 432 29 73 119 139 Tajikistan 33 1 1 0 1,958 1,472 1,782 2,579 Turkey 8 3 4 2 35,646 30,256 25,201 23,975 Turkmenistan 128 35 30 30 6,100 7,500 13,089 13,513 Ukraine 13,946 10,073 6,466 6,526 4,793 1,060 875 1,096 Uzbekistan 350 80 87 92 9,053 8,000 9,555 11,405
Source: FAO (2011)

58
Figure 1: Emissions by sector, 2005
Source: WRI (2011) and authors‘ calculations.
Figure 2: Emissions by type of gas, 2005
Source: WRI (2011) and authors‘ calculations.
0% 20% 40% 60% 80% 100%
Australia & New Zealand
Sub-Saharan Africa
Middle East & North Africa
Latin America & Caribbean
Western Europe
E. Europe & Central Asia
US and Canada
South & SE Asia Pacific
Share of total
Energy AgricultureIndustrialprocesses Other
0% 20% 40% 60% 80% 100%
Australia & New Zealand
Sub-Saharan Africa
Latin America & Caribbean
Middle East & North Africa
E. Europe & Central Asia
Western Europe
US and Canada
South & SE Asia Pacific
Share of total
CO2 CH4 N2O Other

59
Figure 3: Agricultural GDP, agricultural emissions from methane and nitrous oxide, 2005
Source: WRI (2011) and World Bank (2011).
0
5
10
15
20
25
30
35
0
20
40
60
80
100
120
140
Esto
nia
Tajik
ista
n
Mac
edo
nia
, FYR
Mo
ldo
va
Latv
ia
Kyr
gyzs
tan
Slo
ven
ia
Bo
snia
& H
erze
govi
na
Arm
enia
Lith
uan
ia
Geo
rgia
Alb
ania
Turk
men
ista
n
Aze
rbai
jan
Cro
atia
Bu
lgar
ia
Slo
vaki
a
Bel
aru
s
Kaz
akh
stan
Cze
ch R
epu
blic
Hu
nga
ry
Ukr
ain
e
Uzb
ekis
tan
Ro
man
ia
Po
lan
d
Ru
ssia
n F
eder
atio
n
Turk
ey
Constant 2005U.S. dollars (billions)
CO2 emissions(megatonnes)
N2O and CH4 agricultural emissions (left axis)
Agricultural GDP (right axis)

60
Figure 4: Change in share of emissions by type of gas between 1990 and 2005.
Source: WRI (2011) and authors‘ calculations.
-100% -80% -60% -40% -20% 0% 20% 40% 60% 80% 100%
Uzbekistan
Ukraine
Turkmenistan
Turkey
Tajikistan
Slovenia
Slovakia
Serbia & Montenegro
Russian Federation
Romania
Poland
Moldova
Macedonia, FYR
Lithuania
Latvia
Kyrgyzstan
Kazakhstan
Hungary
Georgia
Estonia
Czech Republic
Croatia
Bulgaria
Bosnia & Herzegovina
Belarus
Azerbaijan
Armenia
AlbaniaCO2 CH4 N2O
Other gas

61
Figure 5: Change in share of emissions by sector between 1990 and 2005.
Source: WRI (2011) and authors‘ calculations.
-100% -80% -60% -40% -20% 0% 20% 40% 60% 80% 100%
Uzbekistan
Ukraine
Turkmenistan
Turkey
Tajikistan
Slovenia
Slovakia
Serbia & Montenegro
Russian Federation
Romania
Poland
Moldova
Macedonia, FYR
Lithuania
Latvia
Kyrgyzstan
Kazakhstan
Hungary
Georgia
Estonia
Czech Republic
Croatia
Bulgaria
Bosnia & Herzegovina
Belarus
Azerbaijan
Armenia
Albania Energy Agriculture OtherIndustry

62
Figure 6: Mitigation potential by agricultural practice.
Source: Smith et al. (2007)
Figure 7: Mitigation potential in agriculture by region.
Source: Smith et al. (2007).
0 400 800 1200
Restore cultivated organic soils
Cropland management
Grazing land management
Restore degraded lands
Rice management
Livestock
Set-aside, LUC and agroforestry
Manure management
CO2-eq per year (megatonnes)
Note: Abatement costs are given in costs per ton CO2 equivalentin U.S. dollars
Up to $20Up to $50
Up to $100
0 500 1,000 1,500
Middle East and North Africa
South Asia
Eastern Europe and Central Asia
Latin Aermica and Carribean
Sub-Saharan Africa
East Asia and Pacific
CO2 emissions per year (megatonnes)
Technical mitigation potential of agricultural sectors

63
Figure 8: Low cost annual abatement potential by 2030 in Turkey
Source: McKinsey (2009) reported in EBRD (2011)
Figure 9: Low cost marginal abatement potential in Russia
Source: McKinsey (2009) reported in EBRD (2011)
0
50
100
150
200
Power Buildings Transport Industry Waste Agriculture
2030 abatement potential in Turkey
20 to 100 €/tCO2e0 to 20 €/tCO2eWin-Win
Potential (CO2e, megatonnes)
0
50
100
150
200
250
Forestry BuildingsPower & PetroleumIndustry Agriculture Transport Waste
2030 abatement potential in Russia
20 to 100 €/tCO2e
0 to 20 €/tCO2e
Win-Win
Potential (CO2e, megatonnes)

64
Figure 10: Land degraded by human activity.
Source: FAO (2000)
0 2 4 6 8
South Asia
Middle East & North Africa
High Income
Latin America & Caribbean
Sub-Saharn Afric
East Asia Pacific
East Europe & Central Asia
Million square kilometers
Human enduced land degradation
Degraded by agriculture Degraded in other ways

65
Figure 11 Change in production and yield of cereal grains from 1993 to 2007
Source: FAO (2011)
-10% 0% 10% 20%
Albania
Argentina
Armenia
Azerbaijan
Belarus
Bosnia & Herzegovina
Bulgaria
Canada
China
Colombia
Croatia
Czech Republic
Estonia
Georgia
Hungary
Kazakhstan
Kyrgyzstan
Latvia
Lithuania
Republic of Moldova
Romania
Russian Federation
Serbia and Montenegro
Slovakia
Slovenia
Tajikistan
Macedonia, FYR
Turkey
Turkmenistan
Ukraine
Uzbekistan
Annualized change
ProductionYield

66
Figure 12: Livestock and changing land use in ECA
Source FAO (2011)
100
150
200
250
300
350
400
100
150
200
250
300
350
400
1961 1966 1971 1976 1981 1986 1991 1996 2001 2006
Animal units (thousand)
Hectares (millions)
Land devoted to crops
Meadows and grazing land
Livestock(right axis)

67
Figure 13: Changing composition of livestock in ECA
Source: FAO (2011) and authors‘ calculations.
0
20
40
60
80
100
120
140
160
1961 1966 1971 1976 1981 1986 1991 1996 2001 2006
Animals units (thousands)
Cattle
Chickens
Pigs
Sheep

68
Figure 14: Changing composition of livestock in ECA by country.
Source: FAO (2011)
-15% -5% 5% 15% 25% 35%
Albania
Armenia
Azerbaijan
Belarus
Bosnia & Herzegovina
Bulgaria
Croatia
Czech Republic
Estonia
Georgia
Hungary
Kazakhstan
Kyrgyzstan
Latvia
Lithuania
Macedonia, FYR
Moldova
Poland
Romania
Russian Federation
Serbia & Montenegro
Slovakia
Slovenia
Tajikistan
Turkey
Turkmenistan
Ukraine
Uzbekistan
Annualized percentage change
Change in livestock from 1995 to 2008
CattleChickensPigsSheep

69
Figure 15: Carbon markets, 2005-2010.
Source State and Trends of the Carbon Market 2011 (World Bank, 2011)
0
20
40
60
80
100
120
140
2005 2006 2007 2008 2009 2010
Carbon market transactions
EU ETS allowances
Other allowances
Primary CDM
Seconardy CDM
Other Offsets
U.S. dollars, billions

70
Figure 16: Project offsets as annualized reductions from 1990 emissions and average emission reduction
Note: Project reduction represent average annual offsets expected from CDM and JI projects from 2008 to 2012 as percentage share of 1990 GHG emissions.
-5% -3% -1% 1% 3%
Turkmenistan
Turkey
Tajikistan
Slovenia
Latvia
Kyrgyzstan
Kazakhstan
Croatia
Bosnia & Herzegovina
Belarus
Slovakia
Serbia & Montenegro
Albania
Czech Republic
Poland
Estonia
Armenia
Georgia
Uzbekistan
Romania
Moldova
Hungary
Russian Federation
Ukraine
Macedonia, FYR
Bulgaria
Lithuania
Azerbaijan Average emission change (1990-2005)Project reductions as share of 1990 emissions

71
Figure 17: Sources of investor financing, all CDM and JI projects
Source: Risoe (2011) and authors‘ calculations.
Figure 18: Sources of investor financing, CDM and JI projects in ECA
Source: Risoe (2011) and authors‘ calculations.
Unilateral27%
Netherlands24%United
Kingdom13%
Denmark8%
Japan6%
Switzerland5%
Austria5%
Sweden3%
Other9%
Share of ECA pipleline offsets by investor country
United Kingdom29%
Unilateral15%
Switzerland13%
Japan13%
Netherlands9%
Germany4%
Sweden3%
Italy3%
Spain3%
Other8%
Share of global pipleline offsets by investor country

72
Figure 19: Indicators of general business environment
The table draws on enterprise surveys in Albania, Armenia, Azerbaijan, Belarus, Bosnia and Herzegovina, Bulgaria, Croatia, the Czech Republic, Estonia, Georgia, Hungary, Kazakhstan, Kosovo, Kyrgyz Republic, Latvia, Lithuania, Macedonia, Moldova, Montenegro, Poland, Romania, the Russian Federation, Serbia, Slovak Republic, Slovenia, Tajikistan, and the Ukraine. (World Bank 2011)
0 20 40 60
Corruption is a problem
Audited financial statement
Court system is fair
Line of credit
Quality certification
Private foreign ownership
Percentage of responding firms
ECA countries with no projectsECA countries with projectsSouth AsiaLatin America & CaribbeanEast Asia & Pacific

73
Figure 20: Measure of climate policy environment
Source: Teytelboym and Steves (forthcoming)
0.0 0.2 0.4 0.6
Bosnia and Herzegovina
Turkmenistan
Montenegro
Tajikistan
Kyrgyzstan
Kazakhstan
Belarus
Croatia
Latvia
Slovenia
Azerbaijan
Russian Federation
Serbia
Albania
Armenia
Georgia
Moldova
Uzbekistan
Macedonia
Estonia
Ukraine
Slovak Republic
Bulgaria
Hungary
Poland
Romania
Lithuania
Czech Republic
Climate laws, institutions and measures index
ECA with projects
ECA without projects

74
Figure 21: Investment structure by region.
Source: Risoe (2011) and authors’ calculations.
0% 50% 100%
Africa
East Asia Pacific
Eastern Europe & Central Asia
Latin America
South Asia
Share of projects
Investment structure by share of projects
No FDI Strictly FDIPartnership

75
Figure 22: Average project experience at start of new project by types of investors.
Notes: Average project experience shows the number of projects in regions other than ECA,or within ECA for the public sector and for private firms in the indicated year.
0
10
20
30
40
2005 2006 2007 2008 2009 2010 2011
Average project experience
Regional experience, private firms
Outside experience,private firms
Regionalexperience,
public sector
Outside experience,public sector
Regional unilateralexperience

76
Map 1 : Organic carbon content of topsoils in East Europe & Central Asia (FAO-UN, 2007)
Map 2 : Select land use types in Eastern Europe and Central Asia (FAO 2010)

77
Map 3 : Net Primary Production loss from 1983-2003 (FAO, 2008)