u.s. geological survey water-resources investigations
TRANSCRIPT

EFFECTS OF TREATED MUNICIPAL EFFLUENT IRRIGATION ON GROUND WATER BENEATH SPRAYFIELDS, TALLAHASSEE, FLORIDA
By Janet B. Pruitt, John F. Elder, and Ivy Kelley Johnson
U.S. GEOLOGICAL SURVEY Water-Resources Investigations Report 88-4092
Prepared in cooperation with the CITY OF TALLAHASSEE, FLORIDA
Tallahassee, Florida 1988

DEPARTMENT OF THE INTERIOR DONALD PAUL HODEL, Secretary
U.S. GEOLOGICAL SURVEY Dallas L. Peck, Director
For additional information write to:
District ChiefU.S. Geological SurveySuite 3015227 North Bronough StreetTallahassee, Florida 32301
Copies of this report can be purchased from:
U.S. Geological SurveyBooks and Open-File Reports SectionFederal Center, Building 810Box 25425Denver, Colorado 80225

CONTENTSPage
Abstract .................................................................................._ 1Introduction..........................................................................^^ 1
Purpose and scope.............................................................................................................................. 2History of effluent spray irrigation in Tallahassee.......................................................................... 2Site description .................................................................................................................................. 2Previous studies ................................................................................................................................. 5Acknowledgments.............................................................................................................................. 7
Methods of investigation ........................................................................................................................ 7Installation of monitor wells.............................................................................................................. 7Sampling and analytical techniques.................................................................................................. 7
Field procedures ........................................................................................................................ 7Laboratory procedures............................................................................................................... 7
Physical characteristics of the area of investigation............................................................................... 9Physiography and topography........................................................................................................... 9Hydrogeology...................................................................................................................................... 9
Surficial aquifer........................................................................................................................... 9Floridan aquifer system.............................................................................................................. 9
Effects of spray irrigation and precipitation on water levels................................................................ 18Effects of spray irrigation on ground-water quality............................................................................... 18
Quality of effluent in relation to unaffected ground water............................................................ 18Physical properties and inorganic constituents....................................................................... 21Bacteria........................................................................................................................................ 22
Quality of ground water .................................................................................................................... 22Nitrogen and chloride ................................................................................................................ 22Other inorganic constituents and physical properties ........................................................... 24Bacteria........................................................................................................................................ 27
Organic constituents in effluent and ground water ....................................................................... 28Organic compounds detected in effluent ................................................................................ 28Organic compounds detected in ground water ...................................................................... 30
Summary and conclusions ........................................................................................................................ 32References ................................................................................................................................................. 33
ILLUSTRATIONSPage
Figure1. Map showing locations of the Thomas P. Smith Wastewater Renovation Plant and the
southwest and southeast sprayfields near Tallahassee, Florida.................................................... 32. Map of southeast sprayfield showing numbered wells and center-pivot irrigation system ......... 43. Diagram of most common well construction in southeast sprayfield ............................................ 84. Map of the surface topography of the southeast sprayfield ............................................................ 115. Map showing thickness of unconsolidated deposits and location of cross section A-A'............ 126. Cross section of the southeast sprayfield, north to south ................................................................ 137-9. Maps showing:
7. Altitude of the top of the Floridan aquifer system ............................................................... 148. Potentiometric surface of the Upper Floridan aquifer, May 1985, in part of north
Florida..................................................................................................................................... 169. Altitude of potentiometric surface of the upper 40 feet of the Upper Floridan aquifer,
August 25,1986 ...................................................................................................................... 17
111

10-14. Graphs showing:10. Water-level changes in selected wells in the Floridan aquifer system compared
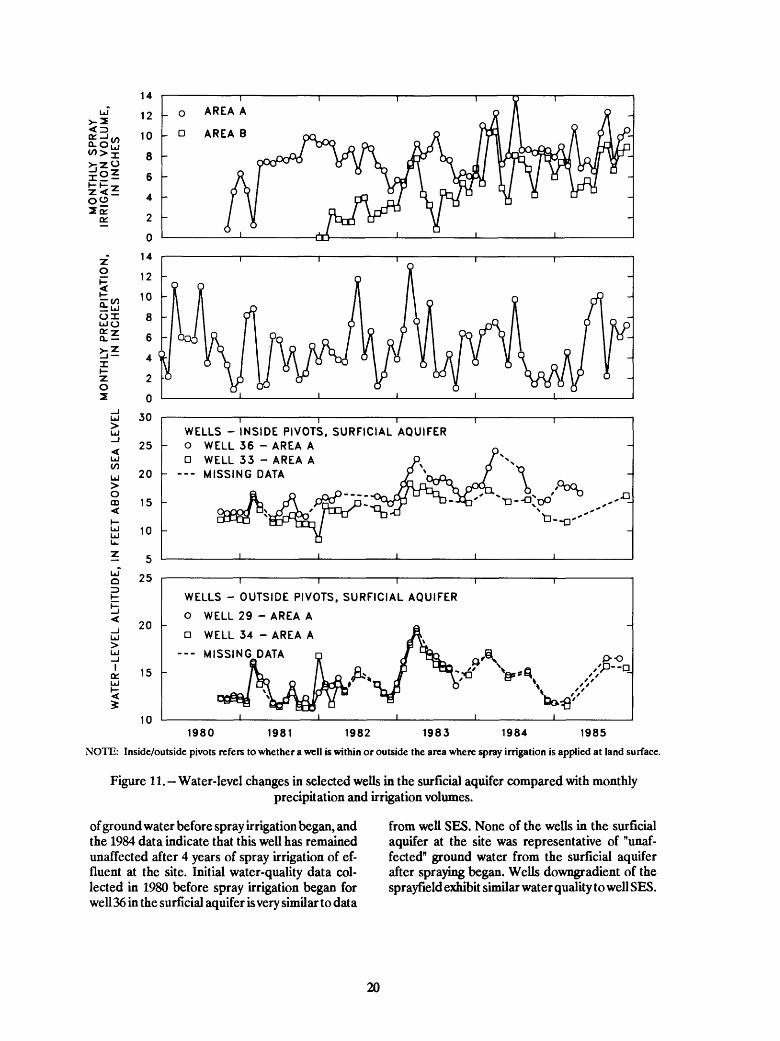
with monthly precipitation and irrigation volumes, 1980-85 ...................................... 1911. Water-level changes in selected wells in the surficial aquifer compared with
monthly precipitation and irrigation volumes, 1980-85............................................... 2012. Monthly concentrations of dissolved chloride and total nitrate-nitrite nitrogen in
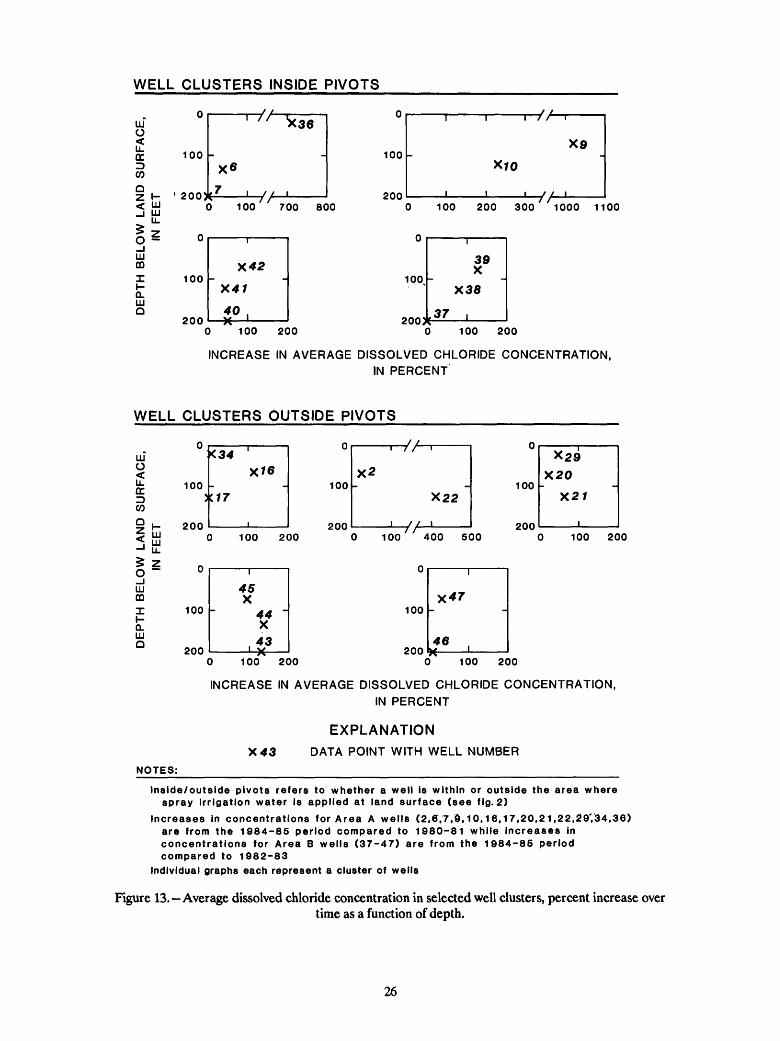
samples collected from five wells (1980-85) ................................................................. 2513. Average dissolved chloride concentration in selected well clusters, percent
increase over time as a function of depth ...................................................................... 2614. Percent frequency of occurrence of chloroform and trichloroethene (TCE) in
samples of treated wastewater and from wells clustered inside pivot tracts ............. 31
TABLES
Page Table
1. Well descriptions and sampling site identifications ......................................................................... 62. Groups of water-quality constituents measured, analytical methods used, and method
detection limits................................................................................................................................. 103. Hydrogeologic units ............................................................................................................................. 154. Mean concentrations of physical properties and inorganic chemical constituents and median
bacterial densities in the surficial aquifer (well 36) prior to the beginning of spray irrigation in background Floridan aquifer system ground water (well SES) from samples collected in 1980 and 1984, in effluent from pond samples collected in 1984, in precipitation in 1984, and maximum contaminant levels for drinking water ................................................................. 21
5. Summary of wells having statistically significant upward trends (probability level less than or equal to 0.05) in nitrate and chloride concentrations in samples collected between January 1980 and December 1985 ................................................................................................. 23
6. Summary of bacteria data, 1980-85 ................................................................................................... 287. Summary of organic compounds detected and concentration ranges in treatment plant,
pond, and ground-water samples, October 1983 through December 1985 .............................. 29
IV

EFFECTS OF TREATED MUNICIPAL EFFLUENT IRRIGATION ONGROUND-WATER BENEATH SPRAYFIELDS,
TALLAHASSEE, FLORIDA
By Janet B. Pruitt, John F. Elder, and Ivy Kelley Johnson
ABSTRACT
Collection of ground-water quality data began in November 1979 at the southeast Tallahassee spray- irrigation site, before the initial application of secondary-treated municipal wastewaterin Novem ber 1980. Effects of effluent irrigation on ground- water quality were evident about 1 year after spraying began in 2 of the 45 observation wells at the site. These effects have generally continued and have in creased in statistical significance during the study period of 1983-85. However, it is not possible to determine if the upward trend in concentrations in surficial aquifer wells is continuing or beginning to level off.
Chloride and nitrate concentrations in ground water have continued to increase since about lyear after spraying began. Nitrate-nitrogen concentra tions have increased from 0.03 milligram per liter up to a maximum of 11 milligrams per liter in one well in the surficial aquifer and from 0.07 to 15 milli grams per liter in one well in the Floridan aquifer system. The greatest increases in concentrations have occurred in wells in the surficial and Floridan inside spray irrigation pivots. Concentration in creases have occurred in some wells in the Floridan outside and downgradient of pivots, indicating lateral movement within the Floridan. Sodium con centrations have increased with chloride increases. Increases in the concentrations of other inorganic constituents have been minor.
Nine volatile organic halocarbon compounds were detected in treated wastewater samples. Low concentrations of two of these halocarbons, chloro form and trichloroethene (TCE), were detected at infrequent occasions in ground-water samples from six wells. None of the detections of organic com pounds in ground water exceeded Florida drinking water standards.
INTRODUCTION
Land application of secondary-treated muni cipal wastewater (effluent) by the City of Tallahas see, Fla., began on a 20.5-acre site southwest of Tallahassee as an experimental project in 1966. In 1987, the city disposed of approximately 15 Mgal/d (million gallons per day) of effluent by spraying on nearly 2,000 acres of forage grain and silage crops at two sites. This study represents a continuing cooperative effort with the City of Tal lahassee for the assessment of ground-water quality and hydrologic effects of spray irrigation of effluent.
Although land application of wastewater was used in the United States as a method of waste dis posal and crop irrigation since the late 1800's, it did not become a widely accepted method for treatment and disposal by municipalities until nearly 100 years later (Pound and Crites, 1973). Technology in the 1950's and 1960's favored com plex treatment systems with disposal to surface waters. Rapidly escalating costs and decreasing surface-water quality led to Federal regulations in the 1970's which required that land application as a disposal method be considered before Federal grants were approved for wastewater-treatment plant construction (Crites and others, 1977). Municipalities were also given a 10 percent bonus in grant money from the U.S. Environmental Pro tection Agency for using an alternative waste- water-treatment technology, such as land application (Wright and Rovey, 1979). The use of land application by a municipality as a disposal method also provides additional wastewater treat ment from the natural filtering system provided by plants and soil, conserves water by recharging the aquifer, fertilizes crops grown for forage and silage, and provides revenue for the city (Sopper and Kardos, 1973; Carlson, 1976; Sheaffer, 1979).

Potential problems with this disposal-treatment method could include the transport of excessive levels of nutrients, refractory organics, heavy me tals, and bacteria to ground water (Johnson, 1979). Although some States allow land disposal of primary treated wastewater, the State of Florida requires that wastewater intended for reuse, such as irrigation of fodder crops, receive secondary treatment (Florida Department of En vironmental Regulation, 1983).
Purpose and Scope
The purpose of this report is to define the effects of spray irrigation of treated municipal wastewater on ground water quality beneath the City of Tallahassee's southeast sprayfield. This report presents the results of analyses of data col lected from January 1983 through December 1985 and describes trends in water quality from effluent and wells. Some data collected during the first 3 years (1980-82) of effluent irrigation at the south east sprayfield, reported by Elder and others (1985), also are included in the report to demon strate long-term effects of this operation on ground water.
History of Effluent Spray Irrigation in Tallahassee
Before experimental spray irrigation began in Tallahassee in 1966, treated effluent from the city wastewater-treatment plants flowed by way of Munson Slough to Lake Munson, southwest of Tallahassee (fig. 1). When experimental irrigation began, about 0.5 Mgal/d of effluent from a trick- ling-filter plant at the present southwest site was used for irrigation of a 20.5-acre tract adjacent to the plant. All other treated wastewater from other city plants continued to flow into Lake Munson. The city expanded the treatment plant (Thomas P. Smith Wastewater Renovation Plant) at the south west irrigation site to a 7.5 Mgal/d activated sludge process in 1974 and reached a maximum of 119 irrigated acres at the southwest site in 1977.
In 1980, a larger spray-irrigation site (1,090 acres) was opened southeast of Tallahassee (fig. 1) and part of the original southwest irrigation site was used for further treatment plant expansion. The treatment plant now has a capacity of 17 Mgal/d and discharge to Lake Munson has been eliminated. Combined effluent from the Smith plant and the Lake Bradford Road plant, a 4.5 Mgal/d trickling-filter plant, produced approx imately 15 Mgal/d for spray irrigation. Approx imately 1 Mgal/d goes to the southwest field for irrigation of about 100 acres of coastal bermuda grass. In March 1982, spray irrigation began on an additional 750 acres at the southeast site. The site, planted seasonally with corn, sorghum, soybeans, and rye, is mostly operated as a no-till farm. The farmer, under contract with the City of Talla hassee, also grazes cattle on part of the site during the winter months.
Site Description
The sprayfield site described in this report as the southeast site is located southeast of Tallahas see and approximately 8.5 miles east of the waste- water-treatment plant (fig. 1). The site is illustrated in figure 2.
Throughout this report samples referred to as "treatment plant" were collected at the point where the mixed treated wastewater from both plants is transported to a pumping station. Efflu ent, piped from the pumping station through a force main, is held in ponds lined with Hypalon at the southeast site. Samples referred to as "pond" were collected from the holding pond at the point where effluent is pumped to the irrigation pivots.
The 1,840-acre field is divided into 11 circular tracts ranging in size from about 100 acres to about 180 acres. Each tract contains a center-pivot spray unit. The western part of the field, labeled "area A" in figure 2 and containing pivots 1 through 7, comprises the 1,090 acres irrigated since Novem ber 1980. Irrigation of the 750-acre "area B" began in March 1982.
1 Use of brand, trade, or firm names in this report is for identification purposes onfy and does not constitute endorsement by the U.S. Geological Survey.

AREA OF INVESTIGATION
TALLAHASSEE
LAKEBRADFORD
ROAD PLANT
AIRPORT WELL
MUNJCIPAL AIRPORT
SOUTHWESTSPRAY
IRRIGATIONFIELD AND
THOMAS P. SMITH \WASTEWATERRENOVATION
PLANT LAKE MUNSON
SOUTHEASTSPRAY IRRIGATION
FIELD
EFFLUENT FORCE MAIN
3 KILOMETERS
Figure 1. Locations of the Thomas P. Smith Wastewater Renovation Plant and the southwest and southeast sprayfields near Tallahassee, Florida. (Modified from Elder and others, 1985.)

84'12'40"
30D22'07"
30D20'48
23,50
84°10'36"
SPRAYFIELD BOUNDARY
24,5!
EXPLANATION
,5! WATER-QUALITY SITE AND INDIVIDUAL WELL NUMBERS
4 PIVOT SPRAY UNIT NUMBER-Area of circles indicates approximate area where spray irrigation water is applied
0 1,000 2,000 3,000 4,000 5,000 FEET
500 1,000 METERS
Figure 2. Southeast sprayfield showing numbered wells and center-pivot irrigation system. Area A western half (pivots 1-7). Area B = eastern half (pivots 8-11). (From Elder and others, 1985.)

Monitoring wells throughout the Held, inside and outside pivot areas, are referred to locally by numbers or letters. A unique 15-digit site iden tification number (table 1) has been assigned to each well and to both effluent sampling points. This site number is based on the latitude-longi tude grid system and provides a geographic loca tion for each well. The first six digits denote degrees, minutes, and seconds of latitude; the next seven digits denote degrees, minutes, and seconds of longitude; and the last two digits represent a se quential number for sites within a 1-second grid.
Previous Studies
In a statewide study, Franks (1981) docu mented the widespread use of land application of treated wastewater in Florida. Of the 2,500 sites permitted by Florida Department of Environmen tal Regulation for land application of domestic wastewater, about 10 percent were reported em ploying irrigation methods, 22 percent drainfields, and 68 percent infiltration ponds. Franks (1981) noted that most land application sites employing spray-irrigation methods that have adequate mon itoring plans have a minimal impact on ground- water quality. Impacts at both Tallahassee spray irrigation sites may be more evident due to exten sive monitoring during the experimental opera tion of the site and continued monitoring efforts.
During the first 8 years of effluent spray irriga tion in Tallahassee, irrigation rates at the south west site were higher than normal for this type of site in order to gather design information. Moni toring of plant growth, for pearl millet nutrient up take, and effluent application rate variations were part of a cooperative study by the City of Tallahas see and the University of Florida (Overman and Smith, 1973) to determine optimum conditions for effective operation of a spray-irrigation facility for the purpose of wastewater renovation. They con cluded that the "efficiency of nitrogen recovery decreases with increasing application rates."
In 1972, the U.S. Geological Survey entered into a cooperative investigation with the City of Tallahassee to determine hydrologic and chemi cal effects of effluent spray irrigation on ground water at a field southwest of the city. Slack (1975) reported that concentrations of phosphorus, biochemical oxygen demand (BOD), and fecal
coliform were removed or reduced before the per colating effluent reached the underlying ground water. He also noted increasing chloride and nitrogen concentrations in the Floridan aquifer system during the 2-year study period (1973-74). Slack found that ammonia, the most significant form of nitrogen in the effluent, underwent nitri fication in soils at the site. Average ammonia nitrogen concentrations (0.02-0.34 mg/L (milli grams per liter)) in ground-water samples from three shallow wells collected over the 2-year per iod were 60 to 1,000 times lower than the average concentration (20 mg/L) in effluent samples whereas average nitrate nitrogen concentrations (3.8-19 mg/L) in ground-water samples were 10 to 60 times higher than the concentration (0.34 mg/L) in effluent samples. Background concen trations in ground water of ammonia nitrogen and nitrate nitrogen averaged 0.03 and 0.05 mg/L, respectively. Organochlorine pesticides, chloro- phenoxy acid herbicides, polychlorinated biphe- nyls (PCB), and polychlorinated naphthalenes (PCN) were not detected in any of seven wells sampled once or in a single effluent sample.
Overman (1979) reported that the sandy soil at the southwest irrigation site was effectively remov ing BOD, fecal coliform, suspended organic mat ter, and phosphate. He also studied a variety of crops determining that growth of forage crops in summer and winter under effluent irrigation was feasible at this site.
Yurewicz (1983) and Yurewicz and Rosenau (1986) reported hydrologic changes and water- quality effects on ground water at the southwest spray-irrigation site during a study period from March 1972 to June 1981. They noted signifi cantly increased concentrations of chloride and nitrate at the site, with the highest percentage in crease over time during periods of experimental high application rates (1972-76). No other water- quality characteristics were significantly impacted by effluent irrigation during the study period. Ground-water samples were collected from 18 wells in 1978 and analyzed for organochlorine insecticides, chlorophenoxy acid herbicides, and PCB, but as in the previously noted 1974 sampling, these compounds were not detected in any samples. Yurewicz and Rosenau (1986) also noted no significant effects of effluent application

Table 1. Well descriptions and sampling site identifications
[LSD, land surface datum; --, unknown. Casing material: P, polyvinyl chloride; S, steel]
[All wells tap the Floridan aquifer system except wells 28 through 36 which tap the surficial aquifer. Finish on all wells is openhole except wells 28 through 36 which are screened]
WellNo.
12346
79101214
1516171819
2021222324
2829303132
3334353637
3839404142
4344454647
48495051
SES
Site identification
No.
302116084123701302049084120901302116084120701302045084120901302157084115101
302157084115102302053084115101302053084115102302208084123801302141084123601
302141084123602302051084123502302051084123501302141084114001302117084113801
302051084113802302051084113801302051084120901302045084123701302046084113801
302116084120702302051084113803302049084120902302117084113802302141084123603
302101084123701302051084123503302141084114002302157084115103302114084105201
302114084105202302114084105203302151084111901302151084111902302151084111903
302110084110601302110084110602302110084110603302058084105101302058084105102
302203084110001302150084103801302045084123702302046084113802302212084114401
Depth of well, in feet below LSD
71466247
102
24252
1335551
10270
1236374
531391275756
2122122222
17224040
240
11573
19413465
18312072
17445
9555
129170200
Open interval, in feet
144950
271944
6-
101123
31425
90
00000
0000
49
1410301422
911173
14
68
2484
Depth of
casing, in feet below LSD
57425342
101
21551
1245147
%
1125251
501251024856
2122122222
17224040
191
10163
16412043
17410955
17131
8947-
146116
Land surface datum (LSD), in feet
20.3826.0542.0227.5750.16
51.1136.9939.2046.5635.44
34.8029.8431.3859.4446.88
29.9230.2227.9632.4824.55
42.0530.2127.1946.1634.94
26.9531.0259.0249.4332.17
32.7332.2847.2047.2747.84
40.3041.6742.3927.4127.71
54.1833.4132.9325.6746.61
Water level after
drilling, in feet
13.0712.9416.6916.4914.51
14.8813.2216.0014.1512.38
14.2212.5912.9811.4415.74
12.8812.7912.9814.1813.23
..12.94-
24.7213.02
12.5612.82-
14.577.17
12.7311.2812.2012.2712.84
5.301.677.399.41
10.71
12.1812.417.93
10.6714.61
Water Diameter level of casing,
(date) in inches
02/19/8002/13/8010/02/7910/02/7907/08/80
07/08/8005/12/8007/30/8007/10/8010/30/80
08/29/8008/20/8007/11/8002/06/8007/30/80
07/09/8007/09/8007/09/80OS/IS/SOOS/IS/SO
..10/03/8003/12/8110/21/8010/21/80
10/03/8010/03/80
-10/03/8008/31/81
09/02/8109/23/8109/28/8109/30/8110/05/81
10/16/8110/08/8110/09/8110/23/8110/22/81
11/06/8111/10/8112/18/8112/03/8112/16/80
44448
44444
44444
44444
22222
22224
44444
44444
44448
Casing material
SPSSS
SPSPP
SPSSS
PPSSPPPPPPPPPPS
SSSSS
SSSSS
SSSSS

on ground-water levels in the Floridan aquifer sys tem, even during periods of high application rates of up to 16 in/wk (inches per week).
Elder and others (1985) documented back ground water-quality and hydrologic conditions and changes that occurred during the first 3 years of operation of the southeast site. The results of this study are discussed in detail later in this report.
Pruitt and others (1985) determined, in a 1983- 84 reconnaissance of 15 municipal wastewater- treatment plants in Florida employing spray irrigation as a method of disposal, that effluent from most of the plants contained chloroform and some contained other organic compounds. Samples of ground water at these sites revealed volatile organic compounds at only four plants. Samples from the southwest and southeast site in Tallahassee revealed no organic compounds de tected in ground water at either site (detection level was 3 |jig/L (micrograms per liter). Two effluent samples from the pond contained detect able quantities of two organophosphorus insecti- cides (diazinon and malathion), one organochlorine insecticide compound (lindane), one volatile halocarbon (trichloroethene), and a ubiquitous industrial ester [bis(2- ethyl- hexyl)phthalate]. In the one effluent sample col lected at the treatment plant, only the same two organophosphorus insecticides found in the pond were detected.
Acknowledgments
The authors gratefully acknowledge the con tinued assistance and cooperation received from Thomas P. Smith, former Director of Under ground Utilities, and William G. Leseman, Super intendent, Water Quality Laboratory, City of Tallahassee. We also thank the laboratory staff and the southeast sprayfield staff for their assis tance in sampling and analytical efforts.
METHODS OF INVESTIGATION
Installation of Monitor Wells
Wells were installed in the sprayfield at the southeast site to monitor three principal zones: surficial aquifer (10-40 feet below land surface), upper part of the Upper Floridan aquifer (41-149 feet below land surface), and lower part of the
Upper Floridan aquifer (150-250 feet below land surface). Most wells are located in or between the 11 spray-irrigation pivots in the sprayfield; a few wells are just outside the sprayfield boundary (fig. 2). Well SES is the drinking water supply well for the southeast sprayfield. Table 1 lists physical characteristics of these wells.
The wells in the Floridan aquifer system were installed by reverse rotary and cable-tool methods. After setting steel or polyvinyl chloride (PVC) casing, the wells were grouted to land sur face. The surficial wells were installed by hand or power augering. Samples of cuttings from wells 2-4,6-7,9,10,12,14-24, 37-49, and 51 were ex amined for lithology. Gamma ray logs were run on wells 2-4, 6-7, 9,10,12,14-24, 37, 40, 43, 46, 48,49,51, and SES.
Sampling and Analytical Techniques
Field Procedures
The surficial aquifer wells (28-36) were sampled with a bailer. The Floridan aquifer sys tem wells have permanently installed submersible pumps (fig. 3).
The following field measurements were made at each well as the water samples were collected: water level, pumping volume, temperature, pH, and specific conductance. Alkalinity was deter mined at selected sites.
Samples collected for analysis of dissolved con stituents were field filtered, using 0.45 micrometer pore-size membrane filters. Immediately follow ing collection, filtration, and preservation, if re quired, samples were chilled on ice and transported to the appropriate laboratories on the same day as collection.
Quality assurance of field data was assessed by an ongoing district reference sample program. Field measurement methods and collection tech niques comply with established U.S. Geological Survey procedures (Wershaw and others, 1983; Fishman and Friedman, 1985).
Laboratory Procedures
The City of Tallahassee Water-Quality Laboratory performed most of the analyses using methods which follow U.S. Geological Survey (U.S. Environmental Protection Agency, 1979; Wershaw and others, 1983; Fishman and

ALUMINUM SHELTER
GROUND LEVEL
ELECTRICAL OUTLET FOR STARTER BOX
GENERATOR CONNECTION
PVC DISCHARGE PIPE
OPENING FORWATER-LEVELMEASUREMENT
CONCRETE SLAB
A
.WIRES TO PUMP
CASING, STEEL OR PVC
PUMP
Figure 3. Most common well construction in southeast sprayfleld. (Modified from Elder and others,1985.)

Friedman, 1985) and "Standard Methods" (American Public Health Association, 1985) pro cedures. U.S. Geological Survey laboratories in Ocala, Fla., and Doraville, Ga., provided the remainder of the analytical work, including quality assurance samples using established Geological Survey procedures. Analysis of 18 duplicate sam ples performed both by the City of Tallahassee laboratory and U.S. Geological Survey labora tories indicated no statistical difference in results. Laboratory quality assurance efforts included split samples between the laboratories, analysis of standard reference materials, blind reference samples, Held blanks, and method spikes. Table 2 lists water-quality constituents measured, analyti cal methods used, and method detection limits.
PHYSICAL CHARACTERISTICS OF THE AREA OF INVESTIGATION
Physiography and TopographyThe sprayfield southeast of Tallahassee is in an
area named the "Woodville Karst Plain" by Hendry and Sproul (1966) and consists of a buried limestone surface with sinkholes, overlain by sand, silt, and clay. The limestone is part of the Floridan aquifer system, the principal source of ground water in northern Florida. The sprayfield is lo cated on a topographic high that continues to higher altitudes to the north. Land surface slopes from altitudes of 70 to 20 feet above sea level in the sprayfield toward the Gulf of Mexico to the south and to adjacent areas east and west of the field (fig. 4). To the east of the sprayfield there are small lakes and intermittent tributaries to the St. Marks River. Some ponds and swamps are found to the west. Some ponds also exist in the southern half of the sprayfield, but no streams drain the field. Before development of the spray- field the area was a forest of planted pine trees.
Hydrogeology
Surficial Aquifer
The surficial aquifer consists of the deposits between land surface and the Floridan aquifer sys tem. The upper few feet have been described by Sanders (1981). The predominant soils in the sprayfield are Kershaw and Ortega sands, generally consisting of sand with 7 percent or less silt and clay to a depth of 6 feet. The soil zone is
unsaturated except in the vicinity of the ponds in the southern part of the sprayfield.
The surficial material above the Floridan aquifer system has been described by Schmidt (1979) and by Hendry and Sproul (1966) as most ly clayey sand and medium-to-fine sand and silt.
Examination of the lithologic samples from the test wells confirm that the sediments comprising the surficial aquifer range from a fine-to- coarse sand to'a clayey, silty, very fine-to-coarse sand with discontinuous lenses of clay which, in general, be come thicker and more numerous with increasing depth. The geologic and hydrogeologic units un derlying the sprayfield are shown in table 3. Figure 5 shows thickness of the unconsolidated deposits, based on geophysical logs, drillers' logs, and examination of well cuttings. A geologic sec tion, marked A-A' in figure 5 is illustrated in figure 6, The surficial aquifer does not appear to be a good source of water for domestic wells be cause its saturated thickness is small in most areas and because of the presence of clay lenses.
Part of the surficial material at the southeast field is saturated, and the water table in the surfi cial aquifer is above the potentiometric surface of the Upper Floridan aquifer. The water table gen erally follows the slope of land surface. Data on the position of the water table are not sufficient to permit mapping.
The clay layers within the surficial aquifer do not constitute an effective confining bed because they are not continuous and because they are breached by sinkholes. Most of the ground-water flow from the surficial aquifer into the Floridan probably occurs where the clay layers are thin or missing.
Floridan Aquifer System
The geologic units that constitute the Floridan aquifer system (Miller, 1982b) are shown in table 3. The top of the Floridan is generally between 20 feet above and 40 feet below sea level (fig. 7) near the sprayfield (Elder and others, 1985) and slopes to the south at an irregular rate to altitudes of 0 to 50 feet below sea level along the Gulf Coast in Wakulla County (Kwader and Schmidt, 1978).
Lithologic samples, gamma-ray logs, and dril lers' logs from the test wells were used to prepare

Table 2. Groups of water-quality constituents measured, analytical methods used, and method detectionlimits
[--, not established]
Code Method Code Method1 Chromatographic, gas, purge and trap, 6 Colorimetric, cadmium-reduction, automated
electrolytic conductivity detector. 7 Colorimetric, phosphomolybdate, automated 2 Chromatographic, gas, electron capture, 8 Spectrometric, atomic absorption, hydride
solvent extraction, esterification. 9 Spectrometric, atomic absorption, direct 3 Chromatographic, gas, electron capture, 10 Spectrometric, atomic absorption, cold vapor
solvent extraction. 11 Colorimetric, ferric thiocvanate, automated 4 Colorimetric, indophenol, automated 12 Electrometric, ion-selective electrode 5 Colorimetric, block digestor-salicyiate- 13 Turbidimetric, barium sulfate, automated
hypochlorite, automated. 14 Membrane filterMethod
Constituent Method detectioncode limit
Purgeable halocarbons, totalrecoverable, micrograms per liter
Bromoform 1 0.10Bromomethane 1 5.0Carbon tetrachloride 1 .10Chlorobenzene 1Chloroethane 1 5.02-Chloroethyivinyl ether 1 5.0Chloroform 1 .05Chloromethane 1 5.0Dibromochloromethane 1 .10Dichlorobromomethane 1 .101,2-Dichlorobenzene 1 101,3-Dichlorobenzene 1 101,4-Dichlorobenzene 1 10Dichlorodifluoromethane 1 5.01,1-Dichloroethane 11,2-Dichloroethane 1 3.0trans-l,2-Dichloroethene 1 1,1-Dichloroethene 11,2-Dichloropropane 1 5.0cis-l,3-Dichloropropene 1 5.0trans-l,3-Dichloropropene 1Methylene chloride 1 1.51,1,2,2-Tetrachloroethane 1Tetrachloroethene 1 .051,1,1-Trichloroethane 1 .101,1,2-Trichloroethane 1Trichloroethene (TCE) 1 .10Trichlorofluoromethane 1 5.0Vinyl chloride 1 5.0
Chlorophenoxy acid herbicides, totalrecoverable, micrograms per liter
2,4-D 2 0.10Silvex 2 .10
Nutrients, total milligrams per liter
Nitrogen, ammonia 4 0.01Nitrogen, Kjeldahl 5 .01
(organic + ammonia)Nitrogen, nitrate 6 .10Nitrogen, nitrite 6 .01Nitrogen, nitrate + nitrite 6 .10Phosphorus, total 7 .01Phosphorus, ortho- 7 .01
MethodConstituent Method detection
code limit
Organochlorine insecticides andrelated compounds, total
recoverable, micrograms per liter
Aldrin 3 0.10a-BHC 3 .01b-BHC 3 .01d-BHC 3 .01Chlordane 3 .20p,p'-DDD 3 .10p,p'-DDE 3 .10p,p'-DDT 3 .10Dieldrin 3 .10Endrin 3 .01Endrin aldehyde 3 .01Endosulfan I 3 .01Endosulfan II 3 .01Endosulfan sulfate 3 .05Heptachlor 3 .05Heptachlor epoxide 3 .05 Lindane (g-BHC) 3 .01Methoxychlor 3 .01Mirex 3 .05Polychlorinated 3 .25
biphenyls (PCB)Toxaphene 3 .20
Organophosphorus insecticides, totalrecoverable, micrograms per liter
Demeton 3 0.10Diazinon 3 .10Guthion 3 2.0Malathion 3 .20Parathion, ethyl 3 .10
Major inorganic ions, dissolved,milligrams per liter
Cations
Calcium 9 OJMagnesium 9 .1Potassium 9 .1Sodium 9 .1
Anions
Chloride 11 0.1Fluoride 12 .05Sulfate 13 -5
MethodConstituent Method detection
code limit
Trace metals, dissolved,milligrams per liter
Arsenic 8 1Cadmium 9 1Chromium 9 10Copper 9 1Iron 9 10Lead 9 1Manganese 9 10Mercury 10 .1Selenium 8 10Zinc 9 10
Bacteria, count per 100 milliliters
Coliform, total 14 1Coliform, fecal 14 1Streptococcus, 14 1
fecal
10

84°12'40"
84°10'36"30°22'07"
30°20'48
EXPLANATION
-30 TOPOGRAPHIC CONTOUR--Shows altitude of land surface. Contour interval 10 feet. Hachures indicate depressions. Datum is sea level
0 1,000 2,000 3,000 4,000 5,000 FEET
500 1,000 METERS
Figure 4. Surface topography of the southeast sprayfield. (Modified from U.S. Geological SurveyWoodville 7.5-minute quadrangle, 1954.)
11

84°12'40"
30°22'07" -
30°20'48' SPRAYFIELD BOUNDARY
GO
A A'
EXPLANATION
LINE OF EQUAL THICKNESS OF UNCONSOLIDATED DEPOSITS ABOVE FLORIDAN AQUIFER SYSTEM-lnterval 20 feet
LINE OF GEOLOGIC SECTION (fig. 6)
CONTROL POINT-Upper figure is well number; lower figure is thickness, in feet
0 1,000 2,000 I i r^
3,000 4,000 5,000 FEET
500 1,000 METERS
Figure 5. Thickness of unconsolidated deposits and location of cross section A-A'. (From Elder andothers, 1985.)
12

A 1
0 500 METERS
VERTICAL EXAGGERATION X 41
Figure 6. - Cross section of the southeast sprayfield, north to south. (Modified from Elder and others,1985.)
13

84°12'40"
30°22'07"
30°20'48
-35
EXPLANATION
-2O STRUCTURE CONTOUR-Shows altitude of the top of the Floridan aquifer system. Contour interval 20 feet. Datum is sea level
^ 4 CONTROL POINT-Upper figure is well number; lower figure ~6 is altitude of top of Floridan aquifer system, in feet
above or below sea level.
0 1,000 2,000 3,000 4,000 5,000 FEET
500 1,000 METERS
Figure 7. Altitude of the top of the Floridan aquifer system. (Modified from Elder and others, 1985.)
14

Table 3. Hydrogeologic units
[From Hendry and Sproul (1966), Schmidt (1979), and Miller (1982b; 1986)]
Series
Holocene to
Miocene
Miocene
Oligocene
Eocene
Formation
Fine sand and silt, clayey sand, and clay.
St. Marks Formation
Suwannee Limestone
Ocala Limestone Avon Park Formation
Undifferentiated fine-grained elastics
Hydrogeologic unit
Surficial aquifer
Floridan aquifer system
(includes Upper Floridan aquifer)
Confining unit
Thickness (feet)
25-70 1
About 1,600
Unknown
Thickness is much greater in buried sinkholes. The greatest thickness of buried materialsr.»^e ^Vi*-lll4- 1 *5 n -FciQ4- -i T-l tATQ 1 1 7found was about 130 feet in well 7.
a detailed map of the altitude of the top of the Floridan aquifer system at the sprayfield (fig. 7). The upper part of the Floridan (St. Marks Forma tion) appears to be a poorly consolidated and partly clastic deposit. Some shallow, open-hole wells caved during drilling, indicating structural weaknesses of the St. Marks Formation. New sink holes could form at any time, especially during and following droughts or extensive development of high yielding wells. The deepest test wells (7 and 37) penetrate the Suwannee Limestone.
The base of the Floridan aquifer system in this area is described by Miller (1982a; 1986) as the top of undifferentiated units of "silty, highly glauconitic, micaceous, fine-grained sand inter- bedded with brown, lignitic clay" of early Eocene age, with an altitude of about -1,500 feet. The Floridan in the sprayfield area is about 1,400 to 1,500 feet thick, according to Miller (1982b; 1986).
The Floridan aquifer system has been subdi vided by Miller (1986) into the Upper Floridan aquifer, the middle (intervening) confining unit, and the Lower Floridan aquifer. Only the Upper Floridan aquifer, which constitutes the uppermost
part of the Floridan aquifer system, will be dis cussed in the remainder of this report.
The potentiometric surface of the Upper Flori dan aquifer hi the Floridan aquifer system in May 1985 (fig. 8) is shown by Rosenau and Meadows (1987). The flow of ground water is from the po tentiometric surface highs in north Florida and south Georgia toward Apalachee Bay. Addi tional recharge to the aquifer occurs along the flow path. The sprayfield area is classified as an area of high recharge (10-20 in/yr (inches per year)) by Stewart (1980). Computer model simulations of the predevelopment flow of the Floridan aquifer system by Bush (1982) estimate the rate of recharge to the Floridan aquifer system to be 15 to 20 in/yr in the sprayfield area.
In the particular area of the southeast spray- field, the direction of ground-water flow in the Floridan aquifer system is toward the south and southwest (figs. 8 and 9). As in the surrounding area, natural recharge occurs along the flow path, and such recharge is augmented by spray irriga tion. The direction of vertical hydraulic gradient in the upper 150 feet of the Floridan, based on
15

84°30'
GEORGIA
"FLORIDA"84°
30°30'
EXPLANATION
SOUTHEAST SPRAYFIELD
POTENTIOMETRIC CONTOUR-Shows altitude at which water level would have stood in tightly cased wells. Contour interval 10 feet. Datum is sea level
OBSERVATION WELL
$_ AREA OF MAJOR SPRING DISCHARGE DOWNGRADIENT 1 FROM THE SPRAYFIELD
QUINCY RAIN GAGE SITE
10 20 MILES
10 20 KILOMETERS
Figure 8. Potentiometric surface of the Upper Floridan aquifer, May 1985, in part of north Florida.(Modified from Rosenau and Meadows, 1986.)
16

84°12'40"
30°22'07"
30°20'48
EXPLANATION
14 POTENTIOMETRIC CONTOUR-Shows altitude at which water level would have stood in tightly cased wells. Dashed where approximate. Contour interval 1 foot. Datum is sea level
CONTROL POINT-Upper figure is well number; lower figure is water-level altitude, in feet above sea level
DIRECTION OF GROUND-WATER FLOW
0 1,000 2,000 3,000 4,000 5,000 FEET
500 1,000 METERS
Figure 9. Altitude of potentiometric surface of the upper 40 feet of the Upper Floridan aquifer,August 25,1986.
17

water levels in deep and shallow limestone wells at the sampling sites, is upward throughout most of the field. Where the vertical hydraulic gradient is upward within the Floridan, recharge is not entering the deeper part of the Floridan. The up ward gradient may be changed to a downward gradient by continued spray irrigation or by heavy rainfall. The downward gradient near the south ern edge of the sprayfield is probably a local phe nomenon. The gradient is probably upward near the St. Marks and Wakulla Rivers which are major discharge points.
Discharge from the Upper Floridan aquifer is to numerous springs (Rosenau and others, 1977), to the spring-fed St. Marks and Wakulla Rivers to the south, to evapotranspiration near these streams, to the Gulf of Mexico, and to wells. Pumpage constitutes a very small part of the dis charge from the aquifer system in this area. The City of Tallahassee used about 20 Mgal/d in 1987 from wells distributed throughout the city. A com mercial establishment about 3 miles west of the sprayfield and the supply well at the sprayfield each use less than 0.01 Mgal/d. These withdrawals have little effect on the potentiometric surface in the sprayfield because of the very high transmissiv- ity and high recharge rate of the Floridan aquifer system. Bush (1982) estimates a transmissivity of greater than 1,000,000 ft2/d (feet squared per day), based on a computer model simulation of pre- development flow in the Floridan aquifer system.
EFFECTS OF SPRAY IRRIGATION AND PRECIPITATION ON WATER LEVELS
The amount of effluent applied by spray irriga tion to the southeast field ranged from 24 to 580 Mgal/mo (million gallons per month), or 0.8 inch to 12 in/mo (inches per month), and averaged 6.2 in/mo from the initial application in November 1980 through December 1985. During the first 16 months, all effluent was applied to area A through pivots 1 through 7 (fig. 2). In March 1982, effluent application began on area B using pivots 8 through 11. Figure 10 illustrates the monthly variation of irrigation volume in both areas A and B.
Monthly precipitation during 1980-85, measured at the National Weather Service site near the Tallahassee airport (fig. 1), is also shown in figure 10. Precipitation varied from a low of 0.89 inch in December 1980 to a high of 13.04 inches in
March 1983. The average for the 5-year period was 4.9 in/mo. This overall range and average is similar to the spray-irrigation volume range but precipitation varies more significantly from month to month.
Elder and others (1985, p. 25-29) demon strated the strong correlation between precipita tion and water levels in wells at the southeast sprayfield. Figures 10 and 11 show water levels in wells in.'the Floridan and surficial aquifers at the site, in addition to water levels in a well offsite at the airport, and graphs of precipitation and irriga tion rates from 1980 to 1985. A similar correspon dence between all hydrographs and precipitation is evident, whereas a correspondence between water levels and irrigation rates is not. Since monthly irrigation volumes fluctuate over a nar rower range than precipitation, moisture levels are kept high in the soil allowing variations in precipitation to have even greater effects on water levels. Water levels in wells inside pivots are af fected by rainfall and irrigation whereas wells out side or at the edge of pivots are affected primarily by rainfall.
EFFECTS OF SPRAY IRRIGATION ON GROUND-WATER QUALITY
Quality of Effluent in Relation to Unaffected Ground Water
Table 4 lists mean concentrations of physical properties, inorganic chemical constituents, and bacteria in surficial aquifer water (well 36) prior to spray irrigation, in unaffected Floridan ground water (well SES) from samples collected in 1980 and 1984, and in pond samples collected in 1984. The table also lists maximum contaminant levels (MCL), established by the State of Florida (Florida Department of Environmental Regula tion, 1985), for these properties and chemical con stituents in public drinking water. None of the concentrations in pond samples or unaffected ground-water samples exceeds the established MCL.
Well SES was chosen to represent background or "unaffected" ground water from the Floridan aquifer system as it is 200 feet deep, located within the area of investigation but outside the pivot tracts, and upgradient in the ground-water flow system. The 1980 data in table 4 represent quality
18

z<±
zO
oxLJCJ
zO
25
20
>LJ 15
<" 10LJ
S 25mf-
tj" 20Li.
Z
LJ
Q 15K tj
_i 10LJ
£ 35
WELLS - INSIDE PIVOTS, FLORIDAN AQUIFER SYSTEM
o WELL 9 - AREA A
D WELL 42 - AREA B
-- MISSING DATA
WELLS - OUTSIDE PIVOTS, FLORIDAN AQUIFER SYSTEM
o WELL 18 - AREA AD WELL 45 - AREA B -- MISSING DATA
AIRPORT WELL - FLORIDAN AQUIFER SYSTEM
MISSING DATA
1980 1981 1982 1983 1984 1985 NOTE: Inside/outside pivots refers to whether a well is within or outside the area where spray irrigation is applied at land surface.
Figure 10. Water-level changes in selected Floridan aquifer system wells compared with monthly precipitation and irrigation volumes, 1980-85.
19
ox
o3
oCD
25
20
15
10
5
25
20
i 15 ui<
10
WELLS - INSIDE PIVOTS, SURFICIAL AQUIFER o WELL 36 - AREA A D WELL 33 - AREA A -- MISSING DATA
n_**-*
WELLS - OUTSIDE PIVOTS, SURFICIAL AQUIFER
O WELL 29 - AREA A
D WELL 34 - AREA A
--- MISSING DATA P-0
1980 1981 1982 1983 1984 1985
NOTE: Inside/outside pivots refers to whether a well is within or outside the area where spray irrigation is applied at land surface.
Figure 11. Water-level changes in selected wells in the surficial aquifer compared with monthlyprecipitation and irrigation volumes.
of ground water before spray irrigation began, and the 1984 data indicate that this well has remained unaffected after 4 years of spray irrigation of ef fluent at the site. Initial water-quality data col lected in 1980 before spray irrigation began for well 36 in the surficial aquifer is very similar to data
from well SES. None of the wells in the surficial aquifer at the site was representative of "unaf fected" ground water from the surficial aquifer after spraying began. Wells downgradient of the sprayfield exhibit similar water quality to well SES.
20

Table 4. Mean concentrations of physical properties and inorganic chemical constituents and median bacterial densities in the surficial aquifer (well 36) prior to the beginning of spray irrigation in background Floridan aquifer system ground water (well SES) from samples collected in 1980 and 1984, in effluent from pond samples collected in 1984, in precipitation in 1984, and maximum contaminant levels in drinking water
[mg/L = milligrams per liter; pg/L = micrograms per liter; mL = milliliters; MCL = maximum con taminant level; (p) = primary drinking water regulations; (s) = secondary drinking water regulations; and NS = no standard available (Florida Department of Environmental Regulation, 1985); precipita tion sample from Quincy rain gage (see fig. 8 for location) on May 8-15,1984]
Property or constituent
Well 36 1980
SFS1980 1984
Pond Precipitation1984 1984 MCL
Physical propertypH, units 7.9 7.9 7.8 7.0
Nutrients, total. mg/LNitrogen, Kjeldahl .30 .12 .04 7.8 Nitrogen, ammonia as
nitrogen Nitrogen, nitrate plus .02 .30 .42 6.0
ninte as nitrogen Phosphorus, total .08 .05 .03 4.1
Maior inorganic ions, dissolved, mg/LCalcium 44 30 30 31 Magnesium 2.5 8.6 8.6 26.9 Potassium .4 .4 3.8 6.5 Sodium 1.8 2.9 2.8 37 Chloride 3.4 4.0 3.8 43 Fluoride 3 .2 .2 3 Sulfate 8.7 8.6 10.5 23
Trace metals, dissolved, pg/LArsenic <1 1 <1 <1Cadmium 2 < 1 < 1 < 1Chromium 7 4 <10 3Copper 110 <1 <1 5Iron 1,080 <3 3 74Lead 130 <1 3 <1Manganese 21 <1 1 9Mercury <.l <.l <.l <.lSelenium <1 <1 <1 <1Zinc 60 50 75 21
Bacteria, colonies per 100 mLColiform, total - <1 <1 300 Colifonn, fecal - <1 <1 40 Streptococcus, fecal - <1 <1 25
5.4
.19
.62
.14
.11
.04
.46
.76
£6.5 (s)
NS NS
10
NS
NS NS NS 160 250
1.4-2.4 250
NS NS
(P)
P)
(P)
Average of four colonies per 100 mL per month when less than 20 samples per month are collected.
Physical Properties and Inorganic Constituents
Concentrations of inorganic constituents in pond samples are generally higher than back ground concentrations in the Floridan aquifer sys tem or the surficial aquifer in nutrient and common ion groups, although calcium and mag
nesium concentrations in the Floridan are ap proximately the same as in the pond (table 4). In some cases, trace metal concentrations are higher in ground water than in the pond. Precipitation samples have generally lower or similar concen trations of inorganic constituents than do back ground ground-water samples.
21

Measurements in 1980 of pH in surficial aquifer well 36 (7.7-8.2) are slightly greater than pH in unaffected Floridan aquifer system ground water (7.3-8.0). Samples from both aquifers yield pH measurements greater than measurements made in pond samples which range from a pH of 6.8 to 73.
Nitrogen and phosphorus concentrations in the pond are significantly greater than in ground water. Average total nitrogen concentrations range from 0.5 mg/L in well SES in 1984 to 16 mg/L in the pond. More than half of the nitrogen con centration in pond water is comprised of organic nitrogen and ammonia. Nitrate plus nitrite ac count for the remaining part. Total phosphorus concentrations are considerably greater in pond samples (4.1 mg/L) than in water from surficial or Floridan aquifer wells that are less than 0.1 mg/L.
Chloride, potassium, sodium, and sulfate con centrations are higher in the pond than in Floridan or surficial ground water. Calcium and magne sium concentrations in pond samples are very sim ilar to those in background Floridan aquifer system ground water. Trace metal concentrations in the effluent are below the MCL set for drinking water. Concentrations of chromium, lead, and zinc are lower in the pond than in background Floridan aquifer system and surficial aquifer ground water.
Bacteria
Coliform bacteria were found in much higher concentrations in pond samples than in control well SES (table 4). No fecal coliform or total colifonn was reported in samples collected from well SES in 1980 and 1984. The median bacteria counts are based on 103 pond samples and 11 well samples. None of the wells was disinfected after drilling and development. Well 36 in the surficial aquifer was not sampled for bacteria before the beginning of spray irrigation.
Quality of Ground Water
During the first 3 years of ground-water monitoring (1980-82) at the southeast site, Elder and others (1985) observed substantial changes in pH, specific conductance, total inorganic nitrogen (TIN: nitrate, nitrite, and ammonia), chloride, and phosphorus concentrations in ground water
from the surficial aquifer and Floridan aquifer system beneath the area A part of the southwest sprayfield. Although not all observed changes were statistically significant, they warranted fur ther monitoring since the data collected during the 3-year study were often insufficient to detect trends. Most observed changes did not occur un til approximately 1 year after irrigation began. Since irrigation of area B did not begin until March 1982, Elder and others (1985) did not have a sufficient data base to test ground-water data in that area for trends.
Data collected during the current study period (1983-85) and the previous study period (1980- 82), were analyzed for time trend using the Seasonal Kendall test. Crawford and others (1983) describe this nonparametric trend tech nique as "suitable for detecting monotonic trends in time series with seasonability, missing values, or values reported as 'less than'." Hirsch and others (1982) point out, however, that when skewed data and/or extreme seasonal effects are present a sub jective examination of the data may yield con clusions appreciably different from this statistical tool. As a result, both statistical and examination techniques were used to analyze the data.
Changes began to occur after about 1 year after spray irrigation commenced. These changes were evident in well 36 in the surficial aquifer between 13 to 15 months after spraying began and in shal low well 9 in the Floridan aquifer system between 11 to 14 months after spraying began. Hereinafter, these wells will be referred to as Floridan wells and surficial wells.
Nitrogen and Chloride
Organic nitrogen in spray effluent is not directly available for plant uptake nor is it readily leached from soil. Organic nitrogen can be con verted to inorganic nitrogen by oxidation or by microbial action in the soil. Ammonia nitrogen as ammonia is readily volatilized if the pH is above 9. Since the pH of the effluent is usually less than 8.5, ammonia nitrogen in the sprayed effluent ex ists primarily as the ammonium ion which can be bound by clay in the soil or utilized by plants (Broadbent, 1973: Hem, 1985). Nitrification may occur when micro-organisms transform the ammonium ion to nitrate. Nitrite is formed as an
22

intermediate product during the biotransforma- tion of ammonia to nitrate or during denitrifica- tion of nitrate-rich soils. Nitrite is usually mobile, unstable, and readily converted to nitrate in the presence of oxygen. Nitrate is very soluble, and thus is easily transported from the soil to ground water. Commercial fertilizers, which contain high concentrations of nitrogen, phosphorus, and potassium, are applied by the farmer to the south east field. No data are available at this time to determine what impact, if any, fertilizer applica tion may have on local ground water. High con centrations of nitrate have been detected in ground water associated with long-term disposal of effluent on farmland suggesting the need for regulation of effluent application to balance nitrate input with crop uptake (Hinesly and others, 1978).
Elder and others (1985) observed statistically significant increases in TIN (total inorganic nitro gen) concentrations in two Floridan wells (9 and 10) and one surficial well (36). Data from two addi tional wells, Floridan well 22 and surficial well 29, also exhibited significant increasing trends when only nitrate data instead of TIN data were sub jected to trend analysis. In ground-water samples collected at this site, the contribution of nitrite and ammonia nitrogen to the TIN concentrations of ground water is usually less than 0.10 mg/L. Be cause the contribution of the nitrate ion to TIN concentrations in ground-water samples is so much greater than that of the other two ions, only the effects of nitrate will be addressed in the remainder of this report.
The significant upward trend in nitrate concen trations continued from 1983-85 in three of the five wells (9,10, and 22) in area A noted during the pre vious study, but concentrations in surficial aquifer well 29remained relatively stable and no continued upward trend was observed (fig. 12). A statistically significant upward trend continued in surficial well 36 even though the variability in nitrate concentra tions (between 1 mg/L and 30 mg/L) was extremely high. Two other Floridan wells (20 and 21) and one other surficial well (33) in area A now show up ward trends in nitrate concentrations. The ap parent upward trends in wells 33 and 36 and the apparent leveling off of nitrate concentration in well 29 are inconclusive in determining whether the upward trend in nitrate concentrations is con
tinuing or leveling off. Surficial wells 28,30,31,32, and 35 do not have a sufficient data base over both study periods for application of trend analysis techniques because the water table was located below the position of the screened interval during many sampling periods. No increasing trend of nitrate concentrations has occurred in any other sampled wells including the wells outside the sprayfield boundary.
In area B, five Floridan aquifer system wells (40, 41, 43, 44, and 45) have significantly increasing nitrate concentrations. In the well cluster contain ing wells 43, 44, and 45, which are outside pivot tracts, well 43, the deepest, has the greatest nitrate concentration (5.93 mg/L). Because these wells are located outside a pivot area, the increases in nitrate concentrations are probably a result of the lateral movement of ground water within the Flor idan from a pivot upgradient of the well cluster. These three wells are located in an area where a downward water-level gradient is present in the upper 150 feet of the Upper Floridan aquifer (Elder and others, 1985, p. 21). The downward vertical gradient and flow system heterogenieties probably account for the deepest well having the greatest nitrate concentration. Table 5 lists the wells with statistically significant (significance level = 0.05) upward trends in nitrate concentrations.
Table 5. Summary of wells having statistically significant upward trends (probability level less than or equal to 0.05) upward trends in nitrate and chloride concentrations in samples collected between January 1980 and December 1985
Aquifer and
aquifer Areasystem tapped
Nitrate Chloride
Wells within pivot tracts
Floridan Floridan Surficial
Floridan Flomdan Surficial
A B A
9,1040,4133,36
9,10,1240,41,42
33,36
Wells outside pivot tracts
A 20,21,22 21,22B 43,44,45 43,44,45A none none
23

In figure 12, scatter plots show increasing ni trate concentrations plotted over time from 1980 through 1985 for three area A wells and two area B wells which exhibit significant upward trends. Nitrate concentrations in all ground-water sam ples collected during the 1980-82 study period were below the State MCL of 10 mg/L for nitrate (as nitrogen) in public drinking water (Florida Department of Environmental Regulation, 1985). During the 1983-85 study period^ nitrate concen trations exceeded the MCL in'surficial aquifer well 36 and Floridan aquifer system well 9. In creasing nitrate levels detected in samples from wells maybe the result of a combined contribution from sprayed effluent and commercial fertilizer. Monitoring nitrogen-loading rates, plant nutrient uptake, and fertilizer applications could be an im portant step in determining the combined impact of effluent irrigation and fertilizer application on ground-water nitrate levels. Regulating effluent application during periods of high rainfall may be necessary to balance the crop uptake of nutrients with the nitrogen input from all sources.
Chloride serves as an excellent conservative tracer of the movement of wastewater at the southeast site inasmuch as it is stable, soluble, readily transported to ground water, and present in high enough concentrations in the pond (45 mg/L) to distinguish it from background levels (4 mg/L) in ground water.
Significant upward trends in chloride concen trations continue to occur in four (9, 10, 22, and 36) of the five area A wells noted in the first study. As with nitrate, chloride concentrations in surfi cial well 29 did not continue to increase signif icantly as previously reported by Elder and others (1985). Surficial well 33 and Floridan wells 12 and 21 in area A now show significantly increasing chloride concentrations over the 6-year monitor ing period. In area B, upward trends in chloride concentrations were observed as significant in Floridan wells 40, 41, 42,43, 44, and 45. Wells 38 and 39 have noticeable upward trends that are not statistically significant. As seen in figure 12, chlo ride concentrations in wells 9, 22, 36, 40, and 43 began increasing approximately 1 year after spray irrigation began.
Figure 13 shows that for well clusters inside pivot areas, shallow wells have a greater percent
increase in chloride concentration over time than deeper wells. No apparent correlation between chloride concentration and depth is evident in well clusters located outside pivot areas. Surficial well 36 has a much higher percent increase than adjacent Upper Floridan well 6. Well 7, a deep Floridan well located within the same cluster as wells 6 and 36, shows no apparent increase (<5 percent) in concentration over the 6-year data- collection period.
The significantly increasing concentrations of nitrate and/or chloride in six Floridan wells (16, 18,19,20,46, and 47) located outside pivot tracts indicates lateral movement of irrigation water. Several other Floridan wells located outside pivots have increasing chloride and/or nitrate concentra tions which are not statistically significant. All wells represented in figure 13 as outside the pivot areas are located downgradient from a pivot in the ground-water flow system. Wells upgradient from and outside the pivot areas (48 and SES) show no increase in chloride or nitrate concentrations.
Vertical movement remains more important than lateral movement of irrigation water in the Floridan in the distribution of nitrate and chloride in the subsurface. Although some Floridan wells outside pivots appear to be affected by lateral movement of irrigation water, many downgradient Floridan wells outside pivots are unaffected and the highest concentrations are always found in wells inside pivots. The trend that should be ex- pected to occur, however, is for more downgradient Floridan wells to be affected by lateral movement and for the concentrations of wells inside pivots to begin to level off at some point. Thus, lateral movement will play an increas ingly significant role in the future.
Other Inorganic Constituents and Physical Properties
Although Elder and others (1985) noted in creases in total phosphorus concentrations in 16 wells in area A from 1980-82, the increases did not prove to be statistically significant, and the limited data available at that time for area B wells did not permit trend analysis. After 3 more years of data collection, no significant trends in phosphorus concentrations were found in ground-water samples at the 0.05 probability level. Two area A Floridan wells, 7 and 14, showed a slight upward
24

DIS
SO
LVE
D C
HLO
RID
E C
ON
CE
NTR
ATI
ON
, IN
MIL
LIG
RA
MS
PER
LIT
ER
h- & 2
.a^ |l 51 3- 0 B. f̂ij ? B.
ro
Ow
-r^
o
o
o
to
oo 0 i
00 00 O4
o o
jo^
^
UD
_
'-6-
cn
CO
-
1 1
> eA
i
i i
io
o*
°
9 I_
___l»
1o
I
O
N)
00
O
. Q
Q a
°-Q
Q a
3S
«3
*iS
«3
Q.
«
«
o«
0ti
oo
1 1
1 1
t> o
1 >
1 1
Op
t>
1 8
1 t>
m
>
1 1
1 1
1
5 O m CO
CO
CD
O
ro
-i*.
O
NJ
TOTA
L N
ITR
ATE
/NIT
RIT
E N
ITR
OG
EN
CO
NC
EN
TRA
TIO
N,
IN M
ILLI
GR
AM
S P
ER L
ITER
WELL CLUSTERS INSIDE PIVOTS
0HIo<£E 100DCO
2 I- ' 200)
/ /1 ' ' "xsfi
-X®
,7 , ,, ,* / /
0
100
200
/ /I i i / / i
X9_
x/o
1 1 1 / / 1/ /
< W 0 100 700 800 0 100 200 300 1000 1100
*' 0o °UJ CO
I 100
0.IllQ
1
X42-
X41
4°,
0
100.
onr>^
1
39 X
X38
.37 i0 100 200 0 100 200
INCREASE IN AVERAGE DISSOLVED CHLORIDE CONCENTRATION,IN PERCENT
WELL CLUSTERS OUTSIDE PIVOTS
Q n / L n
LUO
£ 100D 3CO
9 H- 200
K34 'x/e
-
117
,
U
100
200
i / / '
X2_
X22
i //i/ /
X29
X20100 -
X27
200 I < W 0 100 200 0 100 400 500 0 100 20-1 U.
^ z n0 °
UJ COT 100I- Q.UJ Q
200 r* ^v,w -rs
'
45 X
44 'X
, 43I vs
u
100
onn
i
X 47-
46^0 100 200 0 100 200
INCREASE IN AVERAGE DISSOLVED CHLORIDE CONCENTRATION,IN PERCENT
X43
EXPLANATION
DATA POINT WITH WELL NUMBER
NOTES:
Inside/outside pivots refers to whether a well is within or outside the area where spray irrigation water is applied at land surface (see fig. 2)
Increases in concentrations for Area A wells (2,6,7,6,10,16,1 7,20,21,22,29734,36) are from the 1984-85 period compared to 1980-81 while increases in concentrations for Area B wells (37-47) are from the 1984-85 period compared to 1982-83
Individual graphs each represent a cluster of wells
Figure 13. Average dissolved chloride concentration in selected well clusters, percent increase overtime as a function of depth.
26

trend at the 0.1 probability level. Maximum con centrations are still low in these wells (0.24 and 0.21 mg/L, respectively) compared to the maxi mum of 6.2 mg/L phosphorus in the pond. Increas ing concentrations of phosphorus were noted in four area B Fioridan wells (40,41,43, and 45) but the increases are not statistically significant. The lack of phosphorus transport to ground water from sprayed effluent is consistent with long-term stu dies which have shown that phosphorus removal is nearly complete (90 percent) in effluent irriga tion systems and that leaching accounts for only 3 to 5 percent of the loss (Loehr and others, 1979).
As would be expected, sodium concentrations increased proportionally with chloride increases, exhibiting upward trends in surficial wells 33 and 36 and in Fioridan wells 9,10,12,21,22,38 through 43, and 45. Because sodium analyses were per formed less frequently on ground-water samples than chloride analyses, insufficient data exist to test for statistical significance. Maximum sodium concentrations detected in Fioridan wells are still about one-tenth the concentration of the estab lished secondary MCL of 160 mg/L in drinking water (Florida Department of Environmental Regulation, 1985).
The concentrations of most other major ions (calcium, magnesium, potassium, sulfate, and fluoride), which showed no consistent patterns of change from 1980-82, remained fairly stable through 1985. The concentrations of calcium, fluoride, and trace metals (except iron) are not ex pected to increase significantly because the con centrations of these constituents in pond water is similar to or less than background ground water (table 4).
Some changes in calcium and magnesium con centrations in water from Fioridan aquifer wells have occurred. The decreasing trend in magne sium concentrations in Fioridan well 10, first noted but not substantiated by Elder and others (1985, p. 34) due to insufficient data, was now found to be significant at the 0.05 probability level. Concen trations decreased from a high of 9.4 mg/L in May 1981 to a low of 6.4 mg/L in August 1985. This trend was not duplicated in adjacent well 9 where magne sium concentrations increased from 0.8 to 2.3 mg/L between 1980 and 1985. Calcium concentrations remained stable in well 10 but increased almost
twofold in well 9. Average calcium and magnesium concentrations in the pond are nearly the same as in the background Fioridan well SES and in 1980 data from well 10. Area B Fioridan wells 38, 39, and 43, with similar calcium and magnesium con centrations to well 10, appear to also have decreas ing magnesium concentrations, but insufficient data exist to prove a decreasing trend exists. The noticeable decrease in magnesium concentrations in the four Fioridan wells and increase in calcium in one Fioridan well is currently unexplained.
Trace metal concentrations in ground water remained fairly stable, showing no statistically sig nificant patterns of change with time from 1980 through 1985.
A highly significant downward trend in pH was noted in Fioridan well 9 and surficial well 36 during the first study period. pH is generally higher in ground water from the Fioridan aquifer system than in pond water. An upward trend in specific conductance was also noted in well 9 and was related to the increase in major ion concentra tions in that well. Evidence of an increasing trend in specific conductance and a decreasing trend in pH continues to be significant at a probability level of 0.01 in well 9. Similar trends in both prop erties are evident in Fioridan well 22 and the decreasing trend at a lower statistical significance for pH (p-level = 0.10) exists in wells 10 and 36. Elder and others (1985, p. 36-37) suggest that the lowered pH may be a result of the release of carbon dioxide in conjunction with the oxidation of dissolved organic material by microbial action. Nitrification is another possible process that could be responsible for lowering pH (Brian Katz, U.S. Geological Survey, written commun., 1987). This reaction can be written as follows: NH4 + + 2O2 ^ NOs" + HO + 2H + . Another possible explanation for lowered pH is the release of a hydrogen ion during the exchange of a calcium ion in the soil (J.F. Payne and A.R. Overman, 1987, Performance and long-term effects of a waste- water spray irrigation system in Tallahassee, Florida, project no. 81829-C: Gainesville, Fla., University of Florida, unpublished thesis).
Bacteria
Data from the entire period of record (1980- 85) indicate that detections of total and fecal coli- form are sporadic in Fioridan wells with no
27

consistent patterns indicating trends in bacterial contamination. This is similar to the findings of Elder and others (1985) for the first study period (1980-82). Fecal coliform colony counts from sur- ficial well samples, although somewhat greater than for Floridan wells, are still low (table 6). These data indicate that coliform bacteria found in the ground water are generally much less than in the effluent.
Fecal streptococcus appears to be more prev alent in the Floridan and surficial wells than coli form (table 6). Although seasonal variations and increasing trends of fecal streptococcus colonies with time are not evident, the median and range of colony counts are greater than fecal coliform.
Organic Constituents in Effluent and Ground Water
One of the potential effects of land application of effluent is the possible transport of refractory organic compounds to the ground water. Some organic compounds are not effectively removed during secondary treatment. Also, some organic compounds are transformed during the chlorina- tion process to toxic halogenated compounds. The transformation reactions may occur because resid ual chlorine is desirable in the final effluent for dis- infection purposes. Although the City of Tallahassee Water Quality Laboratory had detected volatile halocarbons in the effluent from the wastewater-treatment plant prior to this study, little previous organic data had been collected from wells in the sprayfield to determine if organic compounds were being transported to the ground water by effluent irrigation.
Another possible source of transport of organic compounds to ground water are pesti cides applied at the southeast site as part of the fanning operation. The insecticides, toxaphene (organochlorine), methyl parathion (organophos- phorus), and Dursban (chlorinated organophos- phorus), as well as carbamate and pyrethrin insecticides, and carbamate, triazine, and amide and amine derivative herbicides, have been used in the farming operation at the sprayfield.
Organic Compounds Detected in Effluent
Table 7 lists concentration ranges of organic compounds detected in water samples from the treatment plant, the pond, and six monitoring wells. Also listed are MCL for public drinking water established by the Florida State Code (Florida Department of Environmental Regula tion, 1985) for seven of the detected organic com pounds. Monitoring for organic constituents in ground water began in 1983.
Ten organic compounds were detected in treatment plant and pond samples. Nine of the ten compounds are classified as purgeable halocar bons and the tenth is an organochlorine insecti cide. Samples were also analyzed for organophosphorus insecticides, chlorophenoxy acid herbicides, and PCB but no compounds in these groups were detected. See table 2 for a list of compounds in each group.
The most commonly detected purgeable halo- carbon, a trihalomethane chloroform, was found in 14 of 18 treatment plant samples and 7 of 7 pond samples. Two other trihalomethanes, bromoform
Surficial Floridan
Surficial Floridan
Table ^.-Summary of bacteria data, 1980-85
Aquiferand
aquifer system
Fecal streotococcusNo. of
samples
No. of
wellsMedian Range
No. of
samples
Fecal coliformNo. of
wellsMedian Range
7197
33228
110
526
Wells located inside pivot area
7309
410-10,000 < 1-220
16205
Wells located outside pivot area
1307
< 1-2,800 < 1-260
32230
110
526
60 < 2-1,500 <1 <1-90
< 2-220
28

Table 7. Summary of organic compounds detected and concentration ranges from treatment plant, pond, and ground-water samples, October 1983 through December 1985
[Concentrations are total recoverable in micrograms per liter; MCL = maximum contaminant level allowable in drinking water (Florida Department of Environmental Regulation, 1985) in micrograms per liter; () = number of times the compound was detected at that location; (TTHM) = total trihalomethane concentration; - - not detected; and NS = no standard avail able]
Organic compounds detected
No. of samples collected
Treated wastewater
Treatment plant Pond
18 7
Surfiiaqiiiff
Well!
7
cial '-r36 Well 6
10
Flnridan anuifer systemWell 9
22
Well 10
18
Well 41
8
Well 42
10
Trihalomethanes
Chloroform
Bromofonn
Dichlorobromo- methane
(14) 0.94-6.56
0.27-0.62
0.11-052
1.00-1540(3l
0.11-0.17
0.06-0(0)
(0)
.10 0.24-0.99(0)
(0)
(4) 0.06-0.10
(0)
(0)
0.09-0.12(0)
(0)
0.08-0.10(0)
(0)
(6) 0.10-0.30
(0)
(0)
MCL
100(TTHM)
Chlorinated purgeables
Trichloro- ethene (TCE)
1,1,1-Trichloro- ethane
Tetrachloro- ethene
1,1,2,2-Tetra- chloroethane
trans-1,2- Dichloroethene
1,1-Dichloro- ethene
(9) 0.12-1.01
(4) 0.15-2.05
0.10-8.15
(0)
(1) 0.20
£1
(4) 0.10-056
&
(2) 054-1.00
(1) 0.21
(0)
(0)
(2) (2) 0.11-0.16 0.16-0.46
(0)
(0)
(0)
(0)
(0)
(0)
(0)
(0)
(0)
(0)
(2) 0.16-0.19
(0)
(0)
(0)
(0)
(0)
(1) 0.32
(0)
(0)
(0)
(0)
(0)
(2) 0.17-0.18
(0)
(0)
(0)
(0)
(0)
(2) 0.11-0.16
(0)
(0)
(0)
(0)
(0)
3
200
3
NS
NS
NS
Chlorinated insecticide
Lindane(2)
0.04-0.08(2)
0.02-0.11(0) (0) (0) (0) (0) (0)
4
Note: Wells 6,10,41, and 42 are steel cased; wells 9 and 36 are PVC cased.
and dichlorobromomethane, were also detected, but at lower concentrations and less frequently. Trihalomethanes are readily formed during the chlorination process of municipal treatment plant effluent when common refractory compounds are present (Tomson and others, 1981). An example, shown below, of how this reaction might occur can
be demonstrated using ethanol, an alcohol often present in wastewater. Ethanol may oxidize during an aerobic step in treatment to form acetal- dchyde, which reacts with chlorine forming chloral (trichloroacetaldehyde). Chloral is unstable in water, forming the solid chloral hydrate which may degrade to chloroform (Bellar and others, 1974).
Cl, H.,0CH 3 -CH 2 OH
(ethanol)
CH 3 -C-H
(acetaldehyde)
C1 3 -C-C-H(chloral)
H
I C1 3 -C-C-(OH) 2(chloral hydrate)
CHClg
(chloroform)
29

Brominated compounds occur similarly be cause bromine is a common contaminant in com mercial chlorine. Chloroform was also the most commonly detected compound in the previously mentioned study by Pruitt and others (1985) and was reported present in effluent samples from 12 of the 15 municipal wastewater-treatment plants sampled. The State maximum contaminant level for total trihalomethanes (TTHM) is 100 jig/L. The maximum reported concentration of TTHM in the treatment plant samples during this study was 6.7 jig/L.
Tetrachloroethene, a purgeable halocarbon present in 11 of 18 treatment plant samples, was the only compound detected at concentrations exceeding the State MCL (3 jxg/L for tetrachloro- ethene). Four of the eleven detections had tetra- chloroethene concentrations of 3.1, 3.3, 7.9, and 8.2 |ig/L. Tetrachloroethene was also detected in two of seven pond samples, but at concentrations less than 3 jxg/L. The primary sources of tetra- chloroethene are dry cleaning solvents, metal de- greasers, spot removers, and household cleaners.
Other volatile halocarbons detected in treat ment plant or pond samples were: trichloroethene (TCE), 1,1,1-trichloroethane, trans-1,2- dichloroethene, 1,1-dichloroethene, and 1,1,2,2- tetrachloroethane. Of this group TCE, a common contaminant of ground water, was detected in 9 of 18 treatment plant samples and in 4 of 7 pond samples. In a U.S. Environmental Protection Agency ground-water supply survey of eight States, TCE was detected in 28 percent of the nearly 3,000 wells sampled (DeMarco, 1983). The primary source of TCE is the same as for tetra- chloroethene. 1,1,1-Trichloroethane, detected in four treatment plant samples and one pond sam ple, is commonly used in drain cleaners, inks, and shoe polishes. Each detected only in one treat ment plant sample, trans-1,2- dichloroethene, a widely used solvent, and 1,1-dichloroethene, used in the production of plastic food wraps, are also degradation products of TCE and tetra- chloroethene (Parsons and others, 1984). 1,1,2,2- Tetrachloroethane, detected only in one pond sample, is used as a solvent for herbicides and in secticides and has many industrial uses.
Lindane, the only chlorinated insecticide detected, was found at very low concentrations in
2 of 18 treatment plant samples and 2 of 7 pond samples. Lindane was also detected in two pond samples collected in 1983 at the southeast site during a statewide study of organic compounds in effluent at municipal wastewater-treatment plants (Pruitt and others, 1985). The lindane concentra tions of 0.02-0.11 jxg/L detected in this study and 0.03-0.05 jxg/L detected in the statewide study were well below the State MCL of 4 jxg/L.
Figure 14 depicts the frequency of occurrence of chloroform and TCE in treatment plant, pond, and well samples. The higher frequency of occur rence of chloroform and TCE in the pond samples, as compared to treatment plant samples, maybe due to transformation reactions occurring during impoundment as a result of prolonged con tact time of residual chlorine with the effluent.
Organic Compounds Detected in Ground Water
Water samples from one surficial aquifer well (36) and five Floridan aquifer system wells (6, 9, 10, 41, and 42) were analyzed for halogenated or ganic compounds. Table 7 summarizes the analytical results. All detections in the ground- water samples were below established MCLs. As in the treatment plant and pond samples, chloroform was the most commonly occurring contaminant and was detected in all six wells. Fre quency of occurrence, depicted in figure 14, was generally similar in wells clustered within the same pivot. The maximum concentration of chloroform detected in ground- water samples was 0.99 (ig/L in well 6. Wells 6, 9, and 42 are the shallowest Floridan wells in each of the three well clusters. No other trihalomethane compounds were detected in the wells; consequently, the TTHM concentrations in water from each well are much less than the State MCL of 100
TCE was the only other organic contaminant detected in water samples from the wells and was found in at least one sample from each well. The maximum concentration of TCE detected in ground-water samples was 0.46 jxg/L in well 6. The State MCL for TCE is 3 jxg/L.
Volatile halocarbon detections occurred much less frequently in ground-water samples than in treatment plant or pond samples (fig. 14). Because aeration is known to be an effective method for
30

WELL 42
WELL 41
WELL 36
WELL 10
WELL
WELL
POND
TREATMENT PLANT
E3 CHLOROFORMTRICHLOROETHENE
10 20 30 40 50 60 70 80 90 FREQUENCY OF OCCURRENCE, IN PERCENT
100
Figure 14. Percent frequency of occurrence of chloroform and trichloroethene (TCE) in samples of treated wastewater from wells clustered inside pivot tracts.
removal of volatile organic compounds (VOC) from water (Singley and Moser, 1983; U.S. Envi ronmental Protection Agency, 1986), such com pounds present in the pond may be removed or reduced in concentration during the spray-irriga tion process. Water turbulence created by the high pumping rate of the submersible pump may also cause volatilization of VOC during sample collec tion, yielding low analytical results. Biodegra- dation and soil sorption processes may contribute to the removal of trace organic compounds from the sprayed effluent (Bouwer and others, 1981).
Contamination of ground water by volatile organic compounds from effluent irrigation at this site is expected to be minimal as long as concentrations of these compounds in the effluent remain low.
No organochlorine or organophosphorus in secticides or chlorophenoxy acid herbicides were detected in any ground-water samples. Although carbamate and pyrethrin insecticides, and car- bamate, triazine, and amide and amine derivation herbicides have also been used at this site, no water samples collected during this study were analyzed for these compounds.
31

SUMMARY AND CONCLUSIONS
Collection of ground-water quality data began at the southeast sprayfield before the initial appli cation of secondary-treated wastewater in 1980. In the 6 years since spraying began, hydrologic and water-quality data have been collected and evaluated. Water-quality effects of effluent irri gation were evident in wells in the surficial aquifer and Floridan aquifer system in area A about 1 year after spraying began in November 1980. Approx imately 1 year after Held expansion to area B in March 1982, effects of spray irrigation became evident in surficial and Floridan aquifer wells in area B. Ground-water quality may also be im pacted at the southeast site by the application of fertilizer and pesticides as part of the contract farming operation at the site.
Water levels are affected primarily by precipitation, often showing a lag-time effect of about 1 month. Irrigation rates also affect water levels, but less significantly. Irrigation rates, which averaged 6.2 in/mo from November 1980 through December 1985, are slightly higher than precipitation (1980-85 average = 4.9 in/mo) and tend to be more regular. The more uniform irriga tion rates may maintain high moisture levels leav ing precipitation available to recharge the aquifer and affect water levels to a greater degree.
Using chloride as a conservative tracer of ef fluent migration, data indicate the vertical migra tion of wastewater downward to the water table and from the surficial aquifer to the Floridan aquifer system. The wastewater has moved laterally within the Floridan as evidenced by in creasing concentrations of chloride in some wells outside pivot areas. Lateral movement does not appear to be extensive because many Floridan wells downgradient of pivots remain unaffected. Chloride concentrations continue to increase sig nificantly in five Floridan area A wells, six Floridan area B wells, and in two surficial wells.
Nitrate concentrations in one Floridan well and one surficial well, both located inside pivot tracts, have surpassed the maximum contaminant levels established by Florida State code for drink ing water. Monitoring nitrogen-loading rates, plant nutrient uptake, and fertilizer applications could be an important step in determining the
combined impact of effluent irrigation and fer tilizer application on ground-water nitrate levels.
Most of the phosphorus in the effluent is removed by the soil and plants following spray ir rigation. Two area A wells indicate upward trends in phosphorus concentrations but maxi mum concentrations are too low to seriously im pact ground-water quality.
Most other inorganic constituents have shown no trends in data over the observed time period. Sodium concentrations increase with chloride concentrations but neither exhibits levels that ap proach the State MCL for drinking water. A decreasing trend in magnesium concentrations was noted in well 10 but the trend increased in neighboring well 9. Decreasing pH levels have been noted in three area A wells.
Fecal coliform bacteria are present in many ground-water samples, but no consistent trends in the data are evident. Fecal streptococcus is more prevalent in samples from Floridan wells although trends of increasing colony counts over time are not evident at this time.
Organic halocarbon concentrations in the treatment plant and pond samples are normally low. Organic contaminants have not significantly affected ground water at this effluent irrigation site. Nine halogenated volatile organic com pounds and one halogenated insecticide were detected in treatment plant samples. Only two of these compounds, chloroform and TCE, were detected in ground water. Although no chlorinated or organophosphorus insecticides or chlorophenoxy acid insecticides were detected in ground- water samples, other types of insecticides and herbicides were applied to the Held. Ground- water quality effects from these compounds or their degradation products are unknown. All con centrations of organic compounds detected in ground water were well below State MCL for drinking water.
Conditions at the southeast site generally have not stabilized although the upward trend in con centrations of nitrate and chloride in shallow aquifer wells may be leveling off. Increases of nitrate over the MCL for drinking water in some wells warrants concern for the extent and mag nitude of this trend. The combined effect of
32

organic halocarbons in the sprayed effluent and application of commercial pesticides over an extended period of time could result in transport of toxic organic compounds to ground water. Monitoring programs are essential to determine long-term effects of effluent irrigation on ground water at the site.
REFERENCES
American Public Health Association, 1985, Standard methods for the examination of water and wastewater (16th ed.): Washing ton, American Public Health Association, American Water Works Association, and Water Pollution Control Federation, 1,268 p.
Bellar, T.A., Lichtenberg, J J., and Kroner, R.C., 1974, The occurrence of organohalides in chlorinated drinking waters: U.S. Environ mental Protection Agency EPA 670/4-74- 008,13 p.
Bouwer, EJ., McCarty, P.L., and Lance, J.C., 1981, Trace organic behavior in soil columns during rapid infiltration of secondary waste- water: Water Research, v. 15, p. 151-159.
Broadbent, F.E., 1973, Factors affecting nitrifica tion- devitrification in soils, in Sopper, W.E., and Kardos, L.T., eds., Recycling treated municipal wastewater and sludge through forest and cropland: University Park, Pa., The Pennsylvania State University Press, p. 232- 244.
Bush, P.W., 1982, Predevelopment flow in the Ter tiary limestone aquifer, southeastern United States: A regional analysis from digital model ing: U.S. Geological Survey Water-Resources Investigations Report 82-905,41 p.
Carlson, Christine, 1976, Land application of wastewater: A new look at an old idea: Washington, D.C., League of Women Voters, Current Focus, Publication no. 378,8 p.
Crawford, C.G., Slack, J.R., and Hirsch, R. M., 1983, Nonparametric tests for trends in water-quality data using the statistical analysis system: U.S. Geological Survey Open-File Report 83-550,102 p.
Crites, R.W., Esmay, J., Griffes, D., Olson, J., Powers, J., Shedden R., Smith, R., and Uiga, A., 1977, Process design manual for land
treatment of municipal wastewater: U.S. Environmental Protection Agency, EPA 625/1-77-008, p. 1-3.
DeMarco, Jack, 1983, History of treatment of volatile organic chemicals in water, in Occur rence and removal of volatile organic chemi cals from drinking water: Denver, Colo., American Water Works Association Research Foundation, cooperative research report, p. 37-43.
Elder J.F., Hunn, J.D., and Calhoun, C.W., 1985, Wastewater application by spray irrigation on a field southeast of Tallahassee, Florida: Effects on ground-water quality and quantity, 1980-82: U.S. Geological Survey Water- Resources Investigations Report 85-4006, 41 p.
Fishman, MJ., and Friedman, L.C., eds., 1985, Methods for the determination of inorganic substances in water and fluvial sediments: U.S. Geological Survey Techniques of Water- Resources Investigations, Book 5, Chap. Al, Open- File Report 85-495,709 p.
Florida Department of Environmental Regula tion, 1983, Land application of domestic wastewater effluent in Florida, final rule, effective date January 1984: Division of Environmental Programs, Bureau of Waste- water Management and Grants, 46 p.
1985, Public drinking water systems: Chapter 17-22 in Florida Administrative Code.
Franks, B J., 1981, Land application of domestic wastewater in Florida Statewide assess ment of impact on ground-water quality: U.S. Geological Survey Water-Resources Inves tigations Report 81-3,37 p.
Hem, J.D., 1985, Study and interpretation of the chemical characteristics of natural water: U.S. Geological Survey Water-Supply Paper 2254,263 p.
Hendry, C.W., Jr., and Sproul, C.R., 1966, Geol ogy and ground-water resources of Leon County, Florida: Florida Division of Geology Bulletin 47,178 p.
Hinesly, T.D., Thomas, R.E., and Stevens, R.G., 1978, Environmental changes from long-term
33

land applications of municipal effluents: U.S. Environmental Protection Agency Technical Report EPA 430/9-78-003, 31 p.
Hirsch, R.M., Slack, J.R., and Smith, R.A., 1982, Techniques of trend analysis for monthly water quality data: Water Resources Research, v. 18, no. 1, p. 107-121.
Johnson, C.C., 1979, Land application of waste An accident waiting to happen: Ground Water, v. 17, no. 1, p. 69-72.
Kwader, Thomas, and Schmidt, Walter, 1978, Top of the Floridan aquifer in northwest Florida: Florida Bureau of Geology Map Series 86, 1 sheet.
Loehr, R.C., Jewell, W J., Novak, J.D., Clarkson, W.W., and Friedman, G.S., 1979, Land appli cation of wastes: New York, VanNostrand, v. 1,308 p., and v. II, 431 p.
Miller, J.A., 1982a, Geology and configuration of the base of the Tertiary limestone aquifer sys tem, southeastern United States: U.S. Geological Survey Open-File Report SI- 1176, 1 sheet.
1982b, Geology and configuration of the top of the Tertiary limestone aquifer system, southeastern United States: U.S. Geological Survey Open-File Report 81-1178,1 sheet.
1986, Hydrogeologic framework of the Floridan aquifer system in Florida and parts of Georgia, Alabama, and South Carolina: U.S. Geological Survey Professional Paper 1403-B, 91 p.
Overman, A.R., 1979, Wastewater irrigation at Tallahassee, Florida: U.S. Environmental Protection Agency Report EPA 600/2-79- 151,319p.
Overman, A.R., and Smith, T.P., 1973, Effluent irrigation at Tallahassee, in Landspreading municipal effluent and sludge in Florida, 1973 Workshop, Winter Park, Fla., May 2-3,1973, Proceedings: Gainesville, University of Florida, Institute of Food and Agricultural Services, p. 39-59.
Parsons, Frances, Wood, P.R., and DeMarco, Jack, 1984, Transformations of tetrachloroethene and trichloroethene in microcosms and groundwater: Journal of the
American Water Works Association, v. 76, no. 2, p. 56-59.
Pound, C.E., and Crites, R. W., 1973, Wastewater treatment and reuse by land application, Vol ume I Summary: U.S. Environmental Pro tection Agency EPA 660/2-73-006a, 80 p.
Pruitt, J.B., Troutman, D.E., and Irwin, G.A., 1985, Reconnaissance of selected organic contaminants in effluent and ground water at fifteen municipal wastewater treatment plants in Florida: U.S. Geological Survey Water-Resources Investigations Report 85- 4167,29 p.
Rosenau, J.C., Faulkner, G.L., Hendry, C.W., Jr., and Hull, R.W., 1977, Springs of Florida: Florida Bureau of Geology Bulletin 31, revised, 461 p.
Rosenau, J.C., and Meadows, P.E., 1987, Poten- tiometric surface of the Floridan aquifer system in the Northwest Florida Water Management District, May 1985: U.S. Geological Survey Water-Resources Inves tigations Report 86-4183,1 sheet.
Sanders, T.E., 1981, Soil survey of Leon County, Florida: Washington, D.C., U.S. Department of Agriculture Soil Conservation Service and Forest Service, 151 p.
Schmidt, Walter, 1979, Environmental geology series, Tallahassee sheet: Florida Bureau of Geology Map Series 90,1 sheet.
Sheaffer, J.R., 1979, Land application of waste Important alternative: Ground Water, v. 17, no. 1, p. 62-68.
Singley, J.E., and Moser, R.H., 1983, Evaluation of alternatives, in Occurrence and removal of volatile organic chemicals from drinking water: Denver, Colo., American Water Works Association Research Foundation, cooperative research report, p. 205-241.
Slack, L.J., 1975, Hydrologic environmental effects of sprayed sewage effluent, Tallahas see, Florida: U.S. Geological Survey Water- Resources Investigations Report 55-75,73 p.
Sopper, W.E., and Kardos, L.T., 1973, Vegetation responses to irrigation with treated municipal wastewater, in Sopper, W.E., and Kardos, L.T., eds., Recycling treated municipal waste-
34

water and sludge through forest and cropland: University Park, Pa., The Pennsyl vania State University Press, p. 271-294.
Stewart, J.W., 1980, Areas of natural recharge to the Floridan aquifer in Florida: Florida Bureau of Geology Map Series 98,1 sheet.
Tomson, J.D., Hutchins, Steve, Curran, Carol, Cook, CJ., and Ward, C.H., 1981, Ground- water contamination by trace level organics from a rapid infiltration site: Water Research, v. 15, p. 1109-1116.
U.S. Environmental Protection Agency, 1979, Methods for chemical analysis of water and wastes: Cincinnati, Ohio, Office of Research and Development, Environmental Monitor ing and Support Laboratory, EPA 600/4-79- 020,430 p.
1986, Workshops on assessment and man agement of drinking water contamination: Washington, D.C., Office of Drinking Water, EPA 600/M^86-026, p. lll-C-32-56.
Wershaw, R.L., Fishman, M J., Grabbe, R.R., and Lowe, L.E., eds., 1983, Methods for the deter mination of organic substances in water and fluvial sediments: U.S. Geological Survey
Techniques of Water-Resources Investiga tions, Book 5, Chap. A3, Open-File Report 82-1004,173 p.
Wood, P.R., 1983, Introductory study of the biodegradation of the chlorinated methane, ethane, and ethene compounds, in Occur rence and removal of volatile organic chemi cals from drinking water: Denver, Colo., American Water Works Association Research Foundation, cooperative research report, p. 17.
Wright, K.R., and Rovey, C.K., 1979, Land ap plication of waste State of the art: Ground Water, v. 17, no. 1, p. 47-61.
Yurewicz, M.C., 1983, Hydrologic data from an area southwest of Tallahassee, Florida, where municipal wastewater effluent is applied by spray irrigation: U.S. Geological Survey Open-File Report 83-769,153 p.
Yurewicz, M.C., and Rosenau, J.C., 1986, Effects on ground water of spray irrigation using treated municipal sewage southwest of Talla hassee, Florida: U.S. Geological Survey Water-Resources Investigations Report 86- 4109,52 p.
rtU.S. GOVERNMENT PRINTING OFFICE:! 9 8 9 .6 31 -1 6 9, 8 o 0 o 9
35