geohydrology, geochemistry, and groundwater simulation … · 2013-09-19 · u.s. department of the...
TRANSCRIPT

U.S. Department of the InteriorU.S. Geological Survey
Scientific Investigations Report 2013–5101
Prepared in cooperation with the Fort Irwin National Training Center
Geohydrology, Geochemistry, and Groundwater Simulation (1992–2011) and Analysis of Potential Water-Supply Management Options, 2010–60, of the Langford Basin, California
LangfordBasin
LangfordWell Lake
(dry)

Cover photograph. Aerial view of the Langford groundwater basin. Photograph from Fort Irwin National Training Center, 2007.

Geohydrology, Geochemistry, and Groundwater Simulation (1992–2011) and Analysis of Potential Water-Supply Management Options, 2010–60, of the Langford Basin, California
By Lois M. Voronin, Jill N. Densmore, Peter Martin, Charles F. Brush, Carl S. Carlson, and David M. Miller
Prepared in cooperation with the Fort Irwin National Training Center
Scientific Investigations Report 2013–5101
U.S. Department of the InteriorU.S. Geological Survey

U.S. Department of the InteriorSALLY JEWELL, Secretary
U.S. Geological SurveySuzette M. Kimball, Acting Director
U.S. Geological Survey, Reston, Virginia: 2013
For more information on the USGS—the Federal source for science about the Earth, its natural and living resources, natural hazards, and the environment, visit http://www.usgs.gov or call 1–888–ASK–USGS.
For an overview of USGS information products, including maps, imagery, and publications, visit http://www.usgs.gov/pubprod.
To order this and other USGS information products, visit http://store.usgs.gov.
Any use of trade, firm, or product names is for descriptive purposes only and does not imply endorsement by the U.S. Government.
Although this information product, for the most part, is in the public domain, it also may contain copyrighted materials as noted in the text. Permission to reproduce copyrighted items must be secured from the copyright owner.
Suggested citation:Voronin, L.M., Densmore, J.N., Martin, Peter, Brush, C.F., Carlson, C.S., and Miller, D.M., 2013, Geohydrology, geochemistry, and groundwater simulation (1992–2011) and analysis of potential water-supply management options, 2010–60, of the Langford Basin, California: U.S. Geological Survey Scientific Investigations Report 2013-5101, 86 p.
iii
ContentsAbstract ......................................................................................................................................................... 1Introduction ................................................................................................................................................... 2
Purpose and Scope ............................................................................................................................. 2Location and Description of Study Area ......................................................................................... 2Previous Studies .................................................................................................................................. 5Acknowledgments .............................................................................................................................. 5
Geohydrologic Framework ......................................................................................................................... 5Geology ................................................................................................................................................. 5
Geologic Units ............................................................................................................................. 6Depth to the Basement Complex ............................................................................................. 6Faults ........................................................................................................................................ 11
Groundwater Hydrology ................................................................................................................... 11Aquifer System Definition ....................................................................................................... 11Recharge and Discharge ........................................................................................................ 12Groundwater Withdrawals and Water Use ......................................................................... 13Groundwater Levels and Flow ................................................................................................ 13
Groundwater Quality .................................................................................................................................. 14Sampling and Laboratory Methods ............................................................................................... 17General Water-Quality Characteristics ......................................................................................... 17Chemical Character of Groundwater ............................................................................................. 17Specific Constituents of Interest .................................................................................................... 21Trace Elements .................................................................................................................................. 22Source and Age of Groundwater .................................................................................................... 23
Stable Isotopes of Oxygen and Hydrogen ............................................................................ 23Tritium and Carbon-14 .............................................................................................................. 23
Simulation of Groundwater Flow ............................................................................................................. 26Model Discretization ......................................................................................................................... 26Model Boundaries ............................................................................................................................. 27Model Input ........................................................................................................................................ 32
Hydraulic Conductivity ............................................................................................................ 32Vertical Leakance ..................................................................................................................... 36Specific Yield and Specific Storage ...................................................................................... 36Horizontal-Flow Barriers ......................................................................................................... 36Simulation of Recharge and Discharge ................................................................................ 36Groundwater Withdrawals ..................................................................................................... 38
Model Calibration .............................................................................................................................. 38Model Results .................................................................................................................................... 48Model Sensitivity ............................................................................................................................... 48Limitations of the Model ................................................................................................................... 49Simulated Effects of Future Groundwater Withdrawals ............................................................. 51
Description of Model Scenarios ............................................................................................ 51Scenario 1 ..........................................................................................................................51Scenario 2 ..........................................................................................................................51

iv
Scenario 3 ......................................................................................................................... 56Scenario 4 ......................................................................................................................... 56
Results of Model Scenarios .................................................................................................... 56Scenario 1 ......................................................................................................................... 56Scenario 2 ......................................................................................................................... 56Scenario 3 ......................................................................................................................... 56Scenario 4 ......................................................................................................................... 59
Summary and Conclusions ........................................................................................................................ 62References Cited ........................................................................................................................................ 64Appendix 1.................................................................................................................................................... 68
Lithologic Logs ................................................................................................................................... 68Borehole Geophysics ........................................................................................................................ 68
Appendix 2 ................................................................................................................................................... 73
Figures 1. Map showing location of study area, Fort Irwin National Training Center, California ......... 3 2. Map showing generalized surficial geology, major faults, location of groundwater
monitoring sites and production wells, and geologic section lines in Langford Basin, Fort Irwin National Training Center, California ........................................................... 4
3. Generalized geologic sections A, A-A’; B, B-B’; and C, C-C’ across Langford Basin, Fort Irwin National Training Center, California ....................................................................... 7
4. Map showing altitude of the basement complex in Langford Basin, Fort Irwin National Training Center, California, based on gravity measurements ........................... 10
5. Graph showing A, Groundwater withdrawal, and B, water-level fluctuations in selected wells in Langford Basin, Fort Irwin National Training Center, California ......... 14
6. Graph showing monthly distribution of groundwater withdrawals, January 1993– December 2010, Langford Basin, Fort Irwin National Training Center, California ......... 14
7. Maps showing groundwater-level contours for A, predevelopment (1980–88); B, 1995; C, 2000; D, 2005; and E, 2010 in Langford Basin, Fort Irwin National Training Center, California ....................................................................................................... 15
8. Map showing location of stiff diagrams, and concentrations of dissolved solids, sulfate, nitrate, and fluoride in groundwater from selected wells in Langford Basin, Fort Irwin National Training Center, California ........................................................ 18
9. Trilinear diagrams of groundwater from selected wells in A, the northern part; B, the central part; and C, the southern part of Langford Basin, Fort Irwin National Training Center, California ........................................................................................19
10. Plot showing relation between concentrations of chloride and sulfate in ground- water samples from wells in Langford Basin, Fort Irwin National Training Center, California .....................................................................................................................................21
11. Plot showing stable-isotope concentrations in groundwater from selected wells in Langford Basin, Fort Irwin National Training Center, California ....................................... 24
12. Map showing tritium and carbon-14 activities in groundwater from selected wells in Langford Basin, Fort Irwin National Training Center, California ....................................... 25
13. Map showing local model grid of the Langford Basin and the regional mode grid of the Fort Irwin National Training Center, California .............................................................. 27

v
14. Map showing finite-difference grid and boundary locations, Langford Basin, Fort Irwin National Training Center, California ..................................................................... 28
15. Cross-sectional view A, A–A’; B, B–B’; and C, C–C’ of model layers and horizontal hydraulic conductivities in the Langford Basin, Fort Irwin National Training Center, California ...................................................................................................................... 29
16. Map showing areal distribution of hydraulic parameter zones, horizontal hydraulic conductivity, specific yield (layer 1), specific storage, vertical anisotropy, and horizontal-flow barriers used in the model for A, model layer 1; B, model layer 2; and C, model layer 3 for the calibrated transient groundwater-flow model, Langford Basin, Fort Irwin National Training Center, California ....................................... 33
17. Map showing recharge distribution zones and recharge rates for the calibrated transient groundwater-flow model, Langford Basin, Fort Irwin National Training Center, California ...................................................................................................................... 37
18. Map showing simulated water-table surface and measured water levels for the upper aquifer, Langford Basin, Fort Irwin National Training Center, California. A, Predevelopment; B, February 1995; C, March 2005; D, October 2010; and E, Simulated drawdown from April 1992 to October 2010 .................................................. 40
19. Hydrographs of simulated and measured water levels in 12 wells from predevelop- ment (1980–88) to January 2011, Langford Basin, Fort Irwin National Training Center, California ...................................................................................................................... 47
20. Graph showing measured and simulated equivalent water levels, with 1:1 correl- ation line, for transient conditions, Langford Basin, Fort Irwin National Training Center, California ...................................................................................................................... 48
21. Graph showing composite scaled sensitivity values, Langford Basin, Fort Irwin National Training Center, California. ....................................................................................... 49
22. Graph showing average 2001 to 2010 monthly groundwater withdrawal distribution for wells in Bicycle, Irwin, and Langford Basins providing water to Fort Irwin National Training Center, California ....................................................................................... 51
23. Map showing simulated drawdown from October 2010 conditions to October 2060 conditions for A, scenario 1; B, scenario 2; C, scenario 3; and D, scenario 4, Langford Basin, Fort Irwin National Training Center, California ....................................... 52
24. Graphs showing simulated hydrographs from scenario 1, Langford Basin, Fort Irwin National Training Center, California ....................................................................................... 57
25. Graphs showing simulated hydrographs from scenario 2, Langford Basin, Fort Irwin National Training Center, California ....................................................................................... 58
26. Graphs showing simulated hydrographs from scenario 3, Langford Basin, Fort Irwin National Training Center, California ....................................................................................... 60
27. Graphs showing simulated hydrographs from scenario 4, Langford Basin, Fort Irwin National Training Center, California ....................................................................................... 61
Appendix figures A1-1. Geophysical logs, well-construction diagram, and stratigraphic column for the
borehole of monitoring site drilled in Langford Basin at Fort Irwin National Training Center, California: LL1 (13N/3E-26K2-4) .................................................................. 69
A1-2. Geophysical logs, well-construction diagram, and stratigraphic column for borehole of monitoring site drilled in Langford Basin at Fort Irwin National Training Center, California: LL2 (13N/3E-35J1-3) ............................................................................................... 70
A1-3. Geophysical logs, well-construction diagram, and stratigraphic column for borehole of monitoring site drilled in Langford Basin at Fort Irwin National Training Center, California: LL3 (13N/3E-24N1) .................................................................................................. 71
vi
A1-4. Geophysical logs, well-construction diagram, and stratigraphic column for borehole of monitoring site drilled in Langford Basin at Fort Irwin National Training Center, California: LW1 (13N/3E-14K1) ................................................................................................ 71
A1-5. Geophysical logs, well-construction diagram, and stratigraphic column for borehole of monitoring site drilled in Langford Basin at Fort Irwin National Training Center, California: LL04B (12N/3E-1M4 and 5) and LL04 (12N/3E-1M1-3) ...................................... 72
Tables 1. Well-construction data for selected wells in Langford Basin, Fort Irwin National
Training Center, California ......................................................................................................... 5 2. Results of aquifer tests conducted in Langford Basin, Fort Irwin National Training
Center, California ...................................................................................................................... 12 3. Summary of annual groundwater withdrawals, in acre-feet per year, from three
wells in Langford Basin, Fort Irwin National Training Center, California, April 1992–December 2010 .......................................................................................................................... 13
4. Calibrated parameter values for the calibrated groundwater-flow model, Langford Basin, Fort Irwin National Training Center, California ......................................................... 32
5. Simulated predevelopment and annual water budget, 1992–2010, Langford Basin, Fort Irwin National Training Center, California ..................................................................... 38
6. Simulated and 1993–2011 measured water levels and root mean square error for 12 wells, Langford Basin, Fort Irwin National Training Center, California ....................... 45
7. Calibrated parameter values used in the calibrated model, Langford Basin, Fort Irwin National Training Center, California ........................................................................................ 50
8. Summary of four model scenarios in the Langford Basin, Fort Irwin National Training Center, California ....................................................................................................................... 59
Appendix 2. Water-quality data for selected wells and a spring in Langford Basin, Fort Irwin National Training Center, California, 1955–2011 ................................................................... 74

vii
Conversion Factors, Datums, and Water-Quality Units
Inch/Pound to SI
Multiply By To obtainLength
inch (in.) 2.54 centimeter (cm)foot (ft) 0.3048 meter (m)mile (mi) 1.609 kilometer (km)
Areasquare mile (mi2) 2.590 square kilometer (km2)
Volumegallon (gal) 3,785 milliliter (mL) acre-foot (acre-ft) 0.001233 cubic hectometer (hm3)
Flow ratefoot per day (ft/d) 0.3048 meter per day (m/d)acre-foot per year (acre-ft/yr) 0.001233 cubic hectometer per year (hm3/yr)
Specific capacitygallon per minute per foot
[(gal/min)/ft)] 0.2070 liter per second per meter [(L/s)/m]
Transmissivity*foot squared per day (ft2/d) 0.09290 meter squared per day (m2/d)
Temperature in degrees Celsius (°C) may be converted to degrees Fahrenheit (°F) as follows:
°F=(1.8×°C)+32
Temperature in degrees Fahrenheit (°F) may be converted to degrees Celsius (°C) as follows:
°C=(°F-32)/1.8
Vertical coordinate information is referenced to the North American Vertical Datum of 1988 (NAVD 88).
Altitude, as used in this report, refers to distance above the vertical datum.
Specific conductance is given in microsiemens per centimeter at 25 degrees Celsius (μS/cm at 25°C).
Concentrations of chemical constituents in water are given either in milligrams per liter (mg/L) or micrograms per liter (μg/L).
Concentrations of radioactive isotopes are given in either picocuries per liter (pCi/L) or tritium units (TU).
Concentrations of stable isotopes are given in units of per mil (per thousand).

viii
D C B A
E F G H
JKLM
N P RQ
6 5 4 3 2
7 8 9 10 11
18 17 16 15 13
19 20 21 22 23 24
30 29 28 26 25
31 32 33 34 36
27
R4E R5E
T12N
T13N
T14N
R3ERANGE
TOW
NSH
IP
R2ER1E
T11N
T10N
R3E
Well-numbering diagram (Note: maps in this report use abbreviated well numbers such as "35J1".)
SECTION 35
T13N
13N/3E-35J1-3
1
San Bernardino Meridian
12
14
35

ix
AbbreviationsAs arsenic14C carbon-14, stable isotope of carbonF fluoride2H deuterium, stable isotope of hydrogen3H tritium, radioactive isotope of hydrogenHCO3 bicarbonateNa sodiumNO3 nitrateNTC National Training Center18O oxygen-18, stable isotope of oxygen Per mil parts per thousand (‰)PVC polyvinyl chlorideRMSE root mean squared errorSO4 sulfateSP spontaneous potentialTDS total dissolved solidsUSEPA U.S. Environmental Protection AgencyUSGS U.S. Geological SurveyVSMOW Vienna Standard Mean Ocean WaterBc basement complexQoa Quaternary older alluviumQp Quaternary playa depositsQya Quaternary younger alluvial depositsQye Quaternary younger eolian depositsTog Tertiary older sedimentary depositsTyg Tertiary younger sedimentary deposits

x

Geohydrology, Geochemistry, and Groundwater Simulation (1992–2011) and Analysis of Potential Water-Supply Management Options, 2010–60, of the Langford Basin, California
By Lois M. Voronin, Jill N. Densmore, Peter Martin, Charles F. Brush, Carl S. Carlson, and David M. Miller
year of natural recharge derived from precipitation runoff and as much as 40 acre-feet per year of underflow from the Irwin Basin. Between April 1992 and December 2010, an average of about 650 acre-feet per year of water was withdrawn from the Langford Basin. Groundwater withdrawals in excess of natural recharge resulted in a net loss of 11,670 acre-feet of ground-water storage within the basin for the simulation period.
The Fort Irwin NTC is considering various groundwater-management options to address the limited water resources in the Langford Basin. The calibrated Langford Basin ground-water-flow model was used to evaluate the hydrologic effects of four groundwater-withdrawal scenarios being considered by the Fort Irwin NTC over the next 50 years (January 2011 through December 2060). Continuation of the 2010 with-drawal rate in the three existing production wells will result in 70 feet of additional drawdown in the central part of the basin. Redistributing the 2010 withdrawal rate equally to the three existing wells and two proposed new wells in the northern and southern parts of the basin would result in about 10 feet less drawdown in the central part of the basin but about 100 feet of additional drawdown in the new well in the northern part of the basin and about 50 feet of additional drawdown in the new well in the southern part of the basin. Reducing the withdrawals from the three existing production wells in the central part of the basin from about 45,000 acre-feet to about 32,720 acre-feet would result in about 40 feet of additional drawdown in the central basin near the pumping wells, about 25 feet less than if withdrawals were not reduced. The combi-nation of reducing and redistributing the cumulative withdraw-als to the three existing and two proposed new wells results in about 40 feet of additional drawdown in the central and south-ern parts of the basin and about 70 feet in the northern part of the basin. These results show that reducing and redistributing the groundwater withdrawals would maintain the upper aqui-fer at greater than 50 percent of its predevelopment saturated thickness throughout the groundwater basin. The scenarios simulated for this study demonstrate how the calibrated model can be utilized to evaluate the hydrologic effects of different water-management strategies.
Abstract Groundwater withdrawals began in 1992 from the Langford
Basin within the Fort Irwin National Training Center (NTC), California. From April 1992 to December 2010, approximately 12,300 acre-feet of water (averaging about 650 acre-feet per year) has been withdrawn from the basin and transported to the adjacent Irwin Basin. Since withdrawals began, water levels in the basin have declined by as much as 40 feet, and the quality of the groundwater withdrawn from the basin has deteriorated.
The U.S. Geological Survey collected geohydrologic data from Langford Basin during 1992–2011 to determine the quantity and quality of groundwater available in the basin. Geophysical surveys, including gravity, seismic refraction, and time-domain electromagnetic induction surveys, were con-ducted to determine the depth and shape of the basin, to delin-eate depths to the Quaternary-Tertiary interface, and to map the depth to the water table and changes in water quality. Data were collected from existing wells and test holes, as well as 11 monitor wells that were installed at 5 sites as part of this study. Water-quality samples collected from wells in the basin were used to determine the groundwater chemistry within the basin and to delineate potential sources of poor-quality groundwa-ter. Analysis of stable isotopes of oxygen and hydrogen in groundwater indicates that present-day precipitation is not a major source of recharge to the basin. Tritium and carbon-14 data indicate that most of the basin was recharged prior to 1952, and the groundwater in the basin has an apparent age of 12,500 to 30,000 years. Recharge to the basin, estimated to be less than 50 acre-feet per year, has not been sufficient to replenish the water that is being withdrawn from the basin.
A numerical groundwater-flow model was developed for the Langford Basin to better understand the aquifer system used by the Fort Irwin NTC as part of its water supply, and to provide a tool to help manage groundwater resources at the NTC. Measured groundwater-level declines since the initia-tion of withdrawals (1992–2011) were used to calibrate the groundwater-flow model. The simulated recharge was about 46 acre-feet per year, including approximately 6 acre-feet per

2 Geohydrology, Geochemistry, Groundwater Simulation and Analysis of Potential Water-Supply Management Options
IntroductionFort Irwin National Training Center (NTC) in the Mojave
Desert of California has been used as a military training facil-ity almost continuously since August 1940. Fort Irwin NTC presently (2011) obtains its potable water supply by withdraw-ing groundwater from the Irwin, Bicycle, and Langford Basins (fig. 1). Groundwater withdrawals in excess of recharge have resulted in declining groundwater levels in all three basins. In addition, water-quality concerns have caused several produc-tion wells in the Irwin Basin to be abandoned or destroyed. To effectively manage the water resources and plan for future water needs at the Fort Irwin NTC, it is important to have a complete understanding of the geohydrologic and geochemical framework of the Irwin, Langford, and Bicycle Basins.
Purpose and Scope
This report describes the geohydrologic and geochemical framework of Langford Basin and describes how the resulting information was utilized to develop and calibrate a groundwa-ter-flow model for Langford Basin that was used to evaluate the long-term availability of groundwater in the basin. In 1992, the U.S. Geological Survey (USGS) entered into an agreement with the Fort Irwin NTC to monitor and evaluate the groundwater resources of the Fort Irwin NTC. The reader is referred to Densmore (2003) and Densmore and Londquist (1997) for more information. The work presented in this report was completed under a continuation of this agreement. The objectives of the Fort Irwin NTC groundwater study were to 1) describe the geohydrologic and geochemical framework of the groundwater basins that supply water to the Fort Irwin NTC, 2) develop groundwater-flow models that will help refine the understanding of the geohydrology of these basins, and 3) use this information to evaluate the long-term avail-ability of groundwater for the Fort Irwin NTC. Available geohydrologic and geochemical data were compiled for the Langford Basin, and new data were collected from existing wells. Additional investigative work for this study included conducting geophysical surveys (gravity and time-domain electromagnetic induction) to refine the understanding of the size and shape of the basin (Smith, 1997; Morin, 2000; and Burgess and Bedrosain, USGS, written commun., 2011). An earlier seismic refraction survey (David Berger, U.S. Geologi-cal Survey, written commun., 1996) also was used to refine the size and shape of the basin. Monitor wells were installed to provide depth-dependent geohydrologic and geochemical data.
Water-quality samples were collected to evaluate possible sources of groundwater-quality degradation. Samples were also analyzed for the stable isotopes of oxygen-18 (18O) and deuterium (2H) to determine the source of groundwater and for the radioactive isotopes of tritium (3H) and carbon-14 (14C) to evaluate the relative age of groundwater (years since the water entered the groundwater system) in the basin.
A conceptual model of the geohydrologic system was developed by using data compiled and collected for the study of the Langford Basin, including lithologic and geophysical data from available boreholes (data shown in appendix 1). The conceptual model and groundwater-level data were used to develop and calibrate a groundwater-flow model of the Langford Basin. This calibrated groundwater-flow model will provide a better understanding of the geohydrology of the basin and is a useful tool to help estimate the long-term avail-ability of groundwater from the basin by evaluating changes in groundwater-level altitudes (or water levels) under different withdrawal scenarios. The calibrated model also was used to evaluate the effects of continued withdrawals at the historical average rate of pumping, the addition of proposed wells, and a reduction in groundwater withdrawals on the groundwater-level altitude in the Langford Basin.
Location and Description of Study Area
The Langford Basin is in the southern part of the Fort Irwin NTC, about 35 miles (mi) northeast of Barstow, California (fig. 1). The Langford Groundwater Basin, herein referred to as the Langford Basin in this report, lies within the Langford Drainage Basin, which captures surface runoff. Fort Irwin NTC covers an area of about 970 square miles (mi2) in the Mojave Desert of southern California. Langford Basin is bounded to the northeast by rugged hills at the base of Tiefort Mountain, to the northwest by rugged hills that separate Langford Basin from Irwin Basin, to the southwest by Noble Dome, to the south by Alvord Mountain, and to the east by rugged hills that separate Langford Basin from West Cronise Valley (fig. 1). Faults probably control the physiography and the shape of Langford Basin (Yount and others, 1994; Morin, 2000; Miller and Yount, 2002). Based on nearby mapped faults (fig. 2), four faults likely exist in the subsurface in the Langford Basin. Langford Well Lake (dry), a playa, lies in the northeastern part of Langford Basin (fig. 2). The basin floor ranges in altitude from 2,160 feet (ft) above NAVD 88 at the playa to 2,800 ft above NAVD 88 at the base of Alvord Mountain.
Langford Basin, typical of desert basins in the Mojave Desert, has a relatively flat floor surrounded by generally rugged hills and mountains. The basin has a surface drainage area of about 50 mi2, and the floor of the basin covers about 11 mi2. The basin contains no perennial streams, but several washes flow for days after large storms. Langford Basin is drained internally to the Langford Well Lake (dry) playa (fig. 2). Extensive vegetation is present on the western side of Langford Well Lake (dry) playa, indicating that water some-times collects on the playa in this area. Ponded water has been observed on playas at Fort Irwin NTC after large storms and can exist for weeks until the water has evaporated.
The climate of Langford Basin is typical of the Mojave Desert and is characterized by low precipitation with hot sum-mers and cool winters. No weather records are available for Langford Basin, but weather records for nearby Goldstone,

Introduction 3
California, about 11 mi northwest of the basin, indicate aver-age annual precipitation is about 7 inches (in.), and ranged from 2 to 12 in. between 1950 and 2007 (National Oceanic and Atmospheric Administration, 1994, 2008). Most precipi-tation falls during the winter months of November through March; some additional precipitation is derived from isolated thunderstorms during the months of April through Octo-ber. The average annual temperature at Barstow, California,
between 1940 and 2011 was 64°F and ranged from 3 to 121°F (EarthInfo, Inc., 1995, 2000; California Irrigation Manage-ment Information System, 2011). The average annual potential evaporation in Death Valley (not shown on map), about 85 mi north of the basin, is about 148 in. and about 76 in. at New-berry Springs, California (not shown on map), about 20 mi to the south (David Inouye, California Department of Water Resources, written commun., 1996).
Figure 1. Location of study area, Fort Irwin National Training Center, California.
395
58
15
15
40
Marine CorpsLogistics Base
EdwardsAir Force
Base
EdwardsAir Force
Base
China Lake Naval Weapons
Center
China Lake Naval Weapons
Center
Fort Irwin National Training
Center
Cuddeback LakeAir Force Range
Goldstone
BICYCLEBASIN
BICYCLEBASIN
LANGFORDBASIN
LANGFORDBASIN
IRWINBASINIRWINBASIN
M o j a v e D e s e r t
StudyArea
(see figure 2)
GarlicSpring
West Cronise Valley
Coyote LakeBasin
NobleDome
Base from U.S. Geological Survey digital elevation data, 1:250,000, 1987, and digital data, 1:100,000, 1981-89; Universal Transverse Mercator Projection, Zone 11. Shaded relief base from 1:250,000-scaleDigital Elevation Model; simulated sun illumination from northwest at 30 degrees above horizon
0 20 MILES
0 20 KILOMETERS
EXPLANATION
Drainage basinGroundwater basin (approximate)
NASA site
Boundary—
GARLOCK
FAULT ZONE
Barstow
Daggett
IRWIN
R
D AlvordMountain
TiefortMountain
Mojave Desert
LosAngeles
SanFrancisco
CA
LIFOR
NIA
Map Area

4 Geohydrology, Geochemistry, Groundwater Simulation and Analysis of Potential Water-Supply Management Options
Figure 2. Generalized surficial geology, major faults, location of groundwater monitoring sites and production wells, and geologic section lines in Langford Basin, Fort Irwin National Training Center, California.
UNNAMED NORTH FAULT
PLAYA FAULT
NOBLE DOME FAULT
COYOTE LAKE FAULT
?
COYOTE LAKE FAULT
NORTH NOBLE
DOME FAULT
GARLIC SPRING FAULT
?
??
?
?
?
?
?
SOUTH NOBLE DOME FAULT
L3
L3
L2
L1
23F1
23P1
26N1
26N2
26K126K2-4
14K1
34Q1 35J1-3
1M1-31M4,5
35B1
35A1
24N1
Tyg & Tog—Tertiary sedimentary deposits
Line of geologic section (See figure 3A-C)
Time-domain electro- magnetic site
Approximate groundwater basin boundary
Destroyed
U.S. Geological Survey single-well site
Unused production
ProductionTest
Qoa
Qp Qye QyaUpper aquifer
Quaternary –
Tertiary –
pre-Tertiary –
Quaternary/Tertiary –
Geology
EXPLANATION
Fault—Dashed where approximately located; queried where uncertain; dotted where concealed
Older Alluvium
Younger Alluvium
Basementcomplex
?
24N1
34Q1
26N1
26N2
23P1
U.S. Geological Survey multiple-well site
26K2–4
Middle and lower aquifer
Geology by D.M. Miller,unpublished data, 1994
1 2 KILOMETERS
1 2 MILES
0
0 R3E R4E
T13N
T12N
LangfordWell Lake
(dry)
Nob
leDo
me
D
U
D
UD
A'A
B'
A
B
C'
A'
GranitoidMarble and quartziteSchist
C
Seismic lines
GarlicSpring
Well and number—Well identified by section number only; township and range are shown on this figure
UD

Geohydrologic Framework 5
Previous StudiesPrevious studies of the Langford Basin have been con-
ducted by the USGS and by several consulting and engineer-ing companies. Kunkel and Riley (1959) reported on a hydro-geological reconnaissance of the basin. Studies of groundwater availability were published by C.F. Hostrup and Associates (1955), James M. Montgomery and Associates (1981), and Wilson F. So and Associates (1989). Yount and others (1994) and Schermer and others (1996) published reports on the geol-ogy of the area. In conjunction with the present study, Smith (1997) and Morin (2000) conducted gravity surveys of the altitude of the top of the buried basement complex.
AcknowledgmentsThe authors thank the following personnel at Fort Irwin
NTC: Justine Dishart, Suzanne Beacham, John Sponsler, Muhammed Bari, and Chris Woodruff for providing ground-water withdrawal data; Walt Young, Bill Anderson, and Miles Hubbard for providing access to the production wells to collect samples and measure water levels; Jennifer Swindel for assistance in coordinating field work; and the personnel at Range Control for providing informative and invaluable safety briefings.
Geohydrologic FrameworkThe geohydrologic framework of the Langford Basin was
derived by evaluating information in previously published reports, conducting geophysical surveys, and collecting geologic and hydrologic data from existing and newly drilled wells. The local well name, State well number, and well-construction data for all wells used in this report are listed in table 1. These data are stored in the USGS National Water Information System (NWIS) database and can be accessed at http://waterdata.usgs.gov/ca/nwis/nwis.
Geology
The geology of Langford Basin was previously described by C.F. Hostrup and Associates (1955), Kunkel and Riley (1959), Byers (1960), James M. Montgomery and Associates (1981), Wilson F. So and Associates (1989), Yount and others (1994), and Schermer and others (1996). The geologic discus-sion presented in this report summarizes information from these reports and updates the geology on the basis of work completed as part of the study of the Langford Basin at the Fort Irwin NTC.
Table 1. Well-construction data for selected wells in Langford Basin, Fort Irwin National Training Center, California. [Abbreviations: NTC, National Training Center; NAVD 88, North American Vertical Datum of 1988]
State wellnumber
Local wellname
Current NTCname1
Depthof well(feet)
Top ofopen
interval(feet)
Bottom ofopen
interval(feet)
Altitude of land surface
(NAVD 88)(feet)
Date ofconstruction
12N/3E-1M1 LL04-1 970 950 970 2,410.00 1/18/201112N/3E-1M2 2LL04-2 490 470 490 2,410.00 1/18/201112N/3E-1M3 2LL04-3 350 330 350 2,410.00 1/18/201112N/3E-1M4 LL04B-1 490 470 490 2,410.00 2/25/201112N/3E-1M5 LL04B-2 350 330 350 2,410.00 2/25/201113N/3E-14K1 LW1-100 105 80 100 2,211.20 5/8/199513N/3E-23F1 LX-1 585 95 575 2,170.03 10/12/198013N/3E-23P1 3LP-3 L-1 562 52 552 2,173.52 12/9/198013N/3E-24N1 LL3 172 152 172 2,161.73 2/10/200213N/3E-26K1 4LP-2 L-2 660 160 440 2,180.86 3/24/198913N/3E-26K2 LL1-780 780 760 780 2,172.46 5/7/199513N/3E-26K3 LL1-420 420 400 420 2,172.46 5/7/199513N/3E-26K4 LL1-210 210 190 210 2,172.46 5/7/199513N/3E-26N1 L-3 370 6340 6360 2,261.67 2/20/1988
145 30013N/3E-26N2 2TH-8 370 6340 6360 2,263.15 12/28/1987
145 30013N/3E-34Q1 TH-10 295 240 285 2,357.26 12/30/198713N/3E-35A1 5LP-1 L-3 703 160 580 2,200.27 3/16/198913N/3E-35B1 L-1 500 100 482 2,198.37 12/195413N/3E-35J1 LL2-699 699 659 699 2,250.75 2/9/200213N/3E-35J2 LL2-415 415 395 415 2,250.75 2/9/200213N/3E-35J3 LL2-190 190 170 190 2,250.75 2/9/2002
1Current name is the name used by NTC personnel at Fort Irwin for pumpage and other related records.2Well destroyed.3Well LP-3 is also known as LT-1 in James M. Montgomery and Associates (1981); LT-1 or L-2 in Wilson F. So and Associates (1989); and L-1 in pumpage data received from Dyne
Corpotation, Johnson Controls, and CH2M Hill.4Well LP-2 is also known as L-2 in pumpage data received from Dyne Corporation, Johnson Controls, and CH2M Hill.5Well LP-1 is also known as L-1 in Wilson F. So and Associates (1989) and L-3 in pumpage data received from Dyne Corporation, Johnson Controls, and CH2M Hill.6Interval of second screen.

6 Geohydrology, Geochemistry, Groundwater Simulation and Analysis of Potential Water-Supply Management Options
Geologic UnitsFor this study, the geologic units of Miller and others
(2013) are grouped into four generalized stratigraphic units: (1) basement complex of pre-Tertiary felsic and mafic granitic rocks and metamorphic rocks consisting of marble, quartzite, and schist; (2) Tertiary sedimentary deposits; (3) Quaternary-Tertiary older alluvium; and (4) Quaternary younger alluvium (figs. 2 and 3). The Tertiary sedimentary deposits, Quaternary-Tertiary older alluvium; and Quaternary younger alluvium form the water-bearing deposits in the Langford Basin. These deposits are unconsolidated at land surface and become semi-consolidated to consolidated with depth. The reported thick-nesses of these units were based on an analysis of driller’s logs compiled or drilled as part of this study.
The basement complex underlies the Langford Basin and crops out in some of the surrounding hills, predominantly to the west, north, and northeast (figs. 2 and 3). In general, the basement complex has very low permeability, and water is present only where these rocks are extensively jointed, fractured, or weathered. Although this “weathered” zone may contain moderate quantities of extractable water, storage is minimal, and the basement complex is considered a non-water-bearing zone.
Tertiary sedimentary deposits (figs. 2 and 3; Tyg and Tog) overlie the basement complex and form low-lying hills south and southeast of the basin. These deposits consist of crudely bedded sands and gravels that are primarily derived from granitic rocks. The Tertiary sedimentary deposits are subdi-vided into Tertiary younger sedimentary deposits (Tyg) and Tertiary older sedimentary deposits (Tog), on the basis of the degree of consolidation observed during well drilling (fig. 3). The Tertiary older sedimentary deposits overlie the basement complex in most of the Langford Basin (fig. 3) and consist of consolidated arkosic sandstone and conglomerate. In general, the Tertiary older sedimentary deposits are overlain by Tertiary younger sedimentary deposits. The Tertiary younger sedimen-tary deposits are unconsolidated but are generally less perme-able than the overlying Quaternary deposits. However, where sand and gravel predominate, the Tertiary deposits, in general, may yield moderate amounts of water to wells.
The Quaternary older alluvium (figs. 2 and 3; Qoa) overlies the Tertiary deposits and consists of sand, gravel, and clay. The clasts in this deposit vary with nearby source rocks; they are primarily derived from quartzite, granite, and marble in the northern part of the basin near Garlic Spring and from granitic rocks in the southern part of the basin. The Quaternary older alluvium, in small areas to the southwest and northeast of the basin, typically is cemented by calcite in its upper 10–20 ft where exposed at the surface. The Quaternary older alluvium is more indurated and slightly less permeable than the overly-ing Quaternary younger alluvium but still yields moderate amounts of water.
The Quaternary younger alluvium (Qya), younger eolian deposits (Qye), and playa deposits (Qp) (figs. 2 and 3) overlie the Quaternary older alluvium throughout the basin. These
deposits, as a group, are composed of unconsolidated sand and gravel with some pedogenic silt and clay. The Quater-nary younger alluvium is coarser grained near the hills and becomes finer grained and better sorted toward the Langford Well Lake (dry) playa. The Quaternary younger alluvium generally is less than 20 ft thick and lies above the water table (figs. 3A and 3B).
Quaternary playa deposits (figs. 2 and 3C; Qp) underlie the surface of Langford Well Lake (dry) in the northeastern part of the basin. The Quaternary playa deposits consist of moderately sorted clay, silt, and fine sand and may be as much as 100 ft thick. The Quaternary playa deposits are interfingered with the Quaternary younger alluvium and extend into the Quater-nary older alluvium. The Quaternary playa deposits are fine grained and have a very low permeability. Because of the low permeability, infiltration of surface water is impeded and water ponds on the playa after an occasional storm; the ponded water generally evaporates.
A thin layer of eolian deposits (fig. 2; Qye) is present along the western edge of the playa (fig. 3B). These deposits, consisting of loose sand that was deposited by wind, are not saturated and are not a source of groundwater. Because eolian deposits tended to form near ancient playas, similar deposits may be buried.
Depth to the Basement ComplexA gravity survey was done, as part of this study, to help
understand the three-dimensional structure and to help esti-mate the depth to the basement complex (thickness of basin fill) in the study area (Smith, 1997; Morin, 2000). The gravity survey includes measurements at 290 gravity stations (shown in fig. 2 in Morin, 2000). Estimating the depth to the basement complex from gravity data requires knowledge of the residual gravity field of the exposed geology and knowledge of the vertical density variation within the basin deposits. In addition, data from boreholes that penetrate the surface of the basement complex and surficial geophysical data, including seismic refraction (David Berger, U.S. Geological Survey, written commun., 1996) and time-domain electromagnetic (Burgess and Bedrosian, 2013) data, provide constraints on the esti-mated thickness of the basin fill. These geophysical data were used to map the depth to the water table, the contact between water-bearing alluvial deposits and non-water-bearing Tertiary sediments, and changes in water salinity with depth. For detailed information regarding the gravity survey and analysis, the reader is referred to Smith (1997) and Morin (2000).
The estimated altitude of the basement complex in the Langford Basin shows there are three deep areas within the basin with a minimum altitude of 1,000 ft above NAVD 88 or less (fig. 4). The deepest area is beneath Langford Well Lake (dry) playa, at an altitude of about 600 ft above NAVD 88, in the northeastern part of the basin. The other two deep areas are about 1 mi southwest and 2 mi south of the playa. A ridge separates these two areas and could represent a buried fault. The thickness of the basin fill exceeds 1,000 ft in each of the three areas (fig. 3).

Geohydrologic Framework 7
Figure 3. Generalized geologic sections A, A-A’; B, B-B’; and C, C-C’ across Langford Basin, Fort Irwin National Training Center, California.
NOB
LE D
OME
FAUL
T
UNN
AMED
NOR
TH FA
ULT
GARL
IC S
PRIN
G FA
ULT
Lang
ford
Lak
e Ro
ad
13N
/3E–
14K1
- Be
nd in
sec
tion
13N
/3E–
23F1
- Be
nd in
sec
tion
13N
/3E–
23P1
- Be
nd in
sec
tion
13N
/3E–
26N
1 - B
end
in s
ectio
n
13N
/3E–
34Q1
- Be
nd in
sec
tion
13N
/3E–
26N
2
??
??
????
??
??
?? ?? ??
A
QoaQoa
QoaQoa
Qya
Bc
Bc
Bc
Tog
Tog
Tyg
Tyg
Tyg
Sect
ion
C-C'
Sect
ion
B-B'
??
??
??
0
0 1 MILEDatum is NAVD 88
1 KILOMETER
Vertical exaggeration 15X
Qya
NOBLE DOME FAULT
13N
/3E–
14K1
Water table (Estimated for 1992)
??
Contact—Queried where uncertain
Upper aquifer
Fault—Queried where uncertain; arrowsindicate direction of apparent movement
Well and number—
Perforated interval
EXPLANATIONGeology
Tyg
Tog
Basement complex
Fault name
Bc
Younger alluvium
Younger sedimentary deposits—Middle aquifer
Quaternary -
pre-Tertiary -
Tertiary -
Quaternary/Tertiary - Older alluvium
Older sedimentary deposits—Lower aquifer Tertiary -
QoaQoa
A'SOUTHWEST NORTHEAST
2,200
2,600
2,800
2,400
2,000
1,800
1,600
1,400
1,200
1,000
Altit
ude
FEET
A
Locations of sections are shown on figure 2

8 Geohydrology, Geochemistry, Groundwater Simulation and Analysis of Potential Water-Supply Management Options
NOB
LE D
OME
FAUL
T
UNN
AMED
NOR
TH FA
ULT
COYO
TE L
AKE
FAUL
T
13N
/3E-
35J1-
3 - B
end
in s
ectio
n
12N
/3E-
1M1,
1M
4-5
- Ben
d in
sec
tion
13N
/3E-
35B1
- Be
nd in
sec
tion
13N
/3E-
23P1
- Be
nd in
sec
tion
13N
/3E-
23F1
- Be
nd in
sec
tion
13N
/3E-
26K2
-4*
- Ben
d in
sec
tion
13N
/3E-
26K1
13N
/3E-
35A1
- Be
nd in
sec
tion
0
0 1 MILE
1 KILOMETER
Water table (Estimated for 1992)
??
Contact—Queried where uncertain
Fault—Queried where uncertain; arrowsindicate direction of apparent movement
EXPLANATIONGeology
Fault name
Younger alluviumQuaternary -
Quaternary/Tertiary - Older alluvium
Qya
Upper aquifer
Tyg
Tog
Basement complexBc
Younger sedimentary deposits—Middle aquifer
pre-Tertiary -
Tertiary -
Older sedimentary deposits—Lower aquifer Tertiary -
13N
/3E–
26K1
Well and number—
Perforated interval
Indicates wells that are projected into the section line
*
2,200
2,600
2,800
2,400
2,000
1,800
1,600
1,400
1,200
1,000
3,000
Altit
ude
BB
B'NORTHWEST SOUTHEAST
FEET
?
??
?
?
?
? ?
?
?
?
Bc
Tyg
Tyg
Tog
QoaQoa
Bc
Bc
Qya
Tog
Tyg
Tyg
Qoa
Tog
Qoa
Tyg
Qya Sect
ion
A-A'
Sect
ion
C-C'
Qoa
NOBLE DOME FAULT
Datum is NAVD 88Vertical exaggeration 15X
Locations of sections are shown on figure 2
Figure 3. Generalized geologic sections A, A-A’; B, B-B’; and C, C-C’ across Langford Basin, Fort Irwin National Training Center, California.—Continued

Geohydrologic Framework 9
13N
/3E-
26K2
–4 -
Bend
in s
ectio
n13
N/3
E-26
K1 -
Bend
in s
ectio
n
13N
/3E-
26N
1 - B
end
in s
ectio
n13
N/3
E-26
N2
13N
/3E-
24N
1 - P
roje
cted
C
0
0 1 MILE
1 KILOMETER
600
Qya
13N
/3E-
26K2
–4
Water table (Estimated for 1992)
? Contact—Queried where uncertain
Upper aquifer
Well and number—
Perforated interval
EXPLANATION
Qoa
Tyg
Tog
Basement complex
Younger alluvium
Younger sedimentary deposits—Middle aquifer
Quaternary -
pre-Tertiary -
Tertiary -
Quaternary/Tertiary - Older alluvium
Older sedimentary deposits—Lower aquifer Tertiary -
QpQye
C'EAST
2,200
2,600
2,800
2,400
2,000
1,800
1,600
1,400
1,200
1,000
800
Altit
ude
CWEST
FEET
Sect
ion
A-A'
Sect
ion
B-B'
BcBcTog
Tog
Qoa
Qye
Qp
Qoa
Tyg
Qya
BcBc
Tyg
Tyg
BcBc
?
?
?
?
???
?
?
?
?
Datum is NAVD 88Vertical exaggeration 15X
Fault
Locations of sections are shown on figure 2
Geology
Figure 3. Generalized geologic sections A, A-A’; B, B-B’; and C, C-C’ across Langford Basin, Fort Irwin National Training Center, California.—Continued

10 Geohydrology, Geochemistry, Groundwater Simulation and Analysis of Potential Water-Supply Management Options
1,000
1,200
1,400
1,80
0
1,600
1,400
1,40
0
1,200
004,2
2,200
2,200
2,000
2,000
2,200
1,80
0
1,600
1,600
1,200
2,400
1,000
008,1000,2
002,2
004,2
2,00
0
UNNAMED NORTH FAULT
PLAYA FAULT
NOBLE DOME FAULT
COYOTE LAKE FAULT
?
COYOTE LAKE FAULT
NORTH NOBLE
DOME FAULT
GARLIC SPRING FAULT
?
??
?
?
?
?
SOUTH NOBLE DOME FAULT?
L3
L2
L1
23F1
23P1
26N1
26N2
26K1
26K2-4
14K1
34Q1 35J1-3
1M1-31M4,5
35B1
35A1
24N1
Approximate groundwater basin boundary
Seismic lines
Destroyed
Production
Test
Unused production
23P1
26N1
26N2
34Q1
1,600
Fault—Dashed where approximatelylocated; queried where uncertain;dotted where concealed
EXPLANATION
?
1 2 KILOMETERS
1 2 MILES
0
0 R3E R4E
T13N
T12N
LangfordWell Lake
(dry)
Nob
leDo
me
UD
UD
UD
B'
A
BC
C'
A'
Time-domain electromagnetic site
U.S. Geological Survey single-well site
24N1
U.S. Geological Survey multiple-well site
26K2–4L3
Well and number—Well identified by section number only; township and range are shown on this figure
Bedrock contour—Shows altitude of bedrock. Contour interval 200 feet. Datum is NAVD 88
UD
Figure 4. Altitude of the basement complex in Langford Basin, Fort Irwin National Training Center, California, based on gravity measurements.

Geohydrologic Framework 11
FaultsFaults control much of the physiography of the Fort Irwin
NTC and probably control the shape of Langford Basin (Yount and others, 1994; Morin, 2000; Miller and Yount, 2002). Many faults in the Langford Basin area have been active during the Quaternary; few have demonstrated Holocene rupture, and none are considered to be a seismic risk (Miller and others, 1994). Several faults have been mapped in the bedrock hills around the Langford Basin, including the Garlic Spring, North Noble Dome, South Noble Dome, and Coyote Lake Faults (Yount and others, 1994; Schermer and others, 1996; Miller and Yount, 2002) (fig. 2). However, the precise locations of these faults are uncertain in the Langford Basin. The locations of the faults, where they are obscured by buried sediment, were approximated by projecting the mapped trace of these faults into the basin. Additionally, data collected for this study, including gravity surveys, water-level measurements, and groundwater-flow model calibration, were used to refine the locations of previously mapped faults and define the locations of previously unmapped faults within the Langford Basin.
The Garlic Spring Fault is a northwest-southeast trending fault near the northeastern boundary of the basin, where the basement complex is uplifted on the northeast side of the fault (figs. 2 and 3). The North Noble Dome, South Noble Dome, and Coyote Lake Faults are east-west trending faults mapped in the Noble Dome pediment (a flat bedrock surface at the base of Noble Dome) southwest of the Langford Basin. On the basis of differences in water-level measurements and gravity data collected during this study, an east-west trending fault is projected to extend from Noble Dome into the Langford Basin, just south of wells 13N/3E-35A1 and 13N/3E-35B1, and is referred to as the Noble Dome Fault in this report. The basin fill appears to be uplifted on the south side of the Noble Dome Fault relative to the north side (fig. 3A and 3B). The Noble Dome Fault impedes groundwater flow between the central and southern parts of the basin. The Coyote Lake Fault is an east-west trending fault in the southern part of the basin (fig. 2). The basement complex and Tertiary sedimen-tary deposits are uplifted on the south side of the fault (David Miller, U.S. Geological Survey, oral commun., 2004; fig. 3B). Data are not available to determine if the Coyote Lake Fault is a barrier to groundwater flow.
Two additional faults, referred to as the Playa and unnamed north faults (fig. 2), were identified in the northern part of the Langford Basin on the basis of water-level and gravity data (see “Groundwater Levels and Flow” and “Depth to Basement Complex” sections, respectively), and their locations were refined on the basis of the groundwater-flow model calibration as described in the “Model Calibration” section of this report. These two faults appear to impede the flow of groundwater between the northern and central parts of the Langford Basin. The playa fault (fig. 2) trends east-west and is projected as a continuation of mapped faults east of the basin. The playa fault crosses through Langford Well Lake (dry) playa and may intersect the unnamed north fault (fig. 2) near the western
edge of the playa. The unnamed north fault (fig. 2) is pro-jected to follow the same trend as the Garlic Spring Fault to the northeast. The unnamed north fault is just west of wells 13N/3E-23F1 and 13N/3E-24N1 (fig. 2) and is aligned with an unnamed fault identified in the Irwin Basin by Densmore and Londquist (1997).
Groundwater Hydrology
The Langford Basin aquifer system was defined from infor-mation contained in previous studies, geophysical investiga-tions conducted for this study in the basin, and geohydrologic data collected from existing and newly installed wells in the basin. As part of this study, 11 monitor wells were installed to update and refine the understanding of the geohydrologic framework of the Langford Basin (fig. 2, table 1). During 1995, one piezometer was installed in the northern part of the basin (13N/3E-14K1), and three piezometers were installed at a multiple-well site southwest of the Langford Well Lake (dry) playa (13N/3E-26K2, 13N/3E-26K3, and 13N/3E-26K4). During 2002, one piezometer was installed in the middle of the Langford Well Lake (dry) playa (13N/3E-24N1), and three piezometers were installed at a multiple-well site in the central part of the basin, south of the Noble Dome Fault (13N/3E-35J1, 13N/3E-35J2, and 13N/3E-35J3). During 2011, three piezometers were installed at a multiple-well site in the south-ern part of the basin, north of the Coyote Lake Fault (12N/3E-1M1, 12N/3E-1M4, and 12N/3E-1M5). A typical multiple-well monitoring site in Langford Basin consists of two or three 2-in. diameter polyvinyl chloride (PVC) piezometers. Each piezometer has a single 20- or 40-ft screened interval, installed at different depths in the same borehole. The design of each multiple-well monitoring site was determined during well construction by examining the drill cuttings collected during drilling and the borehole geophysical logs. The lithologic logs of the drill cuttings and the geophysical logs from each bore-hole are presented in appendix 1.
Aquifer System DefinitionThe Langford Basin aquifer system consists of three
aquifers, referred to in this report as the upper aquifer, middle aquifer, and lower aquifer. The upper aquifer is consists of the saturated part of the younger Quaternary alluvium and the Quaternary older alluvium, and generally is unconfined. The upper aquifer has a saturated thickness of about 200 ft near well 13N/3E-23F1 and pinches out at the margins of the basin (fig. 3). The middle aquifer is composed of Ter-tiary younger sedimentary deposits and generally is confined or partly confined. The middle aquifer is as much as 440 ft thick and is generally less permeable than the upper aquifer. The lower aquifer is composed of Tertiary older sedimentary deposits, and the thickness ranges from 40 to 1,000 ft. The base of the lower aquifer system is considered to be the top of the basement complex. The areal extent of the Langford Basin

12 Geohydrology, Geochemistry, Groundwater Simulation and Analysis of Potential Water-Supply Management Options
was delineated on the basis of the altitude at which the 1992 groundwater-level altitude intersects the bottom of the base-ment complex. The 1992 groundwater levels were selected because the groundwater system was undeveloped at that time. Thus, the areal extent of the Langford Basin for this study dif-fers from that of previous studies (for example, Wilson F. So and Associates (1989)).
The transmissivity and hydraulic conductivity of the upper and middle aquifers were estimated from historical specific-capacity data. Thomasson and others (1960) reported that for unconfined valley-fill deposits in the Sacramento Valley, California, the specific capacity in units of gallons per minute of discharge per foot of drawdown in the well, multiplied by 230, approximates the transmissivity of the aquifer in units of feet squared per day. This empirical relation between spe-cific capacity and transmissivity from studies of the northern California aquifer was assumed to be representative of the upper and middle aquifers in the Langford Basin study area because these sediments were deposited in a similar deposi-tional environment as the sediments in Sacramento Valley. Additionally, there is not enough information to indicate a large difference in hydraulic conductivity between the upper and middle aquifers; thus, the upper and middle aquifers were assumed to have similar values. Specific-capacity tests were conducted at eight wells perforated in the upper and middle aquifers, except well 13N/3E-23F1, which is perforated in all three aquifers, in Langford Basin (C.F. Hostrup and Associ-ates, 1955; James M. Montgomery and Associates, 1981; Wilson F. So and Associates, 1989; Southern California Edi-son Company, written comm., 1992). The calculated specific capacity for wells in Langford Basin ranged from about 2.1 to 19 (gal/min)/ft, and the estimated transmissivity ranged from 480 to 4,400 ft2/d (table 2). The hydraulic conductivity of the
upper and the middle aquifers was estimated by dividing the estimated transmissivity of the aquifers by the saturated thick-ness of each aquifer (table 2). The estimated transmissivity is an average for all the aquifer intervals opposite the screened intervals of the well. Hydraulic conductivities for the upper and middle aquifers estimated by this method ranged from 1 to 30 ft/d. Specific capacity was not calculated for the lower aquifer. On the basis of grain size from lithologic cuttings and characteristics during drilling, the hydraulic conductivity for the lower aquifer was estimated to be about 2 ft/d.
Recharge and DischargePrevious investigators have estimated the annual recharge
to the Langford Basin aquifer system to range from negligible (James M. Montgomery and Associates, 1981) to in excess of 700 acre-ft (Wilson F. So and Associates, 1989) from all sources. Because annual precipitation in Langford Basin is less than 7 in., recharge derived from precipitation is mini-mal. The Langford Basin aquifer system is recharged along normally dry washes near the base of the surrounding hills during precipitation events, primarily in the winter or after short summer thunderstorms. Although some of the surface runoff collects in the Langford Well Lake (dry) playa, a low area in Langford Basin, recharge from this source is negligible because of the low permeability of the playa sediments.
The Langford Basin aquifer system is recharged by groundwater underflow from the Irwin Basin through alluvial materials that connect the basins beneath an unnamed dry wash that lies parallel to the Garlic Spring Fault (fig. 2). The driller’s log from monitoring well 13N/3E-14K1, in the north-ern part of the Langford Basin (fig. 2), indicates that the wash is underlain by about 97 ft of alluvial material where it enters
Table 2. Results of aquifer tests conducted in Langford Basin, Fort Irwin National Training Center, California. [Location of wells shown in figure 2. Abbreviations: gal/min/ft, gallon per minute per foot; ft2/d, foot squared per day; ft, foot; ft/d, foot per day; —, no data; ?, test date not published; Qoa, Quaternary older alluvium; Tyg, Tertiary younger sedimentary deposits; Tog, Tertiary older sedimentary deposits]
Local well name
State well number
Date tested(month year)
Tested by
Specific capacity
(gal/min/ft)
Transmissivity (ft2/d)
Saturated thickness1
(ft)
Hydraulic conductivity2
(ft/d)
Aquifer the well is screened in
LX-1 13N/3E-23F1 Oct 80 Driller3 3.8 870 480 2 Qoa, Tyg, Tog
L-1 13N/3E-35B1 ? Hostrup4 4.7 1,100 380 3 Qoa, TygNov 80 Montgomery5 — — — 3–10
TH-8 13N/3E-26N2 Feb 88 So6 5.2 1,200 180 7 Qoa, TygL-3 13N/3E-26N1 Feb 88 So6 5.6 1,300 180 7 Qoa, TygTH-10 13N/3E-34Q1 Feb 88 So6 5.2 1,200 45 30 TygLP-1 13N/3E-35A1 Feb 92 SCE7 19.0 4,400 420 10 Qoa, TygLP-2 13N/3E-26K1 Feb 92 SCE7 9.0 2,100 280 7 Qoa, TygLP-3 13N/3E-23P1 Feb 92 SCE7 4.8 1,100 400 3 Qoa, Tyg
Nov 80 Montgomery5 2.1 480 400 11The saturated thickness is from the top of the water table to the bottom of the well.2The hydraulic conductivity is an average for all aquifers the well is sceened in.3Data from water-well driller’s log.4C.F. Hostrup and Associates (1955).5James M. Montgomery and Associates (1981).6Wilson F. So and Associates (1989). 7Southern California Edison, written comm., 1992.

Geohydrologic Framework 13
the basin (appendix fig. A1-4). Prior to groundwater devel-opment in Irwin Basin, groundwater underflow out of Irwin Basin through the alluvial materials underlying the wash was estimated to be about 50 acre-ft (Densmore, 2003). Since the early 1990s, Irwin Basin has experienced a net inflow of water owing to importation of water withdrawn from the Bicycle and Langford Basins and the subsequent infiltration of treated wastewater effluent in the southeastern part of the Irwin Basin (Densmore, 2003). Groundwater levels in the wash in Irwin Basin have risen above predevelopment levels as a result of the net increase in groundwater inflow into the basin, which resulted in the annual average groundwater underflow out of the Irwin Basin increasing from about 50 acre-ft in the early 1990s to about 105 acre-ft in 1999 (Densmore, 2003). The increase in groundwater underflow from the Irwin Basin does not immediately become recharge to the Langford Basin because of the more than 1 mi distance between the basins (fig. 1). In addition, some of the underflow probably is lost to evapotranspiration by phreatophytes near Garlic Spring. Therefore, the total groundwater underflow into the Langford Basin probably is less than the total groundwater underflow out of the Irwin Basin. The groundwater-flow model devel-oped for this study, described in the “Simulation of Ground-water Flow” section of this report, was used to estimate the quantity and timing of groundwater underflow into the Langford Basin.
Groundwater underflow discharges from Langford Basin beneath an unnamed, highly faulted, low-lying rise east of the Langford Well Lake (dry) playa (fig. 2). Geomorphic evidence, observed in a high-resolution aerial photo covering Langford Basin and adjacent West Cronise Valley, indicates that a wash discharged toward West Cronise Valley. The wash is at the lowest elevation in the Langford Basin and West Cro-nise Valley (U.S. Geological Survey, 2012), and the wash is the only area where surface water can flow out of the Langford Basin. It is believed that surface water discharged from Lang-ford Basin through this wash, and underflow flowed through the faulted section. Before groundwater development began in 1992, groundwater underflow was the only discharge from the basin. Evaporation of groundwater beneath Langford Well Lake (dry) playa is negligible because the water table is more than 30 ft below land surface. Prior to 1992, the Langford Basin was considered to be in steady-state conditions, with discharge equal to recharge to the basin.
Groundwater Withdrawals and Water UseGroundwater withdrawals in Langford Basin began in 1992
when three production wells (13N/3E-23P1, 13N/3E-26K1, and 13N/3E-35A1; fig. 2) were installed in a north-south line west of the playa (fig. 2). Groundwater withdrawn from the wells is transported through a pipeline to Irwin Basin, where it is blended with the water withdrawn from Irwin and Bicycle Basins and is used in Irwin Basin. None of the water that is withdrawn from Langford Basin is used in or returned to Langford Basin.
Groundwater withdrawals are metered and recorded on a monthly basis by Fort Irwin personnel. Between April 1992 and December 2010, an average of 648 acre-ft/yr of water was withdrawn from Langford Basin (table 3). Average annual withdrawal rates were 101, 219, and 329 acre-ft/yr from production wells 13N/3E-23P1, 13N/3E-26K1, and 13N/3E-35A1, respectively. Total annual groundwater with-drawals ranged from about 133 to 1,006 acre-ft/yr (table 3 and fig. 5A). During the 19-year period from April 1992 through December 2010, groundwater withdrawals were highest dur-ing June, July, August, and September, accounting for about 50 percent of the average annual withdrawals (fig. 6).
Groundwater Levels and Flow
Water levels measured during the 1980s at wells 13N/3E-23F1, 26N1, 26N2, 34Q1, and 35B1are considered to rep-resent predevelopment conditions in the Langford Basin (fig. 7A). The predevelopment groundwater gradient was relatively flat, with a general direction of groundwater flow beneath Langford Well Lake (dry) playa, and groundwater dis-charges from the basin east of the playa as underflow through the heavily faulted, low-lying hills (fig. 2). The predevelop-ment groundwater-level (or water-table) altitude was about 2,114 ft near the playa. Groundwater levels were relatively stable prior to the initiation of pumping in 1992 (fig. 5B).
Table 3. Summary of annual groundwater withdrawals, in acre-feet per year, from three wells in Langford Basin, Fort Irwin National Training Center, California, April 1992–December 2010.
Year 13N/3E-23P1 13N/3E-26K1 13N/3E-35A1 Total11992 45.9 149.9 364.7 560.51993 94.6 427.9 483.4 1,005.91994 82.1 213.4 609.1 904.61995 23.7 155.6 553.1 732.41996 138.6 223.1 232.7 594.41997 70.6 188.9 550.5 810.01998 209.5 175.9 264.1 649.51999 110.0 142.0 221.0 473.02000 145.9 203.8 232.5 582.22001 70.4 46.9 116.8 234.12002 75.1 211.2 97.4 383.72003 46.4 239.6 332.0 618.02004 19.5 199.6 276.0 495.12005 169.1 236.9 276.7 682.72006 209.2 355.8 337.9 902.92007 50.2 82.5 0.0 132.72008 212.8 411.6 230.4 854.82009 66.4 215.5 510.1 792.02010 73.9 272.1 553.6 899.6
Total 1,914.0 4,152.2 6,241.9 12,308.1Average 100.7 218.5 328.5 647.8Average
percent15.6 33.7 50.7 100.0
1Groundwater withdrawals from April 1992 to December 1992.

14 Geohydrology, Geochemistry, Groundwater Simulation and Analysis of Potential Water-Supply Management Options
From 1992 to 2010, approxi-mately 12,310 acre-ft of water were withdrawn from the three produc-tion wells in the basin (table 3). Water-level contours represent-ing 1995, 2000, 2005, and 2010 conditions show that groundwater withdrawals have resulted in a cone of depression near production well 13N/3E-35A1 in the central part of the basin (fig. 7B, 7C, 7D, and 7E). From predevelopment condi-tions (fig. 7A) to 2010, water-level declines were measured at all wells in the Langford Basin, with as much as 50 ft under pumping conditions in well 13N/3E-35B1 in the cone of depression (figs. 5B and 7E).
Inspection of the groundwater-level contours indicates that faults within the basin impede the flow of groundwater (fig. 7). The impedi-ment effect of these faults is likely caused by the low permeability of the fault zones resulting from the compaction and extreme deforma-tion of the water-bearing deposits immediately adjacent to the faults and by lateral juxtaposition of high-permeability and low-permeability units. The low-permeability fault zones form a partial barrier to the
lateral movement of groundwater flow, which can cause sharp discontinuities in water-level altitudes on opposite sides of a fault. In some cases, the barrier effect of the fault is not observed until the aquifer system is stressed by groundwater pumping or recharge. Thus, the water level in a well on the other side of a fault from a production well may not respond or may have a delayed response to water-level changes at the production well from variations in the withdrawal rate.
Groundwater QualityThe groundwater quality of the Langford Basin was
defined by collecting water-quality samples from 18 wells and 1 spring during 1993–2011 (appendix 2). Groundwater from the Langford Basin is treated prior to distribution for drinking. Three of the sites sampled were multiple-well monitoring sites that each contain three wells screened at different depths. The remaining nine wells were production wells or single-well monitoring sites. Data collected as part of this study were supplemented with historical data from wells also shown in appendix 2 (C.F. Hostrup and Associ-ates, 1955; Kunkel and Riley, 1959; James M. Montgomery and Associates, 1981; Wilson F. So and Associates, 1989).
Figure 5. A, Groundwater withdrawal, and B, water-level fluctuations in selected wells in Langford Basin, Fort Irwin National Training Center, California.
0
2
4
6
8
10
12
14
16
Jan Feb Mar Apr May June July Aug Sept Oct Nov Dec
Month
Perc
ent o
f ann
ual w
ithdr
awal
0
200
400
600
800
1,000
1,200
Annu
al g
roun
dwat
er w
ithdr
awal
,in
acr
e-fe
et
A
B
2,050
2,060
2,070
2,080
2,090
2,100
2,110
2,120
1950 1955 1960 1965 1970 1975 1980 1985 1990 1995 2000 2005 2010YEAR
Wat
er-le
vel a
ltitu
de,
in fe
et a
bove
sea
leve
l Static water levels
Pumping begins
Pumping begins
Water levelsreflect nearbypumping
13N/3E-23P113N/3E-26K113N/3E-35A1
Groundwater withdrawal
Location of wells shown on figure 2; dashed lines indicate missing data
13N/3E-35B1 (100-482 feet, upper and middle aquifer)
13N/3E-34Q1 (240-285 feet, upper aquifer)
Light colored circles affected by nearby pumping
Figure 6. Monthly distribution of groundwater withdrawals, January 1993–December 2010, Langford Basin, Fort Irwin National Training Center, California.

Groundwater Quality 15
Figure 7. Groundwater-level contours for A, predevelopment (1980–88); B, 1995; C, 2000; D, 2005; and E, 2010 in Langford Basin, Fort Irwin National Training Center, California.
UNNAMED NORTH FAULT
PLAYA FAULT
NOBLE DOME FAULT
COYOTE LAKE FAULT
UNNAMED NORTH FAULT
PLAYA FAULT
NOBLE DOME FAULT
COYOTE LAKE FAULT
UNNAMED NORTH FAULT
PLAYA FAULT
NOBLE DOME FAULT
COYOTE LAKE FAULT
UNNAMED NORTH FAULTPLAYA FAULT
NOBLE DOME FAULT
COYOTE LAKE FAULT
?
COYOTE LAKE FAULT
NORTH NOBLE
DOME FAULT
GARLIC SPRING FAULT
?
??
?
?
?
?
?
SOUTH NOBLE DOME FAULT
?
COYOTE LAKE FAULT
NORTH NOBLE
DOME FAULT
GARLIC SPRING FAULT
?
??
??
?
?
?
SOUTH NOBLE DOME FAULT
?
COYOTE LAKE FAULT
NORTH NOBLE
DOME FAULT
GARLIC SPRING FAULT
?
??
?
?
?
?
?
SOUTH NOBLE DOME FAULT
?
COYOTE LAKE FAULT
NORTH NOBLE
DOME FAULT
GARLIC SPRING FAULT
?
??
?
?
?
?
?
SOUTH NOBLE DOME FAULT
2,105
2,100
2,110
2,115
2,105
2,110
2,110
2,100
2,095
2,100
2,09
52,0
90
2,105
2,115
2,110
2,120
23F12,115
26N12,116
26N22,116 35B1
2,114
23F12,116
23P12,109
26N12,106
26K12,104
34Q12,113
34Q12,110
34Q12,107
35J32,104
35B12,085
35A126N12,094
26K12,091
26K42,094
23P12,105
23F12,115
14K12,122
35B12,092
35A126N12,098
26K12,097
26K42,094
23P12,103
23F12,114
35B12,098
35A1
34Q12,115
EXPLANATION
2,107
2,105
34Q1
?
1 2 KILOMETERS
1 2 MILES
0
0
Nob
leDo
me
U
UD
T13N
T12N
Nob
leDo
me
UD
UD
R3E R4E
Nob
le
UD
UD
UD
R3E R4E
T13N
T12N
Nob
leDo
me
U
D
U
D
UD2000 2005
1995A
C
B
D
Predevelopment(1980–88)
UD Fault—Dashed where approximately located; queried where uncertain; dotted
where concealed; U indicates up-thrown side of fault; D is down-thrown side of fault
Well and number—Top number is well section number (township and range is shown on figure). Bottom number is water-level altitude measured during year indicated, in feet above NAVD 88. White-filled circle indicates production well
Lines of equal water-level altitude—Interval is varied. Datum is NAVD 88. Arrows show direction of groundwater flow Approximate groundwater basin—Boundary from 1993 water-level altitudeGeneralized direction of flow
LangfordWell Lake
(dry)
LangfordWell Lake
(dry)
LangfordWell Lake
(dry)
LangfordWell Lake
(dry)

16 Geohydrology, Geochemistry, Groundwater Simulation and Analysis of Potential Water-Supply Management Options
UNNAMED NORTH FAULT
PLAYA
COYOTE LAKE
PLAYA FAULT
NOBLE DOME FAULT
COYOTE LAKE FAULT
?
?
??
?
?
?
?
?
?
COYOTE LAKE FAULT
NORTH NOBLE
DOME FAULT
GARLIC SPRING FAULT
?
?
?
?
?
?
?
SOUTH NOBLE DOME FAULT
2,120
2,115
2,110
2,105
2,090
2,085
2,075
2,075
2,070
2,0802,065
2,100
2,105
2,095
?
?
?
?
?
?
? ?
?
?
???
35B12,064
35J32,101
1M52,115
23F12,113
23P12,095
26N12,081
26K12,079
26K42,060
14K12,121
34Q12,104
24N12,100
Qp Qye QyaQuaternary –
EXPLANATION
Younger Alluvium
Geology by D.M. Miller,unpublished data, 1994
1 2 KILOMETERS
1 2 MILES
0
0 R3E R4E
T13N
T12N
Nob
leDo
me
U
D
UD
Approximate groundwater basin boundary
U.S. Geological Survey
Unused production
ProductionTest
Qp Qye QyaQuaternary –
Geology
EXPLANATION
Fault—Dashed where approximately located; queried where uncertain; dotted where concealed
Younger Alluvium
35J3
34Q1
26N1
23P1
Geology by D.M. Miller,unpublished data, 1994
1 2 KILOMETERS
1 2 MILES
0
0 R3E R4E
T13N
T12N
Nob
leDo
me
D
UD
E
Lines of equal water-level altitude— Interval is varied. Datum is NAVD 88. Arrows show direction of groundwater flow
2,105
LangfordBasin
2010
Generalized direction of flow
?UD
Well and number—Well identified by section number only; township and range are shown on this figure
LangfordWell Lake
(dry)
Figure 7. Groundwater-level contours for A, predevelopment (1980–88); B, 1995; C, 2000; D, 2005; and E, 2010 in Langford Basin, Fort Irwin National Training Center, California.—Continued

Groundwater Quality 17
Sampling and Laboratory Methods
Water-quality samples were analyzed in the field for specific conductance, pH, temperature, and alkalinity, and were collected following the methods described in the USGS National Field Manual (U.S. Geological Survey, 2006). Samples were analyzed in the laboratory for major and minor ions, alkalinity, selected trace elements, nutrients, the ratios of the stable isotopes of oxygen (O) and hydrogen (H), and the concentrations of the radioactive isotopes tritium (3H), and carbon-14 (14C) (appendix 2).
Groundwater samples for major and minor ions, trace ele-ments, alkalinity, and total dissolved solids (TDS) analyses required filling one 250-milliliter (mL) polyethylene bottle with unfiltered groundwater and one 500-mL and one 250-mL polyethylene bottle with filtered groundwater (Wilde and oth-ers, 2004). Samples were filtered using a 0.45 micron What-man capsule filter. Each 250-mL filtered sample was preserved with 7.5 Normal nitric acid. Each nutrient sample was filtered into a 125-mL opaque polyethylene bottle. Samples for alka-linity titrations were collected by filtering groundwater into a 500-mL polyethylene bottle. Samples for stable isotopes were collected in 60-mL clear glass bottles filled with unfiltered groundwater and capped; caps were secured using electri-cal tape to prevent leakage and evaporation. Samples for 3H analysis were collected by filling 1-L amber glass bottles with unfiltered groundwater; bottles were closed using caps with a conical insert and secured using electrical tape. 14C samples were collected by filling a 1-L glass bottle from the bottom of the bottle with filtered groundwater.
All samples, except 14C, were analyzed at the USGS National Water Quality Laboratory (NWQL) or by laborato-ries contracted by the NWQL. Inorganic constituents were analyzed by the NWQL using methods described in Fishman (1993), Patton and Kryskalla (2003), Fishman and Fried-man (1989), McLain (1993), and Garbarino (1999). Stable isotopes were analyzed on contract to the NWQL by the USGS Stable Isotope Laboratory in Reston, Virginia, using methods described by Epstein and Mayeda (1953), Coplen and others (1991), and Coplen (1994). 14C was analyzed on contract to the NWQL by Woods Hole Oceanographic Institu-tion, National Ocean Sciences Accelerator Mass Spectrom-etry Facility [NOSAMS] in Massachusetts, using methods described by Vogel and others (1987), Donahue and others (1990), Gagnon and Jones (1993), and Schneider and others (1994). Tritium was analyzed by the USGS Stable Isotope and Tritium Laboratory in Menlo Park, California, using meth-ods described by Thatcher and others (1977). These data are stored in the USGS NWIS database and can be accessed at http://waterdata.usgs.gov/ca/nwis/nwis.
General Water-Quality Characteristics
The major-ion chemistry of groundwater in the Langford Basin is controlled by the natural chemistry of the recharge water, geochemical reactions, which are primarily dissolution
and precipitation of minerals in the subsurface, and evapora-tion. The chemical character of groundwater sampled from selected wells and the spring was determined by using Stiff and trilinear diagrams (figs. 8 and 9). A Stiff diagram depicts the concentrations of major ions in milliequivalents per liter (fig. 8) and indicates relative proportions of major ions (Stiff, 1951). Similarly shaped Stiff diagrams indicate the presence of groundwater with similar chemical characteristics for major ions. Changes in the width of the diagrams approximate differ-ences in the concentrations of TDS. Trilinear diagrams were plotted by using a method described by Piper (1944) to visu-ally characterize water quality differences (water types) within the basin (fig. 9). A trilinear diagram displays the relative con-tribution of major cations and anions, on a charge-equivalent basis, to the total ionic content of the water. Percentage scales show cation concentrations on the upper right and lower left sides of a central diamond and the anion concentrations are shown on the opposite sides. The position of a sample on the diagram gives an indication of the chemical character of the water and allows a comparison to be made between different samples.
Stiff diagrams were plotted on a map of the study area to show the areal distribution of water quality in the basin (fig. 8). Trilinear diagrams were prepared for samples from the northern part (the area east of the unnamed north fault and north of the playa fault), the central part (the area north of the Noble Dome Fault, excluding the northern area), and the southern part (the area south of the Noble Dome Fault) of the Langford Basin (fig. 9). Samples collected prior to 1993 represent predevelopment conditions, and samples collected after 1993 represent post-development conditions.
Chemical Character of Groundwater
Groundwater samples from wells in the northern and central parts of the Langford Basin are sodium-bicarbonate-sulfate (NaHCO3-SO4) type waters, with the exception of wells 13N/3E-24N1, 13N/3E-26K2, and 13N/3E-35A1 (figs. 8 and 9). A NaHCO3-SO4 type water is a water in which Na, HCO3, and SO4 are the predominant ions. The wells with NaHCO3-SO4 type water are perforated in the Quaternary older alluvium and Tertiary younger sedimentary deposits (fig. 3) and have TDS concentrations ranging from 410 to 644 mg/L (fig. 8). The sample from Garlic Spring (13N/3E-11NS1), north of the basin, is also a NaHCO3-SO4 type water (figs. 8 and 9A). Well 13N/3E-24N1 is perforated in the Quaternary playa deposits beneath Langford Well Lake (dry) playa, and the well yields a sodium-chloride (NaCl) type water with a TDS concentra-tion of 3,220 mg/L—the highest concentration in the basin (figs. 3C, 8, and 9A). Well 13N/3E-26K2 is perforated in the Tertiary older sedimentary deposits in the central part of the basin, and the well yields a sodium-sulfate (NaSO4) type water with a TDS concentration of 596 mg/L (figs. 3B, 8, and 9B). The chemistry of well 13N/3E-35A1 and changes over time are discussed later in this section.
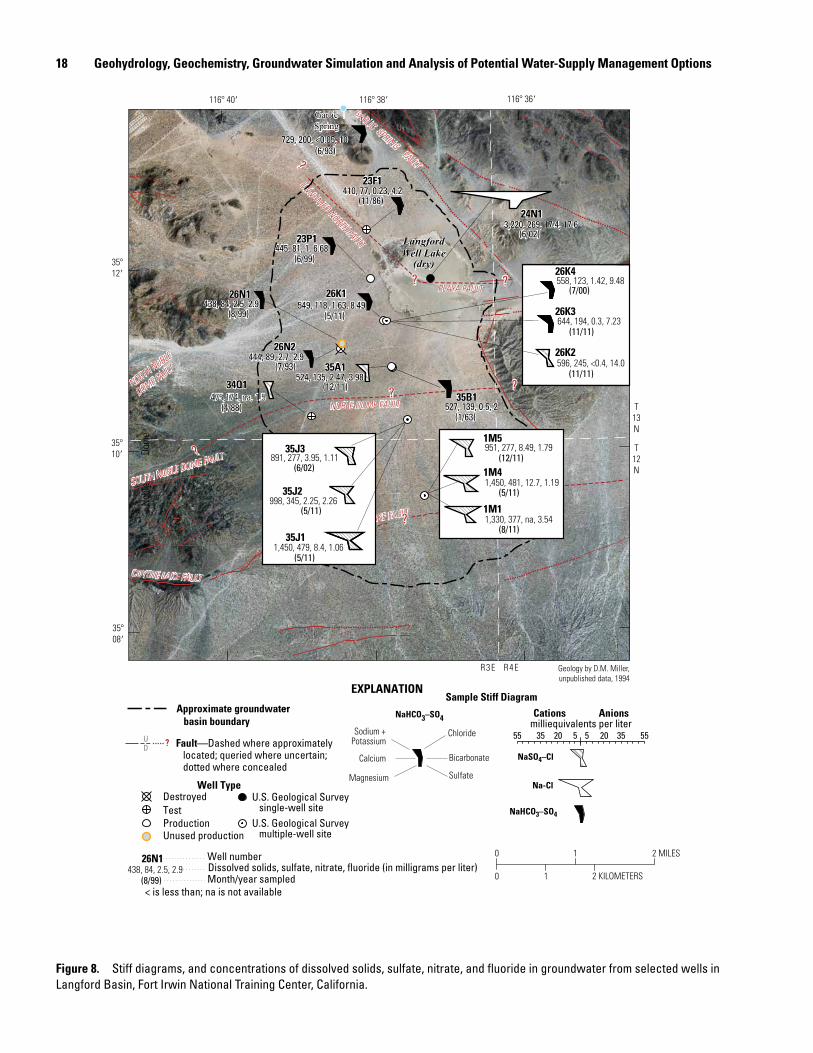
18 Geohydrology, Geochemistry, Groundwater Simulation and Analysis of Potential Water-Supply Management Options
UNNAMED NORTH FAULT
PLAYA FAULT
NOBLE DOME FAULT
COYOTE LAKE FAULT
?
COYOTE LAKE FAULT
NORTH NOBLE
DOME FAULT
GARLIC SPRING FAULT
?
??
?
?
?
?
?
SOUTH NOBLE DOME FAULT
Approximate groundwater basin boundary
Destroyed
ProductionUnused production
Test
Well Type
EXPLANATION
438, 84, 2.5, 2.9(8/99)
26N1 Well number
Month/year sampled< is less than; na is not available
Dissolved solids, sulfate, nitrate, fluoride (in milligrams per liter)
Sample Stiff Diagram
NaHCO3–SO4
NaHCO3–SO4
NaSO4–Cl
Na-Cl
Bicarbonate
Chloride
SulfateMagnesium
Sodium +Potassium
Calcium
Fault—Dashed where approximately located; queried where uncertain; dotted where concealed
Cationsmilliequivalents per liter
Anions
55 35 20 5 5 20 35 55
Geology by D.M. Miller,unpublished data, 1994
1 2 KILOMETERS
1 2 MILES
0
0
R3E R4E
T13N
T12N
Nob
leDo
me
UD
U
D
UD
U.S. Geological Survey single-well siteU.S. Geological Survey multiple-well site
GarlicSpring
?UD
LangfordWell Lake
(dry)
891, 277, 3.95, 1.11
998, 345, 2.25, 2.26
1,450, 479, 8.4, 1.06
(6/02)
951, 277, 8.49, 1.79(12/11)
(5/11)
(5/11)
35J31M5
1,450, 481, 12.7, 1.19(5/11)
1M4
1,330, 377, na, 3.54(8/11)
1M1
35J2
35J1
558, 123, 1.42, 9.48
644, 194, 0.3, 7.23
596, 245, <0.4, 14.0
(7/00)
(11/11)
(11/11)
26K2
26K3
26K4
524, 135, 2.47, 3.98
475,174, na, 1.5
3,220, 269, 17.4, 17.6
410, 77, 0.23, 4.2
445, 81, 1, 6.68(6/02)
(11/86)
729, 200, <0.05, 10(6/93)
(6/99)
(5/11)
(12/11)
(4/88)
23F1
23P1
438, 84, 2.5, 2.9 (8/99)
26N1
444, 89, 2.7, 2.9(7/93)
26N2
34Q1
35A1
24N1
549, 118, 1.63, 8.4926K1
527, 139, 0.5, 2(1/63)
35B1
Figure 8. Stiff diagrams, and concentrations of dissolved solids, sulfate, nitrate, and fluoride in groundwater from selected wells in Langford Basin, Fort Irwin National Training Center, California.

Groundwater Quality 19
Percent of total milliequivalents per liter
Su
lfate
(SO 4)
+ C
hlor
ide
(Cl)
Calcium (Ca) + M
agnesium (M
g)
Carb
onat
e (C
O 3) +
Bica
rbon
ate
(HCO
3)Sodium (Na) + Potassium
(K)EXPLANATION
80
80
60
40
20
20
40
60
80
60
40
20
20
40
60
80
Percent of total milliequivalents per liter
Sulfa
te (S
O 4) +
Chl
orid
e (C
l)
Calcium (Ca) + M
agnesium (M
g)
Ca
rbon
ate
(CO 3)
+ Bi
carb
onat
e (H
CO3)Sodium
(Na) + Potassium (K)
80
80
60
40
20
20
40
60
80
60
40
20
20
40
60
80
13N/3E-23P1 (Qoa and Tyg)13N/3E-26K1 (Qoa and Tyg)13N/3E-26N1 (Qoa)13N/3E-26N2 (Qoa)13N/3E-35A1 (Qoa and Tyg)13N/3E-35B1 (Qoa and Tyg)
13N/3E-23P1 (Qoa and Tyg)13N/3E-26K1 (Qoa and Tyg)13N/3E-26K2 LL1 at 780 feet (Tog)13N/3E-26K3 LL1 at 420 feet (Tyg)13N/3E-26K4 LL1 at 210 feet (Qoa)13N/3E-26N1 (Qoa)13N/3E-35A1 (Qoa and Tyg)
Collected 1955–93
Northern part of basinA Langford wells and Garlic Spring B Langford wells
Central part of basin
EXPLANATIONCollected 1955–93
Collected after 1993
13N/3E-23F1 (Qoa, Tyg, and Tog)
Collected after 1993
13N/3E-11NS1 Garlic Spring
13N/3E-24N1 (Qp)
Location of wells shown on figure 2
Figure 9. Trilinear diagrams of groundwater from selected wells in A, the northern part; B, the central part; and C, the southern part of Langford Basin, Fort Irwin National Training Center, California.

20 Geohydrology, Geochemistry, Groundwater Simulation and Analysis of Potential Water-Supply Management Options
Groundwater samples from wells in the southern part of the basin (13N/3E-34Q1, 13N/3E-35J1, 13N/3E-35J2, 13N/3E-35J3, 12N/3E-1M1, 12N/3E-1M4, and 12N/3E-1M5) are sodium-sulfate-chloride to sodium-chloride-sulfate (NaSO4–Cl to NaCl-SO4) type waters with TDS concentrations ranging from 475 to 1,450 mg/L (figs. 8 and 9C). Wells 13N/3E-34Q1, 13N/3E-35J3, and 12N/3E-1M5 are perforated in the Ter-tiary younger sedimentary deposits and wells 13N/3E-35J2, 13N/3E-35J1, 12N/3E-1M1, and 12N/3E-1M4 are perforated
in the Tertiary older sedimentary deposits (fig. 3). The TDS concentrations are higher and the cation-anion proportions more uniform in most wells perforated in the Tertiary older sedimentary deposits than in the Tertiary younger sedimentary deposits (figs. 8 and 9C).
Since groundwater withdrawals began in 1992, water-qual-ity samples from long-screened production well 13N/3E-35A1 have become enriched in SO4 and Cl and depleted in HCO3, shifting from NaHCO3-SO4 type water prior to 1993 to NaSO4-Cl type water in 1999. During this period, ground-water withdrawals from well 13N/3E-35A1 have caused a groundwater-level depression surrounding the well, which has reversed the direction of groundwater flow north of the well and increased the groundwater-level gradient south of the well (fig. 7). Groundwater withdrawals also have created an upward hydraulic gradient between the lower (Tertiary older sedi-mentary deposits) and middle (Tertiary younger sedimentary) aquifers in the central part of the basin (appendix fig. A1-1). The change in water type in well 13N/3E-35A1 could be the result of groundwater withdrawals from the well, causing groundwater with enriched concentrations of chloride and sul-fate to migrate from (1) the Quaternary playa deposits beneath Langford Well Lake (dry) playa, about 1 mi to the northeast; or (2) the Tertiary older sedimentary deposits that underlie the central part of the basin and are present south of the Noble Dome Fault at the same altitude as the perforated interval of well 13N/3E-35A1, about 2,000 ft south of the well (fig. 3).
The relation between concentrations of chloride and sul-fate was used to help determine the source of the increased concentrations of chloride and sulfate observed at well 13N/3E-35A1 (fig. 10). Samples from the central and north-ern part of the basin with NaHCO3-SO4 type water (referred to in this report as native groundwater) have low concentra-tions of chloride and sulfate and plot on the lower left part of the graph (fig. 10). The sample from well 13N/3E-24N1, perforated in the Quaternary playa deposits beneath Langford Well Lake (dry) playa, is a NaCl type water and plots in the upper part of the graph. Samples from wells 12N/3E-1M1, 12N/3E-1M4, 13N/3E-35J1, and 13N/3E-35J2, perforated in the Tertiary older sedimentary deposits in the southern part of the basin and well 13N/3E-26K2, perforated in the Tertiary older sedimentary deposits in the central part of the basin are all NaSO4-Cl type water and plot along the lower right part of the graph. Mixing lines were plotted between native groundwater and NaCl type water sampled from well 13N/3E-24N1 and NaSO4-Cl type water sampled from well 12N/3E-1M4 (fig. 10). Groundwater sampled from well 13N/3E-35A1 in 1999 falls on the mixing line between native groundwater and well 12N/3E-1M4 in the southern part of the basin, indicating the change in quality in well 13N/3E-35A1 is the result of mixing with a NaSO4-Cl type water from the Tertiary older sedimentary deposits that underlie and lie to the south of the well rather than mixing with the NaCl type water present in the playa deposits in the northeastern part of the basin (fig. 10). Fluoride concentrations in samples from well 13N/3E-35J1 were lower and NO3-N concentrations
Percent of total milliequivalents per liter
Su
lfate
(SO 4)
+ C
hlor
ide
(Cl)
Calcium (Ca) + M
agnesium (M
g)
Carb
onat
e (C
O 3) +
Bica
rbon
ate
(HCO
3)Sodium (Na) + Potassium
(K)
80
80
60
40
20
20
40
60
80
60
40
20
20
40
60
80
13N/3E-34Q1 (Tyg)
13N/3E-35J1 (Tog)
12N/3E-1M1 (Tog)
12N/3E-1M4 (Tog)
12N/3E-1M5 (Tyg)13N/3E-35J2 (Tog)
13N/3E-35J3 (Tyg)
Collected after 1993
Langford wellsSouthern part of basin
C
EXPLANATION
Figure 9. Trilinear diagrams of groundwater from selected wells in A, the northern part; B, the central part; and C, the southern part of Langford Basin, Fort Irwin National Training Center, California.—Continued

Groundwater Quality 21
were higher than in the samples from well 13N/3E-35A1, but fluoride concentrations in the samples from well 13N/3E-26K2 were higher and NO3-N concentrations were lower than in the samples from well 13N/3E-35A1 (fig. 8; appendix 2). The observed reduction in fluoride concentration and increase in NO3-N concentration in samples from well 13N/3E-35A1 imply that mixing of water from this well with water from the Tertiary older deposits in the southern part of the basin is the major source of water contributing to the change in water quality in samples from the well. Depth-dependent water-qual-ity data are needed from well 13N/3E-35A1 and (or) a nearby multiple-well monitoring site to more definitively determine the source of the change in water quality observed in samples from the well.
Specific Constituents of Interest
TDS, sulfate (SO4), nitrate (NO3), and fluoride (F) are of interest in the Langford Basin because concentrations of these constituents in samples from some wells exceed State
or Federal recommended or mandatory regulatory standards for drinking water. The concentrations of these constituents are presented in appendix 2, and their areal distribution for selected samples is presented on figure 8.
TDS concentrations in the samples ranged from 394 to 3,220 mg/L (fig. 8; appendix 2). Samples from Garlic Spring and 14 of the 18 wells sampled contained TDS concentra-tions in excess of the U.S. Environmental Protection Agency (USEPA) Secondary Maximum Contaminant Level (SMCL) of 500 mg/L for TDS (U.S. Environmental Protection Agency, 2002). SMCLs were established only as guidelines to assist public water systems in managing their drinking water for aesthetic considerations, such as taste, color, and odor. These contaminants are not considered to present a risk to human health at the SMCL. The highest TDS concentration was in a sample from well 13N/3E-24N1, on the Langford Well Lake (dry) playa (fig. 8). With the exception of the sample from well 13N/3E-24N1, the TDS concentrations in samples col-lected from wells north of the Noble Dome Fault were less than 650 mg/L. TDS concentrations in samples from wells
Figure 10. Relation between concentrations of chloride and sulfate in groundwater samples from wells in Langford Basin, Fort Irwin National Training Center, California.
1,400
1,200
24N1(NaCl)
800
1,000
600
200
40035J1
1M4
35A1 pre-93
1M1
1M5
NativegroundwaterNaHCO3-SO4
0600
35J2
35J326K2
26K1
35A126K1 pre-93
Sulfate, in milligrams per liter
Chlo
ride,
in m
illig
ram
s pe
r lite
r
0 100 200 300 400 500
(NaSO4-Cl)
Native
grou
ndwat
er-2
4N1
mixing
line
Native groundwater-1M4
mixing line
Langford Basin wells
24N126K1
26K226K326K4
1M11M41M5
All other wells26N126N2
35A135J135J235J3
EXPLANATIONLocation of wells shown on figure 2

22 Geohydrology, Geochemistry, Groundwater Simulation and Analysis of Potential Water-Supply Management Options
south of the Noble Dome Fault were higher than samples collected north of the fault. All concentrations exceeded 890 mg/L except the concentration in the sample from well 13N/3E-34Q1, which had a concentration of 475 mg/L (fig. 8).
SO4 concentrations in the samples ranged from 77 to 481 mg/L (fig. 8; appendix 2). Samples from 7 of the 18 wells sampled contained SO4 concentrations in excess of the SMCL of 250 mg/L for SO4 (U.S. Environmental Protection Agency, 2002). The highest concentration was in a sample from well 12N/3E-1M4, which is perforated in Tertiary older sedimen-tary deposits south of the Noble Dome Fault (figs. 3B and 8). In general, samples from wells perforated in the Tertiary older sedimentary deposits and the playa deposits have SO4 concen-trations in excess of the SMCL of 250 mg/L (fig. 3).
NO3 concentrations in samples, measured as NO3 plus nitrite (NO2), ranged from 0.23 to 17.4 mg/L as nitrogen (N) (fig. 8; appendix 2). Because concentrations of NO2 are negligible, NO2 plus NO3-N and NO3-N are considered equivalent and are referred to in this report as NO3-N. Samples from 2 of the 18 wells sampled contained concentrations of NO3-N in excess of the USEPA Maximum Contaminant Level (MCL) of 10 mg/L (U.S. Environmental Protection Agency, 2002). MCLs are enforceable standards that were established to protect the public against consumption of drinking-water contaminants that present a risk to human health. An MCL is the maximum allowable amount of a contaminant in drinking water that is delivered to the consumer. The highest concentra-tions of NO3-N were measured in samples from well 13N/3E-24N1, perforated in the playa deposits, and well 12N/3E-1M4, perforated in the Tertiary older sedimentary deposits (figs. 3 and 8). These wells also had high concentrations of TDS. Therefore, the high concentrations of NO3-N in samples from this well can be explained, in part, by past evaporative con-centration NO3 in shallow groundwater. The source of NO3 in the Langford Basin is probably naturally occurring N in desert soils. Densmore and Bohlke (2000) measured concentrations as high as 3,374 milligrams per kilogram along the eastern edge of the Bicycle Lake in nearby Bicycle Basin, which they attributed to natural soil NO3 on the basis of N isotope analy-ses. Additionally, N-bearing rocks and sediments are present in some deposits in the area, primarily the clay/shale units of the nearby Barstow Formation (Noble and Mansfield, 1922; Byers, 1960).
Concentrations of F in samples collected from wells for this study ranged from 0.91 to 17.6 mg/L (fig. 8; appendix 2). The highest concentration was from monitor well 13N/3E-24N1, which is in the Langford Well Lake (dry) playa. Concentra-tions also were generally higher in the northern part of the basin than in the southern part of the basin. Garlic Spring and 8 of the 18 wells sampled for F contained concentra-tions in excess of the MCL of 4 mg/L set by the USEPA for F (U.S. Environmental Protection Agency, 2005 (appendix 2). F is found naturally within many types of rock (Hem, 1992), and its presence in the Langford Basin is from the weather-ing and dissolution of minerals that contain F in the basin. Additionally, the concentration of F in groundwater largely is
dependent on the reaction time with aquifer materials. High concentrations of F can be built up in groundwater that has a long residence time (Brunt and others, 2004).
Trace Elements
Trace elements are generally present in small concentra-tions in natural water systems. Although trace elements are essential nutrients, certain trace elements such as arsenic (As), chromium, and uranium are common environmental contami-nants and are known to be toxic in drinking water. Their pres-ence in groundwater and surface water can be due to natural sources, such as dissolution of naturally occurring minerals containing trace elements in the geologic deposits, or due to human activities such as mining, burning of fossil fuels, and improper disposal of industrial wastes. Of the trace elements analyzed for this study, only concentrations of As exceeded the USEPA MCLs (appendix 2).
Concentrations of As in samples collected from wells for this study ranged from 2.4 to 39.4 µg/L (appendix 2). Gar-lic Spring and 5 of the 17 wells sampled for As contained concentrations in excess of the MCL of 10 µg/L set by the USEPA for As (U.S. Environmental Protection Agency, 2005) (appendix 2). None of the water samples from the production wells exceeded the MCL for As. Similar to F, the highest con-centration of As was from monitor well 13N/3E-24N1, which is in the Langford Well Lake (dry) playa. The high concentra-tions of As in samples from this well may be explained by past evaporative concentrations of As in shallow groundwater. As previously described, the sample from well 13N/3E-24N1 also contained the highest concentrations of TDS and NO3. As does not appear to partition into evaporite minerals until a very high salinity is attained, which can result in concentrations of As in excess of 100 mg/L (100,000 µg/L) in shallow groundwater affected by evaporative processes at discharge areas (Levy and others, 1999).
Concentrations of As exceeded 25 µg/L in samples from monitor wells 12N/3E-1M5 and 13N/3E-35J3, relatively shallow wells south of the Noble Dome Fault (appendix 2). Samples from both wells were collected near the top of the water table and had pH values greater than 8 (alkaline) and dissolved-oxygen concentrations in excess of 1.9 mg/L (oxic conditions) (appendix 2). Although the reactions take place slowly, weathering of primary silicate minerals in aquifer materials derived from relatively nonreactive granitic or metamorphic rocks may increase groundwater pH (Nishikawa and others, 2005). As pH increases to values greater than 8, As sorbed on mineral grains may come into solution in oxic aqui-fers (Welch and others, 2000; Nishikawa and others, 2005). This mechanism has been cited as the cause of concentrations of As exceeding MCLs in other alluvial aquifers in the western United States (Welch and others, 2000; Nishikawa and others, 2005). Concentrations may also be affected by high concentra-tions of As from the Tertiary deposits as was observed in the sample from 13N/3E-26K2.

Groundwater Quality 23
Source and Age of Groundwater
Samples were analyzed for the stable isotopes of oxygen (18O) and hydrogen (2H, or deuterium, D) to determine the source of water to wells and to evaluate the movement of water through the study area. Selected samples were analyzed for the radioactive isotopes of hydrogen (tritium, 3H), and car-bon (14C) to determine the age, or time since recharge, of the groundwater. A total of 24 water samples were collected from 2 multiple-well monitoring sites, 1 single-well monitoring site, 5 existing wells, and 1 spring (appendix 2).
Stable Isotopes of Oxygen and HydrogenOxygen-18 and deuterium are natural stable isotopes of
oxygen and hydrogen, respectively, that were used in this study to help identify the source and hydrologic history of groundwater in the Langford Basin. These isotopic ratios are expressed in delta notation (δ) as per mil (parts per thousand or ‰) differences, relative to the standard known as Vienna Standard Mean Ocean Water (VSMOW) (Gonfiantini, 1978). The linear relation between δ18O and δD in natural precipi-tation throughout the world (Craig, 1961) is referred to as the Global Meteoric Water Line (fig. 11). Differences in the isotopic composition of precipitation take place along this line in response to trends with latitude and with the tempera-ture of condensation (Fournier and Thompson, 1980). More negative values (depletion in the heavier isotope relative to the lighter isotope) result when condensation takes place at colder temperatures and higher altitudes. Water that has been partly evaporated is enriched in heavier isotopes relative to its original composition; these values plot to the right of the meteoric water line (for δD as the vertical axis and δ18O as the horizontal axis). There is no further change in isotopic composition at the low temperatures of most groundwater systems after recharged water has migrated below the depth of evaporation. Therefore, any subsequent differences in the iso-topic composition of groundwater along a flow line generally reflect only mixing within the aquifer system or concentration by evaporation in a discharge area. The δ18O and δD composi-tion of groundwater, relative to the meteoric water line, and the isotopic composition of water from other sources can be an indicator of the source of groundwater.
The isotopic compositions of groundwater from wells in the Langford Basin ranged from –10.44 to –12.39 ‰ δ18O and –89.7 to –97.6 ‰ δD (fig. 11; appendix 2). The isotope values from all samples collected from Langford Basin fall below the Global Meteoric Water Line, indicating possible evaporation at land surface prior to recharge, partial evaporation of falling raindrops in an arid atmosphere, or a “local” meteoric water line that differs slightly from the Global Meteoric Water Line. Volume-weighted samples of local precipitation at Daggett (Friedman and others, 1992), near Barstow and at about 2,000 ft altitude (similar to Langford Basin), also fall below the Global Meteoric Water Line but are isotopically heavier than groundwater samples from Langford Basin (fig. 11). Isotope
values from groundwater samples in Indian Wells Valley, west of this study area and not shown on figure 1, also plot along a line that is nearly parallel to and below the Meteoric Water Line (Berenbrock and Schroeder, 1994), suggesting the isoto-pic values in the area fall along a local Global Meteoric Water Line that is about 5 to 10 ‰ (on the δD axis) below the Global Meteoric Water Line (fig. 11).
The isotope values from the Langford Basin plot near samples unaffected by evaporation in the Irwin Basin, indi-cating the source of recharge to these basins was similar. Groundwater from wells near the wastewater-treatment facility and the base housing in the Irwin Basin has been evaporated and lies on the evaporative line (Densmore and Londquist, 1997). These groundwater samples are isotopically heavier than water from other wells in the Irwin and Langford Basins (fig. 11). Groundwater from wells 13N/3E-35J1, 13N/3E-35J2, 13N/3E-35J3, 12N/3E-1M1, and 12N/3E-1M4 in the south-ern part of the Langford Basin plot below and slightly to the right relative to water from the other wells in the northern and western parts of Langford Basin, indicating groundwater from these wells was recharged from a slightly different source or was evaporated prior to recharge. Recharge to this part of the basin most likely was from storms and surface runoff from storms that originated from the Alvord Mountain area, to the south of the study area (fig. 1). Because the δD of water samples in the Langford Basin is more than 20 ‰ lighter (more negative) than local winter precipitation at Daggett (fig. 11), the groundwater probably was not recharged under present-day climatic conditions. In addition to the difference in isotopic concentration, the relative age of the water supports this hypothesis. As described in the “Tritium and Carbon-14” section of this report, recharge to the area dates to near the end of the last North American glaciation (Byers, 1960; Pagnac and Reynolds, 2006) when it likely was colder and (or) wet-ter in the study area, which would cause isotope ratios to be lighter (more negative) than in postglacial (younger) water.
Tritium and Carbon-14Tritium is a natural radioactive isotope of hydrogen that has
a half-life of 12.4 years. The concentration of 3H is reported in picocuries per liter (pCi/L) and tritium units (TU) in the appendix but is discussed in TU in this section. Approximately 800 kilograms of 3H were released into the atmosphere as a result of the atmospheric testing of nuclear weapons between 1952 and 1962 (Michel, 1976). As a result, 3H concentrations in precipitation and groundwater recharge increased during that time. Concentrations of 3H are not affected substantially by chemical reactions other than radioactive decay because 3H is part of the water molecule. Therefore, 3H is an excellent tracer of the movement and relative age of water on timescales ranging from recent to about 60 years before present (post 1952). In this report, groundwater that has measurable 3H concentrations (greater than 0.2 TU) is interpreted to be water recharged after 1952, or recent recharge.

24 Geohydrology, Geochemistry, Groundwater Simulation and Analysis of Potential Water-Supply Management Options
Carbon-14 is a natural radioactive isotope of carbon that has a half-life of about 5,730 years (Mook, 1980). Carbon-14 data are expressed as percent modern carbon (pmc) by com-paring 14C activities to the specific activity of National Bureau of Standards oxalic acid: 13.56 disintegrations per minute per gram of carbon in the year 1950 equals 100 pmc (Kalin, 2000). Carbon-14 was produced, as was 3H, by the atmo-spheric testing of nuclear weapons (Mook, 1980). As a result, 14C activities may exceed 100 pmc in areas where groundwater contains 3H. Carbon-14 activities are used to determine the age of a groundwater sample on timescales ranging from recent to more than 20,000 years before present. Carbon-14 is not part of the water molecule and, therefore, 14C activities may be affected by chemical reactions that remove or add carbon to the water. In addition, 14C activities are affected by mix-ing younger water that has high 14C activity with older water that has low 14C activity. In this discussion, young water is considered to be recent water as described above. Carbon-14 ages presented in this report do not account for changes in 14C activity resulting from chemical reactions or mixing and,
therefore, are considered uncorrected ages. In general, uncor-rected 14C ages are older than the actual age of the associated water. Izbicki and others (1995) estimated that uncorrected 14C ages were as much as 30 percent older than the actual ages of groundwater in the regional aquifer in the Mojave River groundwater basin near Victorville, California (not shown), about 60 mi southwest of the study area.
No measurable concentrations of 3H were present in groundwater samples from 11 wells in Langford Basin (fig. 12). The lack of 3H in samples from Langford Basin indicates the groundwater was recharged prior to 1952. Measured 14C activities for water from six wells in Langford Basin ranged from 2.6 to 21.9 pmc (fig. 12). It should be noted that the sample from well 12N/3E-1M1, a deep well perfo-rated in fine-grained sediment, had a 14C activity of 53.5 pmc (appendix 2). This well was not thoroughly developed because it has a low hydraulic conductivity and did not produce much water; thus, it is believed that this sample reflects the age of the water mixed with the drilling mud and not the true age of the groundwater from the deep aquifer in which the well
Figure 11. Stable-isotope concentrations in groundwater from selected wells in Langford Basin, Fort Irwin National Training Center, California.
-105
-100
-95
-90
-85
-80
-75
-70
-65
Delta Oxygen-18, in per mil
Delta
deu
teriu
m, i
n pe
r mil
Water recharged from the south
Water recharged fromthe north
-7-14 -13 -12 -10 -9 -8-11
Global Meteoric Water Line (Craig, 1961)
Irwin Basin wellsGarlic Spring
Langford Basin wells
23P124N126K1
26K226K326K4
1M11M41M5
26N126N2
35A135J135J235J3
EXPLANATION
Weighted-average precipitation at Daggett
Weighted-average desert winter precipitation at Daggett
Evaporativetrend line
Wells referred to in the text are numbered on this figure

Groundwater Quality 25
Figure 12. Tritium and carbon-14 activities in groundwater from selected wells in Langford Basin, Fort Irwin National Training Center, California.
UNNAMED NORTH FAULT
PLAYA FAULT
NOBLE DOME FAULT
COYOTE LAKE FAULT
?
COYOTE LAKE FAULT
NORTH NOBLE
DOME FAULT
GARLIC SPRING FAULT
?
??
?
?
?
?
?
SOUTH NOBLE DOME FAULT
23F1-/-
23P1<0.2/3.1
26N1<0.2/21.9
26N2-/-
26K1-/-
26K3<0.2/2.6
26K4<0.2/4.6
26K2<0.2/8.0
14K1-/-
34Q1-/-
35J3-/-
1M40/-
35B1-/-
35A1<0.2/10.5
24N1-/-
26N2 23P1
34Q1 26N1
1M4
<0.2/5.07
<0.2/21.94
Well and number—First number is tritium, in tritium units; second number is the carbon-14 activity, in percent modern carbon; -/- indicates no data; < is less than
-/-
0/-
-/-
Destroyed
Test
Production
Unused production
U.S. Geological Survey
Approximate groundwater basin boundary
EXPLANATION
Fault—Dashed where approximately located; queried where uncertain; dotted where concealed
Geology by D.M. Miller,unpublished data, 1994
1 2 KILOMETERS
1 2 MILES
0
0 R3E R4E
T13N
T12N
Nob
leDo
me
UD
U
D
UD
LangfordWell Lake
(dry)
?UD
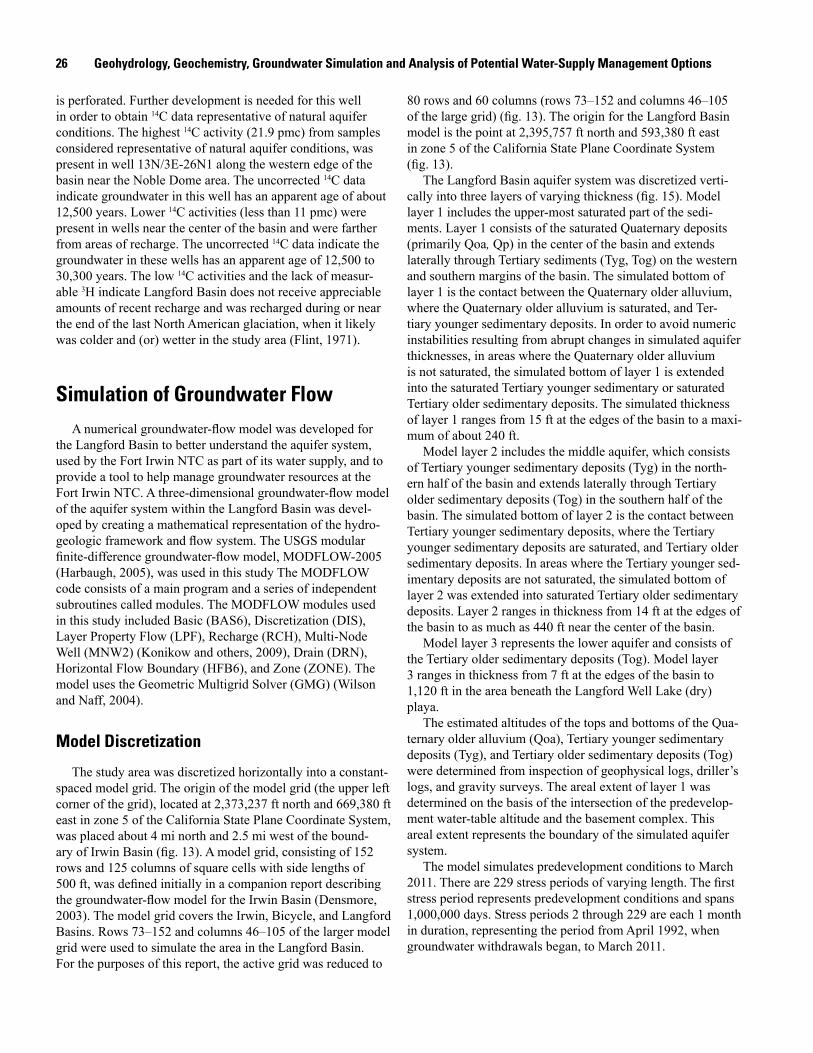
26 Geohydrology, Geochemistry, Groundwater Simulation and Analysis of Potential Water-Supply Management Options
is perforated. Further development is needed for this well in order to obtain 14C data representative of natural aquifer conditions. The highest 14C activity (21.9 pmc) from samples considered representative of natural aquifer conditions, was present in well 13N/3E-26N1 along the western edge of the basin near the Noble Dome area. The uncorrected 14C data indicate groundwater in this well has an apparent age of about 12,500 years. Lower 14C activities (less than 11 pmc) were present in wells near the center of the basin and were farther from areas of recharge. The uncorrected 14C data indicate the groundwater in these wells has an apparent age of 12,500 to 30,300 years. The low 14C activities and the lack of measur-able 3H indicate Langford Basin does not receive appreciable amounts of recent recharge and was recharged during or near the end of the last North American glaciation, when it likely was colder and (or) wetter in the study area (Flint, 1971).
Simulation of Groundwater FlowA numerical groundwater-flow model was developed for
the Langford Basin to better understand the aquifer system, used by the Fort Irwin NTC as part of its water supply, and to provide a tool to help manage groundwater resources at the Fort Irwin NTC. A three-dimensional groundwater-flow model of the aquifer system within the Langford Basin was devel-oped by creating a mathematical representation of the hydro-geologic framework and flow system. The USGS modular finite-difference groundwater-flow model, MODFLOW-2005 (Harbaugh, 2005), was used in this study The MODFLOW code consists of a main program and a series of independent subroutines called modules. The MODFLOW modules used in this study included Basic (BAS6), Discretization (DIS), Layer Property Flow (LPF), Recharge (RCH), Multi-Node Well (MNW2) (Konikow and others, 2009), Drain (DRN), Horizontal Flow Boundary (HFB6), and Zone (ZONE). The model uses the Geometric Multigrid Solver (GMG) (Wilson and Naff, 2004).
Model Discretization
The study area was discretized horizontally into a constant-spaced model grid. The origin of the model grid (the upper left corner of the grid), located at 2,373,237 ft north and 669,380 ft east in zone 5 of the California State Plane Coordinate System, was placed about 4 mi north and 2.5 mi west of the bound-ary of Irwin Basin (fig. 13). A model grid, consisting of 152 rows and 125 columns of square cells with side lengths of 500 ft, was defined initially in a companion report describing the groundwater-flow model for the Irwin Basin (Densmore, 2003). The model grid covers the Irwin, Bicycle, and Langford Basins. Rows 73–152 and columns 46–105 of the larger model grid were used to simulate the area in the Langford Basin. For the purposes of this report, the active grid was reduced to
80 rows and 60 columns (rows 73–152 and columns 46–105 of the large grid) (fig. 13). The origin for the Langford Basin model is the point at 2,395,757 ft north and 593,380 ft east in zone 5 of the California State Plane Coordinate System (fig. 13).
The Langford Basin aquifer system was discretized verti-cally into three layers of varying thickness (fig. 15). Model layer 1 includes the upper-most saturated part of the sedi-ments. Layer 1 consists of the saturated Quaternary deposits (primarily Qoa, Qp) in the center of the basin and extends laterally through Tertiary sediments (Tyg, Tog) on the western and southern margins of the basin. The simulated bottom of layer 1 is the contact between the Quaternary older alluvium, where the Quaternary older alluvium is saturated, and Ter-tiary younger sedimentary deposits. In order to avoid numeric instabilities resulting from abrupt changes in simulated aquifer thicknesses, in areas where the Quaternary older alluvium is not saturated, the simulated bottom of layer 1 is extended into the saturated Tertiary younger sedimentary or saturated Tertiary older sedimentary deposits. The simulated thickness of layer 1 ranges from 15 ft at the edges of the basin to a maxi-mum of about 240 ft.
Model layer 2 includes the middle aquifer, which consists of Tertiary younger sedimentary deposits (Tyg) in the north-ern half of the basin and extends laterally through Tertiary older sedimentary deposits (Tog) in the southern half of the basin. The simulated bottom of layer 2 is the contact between Tertiary younger sedimentary deposits, where the Tertiary younger sedimentary deposits are saturated, and Tertiary older sedimentary deposits. In areas where the Tertiary younger sed-imentary deposits are not saturated, the simulated bottom of layer 2 was extended into saturated Tertiary older sedimentary deposits. Layer 2 ranges in thickness from 14 ft at the edges of the basin to as much as 440 ft near the center of the basin.
Model layer 3 represents the lower aquifer and consists of the Tertiary older sedimentary deposits (Tog). Model layer 3 ranges in thickness from 7 ft at the edges of the basin to 1,120 ft in the area beneath the Langford Well Lake (dry) playa.
The estimated altitudes of the tops and bottoms of the Qua-ternary older alluvium (Qoa), Tertiary younger sedimentary deposits (Tyg), and Tertiary older sedimentary deposits (Tog) were determined from inspection of geophysical logs, driller’s logs, and gravity surveys. The areal extent of layer 1 was determined on the basis of the intersection of the predevelop-ment water-table altitude and the basement complex. This areal extent represents the boundary of the simulated aquifer system.
The model simulates predevelopment conditions to March 2011. There are 229 stress periods of varying length. The first stress period represents predevelopment conditions and spans 1,000,000 days. Stress periods 2 through 229 are each 1 month in duration, representing the period from April 1992, when groundwater withdrawals began, to March 2011.

Simulation of Groundwater Flow 27
Model Boundaries
The boundaries of the Langford Basin groundwater-flow model (fig. 14) were determined by geohydrologic interpreta-tions and coincide with the boundary of the aquifer system. The top boundary of the model, the water table, is simulated as a free-surface boundary, which is allowed to move vertically in response to changes in inflow, outflow, and storage of water within the aquifer. No-flow boundaries are used around and below the modeled area to represent contact with the basement complex (fig. 4). The no-flow boundary indicates water is not exchanged between the model cell and the area outside the model.
A drain is used to simulate groundwater discharge in a highly fractured area east of the Langford Well Lake (dry) playa near the buried extension of Garlic Spring Fault (fig. 14). The drain is simulated in the model using the MOD-FLOW Drain module (Harbaugh, 2005). This module allows groundwater to discharge only when the water level (hydraulic head) in the aquifer is greater than the drain elevation. There is no flow into the drain when the water level in the model cell is less than the elevation of the drain. The elevation of the drain was estimated through model calibration at 2,109 ft above NAVD 88, but was constrained by land surface and bed-rock elevations (fig. 3C). The drain elevation was estimated
Figure 13. Local model grid of the Langford Basin and the regional mode grid of the Fort Irwin National Training Center, California.
1
80
1 60
0
25
250 50 75 100 125
36
80
50
75
100
125
150
ROW
C O L U M N
ROW
COLUMN10E3
0
0 4 KILOMETERS
4 MILES
Consolidated rocks
Unconsolidated deposits
Model cells
Extent of Langford model grid
Boundary of Langford Basin
Area of figures 2, 4, 6, 9, 11, 13, 15, 16, 17, 21 and 23
EXPLANATION
Compiled geology shown in Densmore, 2003
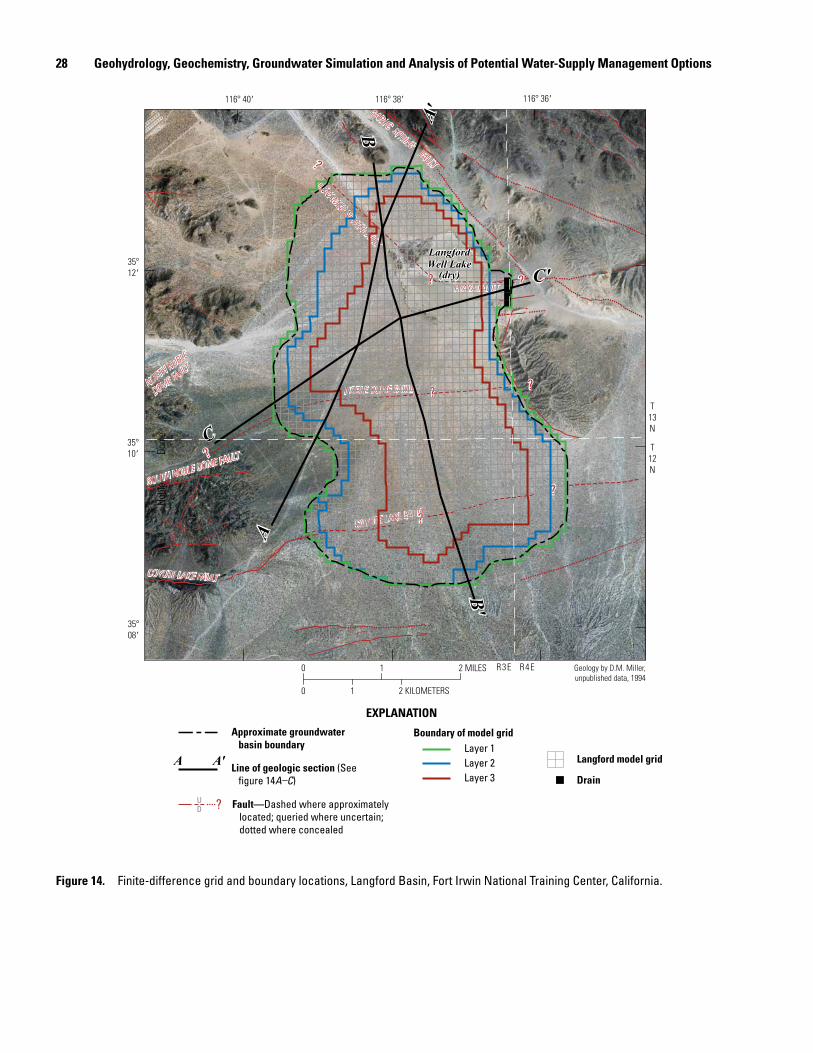
28 Geohydrology, Geochemistry, Groundwater Simulation and Analysis of Potential Water-Supply Management Options
Figure 14. Finite-difference grid and boundary locations, Langford Basin, Fort Irwin National Training Center, California.
UNNAMED NORTH FAULT
PLAYA FAULT
NOBLE DOME FAULT
COYOTE LAKE FAULT
?
COYOTE LAKE FAULT
NORTH NOBLE
DOME FAULT
GARLIC SPRING FAULT
?
??
?
?
?
?
?
SOUTH NOBLE DOME FAULT
Langford model gridLayer 1Layer 2Layer 3 Drain
Boundary of model grid
EXPLANATION
Line of geologic section (See figure 14A–C)
Approximate groundwater basin boundary
Fault—Dashed where approximately located; queried where uncertain; dotted where concealed
?
Geology by D.M. Miller,unpublished data, 1994
1 2 KILOMETERS
1 2 MILES
0
0 R3E R4E
T13N
T12N
Nob
leDo
me
UD
U
D
UD
A'A
B'
A
BC
C'
A'
UD
LangfordWell Lake
(dry)

Simulation of Groundwater Flow 29
Figure 15. Cross-sectional view A, A–A’; B, B–B’; and C, C–C’ of model layers and horizontal hydraulic conductivities in the Langford Basin, Fort Irwin National Training Center, California.
NOB
LE D
OME
FAUL
T
UNN
AMED
NOR
TH FA
ULT
GARL
IC S
PRIN
G FA
ULT
Lang
ford
Lak
e Ro
ad
??
A
QoaQoa
Qya
Bc
Bc
Bc
Sect
ion
C-C'
Sect
ion
B-B'
Kh1= 5.6Kh1= 5Kh1= 5
Kh1= 3
Kh2= 3
Kh2= 3
Kh2= 2.8
Layer 1
Layer 2
Layer 3
Kh3= 2
Kh3= 2
13N
/3E–
34Q1
- Be
nd in
sec
tion
13N
/3E–
26N
1 - B
end
in s
ectio
n13
N/3
E–26
N2
13N
/3E–
23P1
- Be
nd in
sec
tion
13N
/3E–
23F1
- Be
nd in
sec
tion
13N
/3E–
14K1
- Be
nd in
sec
tion
0
0 1 MILEDatum is NAVD 88
1 KILOMETER
Vertical exaggeration 15X
Qya
13N
/3E–
14K1
Water table (Estimated for 1992)
Horizontal hydraulic conductivity (K), in feet per day
??
Contact—Queried where uncertain
Upper aquifer
Fault—Queried where uncertain; arrowsindicate direction of apparent movement
Well and number—
Perforated interval
EXPLANATIONGeologyModel layers
Tyg
Tog
Basement complex
Fault name
Bc
Younger alluvium
Younger sedimentary deposits—Middle aquifer
Quaternary -
pre-Tertiary -
Tertiary -
Quaternary/Tertiary - Older alluvium
Older sedimentary deposits—Lower aquifer Tertiary -
QoaQoa
A'SOUTHWEST NORTHEAST
2,200
2,600
2,800
2,400
2,000
1,800
1,600
1,400
1,200
1,000
Altit
ude
FEET
A
Layer 1
Layer 2
Layer 3
QoaQoaTyg
Tyg Tyg
Tog
Tog
??????
???? ?
??
??
?? ?? ??
NOBLE DOME FAULT
Kh2= 3
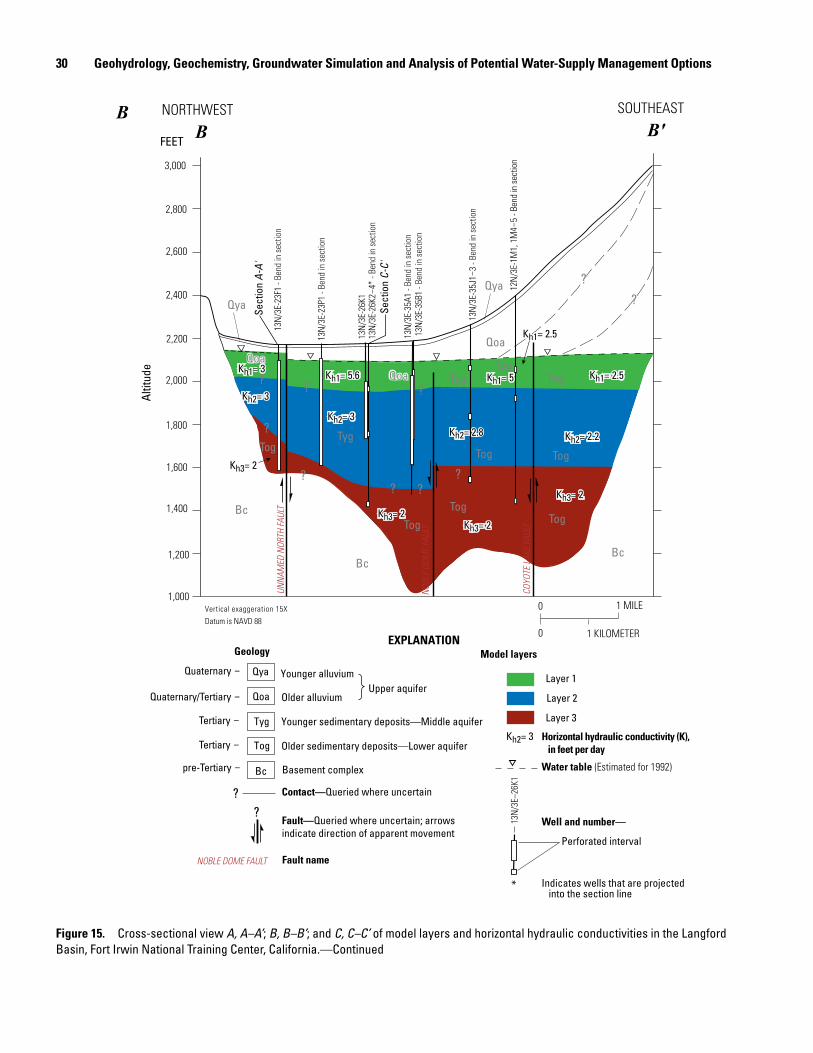
30 Geohydrology, Geochemistry, Groundwater Simulation and Analysis of Potential Water-Supply Management Options
Layer 1
Layer 2
Layer 3
Kh1= 5.6 Kh1= 5Kh1= 3
Kh2= 3
Kh2= 3
Kh2= 2.2Kh2= 2.8
Kh3= 2
Kh3= 2
Kh3= 2
Kh3= 2
Kh1= 2.5
Kh1= 2.5
NOB
LE D
OME
FAUL
T
COYO
TE L
AKE
FAUL
T
UNN
AMED
NOR
TH FA
ULT
13N
/3E-
35J1-
3 - B
end
in s
ectio
n
13N
/3E-
35B1
- Be
nd in
sec
tion
13N
/3E-
23P1
- Be
nd in
sec
tion
13N
/3E-
23F1
- Be
nd in
sec
tion
13N
/3E-
26K1
13N
/3E-
26K2
-4*
- Be
nd in
sec
tion
13N
/3E-
35A1
- Be
nd in
sec
tion
12N
/3E-
1M1,
1M
4-5
- Ben
d in
sec
tion
0
0 1 MILE
1 KILOMETER
Water table (Estimated for 1992)
??
Contact—Queried where uncertain
Fault—Queried where uncertain; arrowsindicate direction of apparent movement
EXPLANATIONGeology
Fault name
Younger alluviumQuaternary -
Quaternary/Tertiary - Older alluvium
Qya
Upper aquifer
Tyg
Tog
Basement complexBc
Younger sedimentary deposits—Middle aquifer
pre-Tertiary -
Tertiary -
Older sedimentary deposits—Lower aquifer Tertiary -
13N
/3E–
26K1
Well and number—
Perforated interval
Indicates wells that are projected into the section line
*
2,200
2,600
2,800
2,400
2,000
1,800
1,600
1,400
1,200
1,000
3,000
Altit
ude
BB
B'NORTHWEST SOUTHEAST
FEET
??
?
?
?? ?
?
?
?
Bc
Tyg
Tog TogTog
Qoa
Bc
Bc
Qya
TogTog
TogTygTyg
Qoa
Tog
Qoa
Qya Sect
ion
A-A'
Sect
ion
C-C'
Qoa
Model layers
Layer 1
Layer 2
Layer 3
Horizontal hydraulic conductivity (K), in feet per day
Datum is NAVD 88Vertical exaggeration 15X
Kh2= 3
NOBLE DOME FAULT
Figure 15. Cross-sectional view A, A–A’; B, B–B’; and C, C–C’ of model layers and horizontal hydraulic conductivities in the Langford Basin, Fort Irwin National Training Center, California.—Continued

Simulation of Groundwater Flow 31
Layer 2
Kh1= 5.6
Kh2= 3
Kh3= 2
Kh1= 5.6Kh1= 1.5
Kh1= 5
Layer 3
Layer 1
13N
/3E-
26K2
–413
N/3
E-26
K1
13N
/3E-
26N
113
N/3
E-26
N2–
Bend
in s
ectio
n
13N
/3E-
24N
1–Pr
ojec
ted
C
0
0 1 MILE
1 KILOMETER
600
QyeQp
13N
/3E-
26K2
–4
Water table (Estimated for 1992)
? Contact—Queried where uncertain
Upper aquifer
Well and number—Perforated interval
EXPLANATION
Qoa
Tyg
Tog
Basement complex
Younger alluvium
Younger sedimentary deposits—Middle aquifer
Quaternary –
pre-Tertiary –
Tertiary –
Quaternary/Tertiary – Older alluvium
Older sedimentary deposits—Lower aquifer Tertiary –
C'EAST
2,200
2,600
2,800
2,400
2,000
1,800
1,600
1,400
1,200
1,000
800
Altit
ude
CWEST
FEET
Sect
ion
A-A'
Sect
ion
B-B'
Bc
Bc
TogTog
Qoa
TygQye
Qp
Qoa
Tyg
Qya
Bc
Tyg
Bc
?
?
?
??
?
?
?
?
Model layersGeology
Layer 1
Layer 2
Layer 3
Horizontal hydraulic conductivity (K), in feet per day
Datum is NAVD 88Vertical exaggeration 15X
Fault
Kh2= 3
Figure 15. Cross-sectional view A, A–A’; B, B–B’; and C, C–C’ of model layers and horizontal hydraulic conductivities in the Langford Basin, Fort Irwin National Training Center, California.—Continued
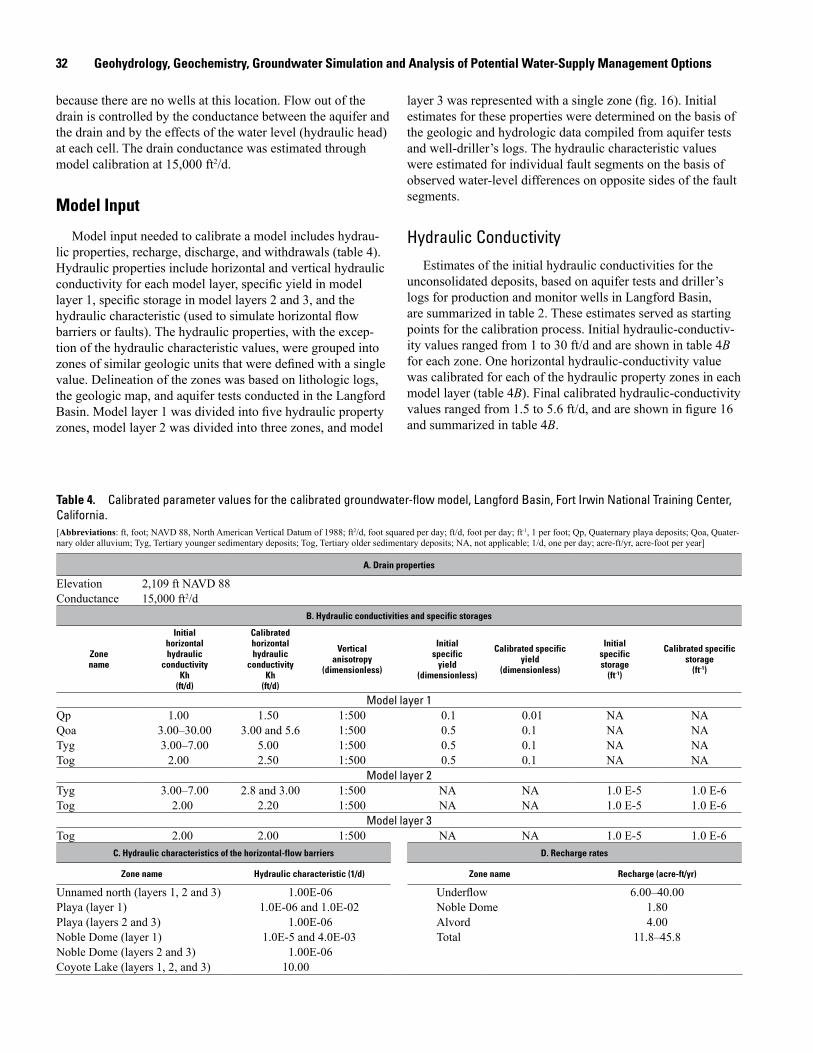
32 Geohydrology, Geochemistry, Groundwater Simulation and Analysis of Potential Water-Supply Management Options
because there are no wells at this location. Flow out of the drain is controlled by the conductance between the aquifer and the drain and by the effects of the water level (hydraulic head) at each cell. The drain conductance was estimated through model calibration at 15,000 ft2/d.
Model Input
Model input needed to calibrate a model includes hydrau-lic properties, recharge, discharge, and withdrawals (table 4). Hydraulic properties include horizontal and vertical hydraulic conductivity for each model layer, specific yield in model layer 1, specific storage in model layers 2 and 3, and the hydraulic characteristic (used to simulate horizontal flow barriers or faults). The hydraulic properties, with the excep-tion of the hydraulic characteristic values, were grouped into zones of similar geologic units that were defined with a single value. Delineation of the zones was based on lithologic logs, the geologic map, and aquifer tests conducted in the Langford Basin. Model layer 1 was divided into five hydraulic property zones, model layer 2 was divided into three zones, and model
layer 3 was represented with a single zone (fig. 16). Initial estimates for these properties were determined on the basis of the geologic and hydrologic data compiled from aquifer tests and well-driller’s logs. The hydraulic characteristic values were estimated for individual fault segments on the basis of observed water-level differences on opposite sides of the fault segments.
Hydraulic ConductivityEstimates of the initial hydraulic conductivities for the
unconsolidated deposits, based on aquifer tests and driller’s logs for production and monitor wells in Langford Basin, are summarized in table 2. These estimates served as starting points for the calibration process. Initial hydraulic-conductiv-ity values ranged from 1 to 30 ft/d and are shown in table 4B for each zone. One horizontal hydraulic-conductivity value was calibrated for each of the hydraulic property zones in each model layer (table 4B). Final calibrated hydraulic-conductivity values ranged from 1.5 to 5.6 ft/d, and are shown in figure 16 and summarized in table 4B.
Table 4. Calibrated parameter values for the calibrated groundwater-flow model, Langford Basin, Fort Irwin National Training Center, California. [Abbreviations: ft, foot; NAVD 88, North American Vertical Datum of 1988; ft2/d, foot squared per day; ft/d, foot per day; ft-1, 1 per foot; Qp, Quaternary playa deposits; Qoa, Quater-nary older alluvium; Tyg, Tertiary younger sedimentary deposits; Tog, Tertiary older sedimentary deposits; NA, not applicable; 1/d, one per day; acre-ft/yr, acre-foot per year]
A. Drain properties
Elevation 2,109 ft NAVD 88Conductance 15,000 ft2/d
B. Hydraulic conductivities and specific storages
Zone name
Initial horizontal hydraulic
conductivity Kh
(ft/d)
Calibrated horizontal hydraulic
conductivity Kh
(ft/d)
Vertical anisotropy
(dimensionless)
Initial specific
yield (dimensionless)
Calibrated specific yield
(dimensionless)
Initial specific storage
(ft-1)
Calibrated specific storage
(ft-1)
Model layer 1Qp 1.00 1.50 1:500 0.1 0.01 NA NAQoa 3.00–30.00 3.00 and 5.6 1:500 0.5 0.1 NA NATyg 3.00–7.00 5.00 1:500 0.5 0.1 NA NATog 2.00 2.50 1:500 0.5 0.1 NA NA
Model layer 2Tyg 3.00–7.00 2.8 and 3.00 1:500 NA NA 1.0 E-5 1.0 E-6Tog 2.00 2.20 1:500 NA NA 1.0 E-5 1.0 E-6
Model layer 3Tog 2.00 2.00 1:500 NA NA 1.0 E-5 1.0 E-6
C. Hydraulic characteristics of the horizontal-flow barriers D. Recharge rates
Zone name Hydraulic characteristic (1/d) Zone name Recharge (acre-ft/yr)
Unnamed north (layers 1, 2 and 3) 1.00E-06 Underflow 6.00–40.00Playa (layer 1) 1.0E-06 and 1.0E-02 Noble Dome 1.80Playa (layers 2 and 3) 1.00E-06 Alvord 4.00Noble Dome (layer 1) 1.0E-5 and 4.0E-03 Total 11.8–45.8Noble Dome (layers 2 and 3) 1.00E-06Coyote Lake (layers 1, 2, and 3) 10.00

Simulation of Groundwater Flow 33
Figure 16. Areal distribution of hydraulic parameter zones, horizontal hydraulic conductivity, specific yield (layer 1), specific storage, vertical anisotropy, and horizontal-flow barriers used in the model for A, model layer 1; B, model layer 2; and C, model layer 3 for the calibrated transient groundwater-flow model, Langford Basin, Fort Irwin National Training Center, California.
UNNAMED NORTH FAULT
PLAYA FAULT
NOBLE DOME FAULT
COYOTE LAKE FAULT
?
COYOTE LAKE FAULT
NORTH NOBLE
DOME FAULT
GARLIC SPRING FAULT
?
??
?
?
?
?
?
SOUTH NOBLE DOME FAULT
EXPLANATION
?
A'AExtent of model layer 1Geologic zoneHorizontal hydraulic-conductivity value, in feet per daySpecific-yield value, dimensionlessVertical anisotropy, dimensionless
QoaKh1 = 5.6SY1 = 0.1VA = 1:500
Approximate groundwater basin boundary
Line of geologic section (See figure 14A–C)
Fault—Dashed where approximately located; queried where uncertain; dotted where concealed
Model simulated fault
Geology by D.M. Miller,unpublished data, 1994
1 2 KILOMETERS
1 2 MILES
0
0 R3E R4E
T13N
T12N
Nob
leDo
me
UD
U
D
UD
B'
A
B
C'
A'Tyg
Qoa QpKh1= 5.6SY1 = 0.1VA = 1:500
QoaKh1= 3SY1 = 0.1VA = 1:500
Kh1= 1.5SY1 = 0.01VA = 1:500
Kh1= 5SY1 = 0.1VA = 1:500
TogKh1= 2.5SY1 = 0.1VA = 1:500
C
A

34 Geohydrology, Geochemistry, Groundwater Simulation and Analysis of Potential Water-Supply Management Options
Figure 16. Areal distribution of hydraulic parameter zones, horizontal hydraulic conductivity, specific yield (layer 1), specific storage, vertical anisotropy, and horizontal-flow barriers used in the model for A, model layer 1; B, model layer 2; and C, model layer 3 for the calibrated transient groundwater-flow model, Langford Basin, Fort Irwin National Training Center, California.—Continued
UNNAMED NORTH FAULT
PLAYA FAULT
NOBLE DOME FAULT
COYOTE LAKE FAULT
?
COYOTE LAKE FAULT
NORTH NOBLE
DOME FAULT
GARLIC SPRING FAULT
?
??
?
?
?
?
?
SOUTH NOBLE DOME FAULT
EXPLANATION
?
Geology by D.M. Miller,unpublished data, 1994
1 2 KILOMETERS
1 2 MILES
0
0 R3E R4E
T13N
T12N
Nob
leDo
me
U
D
U
D
UD
A'A
B'
A
BC
C'
A'
TygKh2 = 3SS2 = 1.0E-6VA = 1:500
TogKh2 = 2.8SS2 = 1.0E-6VA = 1:500
TogKh2 = 2.2SS2 = 1.0E-6VA = 1:500
B
Extent of model layer 2Geologic zoneHorizontal hydraulic-conductivity value, in feet per daySpecific-storage value, in 1 per footVertical anisotropy, dimensionless
TygKh2 = 3SS2 = 1.0E-6VA = 1:500
Approximate groundwater basin boundary
Line of geologic section (See figure 14A–C)
Fault—Dashed where approximately located; queried where uncertain; dotted where concealed
Model simulated fault
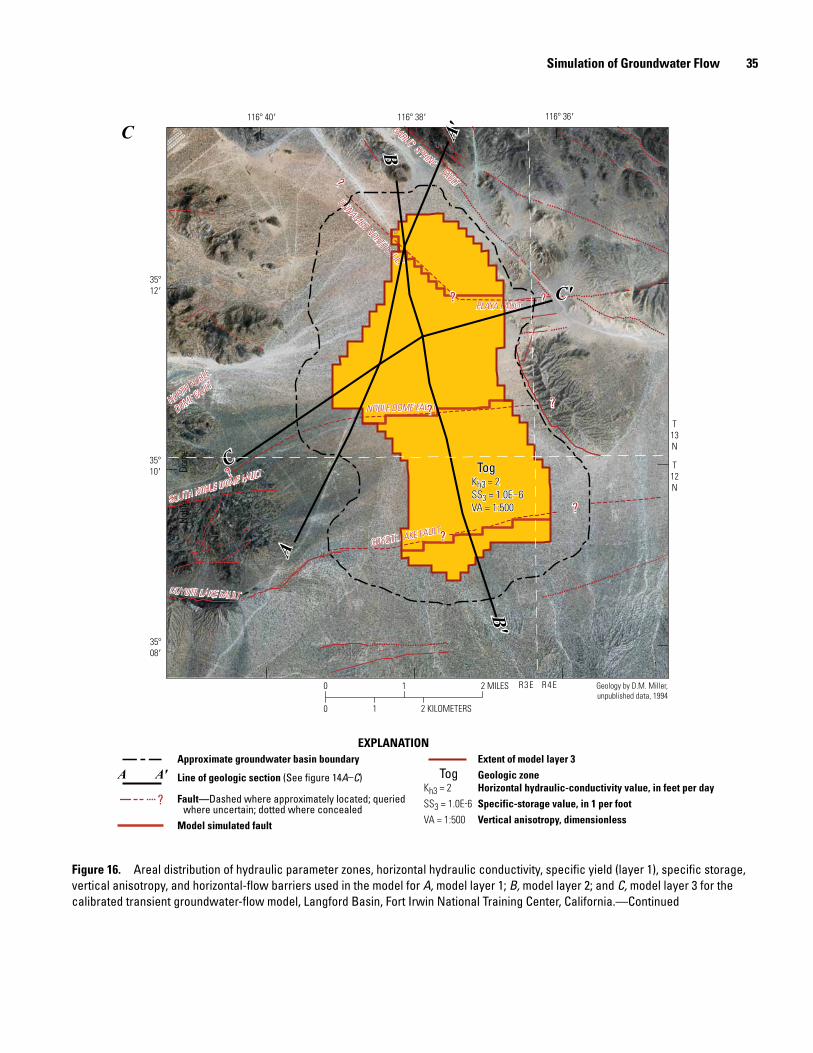
Simulation of Groundwater Flow 35
Figure 16. Areal distribution of hydraulic parameter zones, horizontal hydraulic conductivity, specific yield (layer 1), specific storage, vertical anisotropy, and horizontal-flow barriers used in the model for A, model layer 1; B, model layer 2; and C, model layer 3 for the calibrated transient groundwater-flow model, Langford Basin, Fort Irwin National Training Center, California.—Continued
UNNAMED NORTH FAULT
PLAYA FAULT
NOBLE DOME FAULT
COYOTE LAKE FAULT
?
COYOTE LAKE FAULT
NORTH NOBLE
DOME FAULT
GARLIC SPRING FAULT
?
??
?
?
?
?
?
SOUTH NOBLE DOME FAULT
Geology by D.M. Miller,unpublished data, 1994
1 2 KILOMETERS
1 2 MILES
0
0 R3E R4E
T13N
T12N
Nob
leDo
me
UD
U
D
UD
B'
A
B
C
C'
A'Tog
Kh3 = 2SS3 = 1.0E-6VA = 1:500
C
EXPLANATION
?
A'AExtent of model layer 3Geologic zoneHorizontal hydraulic-conductivity value, in feet per daySpecific-storage value, in 1 per footVertical anisotropy, dimensionless
TogKh3 = 2SS3 = 1.0E-6VA = 1:500
Approximate groundwater basin boundary
Line of geologic section (See figure 14A–C)
Fault—Dashed where approximately located; queried where uncertain; dotted where concealed
Model simulated fault

36 Geohydrology, Geochemistry, Groundwater Simulation and Analysis of Potential Water-Supply Management Options
Vertical LeakanceThe hydraulic connection (vertical leakance or leak-
age) between model layers is calculated by the MODFLOW program by using the thickness of the model layer and the vertical hydraulic conductivity of the model layer to calculate the vertical leakage for each model cell (Harbaugh, 2005). For this model, the vertical hydraulic conductivity was calculated as a fraction of the horizontal hydraulic conductivity. The ratio of horizontal hydraulic conductivity (Kh) to vertical hydraulic conductivity (Kv)—vertical anisotropy—was calibrated to be 1:500. Simulated vertical leakage between model cells only occurs where there is an underlying active model cell.
Specific Yield and Specific StorageA specific yield was estimated through model calibration
for each of the hydraulic property zones in model layer 1 (fig. 16A). Specific storage was estimated through model cali-bration for each zone in model layers 2 and 3. Initial estimates for these storage properties were determined from the geologic properties of the aquifer materials. Initial specific-yield values for all zones in model layer 1 were 0.10 or 0.5, and initial specific storages for all zones in model layers 2 and 3 were 1.0×10⁻⁵ ft–1. Final specific-yield values ranged from 0.01 to 0.1 in model layer 1 (fig. 16A, table 4B). The final specific-yield value of 0.1 was used everywhere in model layer 1 except for the sediments in the area of the playa (Qp), where a value of 0.01 was used. The final specific-storage values for model layers 2 and 3 were 1.0×10⁻⁶ ft–1 (fig. 16B and 16C, table 4B).
Horizontal-Flow BarriersFaults are barriers to groundwater flow in the Langford
Basin. Low permeability faults were simulated by using the Horizontal-Flow Barrier module, which modifies the hydraulic conductivity between adjacent model cells (Hsieh and Freckle-ton, 1993). Flow across a simulated fault is proportional to the hydraulic-head difference between adjacent cells. The constant of proportionality is a specific value, the hydraulic character-istic, that is equal to the barrier hydraulic conductivity divided by the width of the horizontal-flow barrier. The initial loca-tions and areal extents of these barriers were identified by extending mapped faults into the basin and are described in the “Fault” section of this report. Hydraulically significant faults were inferred from measured differences in groundwater-level declines between production wells and monitor wells, and from model calibration. The hydraulic characteristic ini-tially was set to 1.0 1/d. For each horizontal-flow barrier, the hydraulic characteristic was calibrated to simulate groundwa-ter-level declines and drawdown throughout the model calibra-tion period. Fault locations also were adjusted during model calibration to better match simulated and observed water-level declines. Currently, no data are available in the Coyote Lake
Fault area to determine the conductance for this fault. A high value of 10.0 1/d was used for the Coyote Lake Fault so that simulated flow through the fault was not impeded. Final values for all other faults ranged from 1.0×10⁻⁶ to 1.0×10⁻² 1/d (table 4C). Locations of simulated faults are shown on figure 16.
Simulation of Recharge and DischargeRecharge to the Langford Basin occurs as natural recharge
of precipitation runoff along normally dry washes near the base of the surrounding hills and as groundwater underflow from the Irwin Basin. As previously stated, areal recharge from direct infiltration of precipitation is believed to be minimal because of the low precipitation and high evaporation rates in the basin. Isotopic data presented earlier in this report indicate the basin was recharged thousands of years ago when the climate was cooler and wetter. The small amount of natural recharge that does take place in the arid Mojave Desert under current climatic conditions results primarily from the infiltra-tion of intermittent runoff along washes (Izbicki and others, 2000).
Natural recharge of precipitation runoff in Langford Basin was simulated in layer 1 with the MODFLOW Recharge module (Harbaugh, 2005) along intermittent streams at the base of Noble Dome (Noble Dome zone) in the western part of the basin and at the base of the Alvord Mountains (Alvord zone) in the southern part of the basin (fig. 17). The initial estimate of natural recharge of precipitation runoff used to calibrate the model was 50 acre-ft/yr. It was assumed that the natural recharge in Langford Basin was similar to the esti-mated natural recharge for Irwin Basin (50 acre-ft/yr) reported by Densmore (2003). The initial value of 50 acre-ft/yr was lowered to about 6 acre-ft/yr during model calibration; most of this recharge was simulated in the Alvord zone (4 acre-ft/yr; table 4D). The recharge was equally distributed among the cells that represent the simulated recharge areas at the base of the mountains. Recharge at the base of these mountains was assumed to be constant during the entire simulated time period.
Recharge by groundwater underflow from the Irwin Basin was simulated in layer 1 along the Garlic Spring Fault in the northern part of the Langford Basin (fig. 17). Ground-water underflow out of the Irwin Basin ranged from about 50 acre-ft/yr under predevelopment conditions to about 105 acre-ft/yr in 1999 (Densmore, 2003). Some of this underflow may be lost to evapotranspiration by phreatophytes near Garlic Spring. Water levels in observation well 13N/3E-10E3 (well location shown on fig. 13), in the southeastern part of the Irwin Basin, have increased since 1995 in response to importa-tion of water withdrawn from the Bicycle and Langford Basins and the subsequent recharge of treated wastewater effluent in the southeastern part of the Irwin Basin (Densmore, 2003). This increase in the application of recharge in the Irwin Basin has resulted in an increase in the underflow out of the Irwin Basin along the Garlic Spring Fault. Water levels in well

Simulation of Groundwater Flow 37
Figure 17. Recharge distribution zones and recharge rates for the calibrated transient groundwater-flow model, Langford Basin, Fort Irwin National Training Center, California.
UNNAMED NORTH FAULT
PLAYA FAULT
NOBLE DOME FAULT
COYOTE LAKE FAULT
?
COYOTE LAKE FAULT
NORTH NOBLE
DOME FAULT
GARLIC SPRING FAULT
?
??
?
?
?
?
?
SOUTH NOBLE DOME FAULT
Underflow
4
6 to 40
1.8
Alvord
Noble Dome
Recharge zone name and rate, in acre-feet per year
Alvord4
Approximate groundwater basin boundary
EXPLANATION
Fault—Dashed where approximately located; queried where uncertain; dotted where concealed
?
Geology by D.M. Miller,unpublished data, 1994
1 2 KILOMETERS
1 2 MILES
0
0 R3E R4E
T13N
T12N
Nob
leDo
me
UD
U
D
UD
LangfordWell Lake
(dry)

38 Geohydrology, Geochemistry, Groundwater Simulation and Analysis of Potential Water-Supply Management Options
13N/3E-14K1, in the northern part of the Langford Basin, have risen 3 ft since June 1999 when measurements began (fig. 19, presented later in report). The water-level rise in well 13N/3E-14K1 is assumed to be the result of an increase in underflow from Irwin Basin. The quantity and timing of the groundwater underflow was adjusted to match measured water levels at well 13N/3E-14K1 during the model calibra-tion. Final calibrated values of underflow are 6 acre-ft/yr for predevelopment and for January 1993 to December 1997, and 40 acre-ft/yr for January 1999 to December 2010 (table 5). After groundwater withdrawals began in April 1992, a value of 4.5 acre-ft/yr was used to simulate underflow for April 1992 to December 1992, which is not a full year. The increase in simu-lated groundwater underflow in 1999 is the result of increased net inflow of water to the Irwin Basin owing to importation of water withdrawn from the Bicycle and Langford Basins (Densmore, 2003).
As previously stated, there is no surface-water discharge from the basin. During predevelopment conditions, ground-water underflow is presumed to discharge east of the playa and was simulated by use of the MODFLOW Drain module (Harbaugh, 2005) described previously.
Groundwater WithdrawalsThe MODFLOW Multi-Node Well module, MNW2
(Konikow and others, 2009), was used to simulate groundwa-ter withdrawals from three production wells in the Langford
Basin, which were previously discussed in the “Groundwater Withdrawals and Water Use” section of the report. The MNW2 module simulates wells completed in multiple aquifers and allows vertical groundwater movement through the well bores. The groundwater withdrawal rate at an individual well is dis-tributed dynamically into model layers (multi-well nodes) on the basis of transmissivity, water level, and the length of the screened interval in each layer. Groundwater withdrawals from each well were allocated between model layers 1 and 2. The screened intervals of the three production wells in Langford Basin do not extend into layer 3.
Model CalibrationThe model was calibrated by trial-and-error adjustment of
initial estimates of hydraulic conductivity, vertical anisotropy, specific-yield values, specific-storage values, hydraulic char-acteristic of the horizontal-flow barriers, underflow from the Irwin Basin, recharge rates, and conductance and elevation of the drain. The calibration criteria for the Langford model are to minimize the difference between simulated and measured water levels at 12 observation wells, simulate general flow directions, and simulate the temporal trend in measured water levels. During model calibration, the hydraulic-property values were adjusted within limits based on the geologic and hydro-logic properties of the basin and the degree of confidence placed on the original data estimates. The model calibration included adjusting the locations of horizontal-flow barriers, which had a major effect on the simulated water levels.
Table 5. Simulated predevelopment and annual water budget, 1992–2010, Langford Basin, Fort Irwin National Training Center, California.[Values in acre-feet per year. *, groundwater withdrawals and simulation period begins in April 1992]
Time intervalInflows Outflows
Recharge Underflow Storage Total Withdrawals Drains Storage Total
Predevelopment 5.8 6 0.0 11.8 0.0 11.8 0 11.81992* 4.3 4.5 575.0 583.8 560.5 7.5 15.8 583.81993 5.8 6 1,052.7 1,064.5 1,005.9 3.2 55.4 1,064.51994 5.8 6 1,004.1 1,015.9 904.6 0.0 111.3 1,015.91995 5.8 6 871.3 883.1 732.4 0.0 150.7 883.11996 5.8 6 730.7 742.5 594.4 0.0 148.1 742.51997 5.8 6 895.4 907.2 810.0 0.0 97.2 907.21998 5.8 26 881.3 913.1 649.5 0.0 263.6 913.11999 5.8 40 657.1 702.9 473.0 0.0 229.9 702.92000 5.8 40 664.1 709.9 582.2 0.0 127.7 709.92001 5.8 40 432.9 478.7 234.1 0.0 244.6 478.72002 5.8 40 474.7 520.5 383.7 0.0 136.8 520.52003 5.8 40 701.6 747.4 618.0 0.0 129.4 747.42004 5.8 40 618.2 664.0 495.1 0.0 168.9 664.02005 5.8 40 741.6 787.4 682.7 0.0 104.7 787.42006 5.8 40 1,025.9 1,071.7 902.9 0.0 168.8 1,071.72007 5.8 40 402.4 448.2 132.7 0.0 315.5 448.22008 5.8 40 855.5 901.3 854.8 0.0 46.5 901.32009 5.8 40 852.1 897.9 792.0 0.0 105.9 897.92010 5.8 40 959.9 1,005.7 899.6 0.0 106.1 1,005.71992–2010 Total 108.7 540.5 14,396.9 15,046.1 12,308.2 10.7 2,726.9 15,045.8

Simulation of Groundwater Flow 39
The model was calibrated in an iterative manner between the steady state and transient simulations. Starting with the steady-state model, an initial hydraulic-head distribution for predevelopment conditions was simulated by modifying the initial estimates of the drain elevation and conductance, horizontal hydraulic conductivity, and recharge. The simulated head distribution from the steady-state model was then used as the initial head distribution for the transient model. The transient calibration primarily involved modifying storage properties, the hydraulic-characteristic values of the horizon-tal-flow barriers (faults), and the vertical-anisotropy values. If a satisfactory match between measured and simulated results was not obtained, the process was repeated.
A semi-automated calibration process such as UCODE (Poeter and others, 2005) was not utilized for this study because of the lack of data; only one type of data, hydraulic heads, are available for the Langford Basin. Hill and Tiedeman (2007) discussed problems associated with using only one type of data when a semi-automated calibration process such as UCODE is utilized for calibration. When only hydraulic head observations are included and parameters related to the flows and hydraulic conductivity of the system are being estimated by the regression, the same value of the objective function can be calculated from numerous combinations of the parameters; hence, no set of unique values will be estimated (Hill and Tiedeman, U.S. Geological Survey, written commun., 2011).
Predevelopment conditions were used to simulate steady-state conditions during stress period 1. The model was cali-brated to the highest groundwater-level measurements made prior to 1992 (figs. 7A and 18A). Water-level measurements were available from only five wells (13N/3E-23F1, 13N/3E-26N1, 13N/3E-26N2, 13N/3E-35B1, and 13N/3E-34Q1) for the period from 1980 to 1988. Well 13N/3E-23F1 is screened in all layers, wells 13N/3E-35B1, 13N/3E-26N1, and 13N/3E-26N2 are screened in layers 1 and 2, and well 13N/3E-34Q1 is screened in layer 1. No groundwater-level measurements were available for the southern half of the basin. The steady-state calibration primarily involved modifying the initial estimates of the drain elevation and conductance, horizontal hydraulic conductivity, and recharge until simulated hydraulic heads were within 5 ft of the measured predevelopment water levels. The calibrated hydraulic-conductivity values were similar to values derived from specific-capacity tests (table 2). Simulated hydraulic heads for predevelopment conditions were within ±1.9 ft of measured water levels, with a root mean squared error (RMSE) of 1.5 ft (table 6). The simulated groundwater budget for predevelopment conditions is shown in table 5.
Groundwater conditions from April 1992 through March 2011 were used to simulate transient conditions during stress periods 2–229. The model was calibrated to water levels measured between January 1993 and December 2010. A total of 117 groundwater-level measurements from 12 wells were
used to calibrate the model. Water levels measured in the three production wells were not used in the calibration process if the wells were pumping or were recently pumped. The transient calibration primarily involved modifying storage properties, the hydraulic-characteristic values of the horizontal-flow bar-riers (faults), and the vertical-anisotropy values. Groundwater withdrawals were metered and were not modified during the calibration. The barrier effect of the faults on groundwater flow was not evident until the aquifer system was stressed by groundwater withdrawals. Consequently, the transient calibra-tion process involved modifying the hydraulic-characteristic values of horizontal-flow barrier segments near pumping wells to approximate hydraulic-head declines measured in long-term monitor wells.
The simulated layer-1 hydraulic heads agreed well with measured water levels for March 1995, March 2005, and October 2010 (fig. 18B, 18C, and 18D, respectively), and the simulated drawdown from April 1992 to December 2010 compared well to the measured drawdown at the three produc-tion wells in the Langford Basin (fig. 18E). The RMSE for the transient simulation is 9.3 ft (table 6). The greatest differ-ences between simulated hydraulic heads and measured water levels are in monitor wells 13N/3E-26K2, 13N/3E-26K3, and 13N/3E-26K4 for May 1995, August 2002, and October 2010. These monitor wells are within 200 ft of production well 13N/3E-26K1. Water levels in the monitor wells fluctu-ate more than 50 ft during the same time period, in response to pumping in the production well. Hydraulic heads were simulated using average monthly withdrawal rates for the different production wells; consequently, daily responses to the wells turning on and off are not simulated. Simulated hydraulic heads represent an average for a model cell over the month-long simulation period. Monitor wells 13N/3E-35J1, 13N/3E-35J2, 13N/3E-35J3, 13N/3E-14K1, 13N/3E-23F1, 13N/3E-26N1, and 13N/3E-34Q1 are more than 0.6 mi from the nearest production well and are not affected by daily fluctuations in withdrawal rates. The RMSE from these wells is less than 3.5 ft.
Simulated time-series of hydraulic heads (hydrographs) for the period 1992 through 2010 from the calibrated model closely match the hydrographs of measured water levels (fig. 19). These results indicate the transient simulation rea-sonably simulates the timing and magnitude of water-level declines in Langford Basin. The greatest difference between simulated and measured water levels is in the three monitor wells 13N/3E-26K2, 13N/3E-26K3, and 13N/3E-26K4 that are near production wells.

40 Geohydrology, Geochemistry, Groundwater Simulation and Analysis of Potential Water-Supply Management Options
Figure 18. Simulated water-table surface and measured water levels for the upper aquifer, Langford Basin, Fort Irwin National Training Center, California. A, Predevelopment; B, February 1995; C, March 2005; D, October 2010; and E, Simulated drawdown from April 1992 to October 2010.
UNNAMED NORTH FAULT
PLAYA FAULT
NOBLE DOME FAULT
COYOTE LAKE FAULT
?
COYOTE LAKE FAULT
NORTH NOBLE
DOME FAULT
GARLIC SPRING FAULT
?
??
?
?
?
?
?
SOUTH NOBLE DOME FAULT
EXPLANATION
Horizontal-flow barrier
Approximate groundwater basin boundary
A
ProductionUnused production
Destroyed Test
Well and number—Upper number is well identifier, middle number is water-level altitude and lower number is date of water-level measurement Note: Well is identified by section number only; township and range shown on this figure
Simulated hydraulic-head contour and altitude—Datum is NAVD 88
26N2
34Q1
23P1
26N1Fault—Dashed where approximately located; queried where uncertain; dotted where concealed
?
Geology by D.M. Miller,unpublished data, 1994
1 2 KILOMETERS
1 2 MILES
0
0 R3E R4E
T13N
T12N
Nob
leDo
me
UD
U
D
UD
2,114
Extent of model layer 1
Predevelopment(1980–88)
23F12,11510/30/1980
26N12,1165/1/1988
26N22,1165/1/1988
34Q12,1155/1/1988
35B12,1142/1/1988
23P1
26K1
35A1
2,117
2,116
2,1152,114
2,113
2,114
2,1122,111 2,110

Simulation of Groundwater Flow 41
UNNAMED NORTH FAULT
PLAYA FAULT
NOBLE DOME FAULT
COYOTE LAKE FAULT
?
COYOTE LAKE FAULT
NORTH NOBLE
DOME FAULT
GARLIC SPRING FAULT
?
??
?
?
?
?
?
SOUTH NOBLE DOME FAULT
EXPLANATION
Horizontal-flow barrier
Approximate groundwater basin boundary
B
ProductionUnused production
Destroyed Test
Well and number—Upper number is well identifier, middle number is water-level altitude and lower number is date of water-level measurement Note: Well is identified by section number only; township and range shown on this figure
Simulated hydraulic-head contour and altitude—Datum is NAVD 88
26N2
34Q1
23P1
26N1Fault—Dashed where approximately located; queried where uncertain; dotted where concealed
?
Geology by D.M. Miller,unpublished data, 1994
1 2 KILOMETERS
1 2 MILES
0
0R3E R4E
T13N
T12N
Nob
leDo
me
UD
U
D
UD
2,110
Extent of model layer 1
1995
23F12,1162/8/1995
26N12,1052/28/1995
26N22,1062/8/1995
34Q12,1132/28/1995
2,110
2,110
2,115
2,10
5
2,100
Figure 18. Simulated water-table surface and measured water levels for the upper aquifer, Langford Basin, Fort Irwin National Training Center, California. A, Predevelopment; B, February 1995; C, March 2005; D, October 2010; and E, Simulated drawdown from April 1992 to October 2010.—Continued

42 Geohydrology, Geochemistry, Groundwater Simulation and Analysis of Potential Water-Supply Management Options
UNNAMED NORTH FAULT
PLAYA FAULT
NOBLE DOME FAULT
COYOTE LAKE FAULT
?
COYOTE LAKE FAULT
NORTH NOBLE
DOME FAULT
GARLIC SPRING FAULT
?
??
?
?
?
?
?
SOUTH NOBLE DOME FAULT
2,110
2,105
2,100
2,115
2,09
5
2,120
2,1102,1002,105
EXPLANATION
Horizontal-flow barrier
Approximate groundwater basin boundary
C
ProductionUnused production
Destroyed Test
Well and number—Upper number is well identifier, middle number is water-level altitude and lower number is date of water-level measurement Note: Well is identified by section number only; township and range shown on this figure
Simulated hydraulic-head contour and altitude—Datum is NAVD 88
26N2
34Q1
23P1
26N1Fault—Dashed where approximately located; queried where uncertain; dotted where concealed
?
Geology by D.M. Miller,unpublished data, 1994
1 2 KILOMETERS
1 2 MILES
0
0 R3E R4E
T13N
T12N
Nob
leDo
me
UD
U
D
UD
2,110
Extent of model layer 1
2005
U.S. Geological Survey
35J3
23F12,1153/2/2005
14K12,1223/2/2005
26N12,0943/2/2005
26K42,0943/22/2005
34Q12,1073/2/2005
35J32,1043/2/2005
Figure 18. Simulated water-table surface and measured water levels for the upper aquifer, Langford Basin, Fort Irwin National Training Center, California. A, Predevelopment; B, February 1995; C, March 2005; D, October 2010; and E, Simulated drawdown from April 1992 to October 2010.—Continued

Simulation of Groundwater Flow 43
UNNAMED NORTH FAULT
PLAYA FAULT
NOBLE DOME FAULT
COYOTE LAKE FAULT
?
COYOTE LAKE FAULT
NORTH NOBLE
DOME FAULT
GARLIC SPRING FAULT
?
??
?
?
?
?
?
SOUTH NOBLE DOME FAULT
EXPLANATION
Horizontal-flow barrier
Approximate groundwater basin boundary
D
ProductionUnused production
Destroyed Test U.S. Geological Survey
Well and number—Upper number is well identifier, middle number is water-level altitude and lower number is date of water-level measurement Note: Well is identified by section number only; township and range shown on this figure
Simulated hydraulic-head contour and altitude—Datum is NAVD 88
26N2
34Q1
23P1
26N1
35J1–3
Fault—Dashed where approximately located; queried where uncertain; dotted where concealed
?
Geology by D.M. Miller,unpublished data, 1994
1 2 KILOMETERS
1 2 MILES
0
0 R3E R4E
T13N
T12N
Nob
leDo
me
UD
U
D
UD
2,110
Extent of model layer 1
2010
2,105
2,105
2,100
2,100
2,110
2,115
2,120
2,095
2,095
2,090
2,0852,0
802,0
80
14K12,12110/19/2010
26N12,07610/19/2010
26K42,06010/19/2010
24N12,10010/19/2010
34Q12,10410/19/2010
35J32,10110/19/2010
Figure 18. Simulated water-table surface and measured water levels for the upper aquifer, Langford Basin, Fort Irwin National Training Center, California. A, Predevelopment; B, February 1995; C, March 2005; D, October 2010; and E, Simulated drawdown from April 1992 to October 2010.—Continued

44 Geohydrology, Geochemistry, Groundwater Simulation and Analysis of Potential Water-Supply Management Options
UNNAMED NORTH FAULT
PLAYA FAULT
NOBLE DOME FAULT
COYOTE LAKE FAULT
?
COYOTE LAKE FAULT
NORTH NOBLE
DOME FAULT
GARLIC SPRING FAULT
?
??
?
?
?
?
?
SOUTH NOBLE DOME FAULT
EXPLANATION
Horizontal-flow barrier
Approximate groundwater basin boundary
E
Simulated drawdown, in feet
Fault—Dashed where approximately located; queried where uncertain; dotted where concealed
?
Geology by D.M. Miller,unpublished data, 1994
1 2 KILOMETERS
1 2 MILES
0
0 R3E R4E
T13N
T12N
Nob
leDo
me
UD
U
D
UD
20
Extent of model layer 126N127.2
23F14.0
Unused production
Production
Test
23P1
Well and number— Upper number is well identifier, lower number is the drawdown, calculated water-level measure-ments from Jan or Feb, 1993 and December, 2010 Note: Well identified by section number only; township and range is shown on this figure
10
20
0
10
10
10
20
10
20
203023P1
26K1
23F14.0
26N127.2
34Q111.6
35B140.2
Figure 18. Simulated water-table surface and measured water levels for the upper aquifer, Langford Basin, Fort Irwin National Training Center, California. A, Predevelopment; B, February 1995; C, March 2005; D, October 2010; and E, Simulated drawdown from April 1992 to October 2010.—Continued

Simulation of Groundwater Flow 45
State well
number
Date of water-level
measurement(month/day/year)
Simulated water level for the month of measured water
level (feet)
Measured water level
(feet)
Difference betweensimulated and
measured water level(feet)
Root mean square error
13N/3E-14K1 06/23/1999* 2,118.20 2,119.30 –1.1001/30/2002 2,120.21 2,119.70 0.5108/14/2002 2,120.47 2,119.80 0.6603/02/2005 2,121.12 2,121.70 –0.5912/21/2007 2,121.36 2,121.70 –0.3410/19/2010 2,121.35 2,121.40 –0.05 0.63
13N/3E-23F1 11/01/1986* 2,116.19 2,114.83 1.3601/27/1993 2,114.99 2,116.76 –1.7709/07/1994 2,113.59 2,115.20 –1.6111/21/1994 2,113.87 2,115.93 –2.0602/08/1995 2,114.59 2,116.32 –1.7308/10/1995 2,113.43 2,115.94 –2.5109/18/1996 2,113.54 2,115.21 –1.6806/23/1999 2,112.93 2,114.83 –1.9001/18/2000 2,113.11 2,114.24 –1.1301/30/2002 2,113.32 2,113.73 –0.4108/14/2002 2,112.67 2,113.10 –0.4303/02/2005 2,113.23 2,114.84 –1.6112/15/2010 2,111.53 2,112.74 –1.21 1.60
13N/3E-24N1 06/26/2002 2,107.33 2,104.76 2.5708/14/2002 2,107.11 2,104.58 2.5310/19/2010 2,102.45 2,100.31 2.14 2.42
13N/3E-26K2 05/17/1995* 2,095.02 2,040.67 54.3508/10/1995 2,090.50 2,095.61 –5.1106/23/1999 2,095.74 2,091.78 3.9601/18/2000 2,098.30 2,094.93 3.3701/30/2002 2,099.54 2,094.08 5.4608/14/2002 2,090.35 2,083.50 6.8503/22/2005 2,096.30 2,093.08 3.2210/19/2010 2,077.22 2,069.17 8.0512/07/2010 2,085.24 2,072.30 12.9401/27/2011 2,087.57 2,081.70 5.87 18.33
13N/3E-26K3 05/17/1995* 2,088.23 2,071.44 16.7908/10/1995 2,085.76 2,080.02 5.7406/23/1999 2,092.22 2,092.19 0.0301/18/2000 2,095.91 2,096.93 –1.0201/30/2002 2,098.55 2,095.21 3.3408/14/2002 2,083.10 2,049.29 33.8003/22/2005 2,093.92 2,093.97 –0.0510/19/2010 2,073.48 2,038.97 34.5012/07/2010 2,084.73 2,074.01 10.7201/27/2011 2,086.25 2,081.28 4.97 16.73
13N/3E-26K4 05/17/1995* 2,099.87 2,091.40 8.4708/10/1995 2,097.94 2,090.29 7.6506/23/1999 2,094.80 2,086.67 8.1301/18/2000 2,095.62 2,096.43 –0.8201/30/2002 2,096.73 2,094.34 2.3908/14/2002 2,091.37 2,048.36 43.0103/22/2005 2,093.35 2,093.62 –0.2710/19/2010 2,079.42 2,059.79 19.6312/07/2010 2,081.89 2,075.81 6.0801/27/2011 2,082.83 2,080.85 1.98 15.75
13N/3E-26N1 05/1/1988* 2,113.74 2,115.67 –1.9301/25/1993 2,105.78 2,108.25 –2.4709/24/1993 2,103.45 2,104.04 –0.5907/22/1994 2,099.17 2,101.08 –1.9109/07/1994 2,099.96 2,101.21 –1.2511/21/1994 2,102.78 2,104.26 –1.4802/28/1995 2,104.02 2,105.24 –1.22
Table 6. Simulated and 1993–2011 measured water levels and root mean square error for 12 wells, Langford Basin, Fort Irwin National Training Center, California.

46 Geohydrology, Geochemistry, Groundwater Simulation and Analysis of Potential Water-Supply Management Options
State well
number
Date of water-level
measurement(month/day/year)
Simulated water level for the month of measured water
level (feet)
Measured water level
(feet)
Difference betweensimulated and
measured water level(feet)
Root mean square error
08/10/1995 2,098.23 2,099.42 –1.1909/18/1996 2,100.76 2,098.32 2.4406/23/1999 2,097.69 2,096.86 0.8301/18/2000 2,099.23 2,098.00 1.2301/30/2002 2,099.31 2,095.95 3.3603/02/2005 2,096.17 2,093.56 2.6112/21/2007 2,090.62 2,083.92 6.7010/19/2010 2,083.71 2,076.01 7.7012/07/2010 2,087.72 2,081.04 6.68 3.49
13N/3E-34Q1 05/1/1988* 2,113.54 2,115.26 –1.7201/25/1993 2,113.51 2,114.74 –1.2309/24/1993 2,113.37 2,115.34 –1.9707/22/1994 2,113.03 2,113.74 –0.7109/07/1994 2,112.94 2,113.58 –0.6411/21/1994 2,112.85 2,113.62 –0.7702/28/1995 2,112.70 2,113.16 –0.4608/10/1995 2,112.37 2,112.81 –0.4409/18/1996 2,111.57 2,111.97 –0.4006/23/1999 2,109.62 2,110.10 –0.4801/18/2000 2,109.22 2,109.67 –0.4501/30/2002 2,108.01 2,108.92 –0.9103/02/2005 2,106.42 2,107.05 –0.6312/21/2007 2,104.77 2,105.35 –0.5810/19/2010 2,103.03 2,103.55 –0.5212/07/2010 2,102.89 2,103.07 –0.18 0.89
13N/3E-35B1 02/01/1988 2,113.36 2,114.37 –1.0101/25/1993 2,082.12 2,104.16 –22.0409/24/1993 2,083.51 2,089.46 –5.9507/22/1994 2,067.77 2,076.99 –9.2209/07/1994 2,066.46 2,073.12 –6.6611/21/1994 2,082.71 2,085.06 –2.3502/28/1995 2,090.48 2,098.13 –7.6508/10/1995 2,065.17 2,070.33 –5.1609/18/1996 2,070.66 2,076.95 –6.2907/29/1999 2,081.65 2,075.22 6.4301/18/2000 2,097.18 2,092.43 4.7508/14/2002 2,086.35 2,082.66 3.6903/02/2005 2,093.13 2,085.04 8.0912/15/2010 2,082.00 2,063.95 18.05 9.80
13N/3E-35J1 6/25/2002* 2,109.00 2,108.29 0.7008/14/2002 2,108.92 2,108.27 0.6508/03/2004 2,108.09 2,107.30 0.7903/02/2005 2,107.85 2,107.01 0.8412/21/2007 2,106.46 2,105.72 0.7410/19/2010 2,104.77 2,104.46 0.3101/27/2011 2,104.63 2,104.28 0.35 0.69
13N/3E-35J2 08/14/2002* 2,108.28 2,107.85 0.4308/03/2004 2,107.41 2,106.88 0.5303/02/2005 2,107.12 2,106.59 0.5312/21/2007 2,105.66 2,105.34 0.3210/19/2010 2,103.84 2,103.81 0.0301/27/2011 2,103.65 2,103.69 –0.04 0.38
13N/3E-35J3 08/14/2002* 2,105.61 2,104.82 0.7908/03/2004 2,104.53 2,104.03 0.5003/02/2005 2,104.04 2,103.68 0.3612/21/2007 2,102.39 2,102.08 0.3110/19/2010 2,099.82 2,100.62 –0.8001/27/2011 2,099.45 2,100.33 –0.88 0.65
*Closest measurement to beginning of model simulation.
Table 6. Simulated and 1993–2011 measured water levels and root mean square error for 12 wells, Langford Basin, Fort Irwin National Training Center, California.—Continued

Simulation of Groundwater Flow 47
Figure 19. Hydrographs of simulated and measured water levels in 12 wells from predevelopment (1980–88) to January 2011, Langford Basin, Fort Irwin National Training Center, California.
1992 1994 1996 1998 2000 2002 2004 2006 2008 2010
Well 24N1
Year
Wat
er-le
vel a
ltitu
de, i
n fe
et a
bove
sea
leve
l
2,0402,0502,0602,0702,0802,0902,1002,1102,1202,130
1992 1994 1996 1998 2000 2002 2004 2006 2008 20102,0402,0502,0602,0702,0802,0902,1002,1102,1202,130
1992 1994 1996 1998 2000 2002 2004 2006 2008 2010
Well 35B1
2,0402,0502,0602,0702,0802,0902,1002,1102,1202,130
1992 1994 1996 1998 2000 2002 2004 2006 2008 20102,0402,0502,0602,0702,0802,0902,1002,1102,1202,130
1992 1994 1996 1998 2000 2002 2004 2006 2008 2010
Well 26N1
2,0402,0502,0602,0702,0802,0902,1002,1102,1202,130
1992 1994 1996 1998 2000 2002 2004 2006 2008 2010
Well 35J1Well 35J2
Well 35J32,0402,0502,0602,0702,0802,0902,1002,1102,1202,130
1992 1994 1996 1998 2000 2002 2004 2006 2008 2010
Well 23F1
2,0402,0502,0602,0702,0802,0902,1002,1102,1202,130
1992 1994 1996 1998 2000 2002 2004 2006 2008 2010
Well 14K1
2,0402,0502,0602,0702,0802,0902,1002,1102,1202,130
Well 34Q1
EXPLANATION
Well 26K2 Well 26K3
Well 26K4
Measured value, well screened in layer 3Measured value, well screened in layer 2 Measured value, well screened in layer 1
Measured value, well screened in layers 1, 2, and 3Measured value, well screened in layers 1 and 2
Simulated value, layer 3Simulated value, average of layers 1 and 2Simulated value, average of layers 1, 2, and 3
Simulated value, layer 2Simulated value, layer 1

48 Geohydrology, Geochemistry, Groundwater Simulation and Analysis of Potential Water-Supply Management Options
The simulated hydraulic heads and measured water levels closely match a 1:1 correlation line (fig. 20). A graph of simu-lated and measured equivalent water levels for an unbiased model ideally should show a random distribution above and below a 1:1 correlation line. The measured and simulated equivalent water levels for the Langford Basin are randomly distributed above and below the 1:1 correlation line except for three values from well 13N/3E-26N1 (three green points in the lower left side of fig. 20). The model overpredicts the three water levels measured from well 13N/3E-26N1 after 2007 (figs. 15C and 20). During the calibration process, adjusting model parameters in the area of well 13N/3E-26N1 did not achieve a better match between the measured and simulated water levels. A process is taking place at this well that is not being simulated by the model.
Model Results
During the period from April 1, 1992, through December 31, 2010, about 12,320 acre-ft of groundwater were withdrawn from the Langford Basin and about 650 acre-ft recharged (underflow and recharge) the basin (table 5). Because the
groundwater withdrawals exceeded recharge, measured and simulated water levels have declined throughout the basin (fig. 18E), more than 30 ft in the area centered around the three production wells. Moreover, simulated outflow through the drain from the Langford Basin began to decrease in 1992 and ceased in 1994 (table 5). In order to meet the groundwater withdrawal demand, a net of about 11,670 acre-ft of water (storage inflow minus storage outflow) was simulated as being removed from groundwater storage within the basin between 1992 and 2010 (table 5).
Model Sensitivity
The purpose of sensitivity analysis is to quantify the uncer-tainty in the calibrated model due to uncertainty in the esti-mates of aquifer parameters, stresses, and boundary conditions (Anderson and Woessner, 1991). The objective is to determine how readily and excessively water-level altitudes are affected by a change in hydrologic parameters in the calibrated model. A sensitivity analysis was conducted for the Langford Basin groundwater-flow model using UCODE-2005 (Poeter and oth-ers, 2005). The composite scaled sensitivities (CSS) were used
Figure 20. Measured and simulated equivalent water levels, with 1:1 correlation line, for transient conditions, Langford Basin, Fort Irwin National Training Center, California.
2,070
2,080
2,090
2,100
2,110
2,120
2,130
2,070 2,080 2,090 2,100 2,110 2,120 2,130
Mea
sure
d w
ater
leve
l, in
feet
abo
ve s
ea le
vel
Simulated equivalent water level, in feet above sea level
EXPLANATION
Well 26N1
All other wells
1:1 correlation line
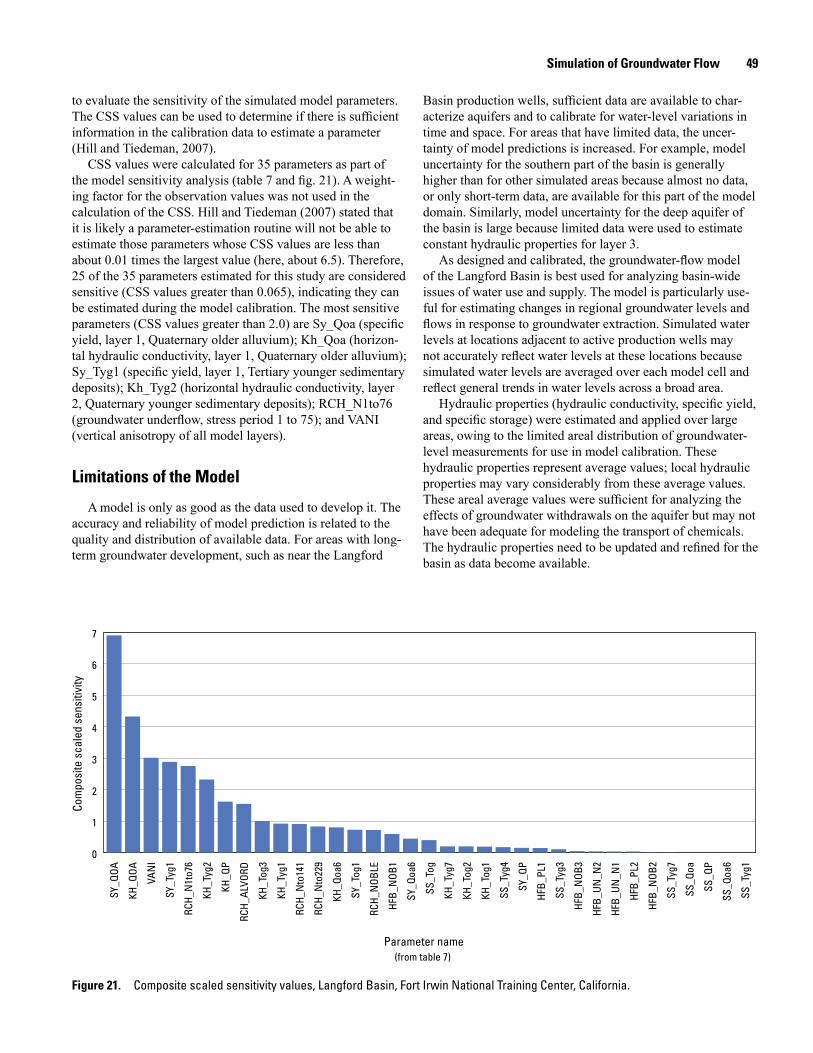
Simulation of Groundwater Flow 49
to evaluate the sensitivity of the simulated model parameters. The CSS values can be used to determine if there is sufficient information in the calibration data to estimate a parameter (Hill and Tiedeman, 2007).
CSS values were calculated for 35 parameters as part of the model sensitivity analysis (table 7 and fig. 21). A weight-ing factor for the observation values was not used in the calculation of the CSS. Hill and Tiedeman (2007) stated that it is likely a parameter-estimation routine will not be able to estimate those parameters whose CSS values are less than about 0.01 times the largest value (here, about 6.5). Therefore, 25 of the 35 parameters estimated for this study are considered sensitive (CSS values greater than 0.065), indicating they can be estimated during the model calibration. The most sensitive parameters (CSS values greater than 2.0) are Sy_Qoa (specific yield, layer 1, Quaternary older alluvium); Kh_Qoa (horizon-tal hydraulic conductivity, layer 1, Quaternary older alluvium); Sy_Tyg1 (specific yield, layer 1, Tertiary younger sedimentary deposits); Kh_Tyg2 (horizontal hydraulic conductivity, layer 2, Quaternary younger sedimentary deposits); RCH_N1to76 (groundwater underflow, stress period 1 to 75); and VANI (vertical anisotropy of all model layers).
Limitations of the Model
A model is only as good as the data used to develop it. The accuracy and reliability of model prediction is related to the quality and distribution of available data. For areas with long-term groundwater development, such as near the Langford
Basin production wells, sufficient data are available to char-acterize aquifers and to calibrate for water-level variations in time and space. For areas that have limited data, the uncer-tainty of model predictions is increased. For example, model uncertainty for the southern part of the basin is generally higher than for other simulated areas because almost no data, or only short-term data, are available for this part of the model domain. Similarly, model uncertainty for the deep aquifer of the basin is large because limited data were used to estimate constant hydraulic properties for layer 3.
As designed and calibrated, the groundwater-flow model of the Langford Basin is best used for analyzing basin-wide issues of water use and supply. The model is particularly use-ful for estimating changes in regional groundwater levels and flows in response to groundwater extraction. Simulated water levels at locations adjacent to active production wells may not accurately reflect water levels at these locations because simulated water levels are averaged over each model cell and reflect general trends in water levels across a broad area.
Hydraulic properties (hydraulic conductivity, specific yield, and specific storage) were estimated and applied over large areas, owing to the limited areal distribution of groundwater-level measurements for use in model calibration. These hydraulic properties represent average values; local hydraulic properties may vary considerably from these average values. These areal average values were sufficient for analyzing the effects of groundwater withdrawals on the aquifer but may not have been adequate for modeling the transport of chemicals. The hydraulic properties need to be updated and refined for the basin as data become available.
Figure 21. Composite scaled sensitivity values, Langford Basin, Fort Irwin National Training Center, California.
0
1
2
3
4
5
6
7
Parameter name(from table 7)
Com
posi
te s
cale
d se
nsiti
vity
SS_T
yg1
SS_Q
oa6
SS_Q
P
SS_Q
oa
SS_T
yg7
HFB_
NOB
2
HFB_
PL2
HFB_
UN_N
1
HFB_
UN_N
2
HFB_
NOB
3
SS_T
yg3
HFB_
PL1
SY_Q
P
SS_T
yg4
KH_T
og1
KH_T
og2
KH_T
yg7
SS_T
og
SY_Q
oa6
HFB_
NOB
1
RCH_
NOB
LE
SY_T
og1
KH_Q
oa6
RCH_
Nto
229
RCH_
Nto
141
KH_T
yg1
KH_T
og3
RCH_
ALVO
RD
KH_Q
P
KH_T
yg2
RCH_
N1t
o76
SY_T
yg1
VAN
I
KH_Q
OA
SY_Q
OA

50 Geohydrology, Geochemistry, Groundwater Simulation and Analysis of Potential Water-Supply Management Options
Para
met
er
grou
pPa
ram
eter
na
me
Para
met
er
valu
eU
nit
Para
met
er
desc
ript
ion
Mod
el
laye
rRe
fere
nce
for
para
met
er e
xten
t
Com
posi
te
scal
ed
sens
itivi
ty
Hyd
raul
ic c
ondu
ctiv
-ity
in th
e ho
rizon
tal
dire
ctio
n
KH
_QP
1.50
ft/d
Qua
tern
ary
play
a de
posi
ts1
Figu
re 1
6A, a
rea
whe
re k
= 1
.51.
62K
H_Q
OA
5.60
ft/d
Qua
tern
ary
olde
r allu
vium
1Fi
gure
16A
, are
a w
here
k =
5.6
4.34
KH
_Qoa
63.
00ft/
dQ
uate
rnar
y ol
der a
lluvi
um1
Figu
re 1
6A, a
rea
whe
re k
= 3
0.80
KH
_Tyg
15.
00ft/
dTe
rtiar
y yo
unge
r sed
imen
tary
dep
osits
1Fi
gure
16A
, are
a w
here
k =
50.
92K
H_T
yg2
3.00
ft/d
Terti
ary
youn
ger s
edim
enta
ry d
epos
its2
Figu
re 1
6B, a
rea
whe
re k
= 3
2.33
KH
_Tyg
72.
80ft/
dTe
rtiar
y yo
unge
r sed
imen
tary
dep
osits
2Fi
gure
16B
, are
a w
here
k =
2.8
0.20
KH
_Tog
12.
50ft/
dTe
rtiar
y ol
der s
edim
enta
ry d
epos
its1
Figu
re 1
6A, a
rea
whe
re k
= 2
.50.
19K
H_T
og2
2.20
ft/d
Terti
ary
olde
r sed
imen
tary
dep
osits
2Fi
gure
16B
, are
a w
here
k =
2.2
0.19
KH
_Tog
32.
00ft/
dTe
rtiar
y ol
der s
edim
enta
ry d
epos
its3
Figu
re 1
6C, a
rea
whe
re k
= 2
1.00
Verti
cal a
niso
tropy
VAN
I50
0D
imen
sion
less
All
sedi
men
ts in
laye
rs 1
, 2, a
nd 3
1, 2
, and
3Fi
gure
16A
, B, a
nd C
3.02
Spec
ific
stor
age
SS_Q
P1.
00E-
06ft-1
Qua
tern
ary
play
a de
posi
ts1
Figu
re 1
6A, a
rea
whe
re k
= 1
.50.
00SS
_Qoa
1.00
E-06
ft-1Q
uate
rnar
y ol
der a
lluvi
um1
Figu
re 1
6A, a
rea
whe
re k
= 5
.60.
00SS
_Qoa
61.
00E-
06ft-1
Qua
tern
ary
olde
r allu
vium
1Fi
gure
16A
, are
a w
here
k =
30.
00SS
_Tyg
11.
00E-
06ft-1
Terti
ary
youn
ger s
edim
enta
ry d
epos
its1
Figu
re 1
6A, a
rea
whe
re k
= 5
0.00
SS_T
yg3
1.00
E-06
ft-1Te
rtiar
y yo
unge
r sed
imen
tary
dep
osits
2Fi
gure
16B
, are
a w
here
k =
30.
11SS
_Tyg
41.
00E-
06ft-1
Terti
ary
youn
ger s
edim
enta
ry d
epos
its2
Figu
re 1
6B, a
rea
whe
re k
= 3
0.17
SS_T
yg7
1.00
E-06
ft-1Te
rtiar
y yo
unge
r sed
imen
tary
dep
osits
2Fi
gure
16B
, are
a w
here
k =
2.8
0.00
SS_T
og1.
00E-
06ft-1
Terti
ary
olde
r sed
imen
tary
dep
osits
1, 2
, and
3Fi
gure
15A
, B, a
nd C
, are
as la
bele
d To
g0.
39Sp
ecifi
c yi
eld
SY_Q
P0.
01D
imen
sion
less
Qua
tern
ary
play
a de
posi
ts1
Figu
re 1
6A, a
rea
whe
re k
= 1
.50.
15SY
_QO
A0.
1D
imen
sion
less
Qua
tern
ary
olde
r allu
vium
1Fi
gure
16A
, are
a w
here
k =
5.6
6.92
SY_Q
oa6
0.1
Dim
ensi
onle
ssQ
uate
rnar
y ol
der a
lluvi
um1
Figu
re 1
6A, a
rea
whe
re k
= 3
0.44
Spec
ific
yiel
dSY
_Tyg
10.
1D
imen
sion
less
Terti
ary
youn
ger s
edim
enta
ry d
epos
its1
Figu
re 1
6A, a
rea
whe
re k
= 5
2.89
SY_T
og1
0.1
Dim
ensi
onle
ssTe
rtiar
y ol
der s
edim
enta
ry d
epos
its1
Figu
re 1
6A, a
rea
whe
re k
= 2
.50.
73R
echa
rge
RC
H_A
LVO
RD
4.00
acre
-ft/y
rFi
gure
17,
ALV
OR
D a
rea
1.55
RC
H_N
OB
LE1.
80ac
re-f
t/yr
Figu
re 1
7, N
OB
LE a
rea
0.72
RC
H_N
1to7
66.
00ac
re-f
t/yr
Figu
re 1
7, u
nder
flow
stre
ss p
erio
d 1
to 7
52.
76R
CH
_Nto
141
40.0
0ac
re-f
t/yr
Figu
re 1
7, u
nder
flow
stre
ss p
erio
d 76
to 1
400.
91R
CH
_Nto
229
40.0
0ac
re-f
t/yr
Figu
re 1
7, u
nder
flow
stre
ss p
erio
d 14
1 to
229
0.83
Hor
izon
tal-fl
ow
barr
ier
HFB
_NO
B1
4.00
E-03
ft/d
1Fi
gure
16A
0.59
HFB
_NO
B2
1.00
E-05
ft/d
1Fi
gure
16A
0.01
HFB
_NO
B3
1.00
E-06
ft/d
2 an
d 3
Figu
re 1
6A0.
04H
FB_U
N_N
11.
00E-
06ft/
d1
Figu
re 1
6A0.
03H
FB_U
N_N
21.
00E-
06ft/
d2
and
3Fi
gure
16A
0.04
HFB
_PL1
1.00
E-02
ft/d
1Fi
gure
16A
0.14
HFB
_PL2
1.00
E-06
ft/d
1, 2
, and
3Fi
gure
16A
0.03
Tabl
e 7.
Ca
libra
ted
para
met
er v
alue
s us
ed in
the
calib
rate
d m
odel
, Lan
gfor
d Ba
sin,
For
t Irw
in N
atio
nal T
rain
ing
Cent
er, C
alifo
rnia
.[A
bbre
viat
ions
: acr
e-ft/
yr, a
cre-
feet
per
yea
r; k,
hor
izon
tal h
ydra
ulic
con
duct
ivity
; ft/d
, fee
t per
day
; ft-1
, 1 p
er fe
et]

Simulation of Groundwater Flow 51
Figure 22. Average 2001 to 2010 monthly groundwater withdrawal distribution for wells in Bicycle, Irwin, and Langford Basins providing water to Fort Irwin National Training Center, California.
As shown in this report, faults can have a major barrier effect on the flow of groundwater in the study area. Therefore, in order to accurately simulate groundwater flow, the location and hydraulic properties of the faults must be well understood. However, the locations and geometries of faults within the model domain are uncertain because limited data are avail-able for most of the study area. As more information becomes available, the modeled locations of faults may be revised, and additional faults may need to be included in the model.
Limited depth-dependent water-level data is a common problem for many groundwater basins. Existing multiple-well monitoring sites in the basin (fig. 2) provided valuable depth-dependent water-level and water-quality information. In 2011, a multiple-well monitoring site was installed in the southern part of the basin (12N/3E-01M1-5), which will provide data for a better understanding of groundwater flow in this area. Additional depth-dependent water-level data are needed in the northern and western parts of the basin. A multiple-well site in the northern part of the basin, near 13N/3E-14K1, could be used to help refine the estimate of groundwater underflow from the Irwin Basin to the Langford Basin.
A numerical model is only an approximation of the actual system and is based on average and estimated conditions. The accuracy and the reliability of the model are dependent on the accuracy of the data used to build the model and on the adequacy of the model to simulate the actual system. Despite limitations of the data and of the numerical method, no other approach is better than a groundwater model to integrate a wide variety of data from multiple sources and to develop concepts of a largely unseen system. Groundwater modeling is an iterative process with data and simulation complementing each other. As more data are collected, the model developed for this study could be updated and recalibrated to improve the understanding of the aquifer system.
Simulated Effects of Future Groundwater Withdrawals
The Fort Irwin NTC is considering various groundwater-withdrawal scenarios to manage their limited water resources in the Langford Basin. The calibrated Langford Basin groundwater-flow model was used to evaluate changes in groundwater-level altitudes (or water levels) under four differ-ent groundwater-withdrawal scenarios being considered by the Fort Irwin NTC for the period of the next 50 years (January 2011 through December 2060).
Description of Model ScenariosAll the model scenarios use the simulated December 2010
water levels as initial conditions. Groundwater recharge for all the model scenarios was assumed to be the same as the cali-brated 2010 conditions (table 5). The quantity of groundwater underflow from the Irwin Basin in future years may be less or more than the 2010 values depending on the water levels
0
2
4
6
8
10
12
Perc
ent o
f ave
rage
ann
ual w
ithdr
awal
s
MonthJan Feb Mar Apr May June July Aug Sept Oct Nov Dec
in the Irwin Basin. Groundwater underflow out of the basin is head-dependent and was simulated by the groundwater-flow model.
Scenario 1Scenario 1 assumes the 2010 annual rate of withdrawals
(about 900 acre-ft/yr) remains constant from 2011 to 2060. The monthly distribution of withdrawals was based on the average monthly withdrawals from all production wells in the Irwin, Bicycle, and Langford Basins for the 10-year period 2001–2010 (fig. 22). The monthly groundwater withdrawals for the Langford Basin were calculated by multiplying the 2010 total groundwater withdrawals (about 900 acre-ft/yr) from the Langford Basin by the average 2001–2010 monthly groundwater withdrawal distribution. The distribution of withdrawals for each production well was based on the 2001–2010 withdrawal history of each well. The distribution of withdrawals for each production well (the current name used by Fort Irwin NTC personnel is in parentheses after the State well name) was 15 percent at well 13N/3E-23P1(L-1), 34 percent at well 13N/3E-26K1(L-2), and 51 percent at well 13N/3E-35A1(L-3).
Scenario 2Scenario 2 assumes the same rate of withdrawals as in
Scenario 1 but assumes the withdrawals will be equally dis-tributed among the three existing wells and two new proposed wells screened in layer 1 that may be constructed in 2016 (the location of the proposed wells is shown on figure 23B). From January 2011 through December 2015, monthly withdrawal rates and distribution among the three wells calculated for Scenario 1 were used for the three existing Langford wells. From January 2016 through December 2060, the monthly withdrawal rates calculated for scenario 1 were equally distrib-uted among the three existing and two new proposed wells.

52 Geohydrology, Geochemistry, Groundwater Simulation and Analysis of Potential Water-Supply Management Options
UNNAMED NORTH FAULT
PLAYA FAULT
NOBLE DOME FAULT
COYOTE LAKE FAULT
?
COYOTE LAKE FAULT
NORTH NOBLE
DOME FAULT
GARLIC SPRING FAULT
?
??
?
?
?
?
?
SOUTH NOBLE DOME FAULT
EXPLANATION
Horizontal-flow barrier
Approximate groundwater basin boundary
A
Production
Simulated drawdown, in feet
23P1
Fault—Dashed where approximately located; queried where uncertain; dotted where concealed
?
Geology by D.M. Miller,unpublished data, 1994
1 2 KILOMETERS
1 2 MILES
0
0 R3E R4E
T13N
T12N
Nob
leDo
me
UD
U
D
UD
40
Extent of model layer 1
Well and number—Well identified by section number only; township and range is shown on this figure
23P1
26K1
35A1
40
50
60
30
70 50
30
60
40
40
70
Figure 23. Simulated drawdown from October 2010 conditions to October 2060 conditions for A, scenario 1; B, scenario 2; C, scenario 3; and D, scenario 4, Langford Basin, Fort Irwin National Training Center, California.

Simulation of Groundwater Flow 53
UNNAMED NORTH FAULT
PLAYA FAULT
NOBLE DOME FAULT
COYOTE LAKE FAULT
?
COYOTE LAKE FAULT
NORTH NOBLE
DOME FAULT
GARLIC SPRING FAULT
?
??
?
?
?
?
?
SOUTH NOBLE DOME FAULT
EXPLANATION
Horizontal-flow barrier
Approximate groundwater basin boundary
B
Production
Proposed
Simulated drawdown, in feet
23P1
Fault—Dashed where approximately located; queried where uncertain; dotted where concealed
?
Geology by D.M. Miller,unpublished data, 1994
1 2 KILOMETERS
1 2 MILES
0
0 R3E R4E
T13N
T12N
Nob
leDo
me
UD
U
D
UD
40
Extent of model layer 1
Well and number—Well identified by section number only; township and range is shown on this figure
23P1
26K1
35A1
40
6070
80
80
90
100
50
50
Figure 23. Simulated drawdown from October 2010 conditions to October 2060 conditions for A, scenario 1; B, scenario 2; C, scenario 3; and D, scenario 4, Langford Basin, Fort Irwin National Training Center, California.—Continued

54 Geohydrology, Geochemistry, Groundwater Simulation and Analysis of Potential Water-Supply Management Options
UNNAMED NORTH FAULT
PLAYA FAULT
NOBLE DOME FAULT
COYOTE LAKE FAULT
?
COYOTE LAKE FAULT
NORTH NOBLE
DOME FAULT
GARLIC SPRING FAULT
?
??
?
?
?
?
?
SOUTH NOBLE DOME FAULT
EXPLANATION
Horizontal-flow barrier
Approximate groundwater basin boundary
C
Production
Simulated drawdown, in feet
23P1
Fault—Dashed where approximately located; queried where uncertain; dotted where concealed
?
Geology by D.M. Miller,unpublished data, 1994
1 2 KILOMETERS
1 2 MILES
0
0 R3E R4E
T13N
T12N
Nob
leDo
me
UD
U
D
UD
40
Extent of model layer 1
Well and number—Well identified by section number only; township and range is shown on this figure
23P1
26K1
35A1
40
30
20
40
Figure 23. Simulated drawdown from October 2010 conditions to October 2060 conditions for A, scenario 1; B, scenario 2; C, scenario 3; and D, scenario 4, Langford Basin, Fort Irwin National Training Center, California.

Simulation of Groundwater Flow 55
UNNAMED NORTH FAULT
PLAYA FAULT
NOBLE DOME FAULT
COYOTE LAKE FAULT
?
COYOTE LAKE FAULT
NORTH NOBLE
DOME FAULT
GARLIC SPRING FAULT
?
??
?
?
?
?
?
SOUTH NOBLE DOME FAULT
EXPLANATION
Horizontal-flow barrier
Approximate groundwater basin boundary
D
Production
Proposed
Simulated drawdown, in feet
23P1
Fault—Dashed where approximately located; queried where uncertain; dotted where concealed
?
Geology by D.M. Miller,unpublished data, 1994
1 2 KILOMETERS
1 2 MILES
0
0 R3E R4E
T13N
T12N
Nob
leDo
me
UD
U
D
UD
40
Extent of model layer 1
Well and number—Well identified by section number only; township and range is shown on this figure
23P1
26K1
35A1
40
4050
60
30
70
40
Figure 23. Simulated drawdown from October 2010 conditions to October 2060 conditions for A, scenario 1; B, scenario 2; C, scenario 3; and D, scenario 4, Langford Basin, Fort Irwin National Training Center, California.—Continued
56 Geohydrology, Geochemistry, Groundwater Simulation and Analysis of Potential Water-Supply Management Options
Scenario 3Scenario 3 simulates a reduction of 3 percent per year in the
2010 withdrawal rate for 10 years, from January 2011 through December 2020. The 30-percent reduction in the 2010 with-drawal rate (about 630 acre-ft/yr) is then kept constant until 2060. The monthly distribution of groundwater withdrawals is the same as in Scenario 1, and the 3 percent per year reduction in withdrawals is equally distributed among the three existing Langford wells.
Scenario 4Scenario 4 simulates a reduction of 3 percent per year in
the 2010 withdrawal rate for 10 years and in withdrawals from two new proposed wells that will be constructed in 2016. From January 2011 to December 2015, the three existing Langford wells are simulated by using the monthly groundwa-ter withdrawal rates calculated in Scenario 1 with a reduction of 3 percent per year in the 2010 withdrawal rate for these 5 years. From January 2016 to December 2020, the December 2015 withdrawal rate (15 percent of the 2010 withdrawal rate) is reduced by 3 percent per year for 5 years and distributed equally among the three existing wells and two new proposed wells. From January 2021 to December 2060, the 30-percent reduction in the 2010 withdrawal rate (about 630 acre-ft/yr) is then kept constant and distributed equally among the five production wells.
Results of Model ScenariosResults of the simulations are presented as drawdown
maps for October 2010 to October 2060 for model layer 1 to compare simulated values after the high summer groundwater withdrawals (fig. 23). A positive value for drawdown (as they all are) indicates the simulated hydraulic head has declined from 2010 to 2060. Graphs showing the simulated heads from 1992 to 2060 at selected well locations are presented in figures 24–27 for each of the scenarios. Scenario withdrawals and results are summarized in table 8.
Scenario 1Scenario 1 simulated that the 2010 annual rate of with-
drawal (about 900 acre-ft/yr) remained constant from 2011 to 2060, for a cumulative withdrawal of about 45,000 acre-ft. Continuation of the 2010 withdrawal rate is simulated to result in 60 to 73 ft of drawdown in hydraulic head in the central part of the basin where the three production wells are located and less than 50 ft of drawdown in the northern and southern parts of the basin (fig. 23A and table 8). These simulated draw-downs are in addition to the decline in water levels that took place from 1992 to 2010, and are referred to in this report as additional drawdown (fig. 18E). Near the production wells, the water-level declines prior to 2011 (20-40 ft) and the simulated
drawdown from 2011 to 2060 (about 70 ft) are projected to decrease the predevelopment saturated thickness of the upper aquifer (layer 1) by about 40 to 45 percent (fig. 24). The simu-lated drawdown will result in water levels falling below the top of the well screen in all of the production wells (fig. 24).
Scenario 2Scenario 2 simulated the same rate of withdrawal as in
Scenario 1 but assumes the withdrawals will be equally distributed among the three existing wells and two new proposed wells that will be constructed in 2016. The cumula-tive simulated withdrawals were about 45,000 acre-ft with 28,800 acre-ft of withdrawals occurring in the three existing wells in the central part of the basin and about 8,100 acre-ft of withdrawals occurring in each of the new proposed wells in the northern and southern parts of the basin. Reducing the withdrawals in the central part of the basin by redistributing the 2010 withdrawal rate to two additional pumping wells in 2016 reduces the simulated additional drawdown in the central part of the basin from a range of 60 to 73 ft in Scenario 1 to about 40 to 64 ft in Scenario 2 (fig. 23A and 23B, and table 8). Redistributing withdrawals to the northern and southern parts of the basin results in about 110 ft of additional drawdown at the proposed new well in the north and about 55 ft at the proposed new well in the south (fig. 23B). Redistributing groundwater withdrawals to the northern part of the basin has a large effect on the simulated drawdowns because the area is relatively small and is bounded by low permeability faults. Near the proposed production well in the northern part of the basin, the water-level declines prior to 2011 (about 5 ft) and the simulated drawdown from 2011 to 2060 (about 110 ft) are projected to decrease the predevelopment saturated thickness of the upper aquifer (layer 1) by about 60 percent (fig. 25B and table 8). The simulated drawdown will result in water levels falling below the top of the well screen in the proposed new production well in the northern part of the basin (fig. 25B).
Scenario 3Scenario 3 simulated a reduction of 30 percent in withdraw-
als from 2011 to 2020 and then a constant rate from 2021 to 2060. The total volume of simulated groundwater withdrawals was reduced from about 45,000 acre-ft in Scenarios 1 and 2 to about 32,720 acre-ft in Scenario 3. The simulated reduction in groundwater withdrawals resulted in about 45 ft of additional drawdown in the central part of the basin near the pumping wells compared to about 73 ft in Scenario 1 (fig. 23A and 23C, and table 8). The reduction in groundwater withdrawals reduced the simulated additional drawdown in the northern and southern parts of the basin by about 10 ft (fig. 23A, and 23C). The reduction in groundwater withdrawals, simulated in Scenario 3, would reduce the rate of depletion of the saturated thickness of the upper aquifer compared to Scenario 1 (figs. 24 and 26).

Simulation of Groundwater Flow 57
Figure 24. Simulated hydrographs from scenario 1, Langford Basin, Fort Irwin National Training Center, California.
Historical Projected
1,900
1992 1996 2000 2004 2008 2012 2016 2020 2024 2028 2032 2036 2040 2044 2048 2052 2056 2060
2,000
2,100
2,200
Layer 2 Layer 1
Well 23P1
Top of well screen Bottom of layer 1
Altitude of land surface
1,900
1992 1996 2000 2004 2008 2012 2016 2020 2024 2028 2032 2036 2040 2044 2048 2052 2056 2060
2,000
2,100
2,200
Altit
ude,
in fe
et
Altitude of land surface
1,900
1992 1996 2000 2004 2008 2012 2016 2020 2024 2028 2032 2036 2040 2044 2048 2052 2056 2060
2,000
2,100
2,200
Layer 2 Layer 1
Well 35A1
Top of well screen Bottom of layer 1
Altitude of land surface
1,900
1992 1996 2000 2004 2008 2012 2016 2020 2024 2028 2032 2036 2040 2044 2048 2052 2056 2060
2,000
2,100
2,200
Layer 2 Layer 1
Well 35J2, J3
Top of well screen Bottom of layer 1
Altitude of land surface
Year
Layer 2 Layer 1
Well 26K1
Top of well screen Bottom of layer 1

58 Geohydrology, Geochemistry, Groundwater Simulation and Analysis of Potential Water-Supply Management Options
Figure 25. Simulated hydrographs from scenario 2, Langford Basin, Fort Irwin National Training Center, California.
Historical Projected
Historical Projected
1,900
2,000
2,100
2,200
Layer 2 Layer 1
Well 23P1
Top of well screen Bottom of layer 1
Altitude of land surface
1,900
2,000
2,100
2,200
Altit
ude,
in fe
et
Altitude of land surface
1,900
2,000
2,100
2,200
Layer 2 Layer 1
Well 35A1
Top of well screen Bottom of layer 1
Altitude of land surface
Layer 2 Layer 1
Well 26K1
Top of well screen Bottom of layer 1
1,900
2,000
2,100
2,200 Altitude of land surface
1,900
1992 1996 2000 2004 2008 2012 2016 2020 2024 2028 2032 2036 2040 2044 2048 2052 2056 2060
2,000
2,100
2,200Altitude of land surface
Year
Layer 2 Layer 1
Southern proposed well
Top of well screen Bottom of layer 1
Layer 2 Layer 1
Northern proposed well
Top of well screen Bottom of layer 1

Simulation of Groundwater Flow 59
Scenario 4Scenario 4 simulates a reduction in withdrawals of about
12,280 acre-ft compared to Scenario 1 and assumes the with-drawals will be equally distributed among the three existing wells and two new proposed wells that will be constructed in 2016, from 2016 to 2060. The cumulative simulated with-drawals were about 32,720 acre-ft with about 21,270 acre-ft of withdrawals occurring in the three existing wells in the central part of the basin and about 5,725 acre-ft of withdrawals occurring in each of the new proposed wells in the northern
and southern parts of the basin. The combination of reduc-ing and redistributing the cumulative withdrawals resulted in about 40 ft of additional drawdown in the central and southern parts of the basin and about 70 ft in the northern part of the basin (fig. 23D and table 8). The results of Scenario 4 show that reducing and redistributing the groundwater withdrawals would maintain the upper aquifer at greater than 50 percent of its predevelopment saturated thickness throughout the ground-water basin (fig. 27).
Table 8. Summary of four model scenarios in the Langford Basin, Fort Irwin National Training Center, California.[NA, not applicable]
Scenarionumber
Description of scenario
Figure number where
drawdown is shown for scenario
Annual withdrawal
rate (acre-feet/year)
30 percent reduced 2010 withdrawal
rate (acre-feet/year)
Total simulated groundwater withdrawals from January
2011 to December
2060 (acre-feet)
Maximun drawdown (feet)
Northern part of basin
(area northeast of unnamed
fault and playa fault)
Central part of basin
(area west of unnamed fault
and north of Noble Dome
Fault)
Southern part of basin
(area south of Noble Dome
Fault)
1 2010 annual rate of withdrawal remains constant from 2011 to 2060.
23A 900 NA 45,000 50 73 51
2 2010 annual rate of withdrawal is equally distributed among the three existing wells and two new proposed wells beginning in January 2016.
23B 900 NA 45,000 110 64 55
3 A 3 percent per year reduction in the 2010 withdrawal rate for 10 years, from January 2011 to December 2020. The 30 percent reduced 2010 withdrawal rate is then kept constant until 2060. The 3 percent per year reduction in withdrawals is equally distributed among the three existing wells.
23C 630–873 630 32,720 28 45 37
4 From January 2011 to December 2015, the three existing Langford wells are simulated using the monthly groundwa-ter withdrawal rates calculated in Sce-nario 1 with a reduction of 3 percent per year in the 2010 withdrawal rate. From January 2016 to December 2020, the December 2015 withdrawal rate (15 percent of the 2010 withdrawal rate) is reduced by 3 percent per year for 5 years and distributed equally among the three existing wells and two new proposed wells. From January 2021 to 2060, the 30 percent reduced 2010 withdrawal rate is then kept constant and distributed equally among the five production wells.
23D 630–873 630 32,720 71 40 40

60 Geohydrology, Geochemistry, Groundwater Simulation and Analysis of Potential Water-Supply Management Options
Figure 26. Simulated hydrographs from scenario 3, Langford Basin, Fort Irwin National Training Center, California.
Historical Projected
1,900
1992 1996 2000 2004 2008 2012 2016 2020 2024 2028 2032 2036 2040 2044 2048 2052 2056 2060
2,000
2,100
2,200
Layer 2 Layer 1
Well 23P1
Top of well screen Bottom of layer 1
Altitude of land surface
1,900
1992 1996 2000 2004 2008 2012 2016 2020 2024 2028 2032 2036 2040 2044 2048 2052 2056 2060
2,000
2,100
2,200
Altit
ude,
in fe
et
Altitude of land surface
1,900
1992 1996 2000 2004 2008 2012 2016 2020 2024 2028 2032 2036 2040 2044 2048 2052 2056 2060
2,000
2,100
2,200
Layer 2 Layer 1
Well 35A1
Top of well screen Bottom of layer 1
Altitude of land surface
1,900
1992 1996 2000 2004 2008 2012 2016 2020 2024 2028 2032 2036 2040 2044 2048 2052 2056 2060
2,000
2,100
2,200
Layer 2 Layer 1
Well 35J2,J3
Top of well screen Bottom of layer 1
Altitude of land surface
Year
Layer 2 Layer 1
Well 26K1
Top of well screen Bottom of layer 1
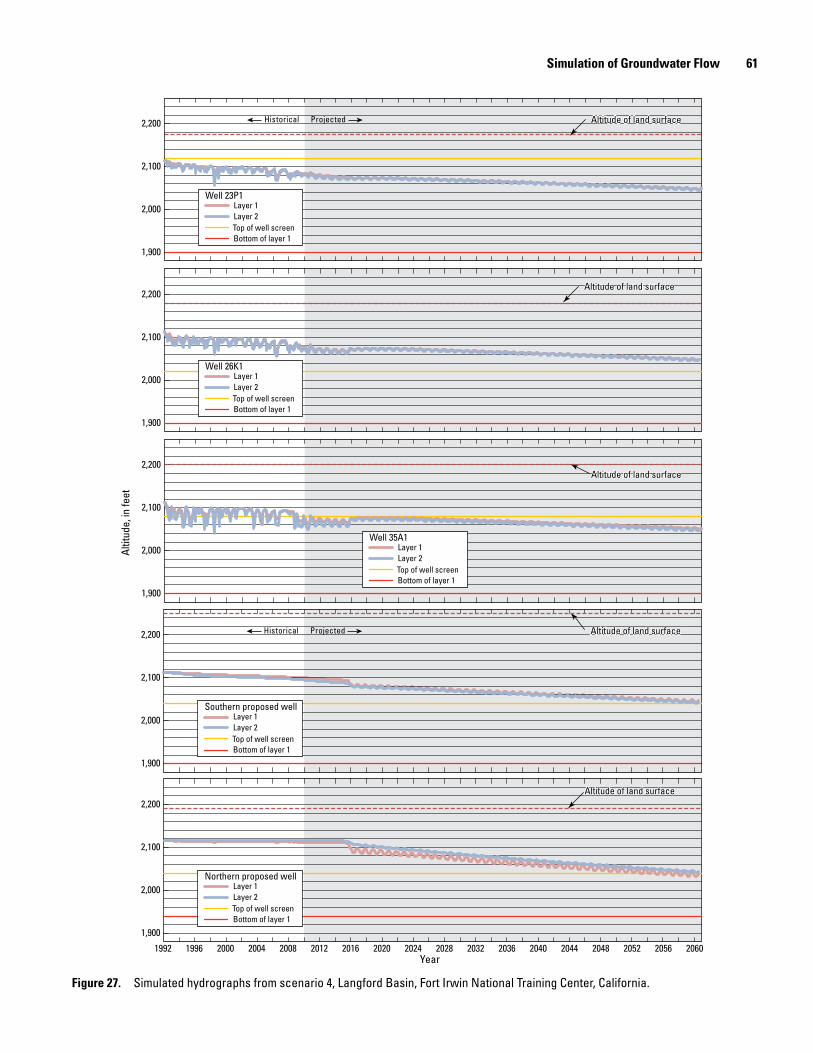
Simulation of Groundwater Flow 61
Figure 27. Simulated hydrographs from scenario 4, Langford Basin, Fort Irwin National Training Center, California.
Historical Projected
Historical Projected
1,900
2,000
2,100
2,200
Layer 2 Layer 1
Well 23P1
Top of well screen Bottom of layer 1
Altitude of land surface
1,900
2,000
2,100
2,200
Altit
ude,
in fe
et
Altitude of land surface
1,900
2,000
2,100
2,200
Layer 2 Layer 1
Well 35A1
Top of well screen Bottom of layer 1
Altitude of land surface
Layer 2 Layer 1
Well 26K1
Top of well screen Bottom of layer 1
1,900
2,000
2,100
2,200 Altitude of land surface
1,900
1992 1996 2000 2004 2008 2012 2016 2020 2024 2028 2032 2036 2040 2044 2048 2052 2056 2060
2,000
2,100
2,200Altitude of land surface
Year
Layer 2 Layer 1
Southern proposed well
Top of well screen Bottom of layer 1
Layer 2 Layer 1
Northern proposed well
Top of well screen Bottom of layer 1
62 Geohydrology, Geochemistry, Groundwater Simulation and Analysis of Potential Water-Supply Management Options
Summary and ConclusionsGroundwater withdrawals from the Langford Basin began
in April 1992. By the end of December 2010, approximately 12,320 acre-ft of water had been withdrawn from the basin and transported to Irwin Basin. During this period, water levels in the basin decreased by as much as 40 ft and a cone of depression developed around the three production wells.
The USGS collected geohydrologic data to determine the quantity and quality of groundwater available in the basin. Water levels were measured and water-quality samples were collected from existing wells in the basin. Eleven monitor wells also were installed at five sites within the basin. Ground-water quality within the basin was assessed on the basis of col-lected water-quality samples. Potential sources of poor-quality groundwater also were identified. Geophysical investigations included a gravity survey to determine the altitude of the top of the basement complex, a seismic refraction survey to delin-eate depths to the Quaternary-Tertiary interface along three transects within the basin, and time-domain electromagnetic induction surveys to map the Quaternary-Tertiary interface and depth to the water table, as well as changes in water salinity with depth. Construction data, lithologic logs, and geophysi-cal logs also were collected for all wells in the basin. On the basis of this information, a hydrogeologic framework for the Langford Basin was developed.
Langford Basin has a relatively flat floor surrounded by generally rugged hills and mountains. The basin has a surface drainage area of about 50 mi2, and the floor of the basin covers about 11 mi2. The hills and mountains that surround the basin consist of a nearly impermeable complex of pre-Tertiary gra-nitic and metamorphic rocks, referred to as the basement com-plex. A gravity survey shows there are three deep areas within the Langford Basin where the depth to the basement complex exceeds 1,000 ft. The deepest area is beneath Langford Well Lake (dry) playa in the northeastern part of the basin. The other two deep areas are about 1 mi southwest and 2 mi south of the playa. The basin, from bottom to the top, is filled with Tertiary sedimentary deposits, Quaternary-Tertiary older alluvium, and Quaternary younger alluvium. The Tertiary sedimentary deposits, Quaternary-Tertiary older alluvium, and Quaternary younger alluvium form the water-bearing deposits in the Langford Basin. These deposits are unconsolidated at land surface and become semi-consolidated to consolidated with depth.
The Langford Basin aquifer system consists of three aqui-fers, referred to as the upper aquifer, middle aquifer, and lower aquifer. The upper aquifer is composed of the saturated part of the younger Quaternary alluvium and the Quaternary older alluvium and generally is unconfined. The upper aquifer has a saturated thickness of about 200 ft in the central part of the basin and pinches out at the margins of the basin. The middle aquifer is composed of Tertiary younger sedimentary depos-its and generally is confined or partly confined. The middle aquifer is as much as 440 ft thick and is generally less perme-able than the upper aquifer. The lower aquifer is composed of
Tertiary older sedimentary deposits, and the thickness ranges from 40 to 1,000 ft. The base of the lower aquifer system is considered to be the top of the basement complex.
Data collected for this study, including gravity surveys, water-level measurements, and groundwater-flow model cali-bration, were used to refine the location of mapped faults and define previously unmapped faults within the Langford Basin. The Garlic Spring Fault is a northwest-southeast trending fault near the northeastern boundary of the basin, where the base-ment complex is uplifted on the northeast side of the fault. The Noble Dome Fault, an east-west trending fault, is projected to extend from Noble Dome into the Langford Basin, and is a barrier to groundwater flow between the central and south-ern parts of the basin. The Coyote Lake Fault is an east-west trending fault in the southern part of the basin. The basement complex and Tertiary sedimentary deposits are uplifted on the southern side of the fault. Data are not available to determine if the Coyote Lake Fault is a barrier to groundwater flow. Two additional faults, referred to as the Playa and unnamed north faults, were identified in the northern part of the Langford Basin on the basis of water-level and gravity data. These two faults appear to impede the flow of groundwater between the north and central parts of the basin.
The principal recharge to the Langford Basin is ground-water underflow from the Irwin Basin, which ranged from about 50 acre-ft/yr during pre-development conditions to about 105 acre-ft/yr in 1999. Groundwater evapotranspiration by pheatophytes near Garlic Springs probably reduces the quantity of groundwater underflow from the Irwin Basin that recharges the Langford Basin. Because annual precipitation is less than 7 in, recharge derived from precipitation is minimal.
Before groundwater development began in 1992, ground-water underflow from the northeastern part of the Langford Basin to the West Cronise Basin was the only discharge from the basin. Evaporation of groundwater beneath Langford Well Lake (dry) playa is negligible because the water table is more than 30 ft below land surface. Prior to 1992, the Langford Basin was considered to be in steady-state conditions with discharge equal to recharge to the basin.
Groundwater withdrawals in Langford Basin began in 1992 when three production wells were constructed in the central part of the basin. Groundwater withdrawn from the wells is transported through a pipeline to Irwin Basin, where it is blended with the water withdrawn from Irwin and Bicycle Basins and is used in the Irwin Basin. None of the water that is withdrawn from Langford Basin is used in or returned to the Langford Basin. Between April 1992 and December 2010, an average of 648 acre-ft/yr of water was withdrawn from the Langford Basin.
From 1992 to 2010, approximately 12,310 acre-ft of water were withdrawn from the three production wells in the basin. Groundwater withdrawals have resulted in a cone of depres-sion near production wells in the central part of the basin. From 1992 to 2010, water-level declines were measured at all wells in the Langford Basin, with as much as 40 ft in the cone of depression in the central part of the basin.

Summary and Conclusions 63
Water-quality samples were collected from 16 wells and 1 spring in Langford Basin during 1993–2010. The predominant ions in the groundwater were Na, HCO3, SO4, and Cl. Since the initiation of groundwater withdrawals in 1992, the quality of groundwater at well 13N/3E-35A1 degraded slightly as a result of increasing concentrations of sulfate and chloride. The stable isotopes of oxygen and hydrogen are isotopically lighter than modern-day precipitation and, thus, were recharged under conditions that were cooler than present-day conditions. Analyses of tritium and carbon-14 indicate that most of the groundwater in the basin was recharged prior to 1952 and has an apparent age of 12,500 to 30,000 years.
A transient groundwater-flow model of the Langford Basin that simulates hydrologic conditions from predevelopment to March 2011 was constructed to evaluate current groundwater conditions and to aid in planning to meet future groundwa-ter needs at the base. Measured groundwater-level declines since the initiation of withdrawals were simulated with the calibrated groundwater-flow model. Recharge to the basin is estimated to be about 46 acre-ft/yr, including approximately 6 acre-ft/yr of natural recharge derived from precipitation runoff and as much as 40 acre-ft/yr of underflow from the Irwin Basin. This recharge is well below the amount needed to replenish the groundwater being withdrawn from the Langford Basin and results in a simulated net loss of about 11,670 acre-ft of groundwater storage within the basin.
The calibrated model was used to assess the effect of four groundwater-withdrawal scenarios on the groundwater-flow system in the Langford Basin. The four groundwater-with-drawal scenarios simulate conditions from 1992 to December 2060. Scenario 1 simulated the continuation of the 2010 with-drawal rate in the three existing production wells in the central part of the basin. The continuation of the 2010 withdrawal rate resulted in an additional 70 feet of drawdown in hydraulic head in the central part of the basin where the three production wells are located. Scenario 2 simulated the redistribution of the 2010 withdrawal rate equally to the three existing produc-tion wells in the central part of the basin and two new produc-tion wells in the northern and southern parts of the basin from 2016 through 2060. The redistribution of the 2010 withdrawal
rate in Scenario 2 resulted in about 10 feet less drawdown in the central part of the basin but about 110 feet of additional drawdown in the new well in the northern part of the basin and about 55 ft of additional drawdown in the new well in the southern part of the basin when compared to scenario 1 results. Scenario 3 simulated reducing the withdrawals from the three existing production wells in the central part of the basin from about 45,000 acre-feet (Scenario 1) to about 32,720 acre-feet. The reduction in withdrawal rate resulted in an additional drawdown of about 45 feet in the central part of the basin near the pumping wells when compared to January 2011 water levels and about 25 feet less than in Scenario 1. Scenario 4 simulates a reduction of 3 percent per year in the 2010 with-drawal rate for 10 years, similar to Scenario 3 and two new proposed wells that will be constructed in 2016. From January 2011 to December 2015, the three existing Langford wells are simulated using the monthly groundwater withdrawal rates calculated in Scenario 1 with a reduction of 3 percent per year in the 2010 withdrawal rate for 5 years . From January 2016 to December 2020, the 3 percent per year reduction in the 2010 withdrawal rate for 5 years is distributed equally among the three existing wells and two new proposed wells. The 30 percent reduced 2010 withdrawal rate (about 630 acre-ft/yr) is then kept constant until 2060 and distributed equally among the five production wells. The combination of reducing and redistributing the cumulative withdrawals resulted in an addi-tional drawdown of about 40 feet in the central and southern parts of the basin and about 70 feet in the northern part of the basin when compared to January 2011 water levels. The results of Scenario 4 show that reducing and redistributing the groundwater withdrawals would maintain the upper aquifer at greater than 50 percent of its predevelopment saturated thick-ness throughout the groundwater basin.
The groundwater-withdrawal scenarios simulated for this study demonstrate how the calibrated model can be utilized to evaluate the hydrologic factors of different water-management strategies. A simulation-optimization model could be devel-oped to systematically evaluate the hydrologic and economic aspects of different water-management strategies.

64 Geohydrology, Geochemistry, Groundwater Simulation and Analysis of Potential Water-Supply Management Options
References Cited
Anderson, M.P., and Woessner, W.W., 1991, Applied ground-water modeling—Simulation of flow and advective trans-port: San Diego, California, Academic Press, Inc., 381 p.
Berenbrock, Charles, and Schroeder, R.A., 1994, Ground-water flow and quality, and geochemical processes, in Indian Wells Valley, Kern, Inyo, and San Bernardino Coun-ties, California, 1987–88: U.S. Geological Survey Water-Resources Investigations Report 93–4003, 59 p.
Beukins, R.P., 1992, Radiometric accelerator mass spectrom-etry—Background, precision, and accuracy, in Taylor, R.E., Long, Austin, and Kra, R.S., eds., Radiocarbon after four decades—An interdisciplinary perspective: New York, Springer-Verlag, p. 230–239.
Brunt, R., Vasak, L., and Griffioen, J., 2004, Fluoride in groundwater—Probability of occurrence of excessive concentration of global scale: International Groundwater Resources Assessment Centre, UNESCO, Report number SP 2004-2, accessed August 15, 2012, at http://www.un-igrac.org/publications/147#.
Byers, F.M., Jr., 1960, Geology of the Alvord Mountain quad-rangle, San Bernardino County, California: U.S. Geological Survey Bulletin 1089-A, 71 p.
California Irrigation Management Information System, 2011, CIMAS Data: California Department of Water Resources, Office of Water Use Efficiency, accessed August 18, 2011, at http://www.cimis.water.ca.gov/cimis/data.jsp.
C.F. Hostrup and Associates, 1955, Water resources survey, Camp Irwin, California: 109 p.
Coplen, T.B., 1994, Reporting of stable hydrogen, carbon, and oxygen isotopic abundances: Pure and Applied Chemistry, v. 66, p. 273–276.
Coplen, T.B., Wildman, J.D., and Chen, J., 1991, Improve-ments in the gaseous hydrogen-water equilibrium technique for hydrogen isotope ratio analysis: Analytical Chemistry, v. 63, p. 910–912.
Craig, Harmon, 1961, Isotopic variation in meteoric waters: Science, v. 133, p. 1702–1703.
Densmore, J.N., 2003, Simulation of ground-water flow in the Irwin Basin aquifer system, Fort Irwin National Training Center, California: U.S. Geological Survey Water-Resources Investigations Report 02–4264, 69 p.
Densmore, J.N., and Bohlke, J.K., 2000, Use of nitrogen isotopes to determine nitrate contamination in two desert basins in California: Interdisciplinary perspectives on drink-ing water risk assessment and management: Proceedings of the Santiago (Chile) Symposium, September 1998, Interna-tional Association of Hydrological Sciences Publication no. 260, p. 63–73.
Densmore, J.N., and Londquist, C.J., 1997, Ground-water hydrology and water quality of Irwin Basin at Fort Irwin National Training Center, California: U.S. Geological Sur-vey Water-Resources Investigations Report 97–4092, 159 p.
Donahue, D.J., Linick, T.W., and Jull, A.J.T., 1990, Isotope-ratio and background corrections for accelerator mass spectrometry radiocarbon measurements: Radiocarbon, v. 32, book 2, p. 135–142.
Driscoll, F.G., 1986, Groundwater and wells: St. Paul, Min-nesota, Johnson Division, p. 168–200.
EarthInfo, Inc., 1995, National Climatic Data Center summary of the day—West 1994: Boulder, Colorado, EarthInfo, Inc., CD-ROM.
EarthInfo, Inc., 2000, EarthInfo CD2 reference manual—for all EarthInfo CD-Rom databases: Boulder, Colorado, Earth-Info, Inc.
Epstein, Samuel, and Mayeda, T.K., 1953, Variation of O-18 content of water from natural sources: Geochimica et Cos-mochimica Acta, v. 4, p. 213–224.
Fishman, M.J., ed., 1993, Methods of analysis by the U.S. Geological Survey National Water Quality Laboratory—Determination of inorganic and organic constituents in water and fluvial sediments: U.S. Geological Survey Open-File Report 93–125, 217 p.
Fishman, M.J., and Friedman, L.C., eds., 1989, Methods for determination of inorganic substances in water and fluvial sediments: U.S. Geological Survey Techniques of Water-Resources Investigations, book 5, chap. A1, 545 p.
Flint, R.F., 1971, Glacial and Quaternary geology: New York, John Wiley and Sons, 892 p.
Fournier, R.O., and Thompson, J.M., 1980, The recharge area for the Coso, California, geothermal system deduced from δD and δ18O in thermal and nonthermal waters in the region: U.S. Geological Survey Open-File Report 80–454, 27 p.
Freeze, R.A., and Cherry, J.A., 1979, Groundwater: Engle-wood, New Jersey, Prentice-Hall, Inc., 604 p.
Friedman, I., Smith, G.I., Gleason, J.D., Warden, A., and Harris, J.M., 1992, Stable isotope composition of waters in southeastern California, 1. Modern precipitation: Journal of Geophysical Research, v. 97, no. D5, p. 5,795–5,812.

References Cited 65
Gagnon, A.R., and Jones, G.A., 1993, AMS-graphite target production methods at the Woods Hole Oceanographic Institution during 1986–1991: Radiocarbon, v. 35, no. 2, p. 301–310.
Garbarino, J.R., 1999, Methods of analysis by the U.S. Geological Survey National Water Quality Laboratory—Determination of dissolved arsenic, boron, lithium, sele-nium, strontium, thallium, and vanadium using inductively coupled plasma-mass spectrometry: U.S. Geological Survey Open-File Report 99–93, 31 p.
Gonfiantini, R., 1978, Standards for stable isotope measure-ments in natural compounds: Nature, v. 271, p. 534–536.
Harbaugh, A.W., 2005, MODFLOW-2005, The U.S. Geologi-cal Survey modular ground-water model—The ground-water flow process: U.S. Geological Survey Techniques and Methods, book 6, chap. A16 [variously paged].
Hem, J.D., 1992, Study and interpretation of the chemical characteristics of natural water (3d ed.): U.S. Geological Survey Water-Supply Paper 2254, 263 p.
Hill, M.C., and Tiedeman, C.R., 2007, Effective groundwa-ter model calibration, with analysis of data, sensitivities, predictions and uncertainty: New York, John Wiley & Sons, 455 p.
Hsieh, P.A., and Freckleton, J.R., 1993, Documentation of a computer program to simulate horizontal-flow barriers using the U.S. Geological Survey’s modular three-dimensional finite-difference ground-water flow model: U.S. Geological Survey Open-File Report 92–477, 32 p.
Izbicki, J.A., Martin, P.M., and Michel, R.L., 1995, Source, movement, and age of ground water in the upper part of the Mojave River Basin, California, U.S.A., in Adar, E.M., and Leibundget, Christian, eds., Application of tracers in arid zone hydrology: International Association of Hydrological Sciences, no. 232, p. 43–56.
Izbicki, J.A., Radyk, J., and Michel, R.L., 2000, Water move-ment through a thick unsaturated zone underlying an inter-mittent stream in the Mojave Desert, southern California, USA; Journal of Hydrology, v. 238, no. 3-4, p. 194–217.
Izbicki, J.A., 2004, Source and movement of ground water in the western part of the Mojave Desert, southern California, USA: U.S. Geological Survey Water-Resources Investiga-tions Report 03–4313, 28 p.
James M. Montgomery and Associates, 1981, Water supply investigation, Fort Irwin, San Bernardino, California. Phase II, Final report on groundwater basin development and man-agement: Consultant’s report prepared for and in the files of the U.S. Army Corps of Engineers [variously paged].
Kalin, R.M., 2000, Radiocarbon dating, in Cook, P.G., and Herczeg, A.L., eds., Environmental tracers in subsurface hydrology: Boston, Massachusetts, Kluewer Academic Publishers, p. 111–144.
Keys, W.S., and MacCary, L.M., 1971, Application of bore-hole geophysics to water-resources investigations: U.S. Geological Survey Techniques of Water-Resources Investi-gations Report, book 2, chap. E1, 126 p.
Konikow, L.F., Hornberger, G.Z., Halford, K.J., and Hanson, R.T., 2009, Revised multi-node well (MNW2) package for MODFLOW groundwater-flow model: U.S. Geological Sur-vey Techniques and Methods, book 6, chap. A30, 67 p.
Kunkel, Fred, and Riley, F.S., 1959, Geologic reconnaissance and test-well drilling, Camp Irwin, California: U.S. Geo-logical Survey Water-Supply Paper 1460-F, p. 233–271.
Levy, D.B., Schramke, J.A., Esposito, K.J., Erickson, T.A., and Moore, J.C., 1999, The shallow ground water chemistry of arsenic, fluorine, and major elements—Eastern Owens Lake, California: Applied Geochemistry, v. 14, no. 1, p. 53–65.
McCulloh, T.H., 1960, Geologic map of the Lane Mountain quadrangle, California: U.S. Geological Survey Open-File Report 60–95, scale 1:62,500.
McLain, B.J., 1993, Methods of analysis by the U.S. Geologi-cal Survey National Water Quality Laboratory—Determi-nation of chromium in water by graphite furnace atomic absorption spectrophotometry: U.S. Geological Survey Open-File Report 93–449, 16 p.
Michel, R.L., 1976, Tritium inventories of the world oceans and their implications: Nature, v. 263, p. 103–106.
Miller, D.M., Menges, C.M., and Lidke, D.J., 2013, General-ized surficial geologic map of the Fort Irwin area, San Ber-nardino County, California: in Buesch, D.C., ed., Geology and geophysics applied to groundwater hydrology at Fort Irwin National Training Center, California, U.S. Geological Survey Open-File Report 2013–1024.
Miller, D.M., and Yount, J.C., 2002, Late Cenozoic tectonic evolution of the north-central Mojave Desert inferred from fault history and physiographic evolution of the Fort Irwin area, California: Boulder, Colorado, Geological Society of America Memoir, v. 195, p. 173–197.
Miller, D.M., Yount, J.C., Schermer, E.R., and Felger, T.J., 1994, Preliminary assessment of the recency of faulting at southwestern Fort Irwin, north-central Mojave Desert, California: San Bernardino County Museum Association Special Publications 94-1, p. 41–52.

66 Geohydrology, Geochemistry, Groundwater Simulation and Analysis of Potential Water-Supply Management Options
Mook, W.G., 1980, The dissolution-exchange model for dating of groundwater with 14C, in Fritz, P., and Fontes, J.C., eds., Handbook of environmental isotopes geochemistry: Amster-dam, Elsevier Science Publishing Company, v. 1, p. 50–74.
Morin, R.L., 2000, Basement structure beneath Langford Well Lake Basin, Fort Irwin, California, based on inversion of gravity data: U.S. Geological Survey Open-File Report 00-518, 13 p.
Munsell Color, 1975, Munsell soil color charts: Baltimore, Maryland., Munsell Color, Macbeth Division of Kollmor-gen Corporation, 27 p.
National Oceanic and Atmospheric Administration, 1994, Climatological data, annual summary, California, 1994: Asheville, North Carolina, v. 98, no. 13.
National Oceanic and Atmospheric Administration, 2008, Annual climatological summary, U.S.: National Climatic Data Center, accessed April 3, 2008, at http://www.ncdc.noaa.gov/.
National Research Council, 1947, Report of the subcommitee on sediment terminology: Eos, Transactions, American Geophysical Union, Abstracts, v. 28, no. 6, p. 936–938.
Nishikawa, Tracy, Izbicki, J.A., Hevesi, J.A., Stamos, C.L., and Martin, Peter, 2005, Evaluation of geohydrologic framework, recharge estimates, and ground-water flow of the Joshua Tree area, San Bernardino County, California: U.S. Geological Survey Scientific Investigations Report 2004–5267, 115 p.
Noble, L.F., and Mansfield, G.R., 1922, Nitrate deposits in the Amargosa region, southeastern California: U.S. Geological Survey Bulletin 724, 99 p.
Pagnac, D.C., and Reynolds, R.E., 2006, The fossil mammals of the Barstow Formation, in Reynolds, R.E., ed., Making tracks across the southwest—The 2006 Desert Symposium: California State University, Desert Studies Consortium and LSA Associates, Inc., p. 65–70.
Patton, C.J., and Kryskalla, J.R., 2003, Methods of analysis by the U.S. Geological Survey National Water Quality Laboratory—Evaluation of alkaline persulfate digestion as an alternative to Kjeldahl digestion for determination of total and dissolved nitrogen and phosphorus in water: U.S. Geological Survey Water-Resources Investigations Report 03–4174, 33 p.
Piper, A.M., 1944, A graphic procedure in the geochemical interpretation of water analyses: American Geophysical Union Transactions, v. 25, p. 914–923.
Poeter, E.P., Hill, M.C., Banta, E.R., Mehl, Steffen, and Chris-tensen, Steen, 2005, UCODE_2005 and six other computer codes for universal sensitivity analysis, calibration, and uncertainty evaluation constructed using the JUPITER API: U.S. Geological Survey Techniques and Methods, book 6, chap. A11, 283 p.
Schermer, E.R., Luyendyk, B.P., and Cisowski, S., 1996, Late Cenozoic structure and tectonics of the northern Mojave Desert: Tectonics, v. 15, no. 5, p. 905–932.
Schneider, R.J., Jones, G.A., McNichol, A.P., von Reden, K.F., Elder, K.L., Huang, Kelan, and Kessel, E.D., 1994, Methods for data screening, flagging, and error analysis at the National Ocean Sciences AMS Facility: Nuclear instru-ments & methods in physics research section B-beam inter-actions with materials and atoms, v. 92, no. 1-4, p. 172–175.
Smith, G.A., 1997, Geometry of Langford Well Lake Basin as estimated by gravity data, Fort Irwin, southern California: San Diego, California, California State University, unpub-lished Master’s Thesis, 29 p.
Stiff, H.A., Jr., 1951, The interpretation of chemical water analysis by means of patterns: Journal of Petroleum Tech-nology, v. 3, no. 10, p. 15–17.
Thatcher, L.L., Janzer, V.J., and Edwards, K.W., 1977, Meth-ods for determination of radioactive substances in water and fluvial sediments: U.S. Geological Survey Techniques of Water-Resources Investigations, book 5, chap. A5, 95 p.
Thomasson, H.G., Jr., Olmsted, F.H., and LeRoux, E.F., 1960, Geology, water resources, and usable ground-water storage capacity of part of Solano County, California: U.S. Geologi-cal Survey Water-Supply Paper 1464, 693 p.
U.S. Environmental Protection Agency, 2002, Drinking water standards: accessed September 3, 2002, at http://www.epa.gov/safewater/standards.html.
U.S. Environmental Protection Agency, 2005, Drinking water standards: accessed December 29, 2005, at http://www.epa.gov/safewater/standards.html.
U.S. Geological Survey, 2006, Collection of water sam-ples (ver. 2.0): U.S. Geological Survey Techniques of Water-Resources Investigations, book 9, chap. A4, September 2006, accessed September 24, 2012, at http://pubs.water.usgs.gov/twri9A4/.
U.S. Geological Survey, 2012, East of Langford Well quad-rangle, California [map]: Reston, Virginia, U.S. Department of the Interior, 7.5 minute series, scale 1:24,000.
U.S. Geological Survey, 2012, Langford Well quadrangle, California [map]: Reston, Virginia, U.S. Department of the Interior, 7.5 minute series, scale 1:24,000.

References Cited 67
Vogel, J.S., Nelson, D.E., and Southon, J.R., 1987, 14C back-ground levels in an accelerator mass spectrometry system: Radiocarbon, v. 29, no. 3, p. 323–333.
Welch, A.H., Westjohn, D.B., Helsel, D.R., and Wanty, R.B., 2000, Arsenic in ground water of the United States: Occurrence and geochemistry: Ground Water, v. 38, no. 4, p. 589–604.
Wilde, F.D., Radtke, D.B., Gibs, Jacob, and Iwatsubo, R.T., eds., 2004 with updates through 2009, Process-ing of water samples (ver. 2.2): U.S. Geological Survey Techniques of Water-Resources Investigations, book 9, chap. A5, April 2004, accessed September 24, 2012, at http://pubs.water.usgs.gov/twri9A5/.
Wilson F. So and Associates, Inc., 1989, U.S. Army National Training Center at Fort Irwin, California, water basin devel-opment plan, final report: Consultant’s report prepared for and in the files of the Commander of the National Training Center at Fort Irwin, 85 p.
Wilson, J.D., and Naff, R.L., 2004, The U.S. Geological Sur-vey modular ground-water model—GMG linear equation solver package documentation: U.S. Geological Survey Open-File report 2004–1261, 47 p.
1261, 47 p.
Yount, J.C., Schermer, E.R., Felger, T.J., Miller, D.M., and Stephens, K.A., 1994, Preliminary geologic map of Fort Irwin Basin, north-central Mojave Desert, California: U.S. Geological Survey Open-File Report 94–173, 27 p.

68 Geohydrology, Geochemistry, Groundwater Simulation and Analysis of Potential Water-Supply Management Options
Appendix 1
Lithologic Logs
The U.S. Geological Survey (USGS) established five single- or multiple-well monitoring sites in Langford Basin. Lithologic logs were compiled for each well on the basis of observations recorded during drilling and analysis of drill cuttings collected from the borehole. Cuttings, collected at 20-ft intervals, were described by rock type, texture, sorting, rounding, color, mineralogy, and any other identifying char-acteristics. Texture descriptions follow the National Research Council (1947) grain-size classification, which allows for correlation of general grain-size terms to size limits, in milli-meters or inches. Color, determined on moist samples, follows the numerical code designations in the Munsell Soil Color Charts (Munsell Color, 1975).
Similar lithologic units, determined from the detailed litho-logic logs, were grouped to facilitate compilation of general-ized lithologic columns (figs. A-1–A-5). Depths of contacts between lithologic units were determined by use of borehole geophysical logs.
Borehole Geophysics
Geophysical logs were run at each borehole immediately after completion of drilling. The logs of the uncased boreholes, which were filled with drilling mud, included 16-in. and 64-in. normal resistivity, lateral (6-ft) resistivity, spontaneous poten-tial (SP), natural gamma, and caliper logs (figs. A-1–A-5). These logs provide information on the characteristics of the formations and on the presence and quality of groundwater. Data from the geophysical logs were used in conjunction with the lithologic logs to determine the placement of piezometers at the three multi-well monitoring sites.
Resistivity devices measure the evident resistivity of a vol-ume of rock under the direct application of an electric current (Keys and MacCary, 1971). Resistivity generally is correlated to grain size. Low resistivity generally indicates the presence of fine-grained deposits, such as silt, clay, and shale; high resistivity indicates the presence of coarse-grained materials, such as sand and gravel.
SP devices measure voltage differences between the borehole fluid and the surrounding rock (Keys and Mac-Cary, 1971). SP logs mainly are used for correlating geologic units, determining bed thickness, and differentiating between nonporous and porous beds. SP logs generally have a baseline corresponding to impermeable beds, such as clay or shale. Where formation water is less resistive than the drilling mud (more saline), deflections to the left of the baseline correspond to permeable strata; the opposite is true where formation water is more resistive than the drilling mud.
Natural gamma logs measure the intensity of gamma-ray emissions resulting from the natural decay of potassium-40 and of the daughter products of uranium and thorium. Gamma logs primarily are used as indicators of lithology and for geo-logic correlation. Higher-intensity gamma rays generally are emitted by clay and feldspar-rich gravel and granite (Driscoll, 1986). At the Fort Irwin National Training Center, an increase in gamma intensity generally is interpreted as corresponding to an increase in granitic materials in the deposits.
Caliper devices measure the diameter of the borehole. The caliper log can indicate “cave-in” in unconsolidated sand or constriction due to swelling clay.

Appendix 1 69
Figure A1-1. Geophysical logs, well-construction diagram, and stratigraphic column for the borehole of monitoring site drilled in Langford Basin at Fort Irwin National Training Center, California: LL1 (13N/3E-26K2-4).
Dept
h be
low
land
sur
face
, in
feet
Caliper,in inches
Generalizedlithology
Gamma,in counts
per second0 20-40 20 50 150
Gravelly sand
Gravelly sand
Gravelly sand
Consolidatedsand
Silty sand
Slightlygravelly sand
Slightlygravelly sand
Slightlysandy gravel
Sand
Sand
Sandy gravel
0
100
200
300
400
500
600
700
800
Sandstone
Spontaneouspotential,
in millivolts
Resistivity,in ohm-meters
Lateralresistivity,
in ohm-meters0 100 0 100 26K2-4
16-inch64-inch
Sandy gravel
Wellconstruction
Total depth800 feet

70 Geohydrology, Geochemistry, Groundwater Simulation and Analysis of Potential Water-Supply Management Options
Figure A1-2. Geophysical logs, well-construction diagram, and stratigraphic column for borehole of monitoring site drilled in Langford Basin at Fort Irwin National Training Center, California: LL2 (13N/3E-35J1-3).
0
100
200
300
400
500
600
700
Sandy gravel
Slightly siltysandy gravel
Cemented sands
Sand with occa-sional gravel
Gravelly sand
Sandy gravel
Gravelly sand
Sandy gravel
Gravelly sand
Silty gravellysand
Generalizedlithology
Dept
h be
low
land
sur
face
, in
feet
35J1–3
Caliper,in inches
Spontaneouspotential,
in millivolts
Resistivity,in ohm-meters
Gamma,in counts
per second0 20 -50 50 0 100 0 1000 200
16-inch64-inch
Lateralresistivity,
in ohm-metersWell
construction
Total depth699 feet
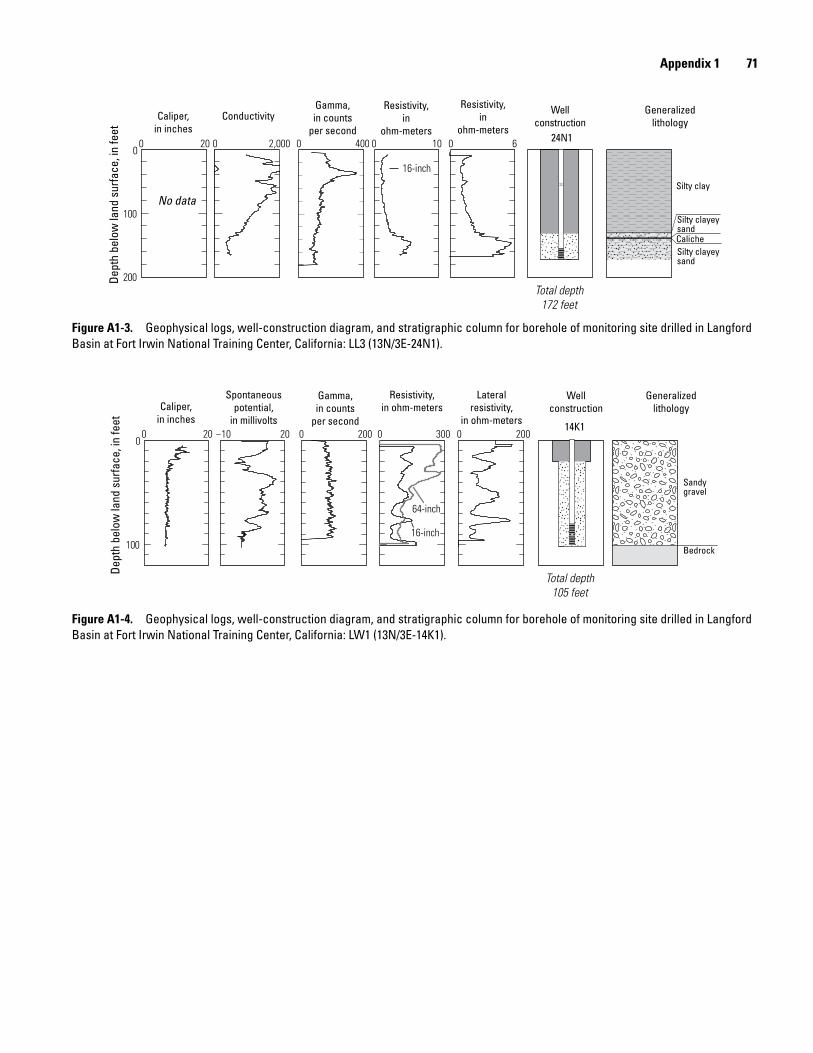
Appendix 1 71
Figure A1-3. Geophysical logs, well-construction diagram, and stratigraphic column for borehole of monitoring site drilled in Langford Basin at Fort Irwin National Training Center, California: LL3 (13N/3E-24N1).
Silty clay
CalicheSilty clayeysand
Silty clayeysand
0 20 0 2,000 0 10 0 6
16-inch
Wellconstruction
Total depth172 feet
0 400
Gamma,in counts
per second
Generalizedlithology
Caliper,in inches
ConductivityResistivity,
inohm-meters
Resistivity,in
ohm-meters24N1
100
200
0
Dept
h be
low
land
sur
face
, in
feet
No data
Figure A1-4. Geophysical logs, well-construction diagram, and stratigraphic column for borehole of monitoring site drilled in Langford Basin at Fort Irwin National Training Center, California: LW1 (13N/3E-14K1).
Sandygravel
Bedrock
0 20 -10 20 0 300 0 2000 200
16-inch
64-inch
Gamma,in counts
per second
Generalizedlithology
WellconstructionCaliper,
in inches
Spontaneouspotential,
in millivolts
Resistivity,in ohm-meters
Lateralresistivity,
in ohm-meters 14K1
100
0
Dept
h be
low
land
sur
face
, in
feet
Total depth105 feet

72 Geohydrology, Geochemistry, Groundwater Simulation and Analysis of Potential Water-Supply Management Options
Figure A1-5. Geophysical logs, well-construction diagram, and stratigraphic column for borehole of monitoring site drilled in Langford Basin at Fort Irwin National Training Center, California: LL04B (12N/3E-1M4 and 5) and LL04 (12N/3E-1M1-3).
Dept
h be
low
land
sur
face
, in
feet
Caliper,in inches
Generalizedlithology
Wellconstruction
Gamma,in counts
per second0 20-400 -100 50 150
Sand
Sandy gravel
Gravelly sand
Clayey gravelly sand
Clayey silty sand
Clayey silty sand
Clayey silty sand
Clayey silt with interbedded cemented sand
Cemented sandSandy clayey silt
Clayey silty sand
Clayey silty sand
Silty sand
Sandy silty clay
Silty sandy clay
Clay
Gravelly silty sand
Gravelly silty sand
Gravelly silty sand
Gravelly sand
Spontaneouspotential,
in millivolts
Resistivity,in ohm-meters
Lateralresistivity,
in ohm-meters0 100 0 150 1M1-3
16-inch64-inch
0
100
200
300
400
500
600
700
800
900
1,000
1,100
Silty sand
Total depth1,019 feet
Wells1M2,3
destroyed
Total depth520 feet
1M4, 5

Appendix 2 73
Appendix 2 Water-quality data for selected wells and a spring in Lang-
ford Basin, Fort Irwin National Training Center, California, 1955–2011. See following page.
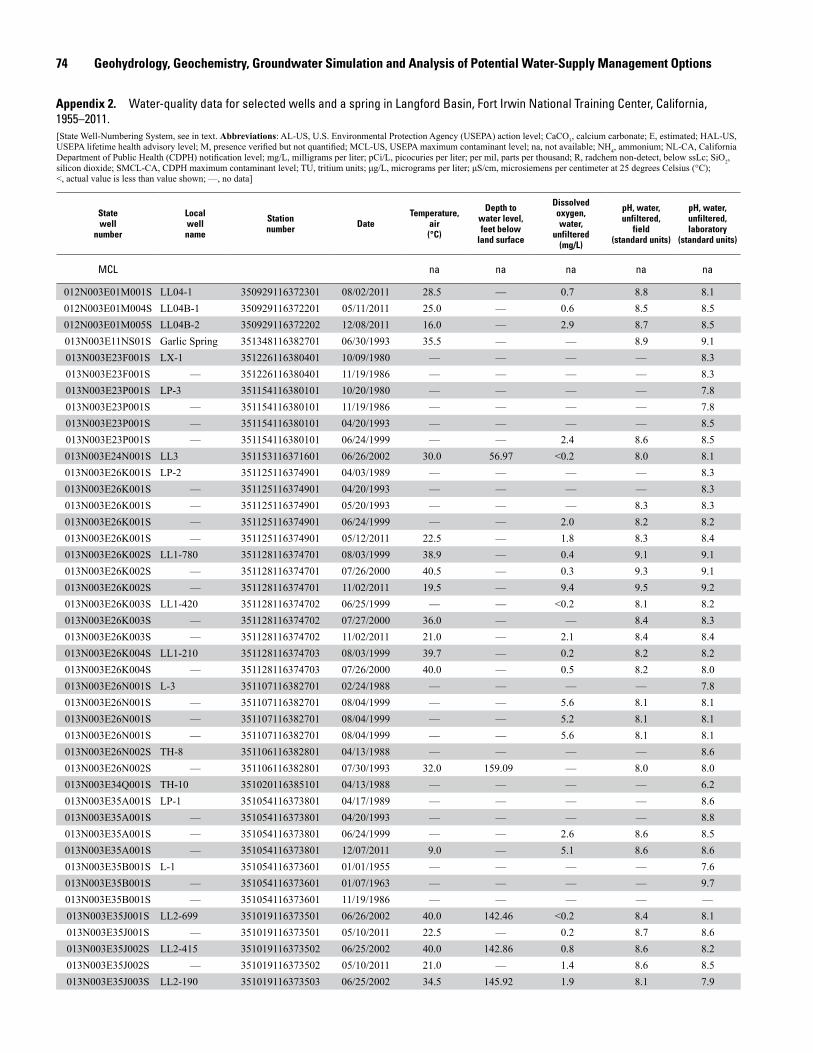
74 Geohydrology, Geochemistry, Groundwater Simulation and Analysis of Potential Water-Supply Management Options
[State Well-Numbering System, see in text. Abbreviations: AL-US, U.S. Environmental Protection Agency (USEPA) action level; CaCO3, calcium carbonate; E, estimated; HAL-US, USEPA lifetime health advisory level; M, presence verified but not quantified; MCL-US, USEPA maximum contaminant level; na, not available; NH4, ammonium; NL-CA, California Department of Public Health (CDPH) notification level; mg/L, milligrams per liter; pCi/L, picocuries per liter; per mil, parts per thousand; R, radchem non-detect, below ssLc; SiO2, silicon dioxide; SMCL-CA, CDPH maximum contaminant level; TU, tritium units; μg/L, micrograms per liter; μS/cm, microsiemens per centimeter at 25 degrees Celsius (°C); <, actual value is less than value shown; —, no data]
State well
number
Local well name
Station number Date
Temperature,air(°C)
Depth to water level,feet below
land surface
Dissolved oxygen,water,
unfiltered(mg/L)
pH, water,unfiltered,
field(standard units)
pH, water,unfiltered, laboratory
(standard units)
MCL na na na na na
012N003E01M001S LL04-1 350929116372301 08/02/2011 28.5 — 0.7 8.8 8.1012N003E01M004S LL04B-1 350929116372201 05/11/2011 25.0 — 0.6 8.5 8.5012N003E01M005S LL04B-2 350929116372202 12/08/2011 16.0 — 2.9 8.7 8.5013N003E11NS01S Garlic Spring 351348116382701 06/30/1993 35.5 — — 8.9 9.1013N003E23F001S LX-1 351226116380401 10/09/1980 — — — — 8.3013N003E23F001S — 351226116380401 11/19/1986 — — — — 8.3013N003E23P001S LP-3 351154116380101 10/20/1980 — — — — 7.8013N003E23P001S — 351154116380101 11/19/1986 — — — — 7.8013N003E23P001S — 351154116380101 04/20/1993 — — — — 8.5013N003E23P001S — 351154116380101 06/24/1999 — — 2.4 8.6 8.5013N003E24N001S LL3 351153116371601 06/26/2002 30.0 56.97 <0.2 8.0 8.1013N003E26K001S LP-2 351125116374901 04/03/1989 — — — — 8.3013N003E26K001S — 351125116374901 04/20/1993 — — — — 8.3013N003E26K001S — 351125116374901 05/20/1993 — — — 8.3 8.3013N003E26K001S — 351125116374901 06/24/1999 — — 2.0 8.2 8.2013N003E26K001S — 351125116374901 05/12/2011 22.5 — 1.8 8.3 8.4013N003E26K002S LL1-780 351128116374701 08/03/1999 38.9 — 0.4 9.1 9.1013N003E26K002S — 351128116374701 07/26/2000 40.5 — 0.3 9.3 9.1013N003E26K002S — 351128116374701 11/02/2011 19.5 — 9.4 9.5 9.2013N003E26K003S LL1-420 351128116374702 06/25/1999 — — <0.2 8.1 8.2013N003E26K003S — 351128116374702 07/27/2000 36.0 — — 8.4 8.3013N003E26K003S — 351128116374702 11/02/2011 21.0 — 2.1 8.4 8.4013N003E26K004S LL1-210 351128116374703 08/03/1999 39.7 — 0.2 8.2 8.2013N003E26K004S — 351128116374703 07/26/2000 40.0 — 0.5 8.2 8.0013N003E26N001S L-3 351107116382701 02/24/1988 — — — — 7.8013N003E26N001S — 351107116382701 08/04/1999 — — 5.6 8.1 8.1013N003E26N001S — 351107116382701 08/04/1999 — — 5.2 8.1 8.1013N003E26N001S — 351107116382701 08/04/1999 — — 5.6 8.1 8.1013N003E26N002S TH-8 351106116382801 04/13/1988 — — — — 8.6013N003E26N002S — 351106116382801 07/30/1993 32.0 159.09 — 8.0 8.0013N003E34Q001S TH-10 351020116385101 04/13/1988 — — — — 6.2013N003E35A001S LP-1 351054116373801 04/17/1989 — — — — 8.6013N003E35A001S — 351054116373801 04/20/1993 — — — — 8.8013N003E35A001S — 351054116373801 06/24/1999 — — 2.6 8.6 8.5013N003E35A001S — 351054116373801 12/07/2011 9.0 — 5.1 8.6 8.6013N003E35B001S L-1 351054116373601 01/01/1955 — — — — 7.6013N003E35B001S — 351054116373601 01/07/1963 — — — — 9.7013N003E35B001S — 351054116373601 11/19/1986 — — — — —013N003E35J001S LL2-699 351019116373501 06/26/2002 40.0 142.46 <0.2 8.4 8.1013N003E35J001S — 351019116373501 05/10/2011 22.5 — 0.2 8.7 8.6013N003E35J002S LL2-415 351019116373502 06/25/2002 40.0 142.86 0.8 8.6 8.2013N003E35J002S — 351019116373502 05/10/2011 21.0 — 1.4 8.6 8.5013N003E35J003S LL2-190 351019116373503 06/25/2002 34.5 145.92 1.9 8.1 7.9
Appendix 2. Water-quality data for selected wells and a spring in Langford Basin, Fort Irwin National Training Center, California, 1955–2011.
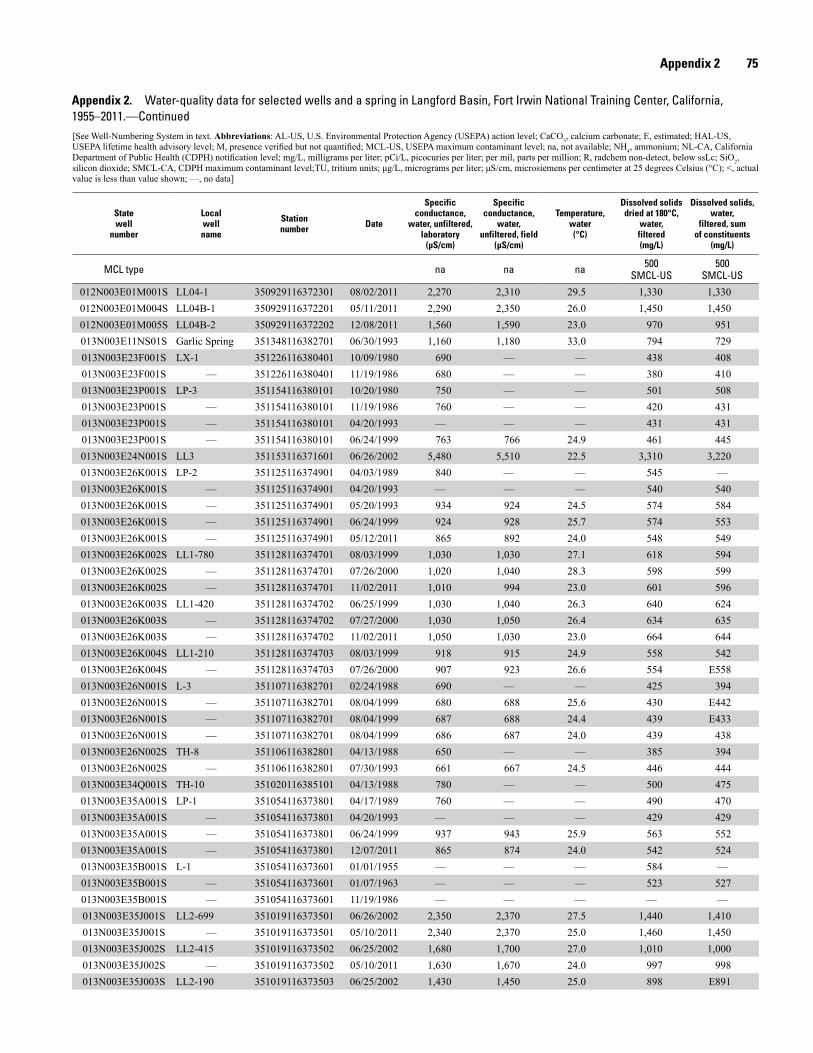
Appendix 2 75
Appendix 2. Water-quality data for selected wells and a spring in Langford Basin, Fort Irwin National Training Center, California, 1955–2011.—Continued[See Well-Numbering System in text. Abbreviations: AL-US, U.S. Environmental Protection Agency (USEPA) action level; CaCO3, calcium carbonate; E, estimated; HAL-US, USEPA lifetime health advisory level; M, presence verified but not quantified; MCL-US, USEPA maximum contaminant level; na, not available; NH4, ammonium; NL-CA, California Department of Public Health (CDPH) notification level; mg/L, milligrams per liter; pCi/L, picocuries per liter; per mil, parts per million; R, radchem non-detect, below ssLc; SiO2, silicon dioxide; SMCL-CA, CDPH maximum contaminant level;TU, tritium units; μg/L, micrograms per liter; μS/cm, microsiemens per centimeter at 25 degrees Celsius (°C); <, actual value is less than value shown; —, no data]
State well
number
Local well name
Station number Date
Specific conductance,
water, unfiltered, laboratory
(µS/cm)
Specific conductance,
water, unfiltered, field
(µS/cm)
Temperature, water(°C)
Dissolved solids dried at 180°C,
water, filtered(mg/L)
Dissolved solids, water,
filtered, sum of constituents
(mg/L)
MCL type na na na 500SMCL-US
500SMCL-US
012N003E01M001S LL04-1 350929116372301 08/02/2011 2,270 2,310 29.5 1,330 1,330012N003E01M004S LL04B-1 350929116372201 05/11/2011 2,290 2,350 26.0 1,450 1,450012N003E01M005S LL04B-2 350929116372202 12/08/2011 1,560 1,590 23.0 970 951013N003E11NS01S Garlic Spring 351348116382701 06/30/1993 1,160 1,180 33.0 794 729013N003E23F001S LX-1 351226116380401 10/09/1980 690 — — 438 408013N003E23F001S — 351226116380401 11/19/1986 680 — — 380 410013N003E23P001S LP-3 351154116380101 10/20/1980 750 — — 501 508013N003E23P001S — 351154116380101 11/19/1986 760 — — 420 431013N003E23P001S — 351154116380101 04/20/1993 — — — 431 431013N003E23P001S — 351154116380101 06/24/1999 763 766 24.9 461 445013N003E24N001S LL3 351153116371601 06/26/2002 5,480 5,510 22.5 3,310 3,220013N003E26K001S LP-2 351125116374901 04/03/1989 840 — — 545 —013N003E26K001S — 351125116374901 04/20/1993 — — — 540 540013N003E26K001S — 351125116374901 05/20/1993 934 924 24.5 574 584013N003E26K001S — 351125116374901 06/24/1999 924 928 25.7 574 553013N003E26K001S — 351125116374901 05/12/2011 865 892 24.0 548 549013N003E26K002S LL1-780 351128116374701 08/03/1999 1,030 1,030 27.1 618 594013N003E26K002S — 351128116374701 07/26/2000 1,020 1,040 28.3 598 599013N003E26K002S — 351128116374701 11/02/2011 1,010 994 23.0 601 596013N003E26K003S LL1-420 351128116374702 06/25/1999 1,030 1,040 26.3 640 624013N003E26K003S — 351128116374702 07/27/2000 1,030 1,050 26.4 634 635013N003E26K003S — 351128116374702 11/02/2011 1,050 1,030 23.0 664 644013N003E26K004S LL1-210 351128116374703 08/03/1999 918 915 24.9 558 542013N003E26K004S — 351128116374703 07/26/2000 907 923 26.6 554 E558013N003E26N001S L-3 351107116382701 02/24/1988 690 — — 425 394013N003E26N001S — 351107116382701 08/04/1999 680 688 25.6 430 E442013N003E26N001S — 351107116382701 08/04/1999 687 688 24.4 439 E433013N003E26N001S — 351107116382701 08/04/1999 686 687 24.0 439 438013N003E26N002S TH-8 351106116382801 04/13/1988 650 — — 385 394013N003E26N002S — 351106116382801 07/30/1993 661 667 24.5 446 444013N003E34Q001S TH-10 351020116385101 04/13/1988 780 — — 500 475013N003E35A001S LP-1 351054116373801 04/17/1989 760 — — 490 470013N003E35A001S — 351054116373801 04/20/1993 — — — 429 429013N003E35A001S — 351054116373801 06/24/1999 937 943 25.9 563 552013N003E35A001S — 351054116373801 12/07/2011 865 874 24.0 542 524013N003E35B001S L-1 351054116373601 01/01/1955 — — — 584 —013N003E35B001S — 351054116373601 01/07/1963 — — — 523 527013N003E35B001S — 351054116373601 11/19/1986 — — — — —013N003E35J001S LL2-699 351019116373501 06/26/2002 2,350 2,370 27.5 1,440 1,410013N003E35J001S — 351019116373501 05/10/2011 2,340 2,370 25.0 1,460 1,450013N003E35J002S LL2-415 351019116373502 06/25/2002 1,680 1,700 27.0 1,010 1,000013N003E35J002S — 351019116373502 05/10/2011 1,630 1,670 24.0 997 998013N003E35J003S LL2-190 351019116373503 06/25/2002 1,430 1,450 25.0 898 E891

76 Geohydrology, Geochemistry, Groundwater Simulation and Analysis of Potential Water-Supply Management Options
[See Well-Numbering System in text. Abbreviations: AL-US, U.S. Environmental Protection Agency (USEPA) action level; CaCO3, calcium carbonate; E, estimated; HAL-US, USEPA lifetime health advisory level; M, presence verified but not quantified; MCL-US, USEPA maximum contaminant level; na, not available; NH4, ammonium; NL-CA, California Department of Public Health (CDPH) notification level; mg/L, milligrams per liter; pCi/L, picocuries per liter; per mil, parts per million; R, radchem non-detect, below ssLc; SiO2, silicon dioxide; SMCL-CA, CDPH maximum contaminant level;TU, tritium units; μg/L, micrograms per liter; μS/cm, microsiemens per centimeter at 25 degrees Celsius (°C); <, actual value is less than value shown; —, no data]
State well
number
Local well name
Station number Date
Calcium, water, filtered (mg/L)
Magnesium, water, filtered(mg/L)
Potassium, water, filtered(mg/L)
Sodium, water,
filtered (mg/L)
Alkalinity, water, filtered, fixed
endpoint (pH 4.5) titration, field,
(mg/L as CaCO3)
MCL na na na na na
012N003E01M001S LL04-1 350929116372301 08/02/2011 26.9 0.6 3.2 435 —012N003E01M004S LL04B-1 350929116372201 05/11/2011 38.9 1.7 5.3 449 38012N003E01M005S LL04B-2 350929116372202 12/08/2011 12.1 1.6 4.2 309 120013N003E11NS01S Garlic Spring 351348116382701 06/30/1993 31.0 4.9 8.2 200 230013N003E23F001S LX-1 351226116380401 10/09/1980 8.4 3.4 3.0 145 —013N003E23F001S — 351226116380401 11/19/1986 14.0 2.0 1.0 142 —013N003E23P001S LP-3 351154116380101 10/20/1980 4.9 3.1 2.3 175 —013N003E23P001S — 351154116380101 11/19/1986 6.0 1.0 3.0 160 —013N003E23P001S — 351154116380101 04/20/1993 6.4 2.9 2.5 159 —013N003E23P001S — 351154116380101 06/24/1999 5.3 2.7 2.1 160 180013N003E24N001S LL3 351153116371601 06/26/2002 9.9 4.7 4.3 1,180 —013N003E26K001S LP-2 351125116374901 04/03/1989 10.0 3.2 4.2 188 —013N003E26K001S — 351125116374901 04/20/1993 10.6 3.3 3.3 193 —013N003E26K001S — 351125116374901 05/20/1993 9.0 2.4 3.2 200 230013N003E26K001S — 351125116374901 06/24/1999 8.9 2.5 3.2 193 220013N003E26K001S — 351125116374901 05/12/2011 7.8 2.2 3.0 190 220013N003E26K002S LL1-780 351128116374701 08/03/1999 5.1 0.2 1.4 205 52013N003E26K002S — 351128116374701 07/26/2000 5.0 0.2 1.1 199 —013N003E26K002S — 351128116374701 11/02/2011 5.1 0.1 0.9 195 52013N003E26K003S LL1-420 351128116374702 06/25/1999 7.2 1.7 2.6 217 210013N003E26K003S — 351128116374702 07/27/2000 7.5 1.8 2.5 213 —013N003E26K003S — 351128116374702 11/02/2011 7.9 1.9 2.5 215 210013N003E26K004S LL1-210 351128116374703 08/03/1999 8.7 2.6 3.2 189 210013N003E26K004S — 351128116374703 07/26/2000 8.7 2.7 3.0 187 —013N003E26N001S L-3 351107116382701 02/24/1988 29.0 4.0 4.0 122 —013N003E26N001S — 351107116382701 08/04/1999 15.9 3.1 3.6 126 140013N003E26N001S — 351107116382701 08/04/1999 15.7 3.1 3.5 124 140013N003E26N001S — 351107116382701 08/04/1999 15.7 3.1 3.4 124 140013N003E26N002S TH-8 351106116382801 04/13/1988 8.0 4.0 4.0 135 —013N003E26N002S — 351106116382801 07/30/1993 14.0 2.8 3.2 120 150013N003E34Q001S TH-10 351020116385101 04/13/1988 36.0 4.0 7.0 128 —013N003E35A001S LP-1 351054116373801 04/17/1989 6.6 1.2 2.0 168 —013N003E35A001S — 351054116373801 04/20/1993 6.4 3.4 1.9 147 —013N003E35A001S — 351054116373801 06/24/1999 7.9 1.1 1.9 186 120013N003E35A001S — 351054116373801 12/07/2011 7.5 1.1 1.8 176 140013N003E35B001S L-1 351054116373601 01/01/1955 8.4 1.5 — 166 —013N003E35B001S — 351054116373601 01/07/1963 5.6 3.4 1.5 182 —013N003E35B001S — 351054116373601 11/19/1986 — — — — —013N003E35J001S LL2-699 351019116373501 06/26/2002 33.8 1.3 3.5 451 —013N003E35J001S — 351019116373501 05/10/2011 39.9 0.6 2.9 458 27013N003E35J002S LL2-415 351019116373502 06/25/2002 23.2 4.1 3.1 316 —013N003E35J002S — 351019116373502 05/10/2011 22.2 4.0 3.2 320 59013N003E35J003S LL2-190 351019116373503 06/25/2002 20.7 3.7 3.8 272 —
Appendix 2. Water-quality data for selected wells and a spring in Langford Basin, Fort Irwin National Training Center, California, 1955–2011.—Continued

Appendix 2 77
Appendix 2. Water-quality data for selected wells and a spring in Langford Basin, Fort Irwin National Training Center, California, 1955–2011.—Continued[See Well-Numbering System in text. Abbreviations: AL-US, U.S. Environmental Protection Agency (USEPA) action level; CaCO3, calcium carbonate; E, estimated; HAL-US, USEPA lifetime health advisory level; M, presence verified but not quantified; MCL-US, USEPA maximum contaminant level; na, not available; NH4, ammonium; NL-CA, California Department of Public Health (CDPH) notification level; mg/L, milligrams per liter; pCi/L, picocuries per liter; per mil, parts per million; R, radchem non-detect, below ssLc; SiO2, sili-con dioxide; SMCL-CA, CDPH maximum contaminant level;TU, tritium units; μg/L, micrograms per liter; μS/cm, microsiemens per centimeter at 25 degrees Celsius (°C); <, actual value is less than value shown; —, no data]
State well
number
Local well name
Station number Date
Alkalinity, water, fil-tered, fixed endpoint
(pH 4.5) titration, laboratory
(mg/L as CaCO3)
Alkalinity, water, filtered, inflection-point titration
method (incrementaltitration method), field
(mg/L as CaCO3)
Bromide, water, filtered(mg/L)
Carbon dioxide, water,
unfiltered(mg/L)
Chloride, water, filtered(mg/L)
MCL type na na na na 250SMCL-CA
012N003E01M001S LL04-1 350929116372301 08/02/2011 35.7 — 1.76 0.1 439012N003E01M004S LL04B-1 350929116372201 05/11/2011 40.6 36 1.35 0.2 374012N003E01M005S LL04B-2 350929116372202 12/08/2011 119 114 0.78 0.4 218013N003E11NS01S Garlic Spring 351348116382701 06/30/1993 — 224 <0.01 0.5 82013N003E23F001S LX-1 351226116380401 10/09/1980 — — — — 50013N003E23F001S — 351226116380401 11/19/1986 — — — — 49013N003E23P001S LP-3 351154116380101 10/20/1980 — — — — 53013N003E23P001S — 351154116380101 11/19/1986 — — — — 51013N003E23P001S — 351154116380101 04/20/1993 — — — — 50013N003E23P001S — 351154116380101 06/24/1999 197 — 0.25 0.9 52013N003E24N001S LL3 351153116371601 06/26/2002 535 — 3.91 10.0 1,260013N003E26K001S LP-2 351125116374901 04/03/1989 — — — — —013N003E26K001S — 351125116374901 04/20/1993 — — — — 54013N003E26K001S — 351125116374901 05/20/1993 — 234 0.23 2.5 56013N003E26K001S — 351125116374901 06/24/1999 237 — 0.24 2.5 53013N003E26K001S — 351125116374901 05/12/2011 229 218 0.25 2.3 55013N003E26K002S LL1-780 351128116374701 08/03/1999 56.5 — 0.34 0.1 88013N003E26K002S — 351128116374701 07/26/2000 53.1 — 0.08 M 89013N003E26K002S — 351128116374701 11/02/2011 49.7 47 0.37 M 90013N003E26K003S LL1-420 351128116374702 06/25/1999 222 — 0.25 3.2 60013N003E26K003S — 351128116374702 07/27/2000 217 — 0.25 1.6 61013N003E26K003S — 351128116374702 11/02/2011 219 209 0.27 1.5 61013N003E26K004S LL1-210 351128116374703 08/03/1999 225 — 0.23 2.9 51013N003E26K004S — 351128116374703 07/26/2000 227 — 0.22 2.8 53013N003E26N001S L-3 351107116382701 02/24/1988 — — — — 48013N003E26N001S — 351107116382701 08/04/1999 146 — 0.28 2.3 50013N003E26N001S — 351107116382701 08/04/1999 146 — 0.28 2.2 52013N003E26N001S — 351107116382701 08/04/1999 146 — 0.28 2.0 52013N003E26N002S TH-8 351106116382801 04/13/1988 — — — — 45013N003E26N002S — 351106116382801 07/30/1993 — 140 0.27 2.7 55013N003E34Q001S TH-10 351020116385101 04/13/1988 — — — — 108013N003E35A001S LP-1 351054116373801 04/17/1989 — — — — 70013N003E35A001S — 351054116373801 04/20/1993 — — — — 70013N003E35A001S — 351054116373801 06/24/1999 132 — 0.41 0.6 98013N003E35A001S — 351054116373801 12/07/2011 142 139 0.36 0.6 85013N003E35B001S L-1 351054116373601 01/01/1955 — — — — 75013N003E35B001S — 351054116373601 01/07/1963 — — — — 98013N003E35B001S — 351054116373601 11/19/1986 — — — — —013N003E35J001S LL2-699 351019116373501 06/26/2002 28.8 — 1.43 0.2 388013N003E35J001S — 351019116373501 05/10/2011 29.4 25 1.42 0.1 401013N003E35J002S LL2-415 351019116373502 06/25/2002 62.3 — 0.83 0.3 246013N003E35J002S — 351019116373502 05/10/2011 64.5 57 0.82 0.3 240013N003E35J003S LL2-190 351019116373503 06/25/2002 138 — 0.57 2.1 165
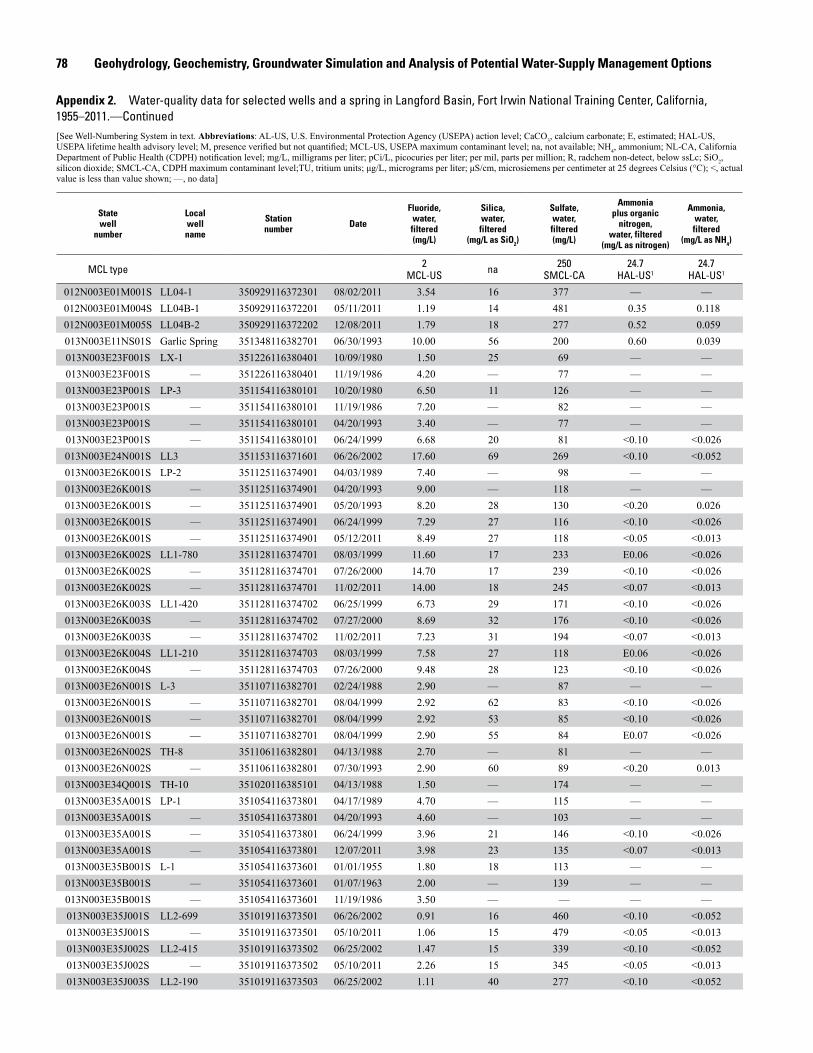
78 Geohydrology, Geochemistry, Groundwater Simulation and Analysis of Potential Water-Supply Management Options
Appendix 2. Water-quality data for selected wells and a spring in Langford Basin, Fort Irwin National Training Center, California, 1955–2011.—Continued[See Well-Numbering System in text. Abbreviations: AL-US, U.S. Environmental Protection Agency (USEPA) action level; CaCO3, calcium carbonate; E, estimated; HAL-US, USEPA lifetime health advisory level; M, presence verified but not quantified; MCL-US, USEPA maximum contaminant level; na, not available; NH4, ammonium; NL-CA, California Department of Public Health (CDPH) notification level; mg/L, milligrams per liter; pCi/L, picocuries per liter; per mil, parts per million; R, radchem non-detect, below ssLc; SiO2, silicon dioxide; SMCL-CA, CDPH maximum contaminant level;TU, tritium units; μg/L, micrograms per liter; μS/cm, microsiemens per centimeter at 25 degrees Celsius (°C); <, actual value is less than value shown; —, no data]
State well
number
Local well name
Station number Date
Fluoride, water, filtered(mg/L)
Silica, water, filtered
(mg/L as SiO2)
Sulfate, water, filtered(mg/L)
Ammonia plus organic
nitrogen, water, filtered
(mg/L as nitrogen)
Ammonia,water, filtered
(mg/L as NH4)
MCL type 2MCL-US na 250
SMCL-CA24.7
HAL-US124.7
HAL-US1
012N003E01M001S LL04-1 350929116372301 08/02/2011 3.54 16 377 — —012N003E01M004S LL04B-1 350929116372201 05/11/2011 1.19 14 481 0.35 0.118012N003E01M005S LL04B-2 350929116372202 12/08/2011 1.79 18 277 0.52 0.059013N003E11NS01S Garlic Spring 351348116382701 06/30/1993 10.00 56 200 0.60 0.039013N003E23F001S LX-1 351226116380401 10/09/1980 1.50 25 69 — —013N003E23F001S — 351226116380401 11/19/1986 4.20 — 77 — —013N003E23P001S LP-3 351154116380101 10/20/1980 6.50 11 126 — —013N003E23P001S — 351154116380101 11/19/1986 7.20 — 82 — —013N003E23P001S — 351154116380101 04/20/1993 3.40 — 77 — —013N003E23P001S — 351154116380101 06/24/1999 6.68 20 81 <0.10 <0.026013N003E24N001S LL3 351153116371601 06/26/2002 17.60 69 269 <0.10 <0.052013N003E26K001S LP-2 351125116374901 04/03/1989 7.40 — 98 — —013N003E26K001S — 351125116374901 04/20/1993 9.00 — 118 — —013N003E26K001S — 351125116374901 05/20/1993 8.20 28 130 <0.20 0.026013N003E26K001S — 351125116374901 06/24/1999 7.29 27 116 <0.10 <0.026013N003E26K001S — 351125116374901 05/12/2011 8.49 27 118 <0.05 <0.013013N003E26K002S LL1-780 351128116374701 08/03/1999 11.60 17 233 E0.06 <0.026013N003E26K002S — 351128116374701 07/26/2000 14.70 17 239 <0.10 <0.026013N003E26K002S — 351128116374701 11/02/2011 14.00 18 245 <0.07 <0.013013N003E26K003S LL1-420 351128116374702 06/25/1999 6.73 29 171 <0.10 <0.026013N003E26K003S — 351128116374702 07/27/2000 8.69 32 176 <0.10 <0.026013N003E26K003S — 351128116374702 11/02/2011 7.23 31 194 <0.07 <0.013013N003E26K004S LL1-210 351128116374703 08/03/1999 7.58 27 118 E0.06 <0.026013N003E26K004S — 351128116374703 07/26/2000 9.48 28 123 <0.10 <0.026013N003E26N001S L-3 351107116382701 02/24/1988 2.90 — 87 — —013N003E26N001S — 351107116382701 08/04/1999 2.92 62 83 <0.10 <0.026013N003E26N001S — 351107116382701 08/04/1999 2.92 53 85 <0.10 <0.026013N003E26N001S — 351107116382701 08/04/1999 2.90 55 84 E0.07 <0.026013N003E26N002S TH-8 351106116382801 04/13/1988 2.70 — 81 — —013N003E26N002S — 351106116382801 07/30/1993 2.90 60 89 <0.20 0.013013N003E34Q001S TH-10 351020116385101 04/13/1988 1.50 — 174 — —013N003E35A001S LP-1 351054116373801 04/17/1989 4.70 — 115 — —013N003E35A001S — 351054116373801 04/20/1993 4.60 — 103 — —013N003E35A001S — 351054116373801 06/24/1999 3.96 21 146 <0.10 <0.026013N003E35A001S — 351054116373801 12/07/2011 3.98 23 135 <0.07 <0.013013N003E35B001S L-1 351054116373601 01/01/1955 1.80 18 113 — —013N003E35B001S — 351054116373601 01/07/1963 2.00 — 139 — —013N003E35B001S — 351054116373601 11/19/1986 3.50 — — — —013N003E35J001S LL2-699 351019116373501 06/26/2002 0.91 16 460 <0.10 <0.052013N003E35J001S — 351019116373501 05/10/2011 1.06 15 479 <0.05 <0.013013N003E35J002S LL2-415 351019116373502 06/25/2002 1.47 15 339 <0.10 <0.052013N003E35J002S — 351019116373502 05/10/2011 2.26 15 345 <0.05 <0.013013N003E35J003S LL2-190 351019116373503 06/25/2002 1.11 40 277 <0.10 <0.052
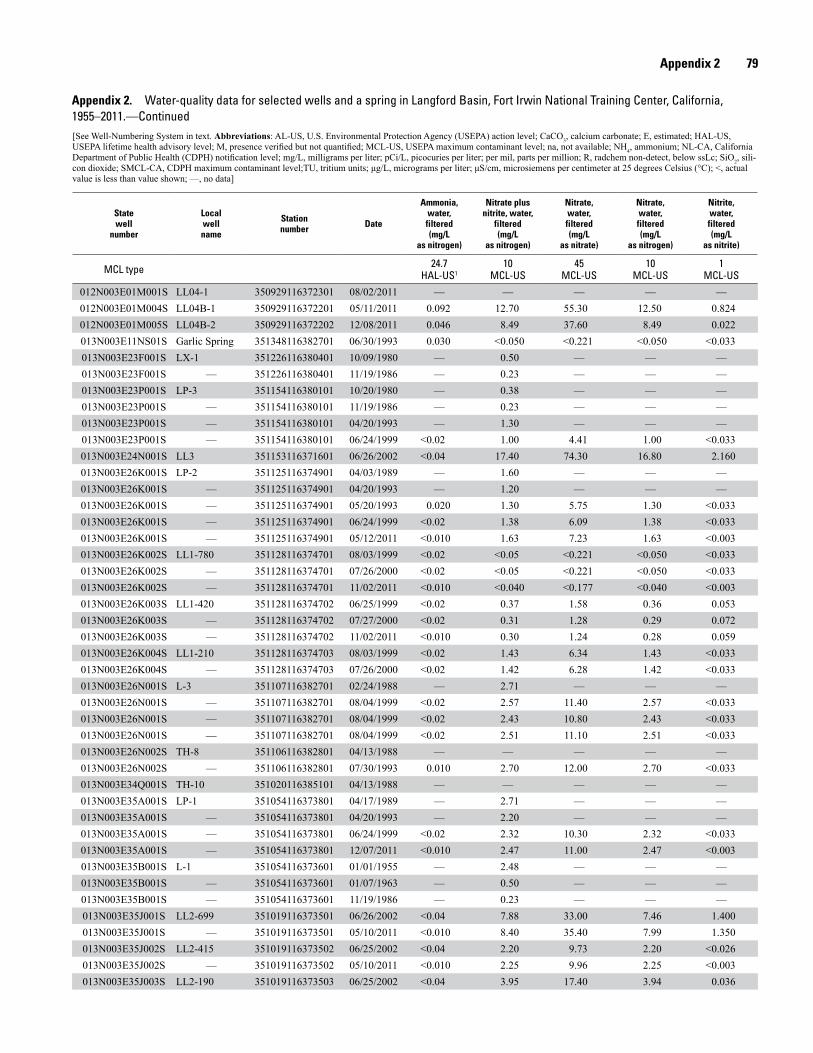
Appendix 2 79
Appendix 2. Water-quality data for selected wells and a spring in Langford Basin, Fort Irwin National Training Center, California, 1955–2011.—Continued[See Well-Numbering System in text. Abbreviations: AL-US, U.S. Environmental Protection Agency (USEPA) action level; CaCO3, calcium carbonate; E, estimated; HAL-US, USEPA lifetime health advisory level; M, presence verified but not quantified; MCL-US, USEPA maximum contaminant level; na, not available; NH4, ammonium; NL-CA, California Department of Public Health (CDPH) notification level; mg/L, milligrams per liter; pCi/L, picocuries per liter; per mil, parts per million; R, radchem non-detect, below ssLc; SiO2, sili-con dioxide; SMCL-CA, CDPH maximum contaminant level;TU, tritium units; μg/L, micrograms per liter; μS/cm, microsiemens per centimeter at 25 degrees Celsius (°C); <, actual value is less than value shown; —, no data]
State well
number
Local well name
Station number Date
Ammonia,water,filtered(mg/L
as nitrogen)
Nitrate plus nitrite, water,
filtered(mg/L
as nitrogen)
Nitrate, water, filtered(mg/L
as nitrate)
Nitrate, water, filtered(mg/L
as nitrogen)
Nitrite, water, filtered (mg/L
as nitrite)
MCL type 24.7HAL-US1
10MCL-US
45MCL-US
10MCL-US
1MCL-US
012N003E01M001S LL04-1 350929116372301 08/02/2011 — — — — —012N003E01M004S LL04B-1 350929116372201 05/11/2011 0.092 12.70 55.30 12.50 0.824012N003E01M005S LL04B-2 350929116372202 12/08/2011 0.046 8.49 37.60 8.49 0.022013N003E11NS01S Garlic Spring 351348116382701 06/30/1993 0.030 <0.050 <0.221 <0.050 <0.033013N003E23F001S LX-1 351226116380401 10/09/1980 — 0.50 — — —013N003E23F001S — 351226116380401 11/19/1986 — 0.23 — — —013N003E23P001S LP-3 351154116380101 10/20/1980 — 0.38 — — —013N003E23P001S — 351154116380101 11/19/1986 — 0.23 — — —013N003E23P001S — 351154116380101 04/20/1993 — 1.30 — — —013N003E23P001S — 351154116380101 06/24/1999 <0.02 1.00 4.41 1.00 <0.033013N003E24N001S LL3 351153116371601 06/26/2002 <0.04 17.40 74.30 16.80 2.160013N003E26K001S LP-2 351125116374901 04/03/1989 — 1.60 — — —013N003E26K001S — 351125116374901 04/20/1993 — 1.20 — — —013N003E26K001S — 351125116374901 05/20/1993 0.020 1.30 5.75 1.30 <0.033013N003E26K001S — 351125116374901 06/24/1999 <0.02 1.38 6.09 1.38 <0.033013N003E26K001S — 351125116374901 05/12/2011 <0.010 1.63 7.23 1.63 <0.003013N003E26K002S LL1-780 351128116374701 08/03/1999 <0.02 <0.05 <0.221 <0.050 <0.033013N003E26K002S — 351128116374701 07/26/2000 <0.02 <0.05 <0.221 <0.050 <0.033013N003E26K002S — 351128116374701 11/02/2011 <0.010 <0.040 <0.177 <0.040 <0.003013N003E26K003S LL1-420 351128116374702 06/25/1999 <0.02 0.37 1.58 0.36 0.053013N003E26K003S — 351128116374702 07/27/2000 <0.02 0.31 1.28 0.29 0.072013N003E26K003S — 351128116374702 11/02/2011 <0.010 0.30 1.24 0.28 0.059013N003E26K004S LL1-210 351128116374703 08/03/1999 <0.02 1.43 6.34 1.43 <0.033013N003E26K004S — 351128116374703 07/26/2000 <0.02 1.42 6.28 1.42 <0.033013N003E26N001S L-3 351107116382701 02/24/1988 — 2.71 — — —013N003E26N001S — 351107116382701 08/04/1999 <0.02 2.57 11.40 2.57 <0.033013N003E26N001S — 351107116382701 08/04/1999 <0.02 2.43 10.80 2.43 <0.033013N003E26N001S — 351107116382701 08/04/1999 <0.02 2.51 11.10 2.51 <0.033013N003E26N002S TH-8 351106116382801 04/13/1988 — — — — —013N003E26N002S — 351106116382801 07/30/1993 0.010 2.70 12.00 2.70 <0.033013N003E34Q001S TH-10 351020116385101 04/13/1988 — — — — —013N003E35A001S LP-1 351054116373801 04/17/1989 — 2.71 — — —013N003E35A001S — 351054116373801 04/20/1993 — 2.20 — — —013N003E35A001S — 351054116373801 06/24/1999 <0.02 2.32 10.30 2.32 <0.033013N003E35A001S — 351054116373801 12/07/2011 <0.010 2.47 11.00 2.47 <0.003013N003E35B001S L-1 351054116373601 01/01/1955 — 2.48 — — —013N003E35B001S — 351054116373601 01/07/1963 — 0.50 — — —013N003E35B001S — 351054116373601 11/19/1986 — 0.23 — — —013N003E35J001S LL2-699 351019116373501 06/26/2002 <0.04 7.88 33.00 7.46 1.400013N003E35J001S — 351019116373501 05/10/2011 <0.010 8.40 35.40 7.99 1.350013N003E35J002S LL2-415 351019116373502 06/25/2002 <0.04 2.20 9.73 2.20 <0.026013N003E35J002S — 351019116373502 05/10/2011 <0.010 2.25 9.96 2.25 <0.003013N003E35J003S LL2-190 351019116373503 06/25/2002 <0.04 3.95 17.40 3.94 0.036

80 Geohydrology, Geochemistry, Groundwater Simulation and Analysis of Potential Water-Supply Management Options
Appendix 2. Water-quality data for selected wells and a spring in Langford Basin, Fort Irwin National Training Center, California, 1955–2011.—Continued[See Well-Numbering System in text. Abbreviations: AL-US, U.S. Environmental Protection Agency (USEPA) action level; CaCO3, calcium carbonate; E, estimated; HAL-US, USEPA lifetime health advisory level; M, presence verified but not quantified; MCL-US, USEPA maximum contaminant level; na, not available; NH4, ammonium; NL-CA, California Department of Public Health (CDPH) notification level; mg/L, milligrams per liter; pCi/L, picocuries per liter; per mil, parts per million; R, radchem non-detect, below ssLc; SiO2, sili-con dioxide; SMCL-CA, CDPH maximum contaminant level;TU, tritium units; μg/L, micrograms per liter; μS/cm, microsiemens per centimeter at 25 degrees Celsius (°C); <, actual value is less than value shown; —, no data]
State well
number
Local well name
Station number Date
Nitrite, water, filtered(mg/L as nitrogen)
Orthophosphate, water, filtered(mg/L)
Orthophosphate, water, filtered(mg/L as
phosphorus)
Phosphorus, water, filtered(mg/L as
phosphorus)
Aluminum, water, filtered(µg/L)
MCL type 1 naMCL-US na na 1,000
MCL-CA012N003E01M001S LL04-1 350929116372301 08/02/2011 — — — — 42.6012N003E01M004S LL04B-1 350929116372201 05/11/2011 0.251 0.113 0.037 0.03 14.9012N003E01M005S LL04B-2 350929116372202 12/08/2011 0.007 2.660 0.869 0.86 79.5013N003E11NS01S Garlic Spring 351348116382701 06/30/1993 <0.010 0.031 0.010 0.02 161.0013N003E23F001S LX-1 351226116380401 10/09/1980 — — — — —013N003E23F001S — 351226116380401 11/19/1986 — — — — —013N003E23P001S LP-3 351154116380101 10/20/1980 — — — — —013N003E23P001S — 351154116380101 11/19/1986 — — — — —013N003E23P001S — 351154116380101 04/20/1993 — — — — —013N003E23P001S — 351154116380101 06/24/1999 <0.010 <0.031 <0.01 <0.05 —013N003E24N001S LL3 351153116371601 06/26/2002 0.657 0.279 0.090 0.08 <3.0013N003E26K001S LP-2 351125116374901 04/03/1989 — — — — —013N003E26K001S — 351125116374901 04/20/1993 — — — — —013N003E26K001S — 351125116374901 05/20/1993 <0.010 <0.031 <0.01 <0.01 <10013N003E26K001S — 351125116374901 06/24/1999 <0.010 0.034 0.010 <0.05 —013N003E26K001S — 351125116374901 05/12/2011 <0.001 0.053 0.017 <0.02 1.7013N003E26K002S LL1-780 351128116374701 08/03/1999 <0.010 0.518 0.170 0.28 —013N003E26K002S — 351128116374701 07/26/2000 <0.010 0.110 0.040 E0.04 30.0013N003E26K002S — 351128116374701 11/02/2011 <0.001 0.016 0.005 <0.02 21.1013N003E26K003S LL1-420 351128116374702 06/25/1999 0.016 1.330 0.430 0.52 —013N003E26K003S — 351128116374702 07/27/2000 0.022 0.193 0.060 E0.05 <20013N003E26K003S — 351128116374702 11/02/2011 0.018 0.029 0.009 <0.02 2.8013N003E26K004S LL1-210 351128116374703 08/03/1999 <0.010 0.598 0.200 0.24 —013N003E26K004S — 351128116374703 07/26/2000 <0.010 0.110 0.040 E0.04 M013N003E26N001S L-3 351107116382701 02/24/1988 — — — — —013N003E26N001S — 351107116382701 08/04/1999 <0.010 <0.031 <0.01 <0.05 —013N003E26N001S — 351107116382701 08/04/1999 <0.010 <0.031 <0.01 <0.05 —013N003E26N001S — 351107116382701 08/04/1999 <0.010 <0.031 <0.01 <0.05 —013N003E26N002S TH-8 351106116382801 04/13/1988 — — — — —013N003E26N002S — 351106116382801 07/30/1993 <0.010 <0.031 <0.01 <0.01 3.0013N003E34Q001S TH-10 351020116385101 04/13/1988 — — — — —013N003E35A001S LP-1 351054116373801 04/17/1989 — — — — —013N003E35A001S — 351054116373801 04/20/1993 — — — — —013N003E35A001S — 351054116373801 06/24/1999 <0.010 <0.031 <0.01 <0.05 —013N003E35A001S — 351054116373801 12/07/2011 <0.001 0.025 0.008 <0.02 <11.0013N003E35B001S L-1 351054116373601 01/01/1955 — — — — —013N003E35B001S — 351054116373601 01/07/1963 — — — — —013N003E35B001S — 351054116373601 11/19/1986 — — — — —013N003E35J001S LL2-699 351019116373501 06/26/2002 0.425 3.280 1.070 1.19 10.2013N003E35J001S — 351019116373501 05/10/2011 0.410 0.212 0.069 0.05 18.3013N003E35J002S LL2-415 351019116373502 06/25/2002 <0.008 2.170 0.710 0.83 11.9013N003E35J002S — 351019116373502 05/10/2011 <0.001 0.043 0.014 <0.02 3.7013N003E35J003S LL2-190 351019116373503 06/25/2002 0.011 4.810 1.570 1.60 4.4
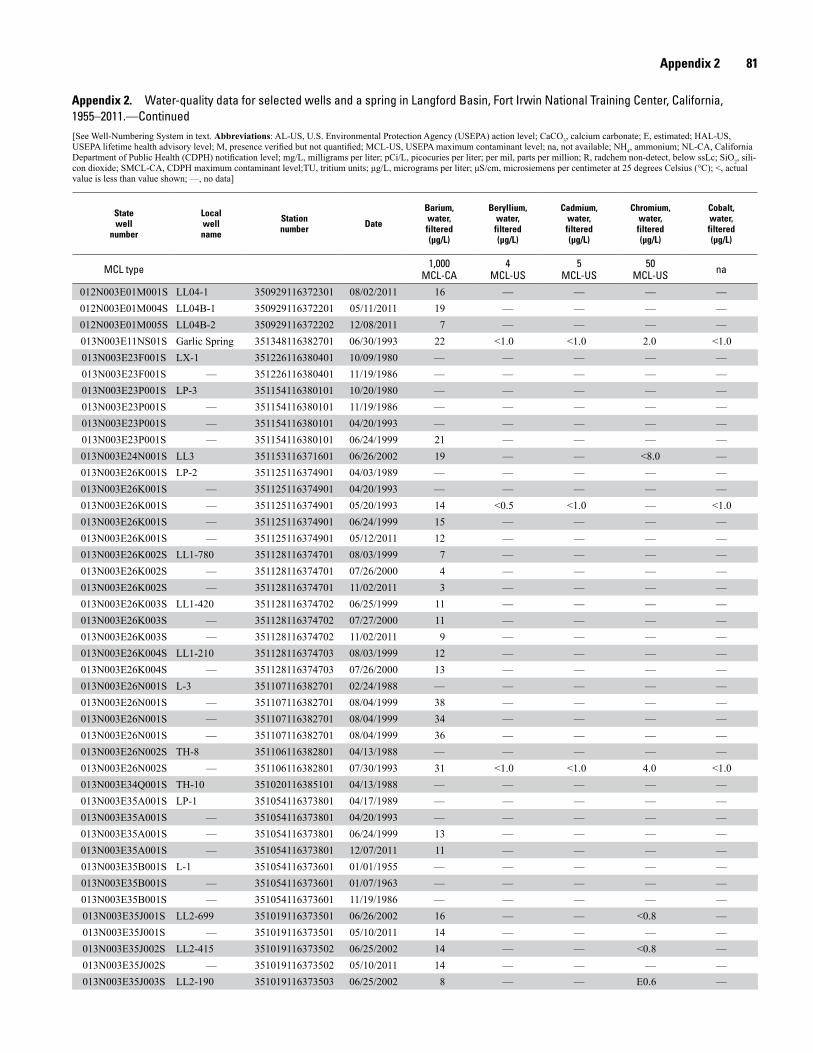
Appendix 2 81
Appendix 2. Water-quality data for selected wells and a spring in Langford Basin, Fort Irwin National Training Center, California, 1955–2011.—Continued[See Well-Numbering System in text. Abbreviations: AL-US, U.S. Environmental Protection Agency (USEPA) action level; CaCO3, calcium carbonate; E, estimated; HAL-US, USEPA lifetime health advisory level; M, presence verified but not quantified; MCL-US, USEPA maximum contaminant level; na, not available; NH4, ammonium; NL-CA, California Department of Public Health (CDPH) notification level; mg/L, milligrams per liter; pCi/L, picocuries per liter; per mil, parts per million; R, radchem non-detect, below ssLc; SiO2, sili-con dioxide; SMCL-CA, CDPH maximum contaminant level;TU, tritium units; μg/L, micrograms per liter; μS/cm, microsiemens per centimeter at 25 degrees Celsius (°C); <, actual value is less than value shown; —, no data]
State well
number
Local well name
Station number Date
Barium, water, filtered(µg/L)
Beryllium, water, filtered(µg/L)
Cadmium, water, filtered(µg/L)
Chromium, water, filtered(µg/L)
Cobalt, water, filtered(µg/L)
MCL type 1,000MCL-CA
4MCL-US
5MCL-US
50MCL-US na
012N003E01M001S LL04-1 350929116372301 08/02/2011 16 — — — —012N003E01M004S LL04B-1 350929116372201 05/11/2011 19 — — — —012N003E01M005S LL04B-2 350929116372202 12/08/2011 7 — — — —013N003E11NS01S Garlic Spring 351348116382701 06/30/1993 22 <1.0 <1.0 2.0 <1.0013N003E23F001S LX-1 351226116380401 10/09/1980 — — — — —013N003E23F001S — 351226116380401 11/19/1986 — — — — —013N003E23P001S LP-3 351154116380101 10/20/1980 — — — — —013N003E23P001S — 351154116380101 11/19/1986 — — — — —013N003E23P001S — 351154116380101 04/20/1993 — — — — —013N003E23P001S — 351154116380101 06/24/1999 21 — — — —013N003E24N001S LL3 351153116371601 06/26/2002 19 — — <8.0 —013N003E26K001S LP-2 351125116374901 04/03/1989 — — — — —013N003E26K001S — 351125116374901 04/20/1993 — — — — —013N003E26K001S — 351125116374901 05/20/1993 14 <0.5 <1.0 — <1.0013N003E26K001S — 351125116374901 06/24/1999 15 — — — —013N003E26K001S — 351125116374901 05/12/2011 12 — — — —013N003E26K002S LL1-780 351128116374701 08/03/1999 7 — — — —013N003E26K002S — 351128116374701 07/26/2000 4 — — — —013N003E26K002S — 351128116374701 11/02/2011 3 — — — —013N003E26K003S LL1-420 351128116374702 06/25/1999 11 — — — —013N003E26K003S — 351128116374702 07/27/2000 11 — — — —013N003E26K003S — 351128116374702 11/02/2011 9 — — — —013N003E26K004S LL1-210 351128116374703 08/03/1999 12 — — — —013N003E26K004S — 351128116374703 07/26/2000 13 — — — —013N003E26N001S L-3 351107116382701 02/24/1988 — — — — —013N003E26N001S — 351107116382701 08/04/1999 38 — — — —013N003E26N001S — 351107116382701 08/04/1999 34 — — — —013N003E26N001S — 351107116382701 08/04/1999 36 — — — —013N003E26N002S TH-8 351106116382801 04/13/1988 — — — — —013N003E26N002S — 351106116382801 07/30/1993 31 <1.0 <1.0 4.0 <1.0013N003E34Q001S TH-10 351020116385101 04/13/1988 — — — — —013N003E35A001S LP-1 351054116373801 04/17/1989 — — — — —013N003E35A001S — 351054116373801 04/20/1993 — — — — —013N003E35A001S — 351054116373801 06/24/1999 13 — — — —013N003E35A001S — 351054116373801 12/07/2011 11 — — — —013N003E35B001S L-1 351054116373601 01/01/1955 — — — — —013N003E35B001S — 351054116373601 01/07/1963 — — — — —013N003E35B001S — 351054116373601 11/19/1986 — — — — —013N003E35J001S LL2-699 351019116373501 06/26/2002 16 — — <0.8 —013N003E35J001S — 351019116373501 05/10/2011 14 — — — —013N003E35J002S LL2-415 351019116373502 06/25/2002 14 — — <0.8 —013N003E35J002S — 351019116373502 05/10/2011 14 — — — —013N003E35J003S LL2-190 351019116373503 06/25/2002 8 — — E0.6 —

82 Geohydrology, Geochemistry, Groundwater Simulation and Analysis of Potential Water-Supply Management Options
Appendix 2. Water-quality data for selected wells and a spring in Langford Basin, Fort Irwin National Training Center, California, 1955–2011.—Continued[See Well-Numbering System in text. Abbreviations: AL-US, U.S. Environmental Protection Agency (USEPA) action level; CaCO3, calcium carbonate; E, estimated; HAL-US, USEPA lifetime health advisory level; M, presence verified but not quantified; MCL-US, USEPA maximum contaminant level; na, not available; NH4, ammonium; NL-CA, California Department of Public Health (CDPH) notification level; mg/L, milligrams per liter; pCi/L, picocuries per liter; per mil, parts per million; R, radchem non-detect, below ssLc; SiO2, sili-con dioxide; SMCL-CA, CDPH maximum contaminant level;TU, tritium units; μg/L, micrograms per liter; μS/cm, microsiemens per centimeter at 25 degrees Celsius (°C); <, actual value is less than value shown; —, no data]
State well
number
Local well name
Station number Date
Copper, water, filtered(µg/L)
Iron, water, filtered(µg/L)
Lead, water, filtered(µg/L)
Lithium, water, filtered(µg/L)
Manganese, water, filtered(µg/L)
MCL type 1,300AL-US
300SMCL-US
15AL-US na 50
SMCL-CA012N003E01M001S LL04-1 350929116372301 08/02/2011 — 14.7 — 77 21.0012N003E01M004S LL04B-1 350929116372201 05/11/2011 — <3.2 — 62 29.9012N003E01M005S LL04B-2 350929116372202 12/08/2011 — 14.9 — 66 1.8013N003E11NS01S Garlic Spring 351348116382701 06/30/1993 1.0 28.0 <1.0 41 6.0013N003E23F001S LX-1 351226116380401 10/09/1980 — — — — 40.0013N003E23F001S — 351226116380401 11/19/1986 — — — — M013N003E23P001S LP-3 351154116380101 10/20/1980 — — — — —013N003E23P001S — 351154116380101 11/19/1986 — — — — M013N003E23P001S — 351154116380101 04/20/1993 — — — — <30013N003E23P001S — 351154116380101 06/24/1999 — 24.5 — — 10.4013N003E24N001S LL3 351153116371601 06/26/2002 — <30.0 — 27 6.2013N003E26K001S LP-2 351125116374901 04/03/1989 — — — — 10.0013N003E26K001S — 351125116374901 04/20/1993 — — — — <30013N003E26K001S — 351125116374901 05/20/1993 <1.0 10.0 <1.0 46 <1.00013N003E26K001S — 351125116374901 06/24/1999 — <10.0 — — <3.00013N003E26K001S — 351125116374901 05/12/2011 — 6.0 — 50 0.3013N003E26K002S LL1-780 351128116374701 08/03/1999 — <10.0 — — 8.7013N003E26K002S — 351128116374701 07/26/2000 — <10.0 — 12 5.4013N003E26K002S — 351128116374701 11/02/2011 — 12.9 — 20 2.3013N003E26K003S LL1-420 351128116374702 06/25/1999 — <10.0 — — 35.1013N003E26K003S — 351128116374702 07/27/2000 — <10.0 — 42 27.0013N003E26K003S — 351128116374702 11/02/2011 — <3.2 — 66 23.2013N003E26K004S LL1-210 351128116374703 08/03/1999 — <10.0 — — <3.00013N003E26K004S — 351128116374703 07/26/2000 — <10.0 — 45 E1.14013N003E26N001S L-3 351107116382701 02/24/1988 — — — — M013N003E26N001S — 351107116382701 08/04/1999 — E5.7 — — <3.00013N003E26N001S — 351107116382701 08/04/1999 — E5.7 — — <3.00013N003E26N001S — 351107116382701 08/04/1999 — <10.0 — — <3.00013N003E26N002S TH-8 351106116382801 04/13/1988 — — — — M013N003E26N002S — 351106116382801 07/30/1993 1.0 150.0 <1.0 50 5.0013N003E34Q001S TH-10 351020116385101 04/13/1988 — — — — M013N003E35A001S LP-1 351054116373801 04/17/1989 — — — — <10013N003E35A001S — 351054116373801 04/20/1993 — — — — <30013N003E35A001S — 351054116373801 06/24/1999 — 15.9 — — <3.00013N003E35A001S — 351054116373801 12/07/2011 — 3.9 — 42 0.6013N003E35B001S L-1 351054116373601 01/01/1955 — — — — —013N003E35B001S — 351054116373601 01/07/1963 — — — — —013N003E35B001S — 351054116373601 11/19/1986 — — — — —013N003E35J001S LL2-699 351019116373501 06/26/2002 — <30.0 — 46 49.1013N003E35J001S — 351019116373501 05/10/2011 — <6.4 — 52 13.9013N003E35J002S LL2-415 351019116373502 06/25/2002 — <10.0 — 29 6.3013N003E35J002S — 351019116373502 05/10/2011 — <3.2 — 27 <0.16013N003E35J003S LL2-190 351019116373503 06/25/2002 — <10.0 — 45 11.1

Appendix 2 83
Appendix 2. Water-quality data for selected wells and a spring in Langford Basin, Fort Irwin National Training Center, California, 1955–2011.—Continued[See Well-Numbering System in text. Abbreviations: AL-US, U.S. Environmental Protection Agency (USEPA) action level; CaCO3, calcium carbonate; E, estimated; HAL-US, USEPA lifetime health advisory level; M, presence verified but not quantified; MCL-US, USEPA maximum contaminant level; na, not available; NH4, ammonium; NL-CA, California Department of Public Health (CDPH) notification level; mg/L, milligrams per liter; pCi/L, picocuries per liter; per mil, parts per million; R, radchem non-detect, below ssLc; SiO2, sili-con dioxide; SMCL-CA, CDPH maximum contaminant level;TU, tritium units; μg/L, micrograms per liter; μS/cm, microsiemens per centimeter at 25 degrees Celsius (°C); <, actual value is less than value shown; —, no data]
State well
number
Local well name
Station number Date
Molybdenum, water, filtered(µg/L)
Nickel, water, filtered(µg/L)
Silver, water, filtered(µg/L)
Strontium, water, filtered(µg/L)
Thallium, water, filtered(µg/L)
MCL type 40HAL-US
100MCL-US
100SMCL-CA
4,000HAL-US
2MCL-US
012N003E01M001S LL04-1 350929116372301 08/02/2011 — — — 772 —012N003E01M004S LL04B-1 350929116372201 05/11/2011 — — — 1,340 —012N003E01M005S LL04B-2 350929116372202 12/08/2011 — — — 397 —013N003E11NS01S Garlic Spring 351348116382701 06/30/1993 90 <1.0 <1.0 470 —013N003E23F001S LX-1 351226116380401 10/09/1980 — — — — —013N003E23F001S — 351226116380401 11/19/1986 — — — — —013N003E23P001S LP-3 351154116380101 10/20/1980 — — — — —013N003E23P001S — 351154116380101 11/19/1986 — — — — —013N003E23P001S — 351154116380101 04/20/1993 — — — — —013N003E23P001S — 351154116380101 06/24/1999 — — — 236 —013N003E24N001S LL3 351153116371601 06/26/2002 — — — 763 —013N003E26K001S LP-2 351125116374901 04/03/1989 — — — — —013N003E26K001S — 351125116374901 04/20/1993 — — — — —013N003E26K001S — 351125116374901 05/20/1993 41 <1.0 <1.0 260 —013N003E26K001S — 351125116374901 06/24/1999 — — — 251 —013N003E26K001S — 351125116374901 05/12/2011 — — — 231 —013N003E26K002S LL1-780 351128116374701 08/03/1999 — — — 135 —013N003E26K002S — 351128116374701 07/26/2000 — — — 125 —013N003E26K002S — 351128116374701 11/02/2011 — — — 128 —013N003E26K003S LL1-420 351128116374702 06/25/1999 — — — 214 —013N003E26K003S — 351128116374702 07/27/2000 — — — 216 —013N003E26K003S — 351128116374702 11/02/2011 — — — 220 —013N003E26K004S LL1-210 351128116374703 08/03/1999 — — — 280 —013N003E26K004S — 351128116374703 07/26/2000 — — — 292 —013N003E26N001S L-3 351107116382701 02/24/1988 — — — — —013N003E26N001S — 351107116382701 08/04/1999 — — — 436 —013N003E26N001S — 351107116382701 08/04/1999 — — — 427 —013N003E26N001S — 351107116382701 08/04/1999 — — — 431 —013N003E26N002S TH-8 351106116382801 04/13/1988 — — — — —013N003E26N002S — 351106116382801 07/30/1993 22 <1.0 <1.0 420 <0.5013N003E34Q001S TH-10 351020116385101 04/13/1988 — — — — —013N003E35A001S LP-1 351054116373801 04/17/1989 — — — — —013N003E35A001S — 351054116373801 04/20/1993 — — — — —013N003E35A001S — 351054116373801 06/24/1999 — — — 303 —013N003E35A001S — 351054116373801 12/07/2011 — — — 313 —013N003E35B001S L-1 351054116373601 01/01/1955 — — — — —013N003E35B001S — 351054116373601 01/07/1963 — — — — —013N003E35B001S — 351054116373601 11/19/1986 — — — — —013N003E35J001S LL2-699 351019116373501 06/26/2002 — — — 1,230 —013N003E35J001S — 351019116373501 05/10/2011 — — — 1,410 —013N003E35J002S LL2-415 351019116373502 06/25/2002 — — — 967 —013N003E35J002S — 351019116373502 05/10/2011 — — — 929 —013N003E35J003S LL2-190 351019116373503 06/25/2002 — — — 544 —
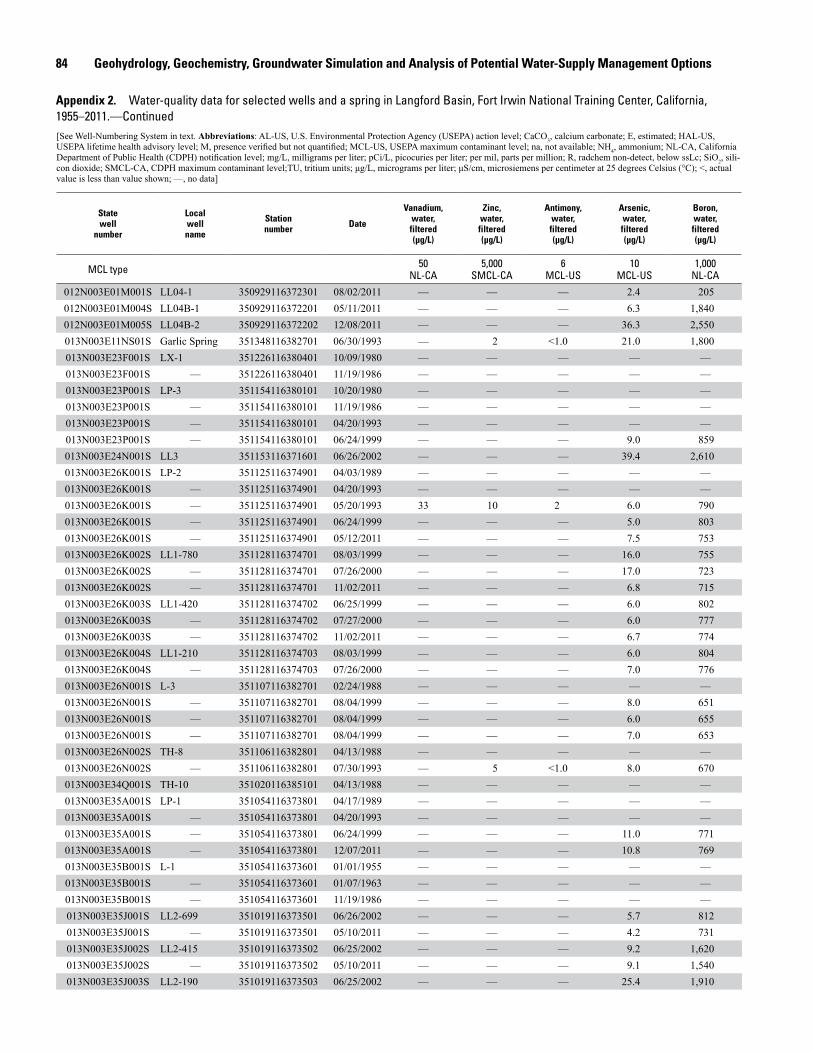
84 Geohydrology, Geochemistry, Groundwater Simulation and Analysis of Potential Water-Supply Management Options
Appendix 2. Water-quality data for selected wells and a spring in Langford Basin, Fort Irwin National Training Center, California, 1955–2011.—Continued[See Well-Numbering System in text. Abbreviations: AL-US, U.S. Environmental Protection Agency (USEPA) action level; CaCO3, calcium carbonate; E, estimated; HAL-US, USEPA lifetime health advisory level; M, presence verified but not quantified; MCL-US, USEPA maximum contaminant level; na, not available; NH4, ammonium; NL-CA, California Department of Public Health (CDPH) notification level; mg/L, milligrams per liter; pCi/L, picocuries per liter; per mil, parts per million; R, radchem non-detect, below ssLc; SiO2, sili-con dioxide; SMCL-CA, CDPH maximum contaminant level;TU, tritium units; μg/L, micrograms per liter; μS/cm, microsiemens per centimeter at 25 degrees Celsius (°C); <, actual value is less than value shown; —, no data]
State well
number
Local well name
Station number Date
Vanadium, water, filtered(µg/L)
Zinc, water, filtered(µg/L)
Antimony, water, filtered(µg/L)
Arsenic, water, filtered(µg/L)
Boron, water, filtered(µg/L)
MCL type 50NL-CA
5,000SMCL-CA
6MCL-US
10MCL-US
1,000NL-CA
012N003E01M001S LL04-1 350929116372301 08/02/2011 — — — 2.4 205012N003E01M004S LL04B-1 350929116372201 05/11/2011 — — — 6.3 1,840012N003E01M005S LL04B-2 350929116372202 12/08/2011 — — — 36.3 2,550013N003E11NS01S Garlic Spring 351348116382701 06/30/1993 — 2 <1.0 21.0 1,800013N003E23F001S LX-1 351226116380401 10/09/1980 — — — — —013N003E23F001S — 351226116380401 11/19/1986 — — — — —013N003E23P001S LP-3 351154116380101 10/20/1980 — — — — —013N003E23P001S — 351154116380101 11/19/1986 — — — — —013N003E23P001S — 351154116380101 04/20/1993 — — — — —013N003E23P001S — 351154116380101 06/24/1999 — — — 9.0 859013N003E24N001S LL3 351153116371601 06/26/2002 — — — 39.4 2,610013N003E26K001S LP-2 351125116374901 04/03/1989 — — — — —013N003E26K001S — 351125116374901 04/20/1993 — — — — —013N003E26K001S — 351125116374901 05/20/1993 33 10 2 6.0 790013N003E26K001S — 351125116374901 06/24/1999 — — — 5.0 803013N003E26K001S — 351125116374901 05/12/2011 — — — 7.5 753013N003E26K002S LL1-780 351128116374701 08/03/1999 — — — 16.0 755013N003E26K002S — 351128116374701 07/26/2000 — — — 17.0 723013N003E26K002S — 351128116374701 11/02/2011 — — — 6.8 715013N003E26K003S LL1-420 351128116374702 06/25/1999 — — — 6.0 802013N003E26K003S — 351128116374702 07/27/2000 — — — 6.0 777013N003E26K003S — 351128116374702 11/02/2011 — — — 6.7 774013N003E26K004S LL1-210 351128116374703 08/03/1999 — — — 6.0 804013N003E26K004S — 351128116374703 07/26/2000 — — — 7.0 776013N003E26N001S L-3 351107116382701 02/24/1988 — — — — —013N003E26N001S — 351107116382701 08/04/1999 — — — 8.0 651013N003E26N001S — 351107116382701 08/04/1999 — — — 6.0 655013N003E26N001S — 351107116382701 08/04/1999 — — — 7.0 653013N003E26N002S TH-8 351106116382801 04/13/1988 — — — — —013N003E26N002S — 351106116382801 07/30/1993 — 5 <1.0 8.0 670013N003E34Q001S TH-10 351020116385101 04/13/1988 — — — — —013N003E35A001S LP-1 351054116373801 04/17/1989 — — — — —013N003E35A001S — 351054116373801 04/20/1993 — — — — —013N003E35A001S — 351054116373801 06/24/1999 — — — 11.0 771013N003E35A001S — 351054116373801 12/07/2011 — — — 10.8 769013N003E35B001S L-1 351054116373601 01/01/1955 — — — — —013N003E35B001S — 351054116373601 01/07/1963 — — — — —013N003E35B001S — 351054116373601 11/19/1986 — — — — —013N003E35J001S LL2-699 351019116373501 06/26/2002 — — — 5.7 812013N003E35J001S — 351019116373501 05/10/2011 — — — 4.2 731013N003E35J002S LL2-415 351019116373502 06/25/2002 — — — 9.2 1,620013N003E35J002S — 351019116373502 05/10/2011 — — — 9.1 1,540013N003E35J003S LL2-190 351019116373503 06/25/2002 — — — 25.4 1,910

Appendix 2 85
Appendix 2. Water-quality data for selected wells and a spring in Langford Basin, Fort Irwin National Training Center, California, 1955–2011.—Continued[See Well-Numbering System in text. Abbreviations: AL-US, U.S. Environmental Protection Agency (USEPA) action level; CaCO3, calcium carbonate; E, estimated; HAL-US, USEPA lifetime health advisory level; M, presence verified but not quantified; MCL-US, USEPA maximum contaminant level; na, not available; NH4, ammonium; NL-CA, California Department of Public Health (CDPH) notification level; mg/L, milligrams per liter; pCi/L, picocuries per liter; per mil, parts per million; R, radchem non-detect, below ssLc; SiO2, sili-con dioxide; SMCL-CA, CDPH maximum contaminant level;TU, tritium units; μg/L, micrograms per liter; μS/cm, microsiemens per centimeter at 25 degrees Celsius (°C); <, actual value is less than value shown; —, no data]
State well
number
Local well name
Station number Date
Iodide, water, filtered(mg/L)
Selenium, water, filtered(µg/L)
Carbon-14, water, filtered
(percent modern)
Tritium, water,
unfiltered (pCi/L)
Tritium, converted
from pCi/L to TU
MCL type na 50MCL-US na 20,000
MCL-CA na
012N003E01M001S LL04-1 350929116372301 08/02/2011 0.137 — 53.5 R−0.3 <0.2012N003E01M004S LL04B-1 350929116372201 05/11/2011 0.103 — 12.0 R0.2 <0.2012N003E01M005S LL04B-2 350929116372202 12/08/2011 0.070 — 20.1 — —013N003E11NS01S Garlic Spring 351348116382701 06/30/1993 0.041 — — — —013N003E23F001S LX-1 351226116380401 10/09/1980 — — — — —013N003E23F001S — 351226116380401 11/19/1986 — — — — —013N003E23P001S LP-3 351154116380101 10/20/1980 — — — — —013N003E23P001S — 351154116380101 11/19/1986 — — — — —013N003E23P001S — 351154116380101 04/20/1993 — — — — —013N003E23P001S — 351154116380101 06/24/1999 0.032 — 3.1 <0.3 <0.2013N003E24N001S LL3 351153116371601 06/26/2002 0.417 — — — —013N003E26K001S LP-2 351125116374901 04/03/1989 — — — — —013N003E26K001S — 351125116374901 04/20/1993 — — — — —013N003E26K001S — 351125116374901 05/20/1993 0.053 <1 — — —013N003E26K001S — 351125116374901 06/24/1999 0.029 — — — —013N003E26K001S — 351125116374901 05/12/2011 0.024 — 5.2 R0.2 <0.2013N003E26K002S LL1-780 351128116374701 08/03/1999 0.112 — 8.0 <0.3 <0.2013N003E26K002S — 351128116374701 07/26/2000 0.123 — — — —013N003E26K002S — 351128116374701 11/02/2011 0.117 — — — —013N003E26K003S LL1-420 351128116374702 06/25/1999 0.084 — 2.6 <0.3 <0.2013N003E26K003S — 351128116374702 07/27/2000 0.082 — — — —013N003E26K003S — 351128116374702 11/02/2011 0.071 — — — —013N003E26K004S LL1-210 351128116374703 08/03/1999 0.025 — 4.6 <0.3 <0.2013N003E26K004S — 351128116374703 07/26/2000 0.034 — — — —013N003E26N001S L-3 351107116382701 02/24/1988 — — — — —013N003E26N001S — 351107116382701 08/04/1999 0.008 — 21.9 <0.3 <0.2013N003E26N001S — 351107116382701 08/04/1999 0.008 — — — —013N003E26N001S — 351107116382701 08/04/1999 0.008 — — — —013N003E26N002S TH-8 351106116382801 04/13/1988 — — — — —013N003E26N002S — 351106116382801 07/30/1993 0.011 <1 — — —013N003E34Q001S TH-10 351020116385101 04/13/1988 — — — — —013N003E35A001S LP-1 351054116373801 04/17/1989 — — — — —013N003E35A001S — 351054116373801 04/20/1993 — — — — —013N003E35A001S — 351054116373801 06/24/1999 0.036 — 10.5 <0.3 <0.2013N003E35A001S — 351054116373801 12/07/2011 0.011 — — — —013N003E35B001S L-1 351054116373601 01/01/1955 — — — — —013N003E35B001S — 351054116373601 01/07/1963 — — — — —013N003E35B001S — 351054116373601 11/19/1986 — — — — —013N003E35J001S LL2-699 351019116373501 06/26/2002 0.243 — — — —013N003E35J001S — 351019116373501 05/10/2011 0.202 — 13.0 R−0.1 <0.2013N003E35J002S LL2-415 351019116373502 06/25/2002 0.051 — — — —013N003E35J002S — 351019116373502 05/10/2011 0.011 — 2.3 R0.1 <0.2013N003E35J003S LL2-190 351019116373503 06/25/2002 0.106 — — — —

86 Geohydrology, Geochemistry, Groundwater Simulation and Analysis of Potential Water-Supply Management Options
Appendix 2. Water-quality data for selected wells and a spring in Langford Basin, Fort Irwin National Training Center, California, 1955–2011.—Continued[See Well-Numbering System in text. Abbreviations: AL-US, U.S. Environmental Protection Agency (USEPA) action level; CaCO3, calcium carbonate; E, estimated; HAL-US, USEPA lifetime health advisory level; M, presence verified but not quantified; MCL-US, USEPA maximum contaminant level; na, not available; NH4, ammonium; NL-CA, California Department of Public Health (CDPH) notification level; mg/L, milligrams per liter; pCi/L, picocuries per liter; per mil, parts per million; R, radchem non-detect, below ssLc; SiO2, silicon dioxide; SMCL-CA, CDPH maximum contaminant level;TU, tritium units; μg/L, micrograms per liter; μS/cm, microsiemens per centimeter at 25 degrees Celsius (°C); <, actual value is less than value shown; —, no data]
State well
number
Local well name
Station number Date
Uranium (natural),
water, filtered(µg/L)
delta Carbon-13,
water, unfiltered (per mil)
delta Oxygen-18,
water, unfiltered(per mil)
DeltaHydrogen-2,
water, unfiltered(per mil)
MCL na na na na
012N003E01M001S LL04-1 350929116372301 08/02/2011 — −8.70 −10.45 −89.7012N003E01M004S LL04B-1 350929116372201 05/11/2011 0.7 −9.70 −10.60 −92.8012N003E01M005S LL04B-2 350929116372202 12/08/2011 — −8.73 −11.47 −96.2013N003E11NS01S Garlic Spring 351348116382701 06/30/1993 4.0 — −11.43 −90.5013N003E23F001S LX-1 351226116380401 10/09/1980 — — — —013N003E23F001S — 351226116380401 11/19/1986 — — — —013N003E23P001S LP-3 351154116380101 10/20/1980 — — — —013N003E23P001S — 351154116380101 11/19/1986 — — — —013N003E23P001S — 351154116380101 04/20/1993 — — — —013N003E23P001S — 351154116380101 06/24/1999 — −5.90 −12.39 −97.2013N003E24N001S LL3 351153116371601 06/26/2002 — — −11.39 −93.8013N003E26K001S LP-2 351125116374901 04/03/1989 — — — —013N003E26K001S — 351125116374901 04/20/1993 — — — —013N003E26K001S — 351125116374901 05/20/1993 17.0 — −12.10 −95.5013N003E26K001S — 351125116374901 06/24/1999 — — −11.87 −94.7013N003E26K001S — 351125116374901 05/12/2011 13.0 −5.82 −11.80 −95.6013N003E26K002S LL1-780 351128116374701 08/03/1999 — −9.60 −11.57 −93.9013N003E26K002S — 351128116374701 07/26/2000 — — −11.68 −94.0013N003E26K002S — 351128116374701 11/02/2011 — — −11.56 −94.0013N003E26K003S LL1-420 351128116374702 06/25/1999 — −6.41 −12.11 −97.1013N003E26K003S — 351128116374702 07/27/2000 — — −12.07 −94.1013N003E26K003S — 351128116374702 11/02/2011 — — −12.01 −97.5013N003E26K004S LL1-210 351128116374703 08/03/1999 — −6.28 −12.05 −97.3013N003E26K004S — 351128116374703 07/26/2000 — — −12.05 −97.6013N003E26N001S L-3 351107116382701 02/24/1988 — — — —013N003E26N001S — 351107116382701 08/04/1999 — −5.94 −11.18 −91.0013N003E26N001S — 351107116382701 08/04/1999 — — −11.29 −90.2013N003E26N001S — 351107116382701 08/04/1999 — — −11.23 −91.4013N003E26N002S TH-8 351106116382801 04/13/1988 — — — —013N003E26N002S — 351106116382801 07/30/1993 12.0 — −11.18 −91.4013N003E34Q001S TH-10 351020116385101 04/13/1988 — — — —013N003E35A001S LP-1 351054116373801 04/17/1989 — — — —013N003E35A001S — 351054116373801 04/20/1993 — — — —013N003E35A001S — 351054116373801 06/24/1999 — −7.11 −11.49 −94.1013N003E35A001S — 351054116373801 12/07/2011 — — −11.58 −94.2013N003E35B001S L-1 351054116373601 01/01/1955 — — — —013N003E35B001S — 351054116373601 01/07/1963 — — — —013N003E35B001S — 351054116373601 11/19/1986 — — — —013N003E35J001S LL2-699 351019116373501 06/26/2002 — — −10.51 −91.1013N003E35J001S — 351019116373501 05/10/2011 0.1 −9.88 −10.44 −90.2013N003E35J002S LL2-415 351019116373502 06/25/2002 — — −11.20 −95.7013N003E35J002S — 351019116373502 05/10/2011 1.5 −8.87 −11.26 −95.6013N003E35J003S LL2-190 351019116373503 06/25/2002 — — −11.16 −94.3
1The Hal-US is 30 mg/L “as ammonia.” For comparison to the analytical results, this HAL-US has been converted and reported as 24.7 mg/L “as nitrogen.”

Voronin and others—G
eohydrology, Geochem
istry, and Groundw
ater Simulation (1992–2011) and A
nalysis of Potential Water-Supply M
anagement
Options, 2010–60, of the Langford B
asin, California—SIR 2013–5101