water-resources investigations in … investigations in tennessee: programs and activities of the...
TRANSCRIPT

WATER-RESOURCES INVESTIGATIONS IN TENNESSEE: PROGRAMS AND ACTIVITIES OF THE U.S. GEOLOGICAL SURVEY, 1988439
U.S. GEOLOGICAL SURVEY Open-File Report 89-379

close correlation between concentrations of total organic carbon (TOC) and most trace metals at the sinkhole and the spring stations suggests that these constituents are transported together.
A report was published in 1988 summarizing the data collected during the first 6 months of the investigation. The project leader is hydrologist Anne Hoos, assisted by hydrologic technician Jerry Garrett.
IMI'AC'I'ONG;IKOUND-WA1‘ER~UALI1'YOFBLAS'I'EI)-INSUBSUKFACE SEWAGE SYSTEM FIELD LINES
Almost one-third of the population of Tennessee is served by subsurface sewage disposal sys- tems, which are the largest contributors of wastewater to the ground. This problem is likely to be more significant in subdivided tracts in suburban areas, especially where field lines have been in- stalled in blasted rock. The U.S. Geological Survey, in cooperation with the Tennessee Department of Health and Environment, Division of Construction Grants and Loans, is undertaking an inves- tigation to establish the nature and degree of relation between ground-water contamination and blasted-in field lines. Ground water samples were collected at two test sites; one control site, where the subsurface is suitable for a septic system, and an experimental site, where the field lines have been blasted-in. Initial results indicate high levels of bacteria (fecal coliform) at discharge sites downgradient from blasted-in systems. Other constituents indicative of septic effluent have been below levels of adverse impact. A dye-trace study is planned at the experimental site to determine the degree of connection between blasted-in septic systems and ground water.
This study is being conducted by hydrologist Dorothea Hanchar.
Block diagram showing flow of field line effluence from subsurface sewage system into blasted rock, to household well, and to nearby creek in subdivision using individual well-septic systems.
27

CI-lARACTERIZATION OF INFLOW OF PESTICIDES AND NUTRIENTS FROM STORM RUNOFF INTO REELFOOT LAKE, WEST TENNESSEE
Reelfoot Lake, in West Tennessee, is one of the most important natural resources in the State. The: lake and surrounding forests are a key tourism and recreation area in West Tennessee and has been a traditional commercial fishery. Intensive agricultural activity in the area surrounding Reel- foolt Lake, and storm runoff from tributaries result in the discharge of fertilizer and pesticide residues into the lake. The annual budget of nutrients and pesticides entering the lake from these sources, and the extent of contribution by storms, have not been adequately defined.
The U.S. Geological Survey, in cooperation with the Tennessee Department of Health and Environment, Division of Construction Grants and Loans, began an investigation in October 1987 to study the impact of agricultural activities on runoff into Reelfoot Lake. The 2-year investigation includes measurement of streamflow and collection and analysis of water samples from three tributaries (North Reelfoot Creek, South Reelfoot Creek, and Running Slough) to the lake during base flow and storms. Samples are analyzed for sediment concentration, nutrients, and triazine her- bicides.
Specific objectives of the investigation are to:
l Identify variation in concentrations of nutrients and pesticides relative to seasonal ef- fects and discharge for storm events, and
. Estimate the annual nutrient and pes- ticide loading for the three tributaries.
Samples collected in the first year of the in- vestigation during base flows and winter storm events show that most of the nitrogen is in the form of organic nitrogen. Concentrations of most triazine pesticides were below the limits of analytical detection. The exception was atra- zine, for which concentrations for these samples were as high as 1.6 micrograms per liter. In water samples collected during spring and sum- mer storm events, most nitrogen occurred in the form of ammonia. Concentrations of atrazine and alachlor were as high as 57 and 45 micro- grams per liter, respectively.
A report was published in 1988 presenting data collected during the first 6 months of the in- vestigation. A final report summarizing data and interpretations of the study will be com- pleted in 1989. The project leader is hydrologist Anne Hoos, assisted by hydrologic technician Jerry Garrett.
35-x
EXPLANATION
010~310 8UrlmEe-water .lmn110rtn0 *t.t,on .lld number
Location of project area, Reelfoot Lake, and surface-water monitoring stations.
28

RECONNAISSANCE OF THE IMPACT OF AGRICULTURAL CHEMICALS ON GROUND-WATER QUALITY
During 1988, the U.S. Geological Survey, in cooperation with the Tennessee Department of Health and Environment, Division of Construction, Grants, and Loans, conducted an investigation to determine the contribution of chemicals in agricultural runoff to ground water. Shallow wells at three sites were sampled for nitrogen species and pesticides. Sampling sites, located in Shelby, Lake, and Haywood Counties, were chosen as representing the three major agricultural practices of West Tennessee (corn, soybeans, and cotton). All wells were located near fields under active cultivation of these crops.
Samples were collected in January, February, and June 1988. Results from pesticide analyses showed concentrations were below analytical detection limits for triazine herbicides (used on all crop types to control grasses), and organophosphorus insecticides (used for the control of the boll weevil, and sampled for in Haywood County only). Results from nutrient analyses indicated a wide range of concentrations for nitrogen constituents. Relatively high concentrations of total nitrite plus nitrate (NO;! + NO3 as nitrogen) were detected in some of the wells sampled. These con- centrations did not exceed the Federal or State standards for drinking water of 10 milligrams per liter of nitrite plus nitrate. The measured concentrations are indicative of the occurrence of nitrogen in ground water as a result of agricultural activities.
As a result of the project, one or more wells at each site are under consideration for inclusion in a long-term, statewide monitoring network for ground-water quality. A water-resources inves- tigation report documenting the results of the study is in preparation. Hydrologist Dorothea Hanchar directed the project.
Location of sampling sites in Haywood, Lake, and Shelby Counties.
29

HYDROGEOLOGY AND DELINEATION OF WELLHEAD-PROTECTION AREAS AT JACKSON, TENNESSEE
An investigation of the hydrogeology of the Jackson area, in West Tennessee as part of a local wellhead-protection program, was initiated by the U.S. Geological Survey in cooperation with the Jackson Utility Division (JUD) in 1988. The project is a continuation of a pilot investigation of the Jackson area begun in 1987 for the development of wellhead-protection areas for the two municipal well fields by the City of Jackson. The initial investigation included a preliminary assessment of the local hydrogeology, ground-water quality, and potential sources of contamination.
The purpose of the current phase is to describe in further detail the hydrogeology of the Jack- son area. The detailed data will be used by the JUD to define short- and long-term threats to the quality of ground water, and adopt strategies to protect municipal supplies. Project tasks include:
l Mapping the lithology and geometry of the aquifers and confining layers in detail l Mapping the configuration of the water-table and potentiometric-surfaces l Mapping directions of ground-water flow l Delineating areas of ground-water recharge and discharge l Simulating the ground-water flow system l Delineating areas that contribute ground water to the i
municipal wells ID %
Potential sources of ground-water contamination were determined during the pilot investigation. During 1988 and early 1989, maps of subsurface geology and lithology, con- structed on a regional scale by other investigators, were refined using additional local information from drillers’ logs and borehole geophysical logs. Nearly 100 domestic and industrial wells were selected for water-level measurements, to be con- ducted in the spring of 1989. Stream discharge at numerous sites also was measured.
JACKSON
A finite-difference, ground-water flow model will be calibrated to average hydrologic conditions. An analytical 3~~33’ program in the model will be used to estimate zones of ground- water contribution to wells in the municipal well fields. .The project is directed, by hydrologist Zelda Bailey. EXPLANATION
NORTH WELL FIELD
SOUTH WELL FIELD
Location of Jackson study area.
30

(;EO(;HAPHIC INFOKMATION SYSTEM INVENTORY FOR THE STATE OF TENNESSEE
Within the last 4 years, the number of computerized Geographic Information Systems (GIS) within Tennessee has increased rapidly. In order to examine the present status of GIS efforts, the Tennessee State Planning Office, the Tennessee Comptroller of the Treasury, and the USGS entered into a cooperative agreement to collect information about mapping usage, computer equip- ment, GIS software, and existing digital data. The objectives of the project were to:
Conduct an inventory of existing mapping coverage, location-specific data bases, avail- able transformation software, and transfer techniques that exist at various state, federal, county, and municipal agencies Create a computer data base of the results of the survey Develop suggested standards for digitized data Describe, in general, communications techniques that can be used to transfer data from one computer system to another Create a map coverage of Tennessee and the 7.5minute quadrangle maps within the State and program retrieval of existing map coverage for each Publish the results of the project
ZONING
UTILITIES
i I
i I I I REFERENCE
GEODETIC/SURVEY CONTROL
Typical GIS coverages.
31

The project was completed in October, 1988. The following are the summarized results:
l 263 agencies were inventoried l 139 maintained one or more computers l 4,741 computerized data coverage existed for areas within Tennessee ‘m 120 location-specific data bases were available ,e 25 GIS systems were in operation
A data base called the GIS Inventory data base was completed for storage of the data. The data were entered into the data base and were cross-referenced by county, 7.5-minute quadrangle, and hydrologic unit code. A map coverage for each cross-referenced geographic unit was created for identification of existing coverage for that area.
A water-resources investigations report containing the summarized results of the project, general standards for digitized data, communication techniques for transfer of data, and an appen- dix containing guidelines for initiating a GIS is in review. Bill Barron, hydrologist, is the project chief.
32

SEDIMENT DEPOSITION AT WETLANDS NEAR BRIDGE CROSSINGS
The U.S. Geological Survey, in cooperation with the Tennessee Department of Transporta- tion (TDOT), is investigating the impact of highway crossings on sediment deposition at wetlands in West Tennessee. The 10 sites selected represent bottomland-hardwood forests and cypress- tupelo swamps along broad flood plains, common in the Gulf Coastal Plain. Highway crossings generally consist of fill material across flood plains with relief openings across main and overflow channels. The principal concern of TDOT is to determine if highway crossings have wide-spread effects on sedimentation processes and ecology of wetlands.
The study uses an interdisciplinary approach and includes techniques of hydrology, sedimen- tology, dendrochronology, geomorphology, and ecology. Dendrogeomorphic analysis provides the principal data for documentation of sediment deposition. The technique uses historic rates of deposition obtained by excavation of buried trees, which are then aged through tree-ring dating. This information allows for determination of rates of sediment accretion and for evaluation of spa- tial and temporal variation in sedimentation. Additionally, flow and sediment modeling are used to evaluate potential for deposition and to investigate cause and effect relations. In areas found to have altered sedimentation rates, the impact on wetlands ecology is evaluated. Ecological techni- ques include growth-trend analysis of tree-core samples and ecological analysis of vegetation-plot data. The 3-year study, scheduled for completion in 1990, is directed by Dr. Cliff Hupp, botanist.
Sampling layout at Big Sandy River at State Route 69, West Tennessee.
i
33

BOTANICAL TECHNIQUES USED FOR FLOOD-FREQUENCY INVESTIGATION
The Geomorphic-Ecological Research Unit of the Tennessee District is involved in develop- ing a new method for estimating flood frequency on Tennessee streams. The project, in coopera- tion with TDOT, is concerned with improving flood-frequency estimates on gaged and ungaged streams using dendrogeomorphic techniques. The method utilizes tree-ring anomalies that indi- cate flood1 damage within riparian trees to develop a flood record. Dendrochronologic identifica- tion of anomalies indicates the year of occurrence of a flood. A magnitude may be determined from the elevation of the sample. The information learned from trees will reveal historic flood data as far back as the oldest trees. Age of riparian trees usually surpasses the length of systematic record. Historic years of occurrence provided by this method can be used to extend the total years of record for a gaged stream or create an indirect flood record for an ungaged stream. Extended length of record will decrease the standard error involved in flood-frequency estimation. The standard method used by the U.S. Geological Survey in flood-frequency estimation uses systematic gage record, a method which can not be used on ungaged streams. Standard estimates for ungaged streams are determined by use of regional equations which have a high standard error in respect to individual streams. Dendrogeomorphically reconstructed flood history on gaged or ungaged streams is being used most efficiently. Results have improved the degree of confidence placed on a data set and allow for the development of accurate flood-frequency determination at ungaged sites. The project leaders are Dr. Cliff R. Hupp, botanist, and Bradley A. Bryan, hydrologist.
)r b- Scar damage from nine years ago --+ 01-l ll<~mpJ\\\J\l 1) 1 B _
a. Cross section of tree
Example of (a) cross section and (b) core sample of a 13-year-old tree.
34

DOCUMENTATION OF MILLINGTON :FLOOD
In cooperation with Shelby County and the City of Millington, Tennessee, the U.S. Geologi- cal Survey has completed a project to document the flood of December 25,1987, in the city and the northern part of the county. The data collected indicates that the flood on the Loosahatchie River had a recurrence interval in excess of 75 years, while the peak discharge on Big Creek was almost twice the discharge of the loo-year flood. For North Fork Creek, the flood was about equal to a loo-year flood.
The documentation of the flood included:
. Data on rainfall that caused the flood l Flood profiles for the streams involved l Computation of peak discharges and frequencies . Delineation of flooded areas and flood depths in Millington
The data will be published as a hydrologic atlas for use by local officials in planning for future flood-protection measures, zoning, and updating of flood-insurance studies.
The project chief was Jim Lewis, hydrologic technician from the Knoxville Subdistrict office.
Location of the Millington study area.
35

APPALACHIAN VALLEYS-PIEDMONT REClONAL AQUIFER-SYSTEM ANALYSIS
The APRASA (Appalachian Valleys-Piedmont Regional Aquifer-System Analysis) is one of 28 studies across the United States authorized by the U.S. Congress as a result of the drought of 1977. The purpose of each federally funded study is to define the regional hydrology and geology and to establish a frameworkof background information on geology, hydrology, and water chemistry of the Nation’s important aquifer systems. The APRASA study area covers 145,000 square miles and is occupied by 26 million people. Surface-water resources have been well allocated in the most populated areas, but are now over stressed. Increasing emphasis is being given to additional development of the ground-water resources. The Tennessee District is responsible for the Valley and Ridge part (45,000 square miles) of the APRASA.
Accomplishments during 1988 include fully staffing the APRASA headquarters office in Rich- mond, Va. Seven districts, Alabama, Georgia, South Carolina, North Carolina, Tennessee, Virginia, and West Virginia, are compiling data and converting the data into machine-readable formats. Three other districts Maryland, Pennsylvania, and New Jersey are extracting and interpreting data in available computer files. A draft of the planning report which defines the problems in the study area and describes the objectives and approaches of the study is being revised. A report on the dis-
charge of large springs in Tennessee is in review. In the Valley and Ridge province the hundreds of geologic units are being identified as principal aquifers, minor aquifers, and nonaqui- fers. Interpretation of chemical qual- ity of water in the aquifers has just begun. Discussions are underway to identify the typical hydrogeologic set- tings and ground-water flow systems that characterize the study area. The project leader for the Valley and Ridge part of the APRASA is E.F. “Pat” Hollyday. The project is scheduled for completion in 1992.
Location of the Appalachian Valleys-Piedmont Regional Aquifer- System Analysis study area.
36

WAYNE COUNTY LANDFILL INVESTIGATION
In 1987, the U.S. Geological Survey, in cooperation with the Tennessee Department of Health and Environment, Division of Superfund, initiated an investigation of the hydrogeology of the Wayne County landfill and adjoining area. The objectives of the project included:
. Determination of potential pathways of contaminants from the landfill to nearby sur- face and ground waters.
l Determination of water-quality conditions in ground water underlying the landfill, in leachate emanating from it, and in nearby streams.
l Determination of the nature and extent of contaminants, if any, in water and fauna in streams adjoining the site.
During 1988, drilling of 16 observation wells was completed. Preliminary characterization of the chemistry of leachate in seeps on the slopes of the landfill was completed. Samples were also collected from streams adjacent to the site. Samples of aquatic organisms in these streams were collected for preliminary analyses of contaminants in animal tissue.
Late in 1988 the project was temporarily halted while funding was obtained to complete the final phases. The project was re-activated in June 1989. A new schedule was prepared to complete sampling from wells, biological monitoring, interpretation of the data, and report prepara- tion. Hydrologists Roger Lee and Arthur Bradfield assisted by hydrologic technician N. Carolyn Short is in charge of the project. The project is scheduled for completion in April 1990.
W PROPOSED TEST WELL NEST
. SURFACE-WATER SAMPLING SITE
Location of Wayne County landfill study area.
37
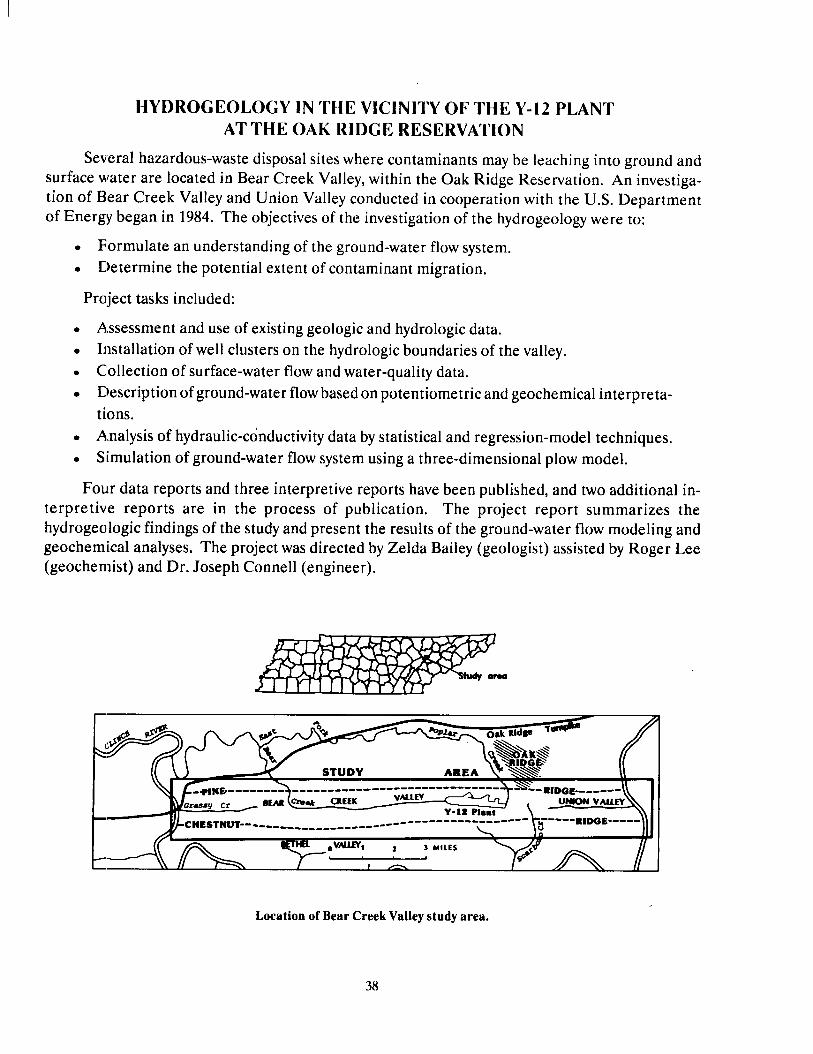
HYDROGEOLOCYINTHE VICINITYOFTHEY-12PLANT ATTHEOAKRlDGERESERVA'I‘ION
Several hazardous-waste disposal sites where contaminants may be leaching into ground and surface water are located in Bear Creek Valley, within the Oak Ridge Reservation. An investiga- tion of Bear Creek Valley and Union Valley conducted in cooperation with the U.S. Department of Energy began in 1984. The objectives of the investigation of the hydrogeology were to:
l Formulate an understanding of the ground-water flow system. l Determine the potential extent of contaminant migration.
Project tasks included:
l Assessment and use of existing geologic and hydrologic data. l Installation of well clusters on the hydrologic boundaries of the valley. . Collection of surface-water flow and water-quality data. l Description of ground-water flow based on potentiometric and geochemical interpreta-
tions. l Analysis of hydraulic-conductivity data by statistical and regression-model techniques. . Simulation of ground-water flow system using a three-dimensional plow model.
Four data reports and three interpretive reports have been published, and two additional in- terpretive reports are in the process of publication. The project report summarizes the hydrogeologic findings of the study and present the results of the ground-water flow modeling and geochemical analyses. The project was directed by Zelda Bailey (geologist) assisted by Roger Lee (geochemist) and Dr. Joseph Connell (engineer).
CHESTNUT----,,,, --___------- _______-mew_______--
Location of Bear Creek Valley study area.
38

OTHER ACTMTIES
GROUND-WATER INFORMATION UNll
In 1989, the U.S. Geological Survey organized a”Ground-Water Information Unit”in the Ten- nessee District. The objectives of this support unit are to ensure maximum utilization of ground- water data collected in Tennessee and to provide diverse support for all ground-water activities in the District. Specific functions of the unit are:
l Storage of new ground-water data l Cleanup and maintenance of ground-water data bases l Assistance to personnel in retrieving and plotting data . Answering information requests from cooperators, officials, and the public
A computerized data base maintained by the Tennessee District as part of the National Ground-Water Information System operated by the USGS, currently contains information on over 2,600 ground-water sites in Tennessee. Data from the District’s data base can be output directly as tables and hydrographs, or to the Geographic Information System (GIS) for graphical and statisti- cal analyses.
GEOGRAPHIC INFORMATION SYSTEM (CIS)
The GIS in the Tennessee District has been operational for about 1 year. During this preced- ing year various coverages have been assembled, and software support has been developed to facilitate project work. Interfaces between GE and U.S. Geological Survey data bases were developed. The following are 1988 highlights of goals achieved:
1. The following coverages were acquired or developed: a. Hydrography coverages for the State at l:lOO,OOO scale. These coverages have polygon,
line, and point features that represent lakes, streams, springs, and gaging stations.
b. Transportation coverages for the State at 1: 100,000 scale. (1) Roads and trails divided into five different categories; (2) Railroads (3) Pipelines, transmission lines, and miscellaneous transportation.
c. Land use and land cover coverage for the State at 1:250,000 scale. This coverage is divided into 9 general categories that are further subdivided into 37 sub-categories. The several categories include Urban, Agricultural, Forest, Water and so forth
d. County outline coverage at 1:250,000 and 1:2,500,000 scale.
e. Statewide streams, geology, and hydrologic units at a 1:2,500,000 scale.
f. Topographic coverage with 20- and lOO-foot contour intervals for the Oak Ridge Reser- vation.
39

COMPUTER SECTION AND ACTlVITlES
The Computer Unit of the Tennessee District continued to improve and to expand its capabilities in support of programs and cooperators. During 1988, the following milestones were accomplished:
1. A 16-channel multiplexor replaced an g-channel multiplexor in the Knoxville and Mem- phis Subdistrict Offices, and each was placed on a dedicated phone line. This provided faster communications from the field office to the main computer in Nashville. An addi- tional 16-channel multiplexor was added at the District Office to accommodate addition- al terminals.
2. Several new computer peripherals were purchased: a. A Macintosh II system was installed in the Publications Section for more efficient
graphics production. b. Two AST Premium 286 personal computers were added to assist and enhance report
typing and desktop publishing. c. All of the personal computers in the Hydrologic Investigations Section were connected
to a print-sharing device connected to a laser printer. d. A GIS workstation was installed consisting of an Altek digitizer and a Tektronix 4207
graphics terminal. e. A CD ROM drive was installed including an optical disk containing a file of the WRSIC
abstracts and USGS’s historical streamflow data. f. A 36” X 48” Calcomp digitizer was procured for use with computerized drafting software
in the Publications Section.
3. Data processing in the sediment laboratory in the Nashville Subdistrict was computerized.
4. Computing capabilities in the Investigation Section were enhanced by the installation of state-of-the-art word processing, statistics, and graphics programs.
5. Data coverage in the GIS system were expanded and applications in several surface and ground-water projects were developed.
The computer staff currently consists of Bill Barron, site manager; Joe Connell, GIS Ad- ministrator; Leticia Ables, computer operator; and Charlie McCoy, programmer trainee.
40

REGIONAL PUBLICATION CENTER
The Tennessee District operates a Regional Publication Center and Clearinghouse in support of projects within the District and the 10 other states in the Southeastern Region. Barbara Balthrop is the Chief of the Publication Center. The following is a list of the Center’s accomplishments during 1988 and its goals for 1989.
Accomplishments for 1988:
. Acquisition of two personal computers and graphics software for production of publi- cation-quality illustrations for reports
l Upgrade of personal computer used for desktop publishing
Goals for 1989:
l Acquire advance training for personnel preparing computer graphics l Compile and publish the National Computer Technology Meeting proceedings for
Headquarters
41

RECENT-PUBLICATIONS The Tennessee Center prepared for publication 4 Water-Resources Investigations Reports,
12 Ope:n-File Reports, 21 journal articles, abstracts, and symposia articles, and the annual data report. The Tennessee Center also compiled and printed a publication for the First Tennessee Hydrology Symposium containing 36 abstracts, along with printing 11 out-of-District reports, and 5 bi-monthly bulletins. Currently, there are approximately 25 reports in various stages of prepara- tion.
Reports Published
Bailey, :Z.C., 1988, Preliminary evaluation of ground-water flow in Bear Creek Valley, the Oak Ridge Reservation, Tennessee: U.S. Geological Survey Water-Resources Investigations Report 884010.
Bailey, Z.C., and Withington, D.B., 1988, Well construction, lithology, and geophysical logs for boreholes in Bear Creek Valley near Oak Ridge, Tennessee: U.S. Geological Survey Water- Resources Investigations Report 88-4068,21 p.
Broshears, R.E., 1988, Tennessee ground-water quality: U.S. Geological Survey Open-File Report 87-0753,8 p.
Carey, W.P., Brown, R.T., and Chatham, C.G., 1988, History of suspended-sediment data collection and inventory of available data for the Tennessee and Cumberland River basins: U.S. Geological Survey Open-File Report 88-497,51 p.
Carmichael, J.K., 1989, An investigation of shallow ground-water quality near East Fork Poplar Creek, Oak Ridge, Tennessee: U.S. Geological Survey Water-Resources Investigations Re:port 88-4219,49 p,
Garrett, J.W., 1988, Hydrologic and suspended-sediment data for Reelfoot Lake, Obion and Lake Counties, northwestern Tennessee, May 1985-September 1986: U.S. Geological Survey Open-File Report 88-170,50 p.
Hanchar, D.W., 1988, Geology of an area near Brentwood, Williamson County, Tennessee: U.S. Geological Survey Water-Resources Investigations Report 88-4176,24 p.
Hanchar, D.W., 1988, Construction, geologic, and water-level data for observation wells near Brentwood, Williamson County, Tennessee: U.S. Geological Survey Open-File Report 87-248,27 p.
Hoos, A.B., 1988, Water quality of runoff to the Clarksville Memorial Hospital drainage well and of Mobley Spring, Clarksville, Tennessee, February - March 1988: U.S. Geological Survey Open-File Report 88-310,26 p.
Hutson, S.S. Hutson, 1988, Estimated use of water in Tennessee, 1985: U.S. Geological Survey Open-File Report 88-438,l sheet. (Map)
42
McMaster, B.W., and Parks, W.S., 1988, Concentrations of selected trace inorganic constituents and synthetic organic compounds in the water-table aquifers in the Memphis area, Tennessee: U.S. Geological Survey Open-File Report 88-485,23 p.
Quinones, Ferdinand, 1988, U.S. Geological Survey ground-water studies in Tennessee: U.S. Geological Survey Open-File Report 88-145,2 p.
Quinones, Ferdinand, Balthrop, B.H., and Baker, E.G., 1988, Water-Resources investigations in Tennessee: Programs and activities of the U.S. Geological Survey, 1987-1988: U.S. Geologi- cal Survey Open-File Report 88-322,66 p.
Tucci, Patrick, and Hanchar, D.W., 1988, Lithologic, geophysical, and well-construction data for ob- servation wells in the Melton Valley area, Oak Ridge Reservation, Tennessee: U.S. Geologi- cal Survey Water-Resources Investigations Report 88-4197,22 p.
Webster, D.A., and Bradley, M.W., 1988, Hydrology of the Melton Valley radioactive-waste burial grounds at Oak Ridge National Laboratory, Tennessee: U.S. Geological Survey Open-File Report 87-686, 115 p.
Withington, D.B., 1988, Quality of ground water in shallow wells in agricultural areas of Haywood, Shelby, Lake, and Obion Counties, Tennessee, January and February 1988: U.S. Geological Survey Open-File Report 88-309, 12 p.
Yurewicz, MC., Carey, W.P., and Garrett, J.W., 1988, Streamflow and water-quality data for three major tributaries to Reelfoot Lake, West Tennessee, October 1987-March 1988: U.S. Geological Survey Open-File Report 88-3 11,20 p.
43

ADMINISTRATIVli: SERVICES SECTION
Administrative services to the Tennessee District headquarters and field offices are provided by a unit of four employees directed by Nancy Tedder, Administrative Officer. Personnel manage- ment, payroll, training, procurement, inventory control, budgeting, and accounting services are efficiently handled through computerized systems.
44

APPENDIX 1
Active Recording Surface-Water Stations in Tennessee as of 3/l/89 2
[mi , square miles; Lat, latitude; Long, longitude]
Drainage Station area Date
No. Name (mi2) Lat Long began
03408500 03409500 03414500 03416000 03417500
03417600
03418070 03421000 03422500 03425000
03425100 03425400 03426800 03427500 03428200
03428500 03430118 03431000
03431062
03431490
03431500
03431517 03431700
03431800 03432350
03432400 03433500 03434500 03435000 03435008
CUMBERLAND RIVER BASIN
New River at New River 382 Clear Fork near Robbins 272 E Fork Obey River nr Jamestown 202 Wolf River near Byrdstown 106 Cumberland River at Celina 7,307
Cumberland River at Penitentiary 7,440 Branch
Roaring River above Gainsboro 210 Collins River near McMinnville 640 Caney Fork near Rock Island 1,678 Cumberland River at Carthage 10,690
Cumberland River at Rome 10,866 Cumberland River at Hunters Point 11,107 East Fork Stones River at Woodbury 39.1 East Fork Stones River nr Lascassas 262 W Fork Stones River at Murfreesboro 128
West Fork Stones River near Smyrna 237 McCrory Cr at Ironwood Dr, at Donelson 7.31 Mill Creek near Antioch 64.0
Mill Creek trib. at Glenrose Ave., 1.17 at Woodbine
Pages Branch at Avondale 2.01
Cumberland River at Nashville 12,806
Cummings Branch at Lickton 2.40 Richland Creek at Charlotte Avenue, 24.3
at Nashville. Sycamore Creek near Ashland City 97.2 Harpeth River at Franklin 191
Harpeth River below Franklin 210 Harpeth River at Bellevue 408 Harpeth River near Kingston Springs 681 Cumberland River below Cheatham Dam 14,163 Cumberland River nr Clarksville 14,421
362308 843317 1934 362318 843749 1930 362458 850135 1942 363337 850423 1942 363315 853052 1922
362621 853542
362104 853245 1974 354232 854346 1925 354826 853744 1911 361453 855719 1922
361550 860410 361757 861549 1986 354941 860436 1962 355506 862002 1951 355410 862548 1972-82,
1986
355625 862754 1965 360908 863901 1977 360454 864050 1953-75,
1976 360702 864337 1977
361222 864624 1977
360945 854617 1892- 1954,1986
361825 864800 1975 360904 865116 1964
361912 870304 1961 355514 865156 1974
355653 865254 1986 360316 865542 1920 360719 870556 1925 361926 871332 1954 362956 871948
45

APPENDIX l--Continued
Active Recording Surface-Water Stations in Tennessee as of 3/l/89--Continued
Station Drainage
area Date n
No. Name (miL) Lat Long began
CUMBERLAND RIVER BASIN--Continued
03436000 Sulphur Fork Red River near Adams 186 363055 850332 03436100 Red River at Port Royal 935 363317 870831 03436500 Cumberland River at Clarksville 16,000 363228 872204
03436690 Yellow Creek at Ellis Mills 103 361839 873315 03437000 Cumberland River at Dover 16,530 362926 875020
03455000 French Broad River near Newport 1,858 355854 830940 1900 03465500 Nolichucky River at Embreeville 805 361035 822727 1920 03466228 Sinking Creek at Afton 13.7 361155 824431 1977 03487550 Reedy Creek at Orebank 36.3 363342 822736 1963 03490500 Holston River at Surgoinsville 2,874 362819 825050 1941
03491000 Big Creek near Rogersville 47.3 362534 825707 1957 13491544 Crockett Creek below Rogersville B-v 362247 830248 1989 03495500 Holston River near Knoxville 3,747 360056 834954 1930 03497300 Little River above Townsend 106 353952 834241 1963 03498500 Little River near Maryville 269 354710 835304 1951
03498850 03528000 03535912
TENNESSEE RIVER BASIN
Little River near Alcoa Clinch River above Tazewell Clinch River at Melton Hill Dam
03536320 White Oak Creek near Melton Hill 1.31 03536380 Whiteoak Creek near Wheat 2.10
03536440 Northwest Tributary near Oak Ridge 03536450 First Creek near Oak Ridge 03536550 Whiteoak Creek bl Melton Valley Drive
near Oak Ridge
.67 355518 841913 1987
.33 355521 841910 1987 3.28 355510 841902 1985
03537050 Melton Branch trib. (East Seven) near Oak Ridge
03537100 Melton Branch near Melton Hill, nr Oak Ridge
.24
.52
03537200 Melton Branch trib. (Center Seven) near Oak Ridge
.07 355503 841754 1987
03537300 Melton Branch trib. (West Seven) near Oak Ridge
.15 355511 841808 1987
03538225 Poplar Creek near Oak Ridge 03538250 East Fork Poplar Creek near Oak Ridge 035382672 Bear Creek trib. abv Bear Creek Road
near Wheat
82.5 355955 842023 1960 19.5 355758 842130 1960
.30 355641 841927 1986
300 1,474 3,343
354832 835536 1986 362530 832354 1918 355307 841803 1936 355556 841820 1987 355530 841852 1987
355507 841743
355459 841753
1987
1985
1939 1961
1924-44, 1986 1980 1986
46
APPENDIX l--Continued
Active Recording Surface-Water Stations in Tennessee as of 3/l/89--Continued
Station Drainage
area Date
No. Name (mi2) Lat Long began
TENNESSEE RIVER BASIN--Continued
035382673 Bear Creek near Wheat 3.20 355639 841927 1986 035382677 Bear Creek tributary near Wheat .14 355628 841955 1987 03538270 Bear Creek at St. Hwy 95 near Oak Ridge 4.34 355617 842029 1985 035382 72 Bear Creek trib. at Hwy 95 near Wheat .14 355626 842032 1986 03538273 Bear creek at Pine Ridge near Wheat 5.00 355632 842037 1986
03540500 Emory River at Oakdale 764 355859 a43329 03543500 Sewee Creek near Decatur 117 353453 a44453 03560500 Davis Mill Creek at Copperhill 5.16 345943 842256
1927 1934
1940-41, 1948-78,
1986 1913
1911-16, 1921
03563000 Ocoee River at Emf 524 350548 843207 03564500 Ocoee River at Parksville 595 350548 843915
03565500 Oostanaula Creek near Sanford 57.0 351939 844219 03566000 Hiwassee River at Charleston 2,298 351716 844507
1954 1898-1903,
1914-40, 1963 1964
1928-78, 1980
03566420 Wolftever Creek near Ooltewah 18.8 350343 850359 03567500 South Chickamauga Creek nr Chickamauga 428 350051 851235
03567900 Tennessee River at Citico Bar at Chattanooga
21,372 350319 861704
03568000 03571000 03580995
Tennessee River at Chattanooga 21,380 Sequatchie River near Whitwell 402 East Fork Mulberry Creek below Jack 23.3
Daniels Distillery at Lynchburg Elk River near Prospect 1,784
350512 851643 1874 351222 852948 1920 351656 862217 1988
03584500 350139 865652 1904-08, 1919
1932-34, 1967
03588000 Shoal Creek at Lawrenceburg 55.4 351440 872102
03588500 03593005
Shoal Creek at Iron City Tennessee River at Pickwick
Landing Dam Tennessee River at Savannah Duck River near Shelbyville Carters Creek at Butler Rd at
Carters Creek
348 32,820
33,140 481
20.1
350127 873444 1925 350354 881508 1975
03593500 03598000 03600088
351329 881526 1930 352849 a62957 1934 354302 865945 1986
47
APPENDIX l--Continued
Active Recording Surface-Water Stations in Tennessee as of 3/l/89--Continued
Station
No. Name
Drainage area Date
2 (mi 1 Lat Long began
TENNESSEE RIVER BASIN--Continued
03600500 Big Bigby Creek at Sandy Hook 17.5 03602219 Piney River at Cedar Hill 46.6 03602500 Piney River at Vernon 193 03603000 Duck River above Hurricane Mills 2,557
03604000 Buffalo River near Flat Woods 447 03604500 Buffalo River near Lobelville 707
OBION RIVER BASIN
07024300 Beaver Creek at Huntingdon 55.5 07024500 S. Fork Obion River nr Greenfield 383 07025500 N. Fork Obion River at Union City 480 07026000 Obion River at Obion 1,852
07026370 North Reelfoot Creek at State Hwy 22 56.3 nr Clayton
07026400 South Reelfoot Creek near Clayton 38.6 07026640 Running Slough near Ledford, Ky. 10.8
07027000 Reelfoot Lake near Tiptonville 240 07027500 S.F. Forked Deer River at Jackson 495
HATCHIE RIVER BASIN
07029500 Hatchie River at Bolivar 1,480
LOOSAHATCHIE RIVER BASIN
07030240 Loosahatchie River near Arlington 262 070303573 Loosahatchie River at North Watkins 728
Street, at Memphis
WOLF RIVER BASIN
07031660 Wolf River at Walnut Grove Road, at Memphis
07031740 Wolf River at Hollywood St., at Memphis
709
788
352919 871359 355943 872622 355216 873005 355548 874435
352945 874958 354846 874751
355956 882601 360705 884839 362359 885943 361504 891133
362750 891513
362620 891537 363228 891859
362109 892507 353338 884852
361631 885836 1929
351837 893823 1969 351515 900134 1986
350758 895118 1986
351116 895832 1986
1953 1988 1925 1925
1920 1927
1962 1929 1989
1929-58, 1966
1980-83 1984
1984 1982-83,
1984 1940 1988
48

APPENDIX l--Continued
Active Recording Surface-Water Stations in Tennessee as of 3/l/89--Continued
Station
No. Name
Drainage area Date
2 (mi 1 Lat Long began
NONCONNAH CREEK BASIN
07032200 Nonconnah Creek near Germantown 68.2 350259 894908 1969 07032251 Nonconnah Creek at Rivergate Road, 182 350432 900355 1986
at Memphis
49

APPENDIX l--Continued
Active Crest-Stage Stations in Tennessee as of 3/l/89
.z [ml , square miles; Lat, latitude; Long, longitude; 4, Operated as a continuous-record station]
Station Drainage
area Date
No. Name (mi2) Lat Long began
CUMBERLAND RIVER BASIN
03409000 White Oak Creek at Sunbright 13.5 361438 844014
03418201 Doe Creek at Gainesboro 5.72 362123 853920 03420360 Mud Creek tributary No. 2 2.28 353610 860133
1934, 1955-82, 1985 1978 1967
near Summitville 03420600 Owen Branch near Centertown 4.60 354230 855305 1955 03421200 Charles Creek near McMinnville 31.1 354300 854605 1955
03424900 Mulherrin Creek near Gordonsville 26.9 361128 855711 1982, 1986 03425045 Peyton Creek at Monoville 44.7 361837 855921 1986 03425357 Darwin Branch tributary at Hartsville .66 362354 860908 1986 03425365 Second Creek near Walnut Grove 3.47 362401 861248 1986 03425500 Spring Creek near Lebanon 35.3 361049 861429 1955-61*, 1962
03425700 03426874 034269424 03428043
03430400
03431000 Mill Creek near Antioch 64.0 360454 864050
Spencer Creek near Lebanon Brawleys Fork below Bradyville Reed Creek near Bradyville Lytle Creek at Sanbyrne Drive
at Murfreesboro Mill Creek at Nolensville
03431040 Sevenmile Creek at Blackman Road at Nolensville
03431060 Mill Creek at Thompson Lane, near Woodbine
03431120 West Fork Browns Creek at General Bates Drive, at Nashville
03431240 East Fork Browns Creek at Baird-Ward Printing Company, at Nashville
03431340 Browns Creek at Factory Street, at Nashville
03431550 Earthman Fork at Whites Creek 03431573 Ewing Creek at Richmond Hill Drive
at Parkwood 03431575 Ewing Creek at Brick Church Pike at
Parkwood 03431578 Ewing Creek at Gwynwood Drive
near Jordonia
50
3.32 361420 862403 1955 15.4 354444 861014 1983
3.52 354444 861231 1983 17.6 354938 862328 1978
12.0 355732 864031 1965
12.2 360421 864400
93.4 360704 864308
3.30 360629 864707
1.58 360633 864600
13.2 360826 464531 1965
6.29 361555 864951 1965 2.17 361350 864628 1976
3.02 361358 864654 1976
9.98 361358 864732 1976
1954-61*, 1962-63, 1964-75*, 1976
1965
1965
1965
1965

APPENDIX l--Continued
Active Crest-Stage Stations in Tennessee as of 3/l/89--Continued
Station Drainage
area
No. Name 2 hi 1 Lat Long
CUMBERLAND RIVER BASIN--Continued
03431581 Ewing Creek below Knight Road, I 13.3 361355 864814 near Bordeaux
03431677 Sugartree Creek at YMCA Access Road, 1.51 360613 864912 at Green Hills
03431679 Sugartree Creek at Abbott Martin Road, 2.19 360623 864917 at Green Hills
03431795 Bednigo Branch trib. at Chestnut Grove .47 362510 865411 03432470 Murfrees Fork above Burwood 7.43 354858 865720
03432925 Little Harpeth River at Granny White 22.0 360130 864909 Pike, at Brentwood
1978
03434590 Jones Creek near Burns 13.3 360615 871905 1984 03434616 Hall Branch near Charlotte .50 361148 872030 1984 034350021 Bartons Creek near Cumberland Furnace 22.29 361502 872000 1984 0343500213 Bartons Creek tributary near Stayton .51 361519 871912 1984
034351113 Honey Run Creek below Cross Plains 25.8 363231 864214 03435770 Sulphur Fork Red River above 65.6 363047 865144
Springfield 03435930 Spring Creek tributary near Cedar Hill 1.40 363208 865926 03436505 Cummings Creek nr Dotsonville 2.65 362918 872806 03436700 Yellow Creek near Shiloh 124 362055 873220
03461230 Caney Creek near Cosby 1.62 354703 831211 1967 03465607 Cherokee Creek near Embreeville 22.9 361224 822923 1984 03465780 Clear Fork near Fair-view 10.5 361933 823347 1983 03466890 Lick Creek near Albany 172 361454 825534 1984 03467480 Bent Creek at Taylor Gap 2.18 361408 830641 1986
03467992 Carter Branch near White Pine 4.25 360705 831855 1986 03467993 Cedar Creek near Valley Home 2.01 360803 831847 1986 03467998 Sinking Fork at White Pine 6.38 360721 831744 1986 03470215 Dumplin Creek at Mt. Hareb 3.65 360459 832551 1986 03476960 Indian Creek at Childress 6.79 362538 821554 1983
03478615 Evans Creek near Blountville 2.50 363119 821812 1983 03481600 Corn Creek at Mountain City 5.34 362923 814852 1959-61, 1963 03487507 Horse Creek at Sullivan Gardens 26.0 362813 823552 1983
TENNESSEE RIVER BASIN
Date
began
1976
1976
1976
1986 1986
1986 1975
1986 1984
1957-80*, 1982

APPENDIX l--Continued
Active Crest-Stage Stations in Tennessee as of 3/l/89--Continued
Station Drainage
area Date
No. Name (miL) Lat Long began
TENNESSEE RIVER BASIN--Continued
03490522 Forgey Creek at Zion Hill 0.86 362912 825308 1986 03491490 Dodson Creek tributary near Rogersville .32 362119 825703 1983 03491540 03494714 03494990
Robertson Creek near Persia 14.6 362024 830227 1986 Dry Land Creek trib. near New Market .20 360333 833413 1986 Flat Creek at Luttrell 22.4 361145 834444 1986
03519610 Baker Creek tributary near Binfield 03519640 Baker Creek near Greenback 03527800 Big War Creek at Luther 03528390 Crooked Creek near Maynardville 03534000 Coal Creek at Lake City
2.10 354156 840246 1966-77, 1979 16.0 354021 864628 1965-75*, 1976 22.3 362718 831429 1986
2.23 361556 835025 1986 24.5 361314 840927 1932-34*, 1955
03535180 03555900 03566599
Willow Fork near Halls Crossroads Coker Creek near Ironsburg North Chickamauga Creek at Greens
Mill, near Hixson Stringers Branch at Leawood Drive,
at Red Bank
3.23 360559 835427 22.4 351305 842028 99.5 351030 851340
03569168 1.54 350700 851728
03571500 Little Sequatchie River at Sequatchie 116 350747 853510
1967 1983
1925, 1944, 1953-56, 1980
1980
1925, 1929-30, 1932-34*, 1944
1951-54, 1965, 1979
03571730 Standifer Branch at Jasper 15.3 350422 853656 1982 03571800 Battle Creek near Monteagle 50.4 350803 854615 1955 03583200 Chicken Creek at McBurg 7.66 351103 864847 1955 03583300 Richland Creek near Cornersville 47.5 351910 865220 1962-68*, 1969 035944242 Owl Creek at Lexington 2.50 353826 882213 1984
03597300 Wartrace Creek above Bell Buckle 03599200 East Rock Creek at Farmington 035999716 Rutherford Creek trib. at Moores Lane
near Kedron
4.99 353745 862122 1966 43.1 353005 864250 1954
0.25 354203 865503 1987
03602170 West Piney River at Hwy 70 nr Dickson 2.16 360521 872812 1984 03604070 Coon Creek tributary near Hohenwald .51 353407 874002 1967
-03604080 Hugh Hollow Branch near Hohenwald 03604090 Coon,Creek above Chop Hollow,
near Hohenwald
1.52 353459 874036 1967 6.02 353519 874109 1967
03604580 Blue Creek near New Hope 13.2 360352 873858 1984 03604595 Little Blue Creek trib. near Gorman .62 361944 874213 1984 03605555 'Trace Creek above Denver 31.9 360308 875427 1963
03605880 Cane Creek at Stewart 4.12 361909 875021 1984
52

APPENDIX l--Continued
Active Crest-Stage Stations in Tennessee as of 3/l/89--Continued
Station Drainage
area Date
No. Name (mi2> Lat Long began
OBION RIVER BASIN
07024225 Neil Ditch near Henry 4.07 361019 882333 1984 07024370 Little Reedy Creek near Huntingdon 0.91 355544 882950 1984 07028505 North Fork Forked Deer River at U.S. 73.9 355858 885549 1987
Highway 45W Bypass at Trenton 07029090 Lewis Creek near Dyersburg 25.5 360314 892142 1955-78,
1980-83, 1985
53

APPENDIX l--Continued
Active Surface-Water Low-Flow Stations in Tennessee as of 3-l-89
Station Drainage
area Date
No. Name (mi*) Lat Long began
CLJMBERLAND RIVER BASIN
03418935 Beaverdam Creek at Latana Road near Bellview
17.0 354407 851143 1979-81, 1983
03418950 03420116
Bee Creek near Herbert Domain Rocky River at Rocky River Road
at Riverview
59.6 354624 851358 1985 72.0 354204 853440 1979-81, 1983
03420470 North Prong Barren Fork at Oak Grove 29.8 034:20720 Hickory Creek near Viola 58.2
354240 855725 1983 353432 855102 1954, 1979-81,
1983
03421150 034132334
Charles Creek at Daylight 13.8 Harpeth River at Interstate Hwy 65 168
near Franklin.
354432 855112 1983 355332 864946 1975, 1986
03432470 Murfrees Fork above Burwood 7.43 354858 865720 1975, 1986 03432474 West Prong Murfrees Fork near Burwood 4.93 354940 865755 1975, 1986 03432495 Murfrees Fork above Leipers Fork 26.3 355157 865738 1975, 1986
03432925 Little Harpeth River at Granny White 22.0 Pike at Brentwood
360130 864909 1978
03433660 03433902
South Harpeth River at Fernvale 27.6 355715 870443 1974-75, 1978 Big Turnbull Creek near Liberty Hill 12.5 355759 871156 1981, 1983
03434620 Town Branch near Charlotte 8.33 361044 871815 1974-76, 1978 034351113 Honey Run Creek below Cross Plains 25.8 363231 864214 1985
03435320 Red River at Adams 594 363537 870333 1937, 1983
TENNESSEE RIVER BASIN
03455050 Clear Creek at Parrotville 9.07 350036 830545 1986 034611996 Crying Creek above Cosby 2.94 354654 831301 1983 03461450 English Creek near Newport 9.74 355447 831242 1983 03465603 Little Cherokee Creek at Garber 8.73 361256 822803 1986 03465620 Clark Creek at Graham Mill 11.5 361004 823227 1986
03465780 Clear Fork near Fairview 10.5 361933 823347 1983 03465800 Muddy Fork at Fairview 9.86 361852 823238 1955-73, 1986 03466256 College Creek at Tusculum 3.48 360955 824517 1986 03466295 Camp Creek at Camp Creek 9.99 360539 824537 1961, 1983-86 03467993 Cedar Creek near Valley Home 2.01 360803 831847 1986
54

APPENDIX l--Continued
Active Surface-Water Low-Flow Stations in Tennessee as of 3-1-89--Continued
Station
No. Name
Drainage area Date
(mi2) Lat Long began
TENNESSEE RIVER BASIN--Continued
03467998 Sinking Fork at White Pine 6.38 360721 831744 1986 03469610 Cove Creek at Hatchertown 2.64 354347 833743 1983 03476515 Beidleman Creek near Caywood Ford 27.4 363128 820753 1975-81, 1983 03481600 Corn Creek at Mountain City 5.34 362923 814852 1986 03486313 Sinking Creek at Johnson City 10.4 361908 821917 1986
03487509 Bear Creek at Sullivan Gardens 3.39 362823 823550 1986 03487545 Boozy Creek near Orebank 10.8 363424 822444 1966, 1986 03490530 Forgey Creek near Surgoinsville 4.59 362720 825139 1962, 1986 03494990 Flat Creek at Luttrell 22.4 361145 834444 1986 03495400 Roseberry Creek at Shipetown 12.2 360443 834614 1986
03495550 Love Creek at Knoxville 8.28 360030 835020 1986 03527800 Big War Creek near Luther 22.3 362718 831429 1986 03528385 Fall Creek at Lickskillet 3.78 361715 834800 1986 03528390 Crooked Creek near Maynardville 2.23 361536 835025 1986 03534927 Bullrun Creek near Luttrell 9.51 361418 834443 1986
03534975 North Fork Bullrun Creek below Maynardville
Raccoon Creek at Paulette Barney Creek near Coker Creek Junebug Creek at Reliance Little South Mouse Creek near
Charleston
6.79 361347 834918 1986
03534990 03555882 03556610 03566111
5.10 361112 835319 1986 4.29 351429 841904 1983 2.20 351124 843022 1986 5.58 351613 844655 1967, 1986
03566200 Brymer Creek near McDonald 9.68 03566253 Greasy Creek at Hopewell 3.12 03582205 Norris Creek below Howell 15.1
350720 845700 1983 351217 845311 1979-81, 1983 351333 863356 1952, 1975,
1978-81, 1983 350430 882547 1982 354339 865420 1986
03593115 Lick Creek near Michie 9.93 03599960 Aenon Creek near Spring Hill 14.2
03599965 03599970 03599980 03600085
Rutherford Creek near Spring Hill McCutcheon Creek near Spring Hill Rutherford Creek near Neapolis Carters Creek at Petty Lane near
Carters Creek Carters Creek tributary near
Carters Creek
39.3 354257 865502 1986 10.2 354339 865527 1986 58.2 354136 865706 1986 16.6 354339 865919 1986
03600086 2.94 354334 865919 1986
55

APPENDIX l--Continued
Active Surface-Water Low-Flow Stations in Tennessee as of 3-1-89--Continued
-
Station
No. - Name
Drainage area Date
(mi*) Lat Long began
TENNESSEE RIVER BASIN--Continued
03600093 Carters Creek near Darks Mill 03600360 Snow Creek near Sante Fe
03600370 Snow Creek near Williamsport
03600380 Leipers Creek at Williamsport
03601100 Big Bigby Creek at Needmore
03602192 West Piney River near Dickson 21.2
03602194 West Piney River below State Highway 25.7 48 near Dickson
03602209 Piney River near Oak Grove 03602230 Piney River above Pinewood 03602265 Piney River at Pinewood
03604750 Birdsong Creek at Holladay 03606350 Big Sandy River at Westport
44.1 77.5
150
15.7 110
32.7 11.1
23.2
37.5
48.3
07024310 Rock Creek near Huntingdon 4.51 360023 882717 07024760 Spring Creek near Greenfield 93.4 361124 884553
07025190 Mud Creek near Sharon 45.6 361559 885005
07025300 North Fork Obion River at Jones Mill 83.7 362646 882757
07026090 Cool Springs Branch near Trimble 10.7 361115 891103 07026100 Reeds Creek near Trimble 51.8 361048 891515 07027270 Tar Creek at Oak Grove 16.4 352402 883454 07027280 Jacks Creek at Jacks Creek 17.9 352816 883121
07030160 Indian Creek at Gilt Edge 65.9
OBION RIVER BASIN
HATCHIE RIVER BASIN
354125 870033 1960, 1986 354331 870736 1962-63, 1965,
1986 354141 871118 1944, 1953-54,
1986 354143 871210 1944, 1953-54,
1986 353243 871405 1934,, 1969,
1972-73, 1978-81, 1983
360140 872700 1950-52, 1962-63, 1965, 1979-81,
1983 360043 872633 1981, 1984
360036 872638 1984 355711 872753 1984 355437 872804 1984
355253 880839 1975-78, 1980 355334 881832 1975-78, 1980
1986 1955, 1975-78,
1980 1958, 1975-78,
1980
1958-61, 1964, 1975-78, 1980
1986 1975-78, 1980
1982 1975-78, 1980
353309 894920 1976-78, 1980-81, 1983
56

APPENDIX 2
Active ground-water network in Tennessee as of 3/l/89
[Lat, latitude; Long, longitude]
Station No. Local well No.
Date Lat Long began
361738082132900 360835086441100 350234085181200 351428085003600 360020087573300
Ct: H-l 361738 821329 Dv:L-10 360835 864411 Hm:G-36 350234 851812 Hm:O-15 351428 850036 Hs:H-1 360020 875733
Ld:F-4 353839 894935 Ld:G-12 354158 893843 Ld:J-5 354357 892717 Ld:L-2 354552 894559 Ld:S-2 355251 893505
Li:G-2 350035 864231 Ln:R-014 352610 871824 Md:N-1 354223 883802 Mg:F-5 360543 843431 Pm:C-1 360521 854326
1964 1985 1981 1975 1962
353839089493500 354158089384300 354357089271701 354552089455900 355251089350500
1966 1980 1982 1980 1980
350035086423100 352610087182401 354223088380200 360543084343101 360521085432601
1988 1985 1949 1984 1968
353922083345600 Sv:E-2 353922 833456 1979 350514089553700 Sh:K-75 350514 895537 1948 351435090005200 Sh:O-1 351435 900052 1940 350735089593300 Sh:P-76 350735 895933 1928 350900089482300 Sh:Q-1 350900 894823 1940
350958090173800 Ar:C-1 350958 901738 1983 350344090130000 Ar:H-2 350344 901300 1983 351349090062800 Ar:O-1 351349 900628 1983
350503084505000 Br:E-1 350503 845050
354823086104400 Cn:D-1 354823 861044 360200089280100 Dy:H-1 360200 892801 360147089230700 Dy:H-7 360147 892307 352226089330101 Fa:R-1 352226 893301
1950-1955, 1964 1967 1955 1954 1949
35222608933Ci102 Fa:R-2 352226 893301 1949 352112089571200 Sh:U-1 352112 895712 1946 352112089571300 Sh:U-2 352112 895713 1953 355505086541100 Wm:M-1 355505 865411 1950
RECORDER--60-MINUTE PUNCH INTERVAL
TAPE DOWN
57

APPENDIX 3
List of water-quality and suspended-sediment stations
z [mi , square miles; Lat, latitude; Long, longitude; Q, chemical; B, bacteriological; S, sediment]
Station
No. Name
Drainage area Date Data
(mi2) Lat Long began type
CUMBERLAND RIVER BASIN
03418420
03425000 03426310
03427500 East Fork Stones River nr Lascassas 262 355506 862002 03428200 W Fork Stones River at Murfreesboro 177 355410 862548
03428500 West Fork Stones River near Smyrna 237 355625 862754
03495500
03497300
03535912 03593005
03600085
03600086 03600088
03604000
07026000 Obion River at Obion 1,852 361504 891133 1975 Q,B,S
07029500 Hatchie River at Bolivar 1,480 361631 885836
Cumberland River below Cordell 8,095 361712 855627 Hull Dam
Cumberland River at Carthage 10,690 361453 855719 Cumberland River at Old Hickory 11,673
Dam (Tailwater)
TENNESSEE RIVER BASIN
Holston River near Knoxville 3,747 360056 834954
Little River above Townsend 106 353952 834241
Clinch River at Melton Hill Dam 3,343 355307 841803 Tennessee River at Pickwick 32,820 350354 881508
Landing Dam Carters Creek at Petty Lane near 16.6 354340 865920
Carters Creek
Carters Creek Trib near Carters Creek 2.94 354334 865920 Carters Creek at Butler Road 20.1 354303 865945
at Carters Creek Buffalo River near Flat Woods 447 352945 874958
OBION RIVER BASIN
HATCHIE RIVER BASIN
1980 Q
1975 Q,B,S 1979 Q
1975 Q 1986 Q
1965 Q
1965, Q,B,S 1977
1964-82, Q,B,S 1986 1973 Q,B,S 1975 Q,B,S
1986 Q,B,S
1986 Q,*,S 1986 Q,B,S
1964 Q,B,S
1964, Q,B,S 1968, 1977
58

INDEX Page
Administrative Services Section .......................................... 44 Appalachian Valleys-Piedmont Regional Aquifer System Analysis ...................... 36 Blasted-in subsurface sewage system field lines ................................. 27 Botanical techniques 34 Burial grounds at the Oak Ridge Reservation ComputerSection .. .... .. .... .. .......... ...... ...................................................................................................................................
t:
Contamination potential of the Memphis Sand aquifer 22 Effects of urbanization on flood-peak discharges in Murfreesboro, Tennessee ................ 10 Flood investigations
.........................................................................................................................
.7 .. . .. .. .... Geographic Information System (GIS) ..
.............. 39
Geographic Information System inventory 31 Ground-water contamination potential at Jackson, Tennessee 30 Ground-Water Information Unit ......................................... 39 Ground-water-level network ............................................. 3 Ground-water network (as of 3/l/89) ....................................... 57 Ground-water quality network in Tennessee .................................... 9 Ground-water resources in the Eastside Utility District ............................. 24 Hackett’s Spring, Brentwood, Tennessee ..................................... 16 Hixson Utility District of Hamilton County ................................... 23 Humphreys County ................................................. 21 Hydrologic Data Section ............................................... 1 Hydrologic Investigations Section .......................................... 8 Impact from urban runoff on ground-water quality ............................... 26 Impact of agricultural chemicals on ground-water quality ........................... 29 McNairy-Nacatoch aquifer in West Tennessee .................................. 20 Millington flood ................................................... 35 Organochlorine pesticides in ground water .................................... 19 Other activities ................................................... 39 Radionuclides in ground water from Hickman and Lewis Counties, Tennessee ................ 17 Recent publications ................................................. 42 Regional Publication Center ............................................ 41 Scour investigation at bridges throughout Tennessee .............................. 13 Sediment chemistry at Reelfoot Lake ....................................... 12 Sediment deposition at wetlands near bridge crossings ............................. 33 Soil-gas analysis ................................................... 14 Storm runoff into Reelfoot Lake, West Tennessee ................................ 28 Surface-water monitoring network ......................................... 2 Surface-water stations (as of 3/l/89) ........................................ 45 Suspended-sediment network ............................................ 5 Water-quality and suspended-sediment stations ................................. 58 Water-quality in the Clinch and Powell Rivers, East Tennessee ........................ 17 Water-quality network ............................................... .4 Water quality of farmstead wells in Tennessee .................................. 11 Water-use program ................................................. .6 Wayne County landfill ............................................... 37 Webb Creek area, Sevier County .......................................... 25 Y-12 Plant at the Oak Ridge Reservation ...................................... 38
59