updates from oregon, massachusetts, and connecticut on
TRANSCRIPT

Updates from Oregon, Massachusetts,
and Connecticut on Solarize Programs
February 21, 2013
Clean Energy States Alliance Webinar Hosted by
Warren Leon, CESA Deputy Director
www.cleanenergystates.org 2
Housekeeping
All participants will be in listen-only mode throughout the broadcast.
You can connect to the audio portion of the webinar using your computer’s speakers or a USB-type headset. You can also connect by telephone. If by phone, pleas enter the PIN number shown on the webinar console into your telephone keypad.
You can enter questions for today’s event by typing them into the “Question Box” on the webinar console. We will pose your questions, as time allows, following the presentations.
This webinar is being recorded and will be made available after the call on the CESA website at www.cleanenergystates.org/events/
www.cleanenergystates.org 3
About CESA
Clean Energy States Alliance (CESA) is a national nonprofit organization dedicated to advancing state and local efforts to implement smart clean energy policies, programs, technology innovation, and financing tools to drive increased investment and market making for clean energy technologies.

www.cleanenergystates.org 4
• Multi-state coalition of clean energy programs cooperating and learning from each other, leveraging federal resources
• CESA state members have nearly $6 billion to invest in next 10 years
• Members have supported nearly 130,000 renewable energy projects from 1998-2011 with state-based dollars
• Nonpartisan, experimental, collaborative network
– Information exchange & analysis
– Partnership development
– CESA projects: solar, wind, RPS, fuel cells, energy storage, program evaluation, national database
What We Do
Information Exchange
Market building support
Projects
Federal Agencies
Clean Energy
Funds & Programs
Stake-holders
CESA
Industry
Private Finance
State Regulators
Academia
www.cleanenergystates.org 5
Today’s Guest Speakers
- Robert Del Mar, Energy Trust of Oregon - Elizabeth Kennedy, Massachusetts Clean Energy Center - Bob Wall, Clean Energy Finance and Investment Authority - Toni Bouchard, SmartPower
6
Contact Info
Warren Leon Deputy Director Clean Energy States Alliance Email: [email protected] Phone: 978-317-4559 www.cleanenergystates.org
Robert Del Mar Sr. Residential Solar Project Manager Energy Trust of Oregon [email protected] www.energytrust.org
Elizabeth Kennedy Program Director, Solar Programs MassCEC [email protected] www.masscec.com
Bob Wall CEFIA [email protected] www.ctcleanenergy.com Toni Bouchard SmartPower [email protected] www.smartpower.org
Solarize Programs in Oregon
Rob Del Mar Sr. Residential Solar Project Manager
Energy Trust of Oregon
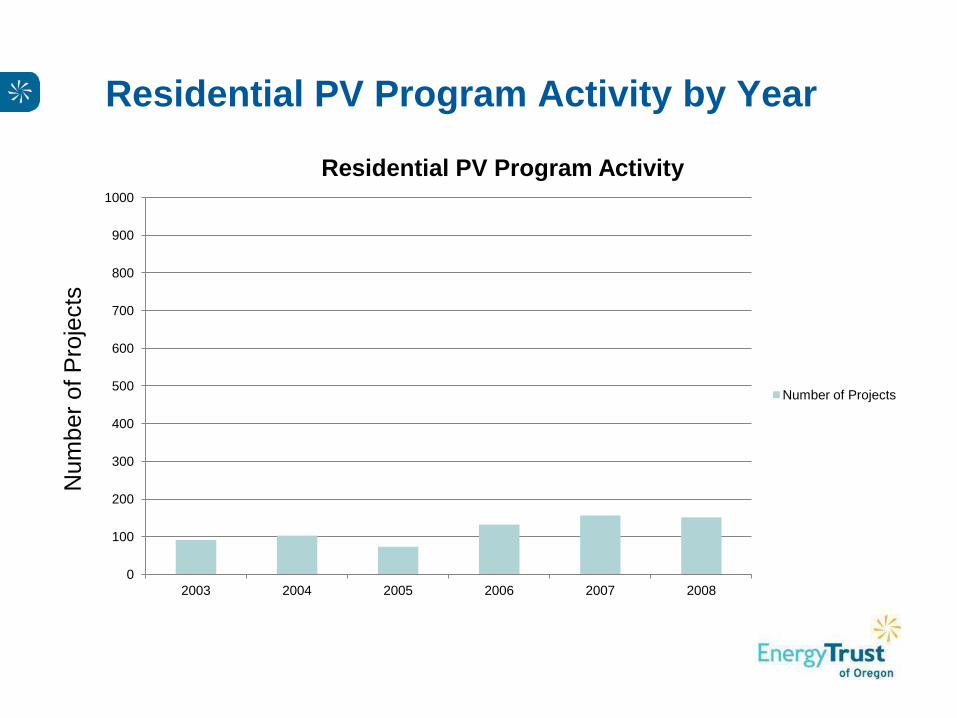
Residential PV Program Activity by Year
0
100
200
300
400
500
600
700
800
900
1000
2003 2004 2005 2006 2007 2008
Residential PV Program Activity
Number of Projects
Num
ber
of
Pro
jects

• RFP Issued by Community
• Pre negotiated pricing (20%
lower than market)
• Pre Screened Contractor
• Limited time offer
• Community-run workshops
• Free site assessments
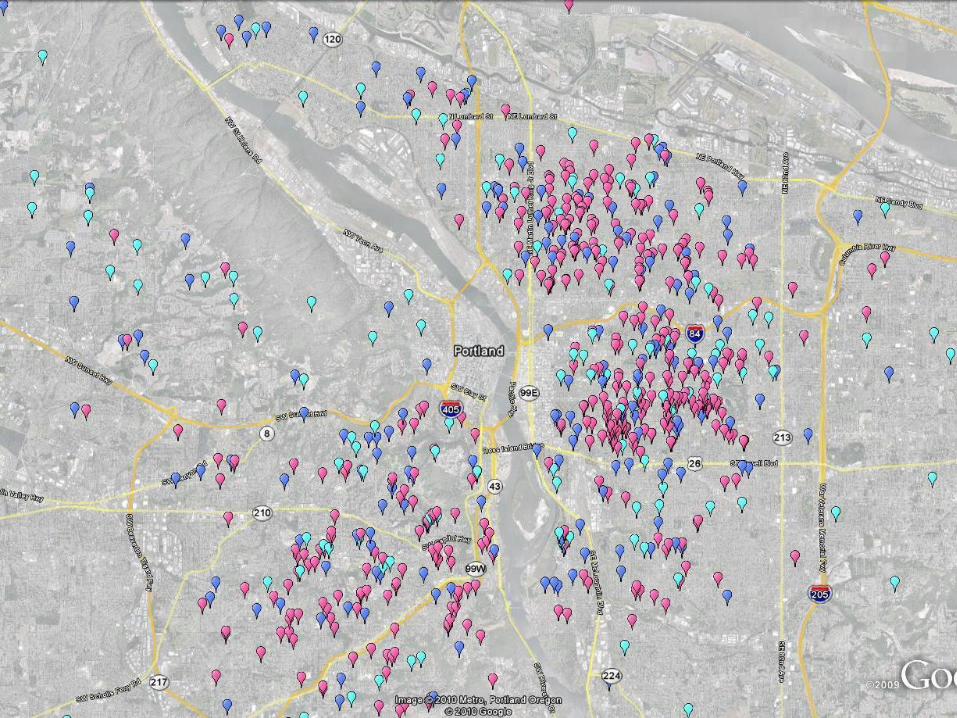
Solarize Southeast Portland Launched in 2009

Safety in numbers

Solarize Southeast Portland Launched in 2009
• 350 homeowners enrolled
• 120 systems installed
•Portland prices in line with rest
of state
• Other communities replicating
model

Residential PV Program Activity by Year
0
100
200
300
400
500
600
700
800
900
1000
2003 2004 2005 2006 2007 2008
Residential PV Program Activity
Number of Projects
Num
ber
of
Pro
jects
0
100
200
300
400
500
600
700
800
900
1000
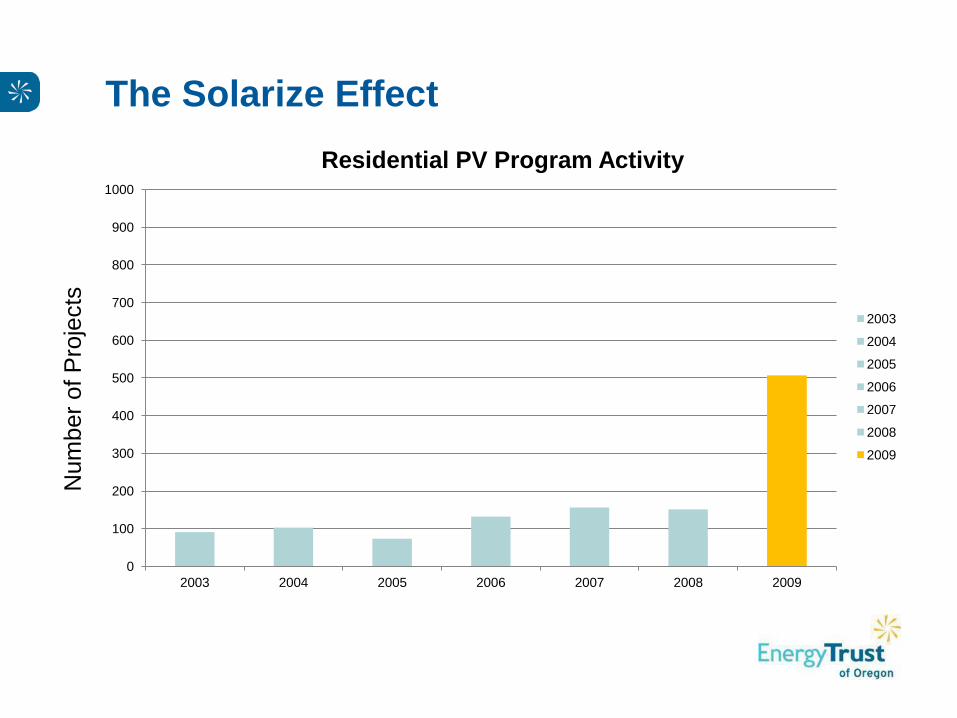
2003 2004 2005 2006 2007 2008 2009
Residential PV Program Activity
2003
2004
2005
2006
2007
2008
2009
The Solarize Effect N
um
ber
of
Pro
jects
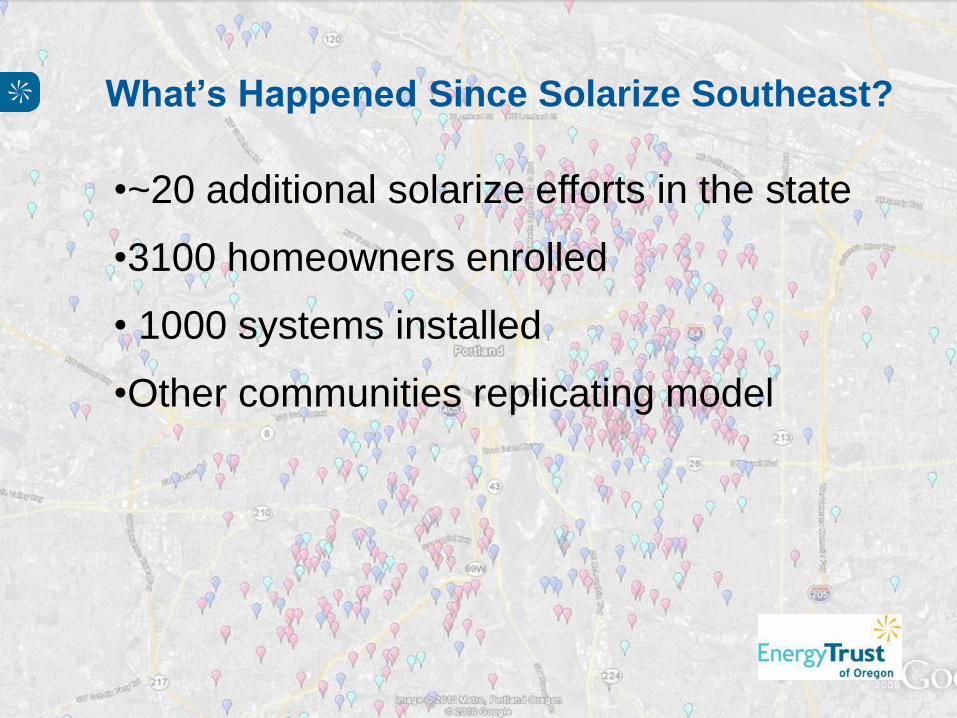
•~20 additional solarize efforts in the state
•3100 homeowners enrolled
• 1000 systems installed
•Other communities replicating model
What’s Happened Since Solarize Southeast?

What’s Happened Since Solarize Southeast?
$0.00
$1.00
$2.00
$3.00
$4.00
$5.00
$6.00
$7.00
$8.00
$9.00
$10.00
0
100
200
300
400
500
600
700
800
900
1000
2003 2004 2005 2006 2007 2008 2009 2010
Number of Projects
Average of $/W
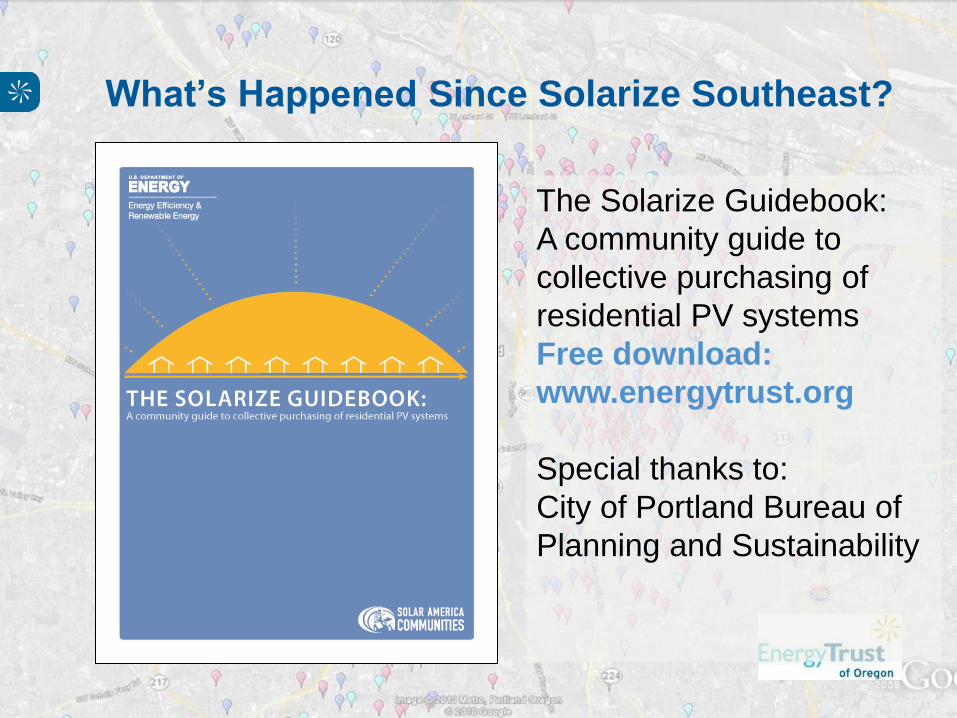
What’s Happened Since Solarize Southeast?
The Solarize Guidebook:
A community guide to
collective purchasing of
residential PV systems
Free download:
www.energytrust.org
Special thanks to:
City of Portland Bureau of
Planning and Sustainability
•Selection of single contractor perceived as
unfair and anticompetitive
•Boom and bust cycle for installers
•Dependent upon contractor(s) managing
challenging cash flow condition.
•May act to clear the pipeline of future projects
Challenges in Solarize Efforts
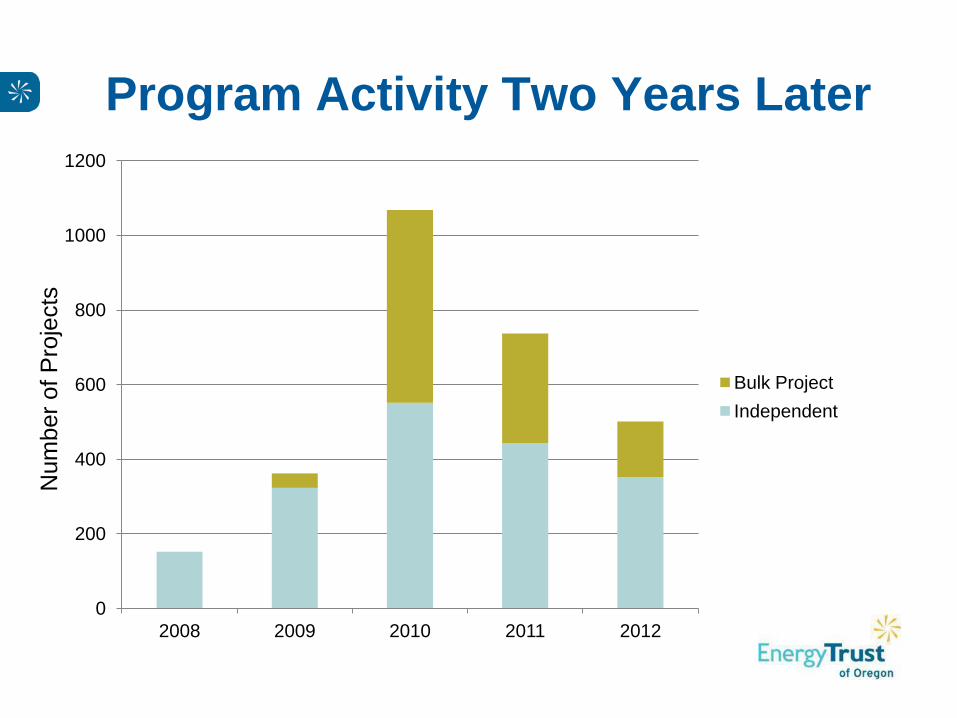
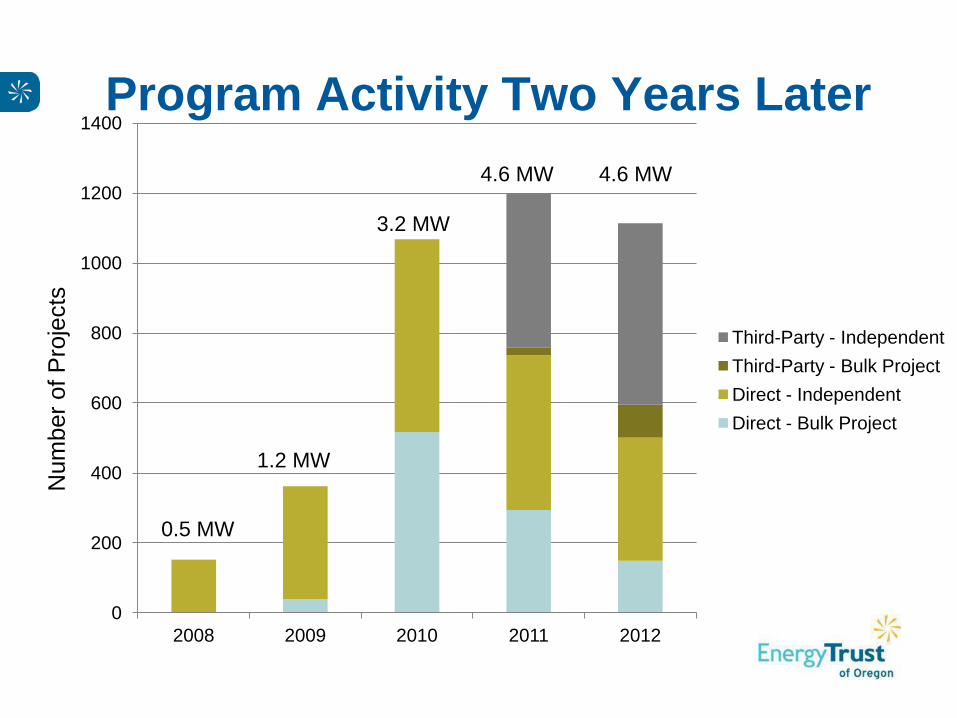
Program Activity Two Years Later
0
200
400
600
800
1000
1200
2008 2009 2010 2011 2012
Bulk Project
Independent
Num
ber
of
Pro
jects
0
200
400
600
800
1000
1200
1400
2008 2009 2010 2011 2012
Third-Party - Independent
Third-Party - Bulk Project
Direct - Independent
Direct - Bulk Project
Program Activity Two Years Later N
um
ber
of
Pro
jects
0.5 MW
1.2 MW
4.6 MW
3.2 MW
4.6 MW
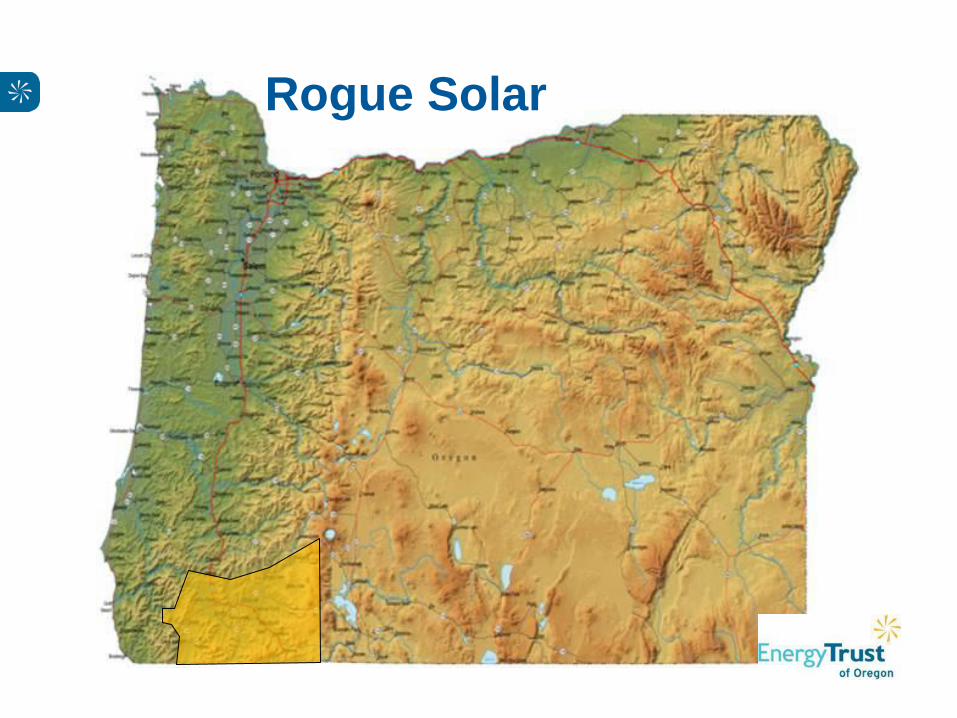
Rogue Solar
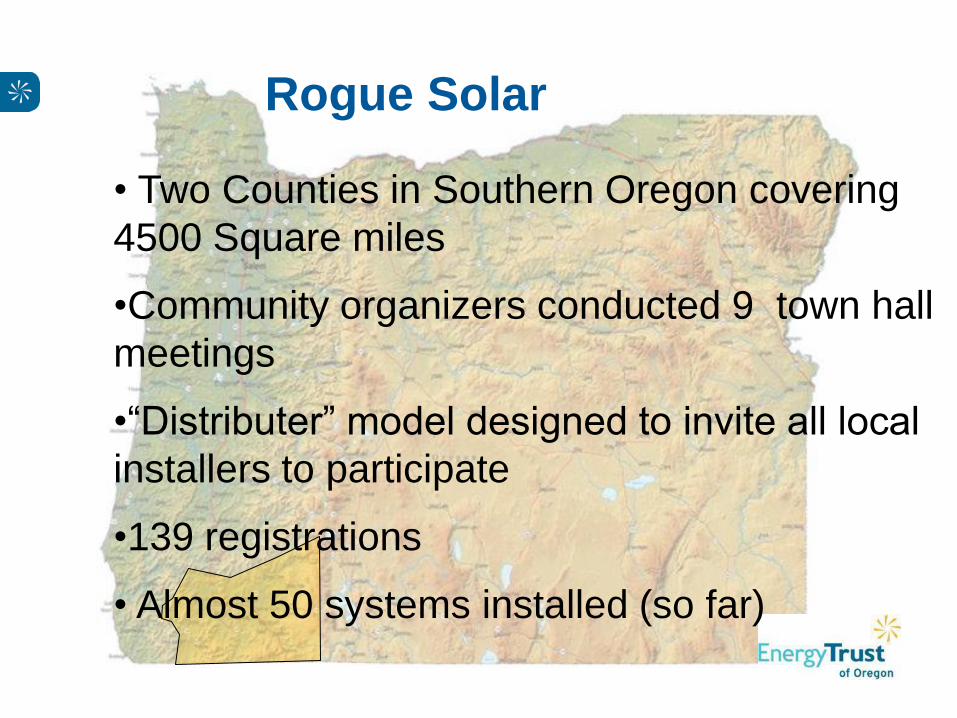
Rogue Solar
• Two Counties in Southern Oregon covering
4500 Square miles
•Community organizers conducted 9 town hall
meetings
•“Distributer” model designed to invite all local
installers to participate
•139 registrations
• Almost 50 systems installed (so far)

Solarize Massachusetts
Elizabeth Kennedy Massachusetts Clean Energy Center
1
2
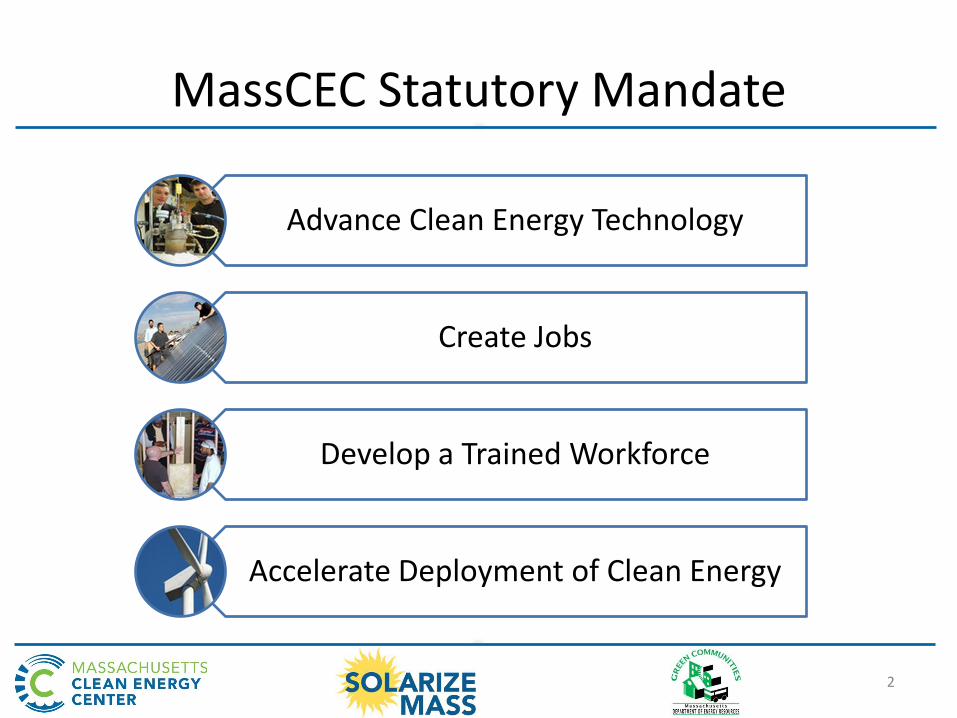
MassCEC Statutory Mandate
Advance Clean Energy Technology
Create Jobs
Develop a Trained Workforce
Accelerate Deployment of Clean Energy

3
Source of funding is a Systems Benefits Change on ratepayers’ electric bill
Available for customers of IOUs and MLPs that opt-in
MassCEC Eligible Customers

“Installing a solar PV system is a terrific investment, and of course it is a good thing to do for the earth. Once you
become familiar with the economics, it is a no-brainer.” – Resident, Hatfield, MA

5
Solarize Massachusetts Goals
Lower prices;
Increased adoption
Competitive Pricing
Reduce Marketing & Acquisition Costs
Outreach and Education
Simplified process
6
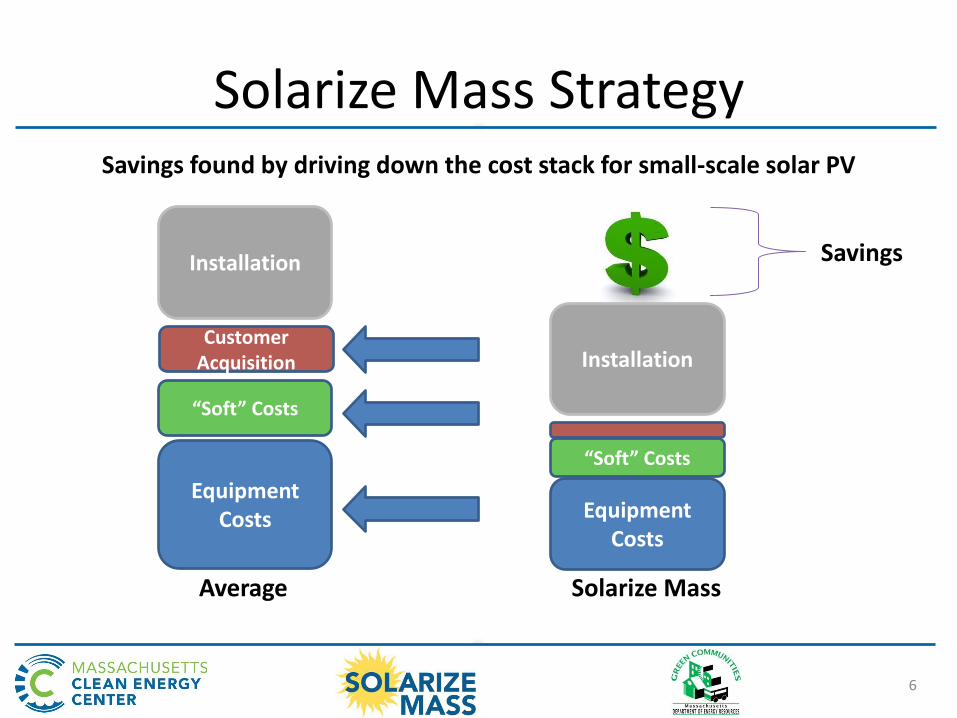
Solarize Mass Strategy Savings found by driving down the cost stack for small-scale solar PV
Equipment Costs
“Soft” Costs
Customer Acquisition
Installation
Average
Equipment Costs
“Soft” Costs
Installation
Savings
Solarize Mass
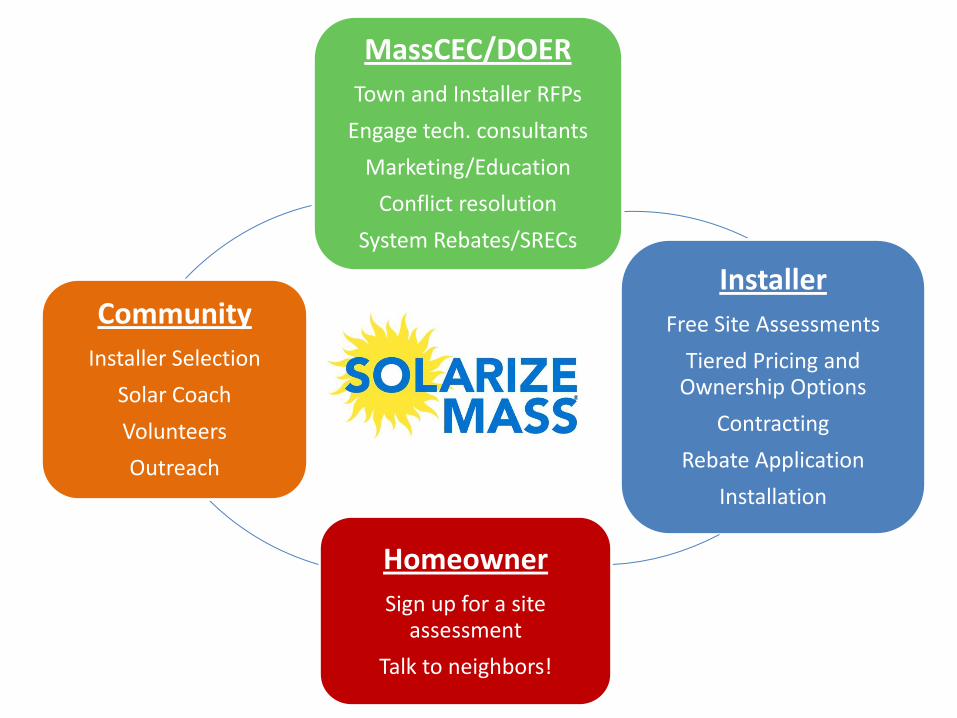
MassCEC/DOER
Town and Installer RFPs
Engage tech. consultants
Marketing/Education
Conflict resolution
System Rebates/SRECs
Installer
Free Site Assessments
Tiered Pricing and Ownership Options
Contracting
Rebate Application
Installation
Homeowner
Sign up for a site assessment
Talk to neighbors!
Community
Installer Selection
Solar Coach
Volunteers
Outreach
8
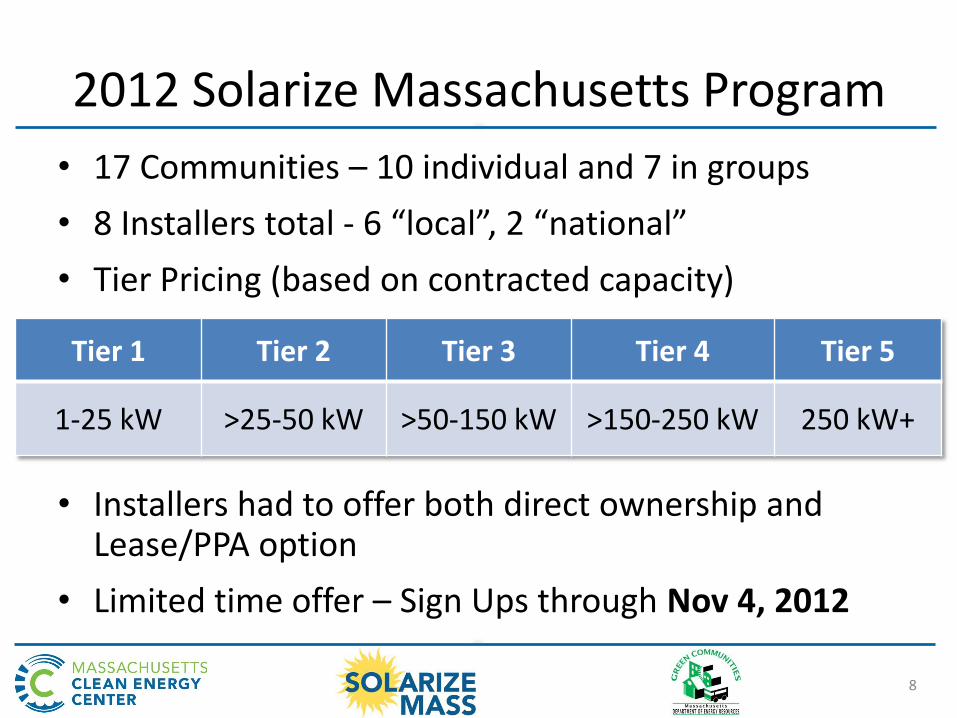
2012 Solarize Massachusetts Program
• 17 Communities – 10 individual and 7 in groups
• 8 Installers total - 6 “local”, 2 “national”
• Tier Pricing (based on contracted capacity)
• Installers had to offer both direct ownership and Lease/PPA option
• Limited time offer – Sign Ups through Nov 4, 2012
Tier 1 Tier 2 Tier 3 Tier 4 Tier 5
1-25 kW >25-50 kW >50-150 kW >150-250 kW 250 kW+

9
Solarize 2012 Final Metrics (as of 11/4/12)
Total Number Of:
Leads Generated
5,405
Contracts Signed
803
Contracted Capacity (kW)
5,126
Communities at Tier 5 Pricing
10
0
1000
2000
3000
4000
5000
6000
1 2 3 4 5 6 7 8 9 10 11 12 13 14 15 16 17 18 19 20 21
Co
ntr
acte
d C
apac
ity
(kW
)
Week of the Program
Cumulative Contracted Capacity
10
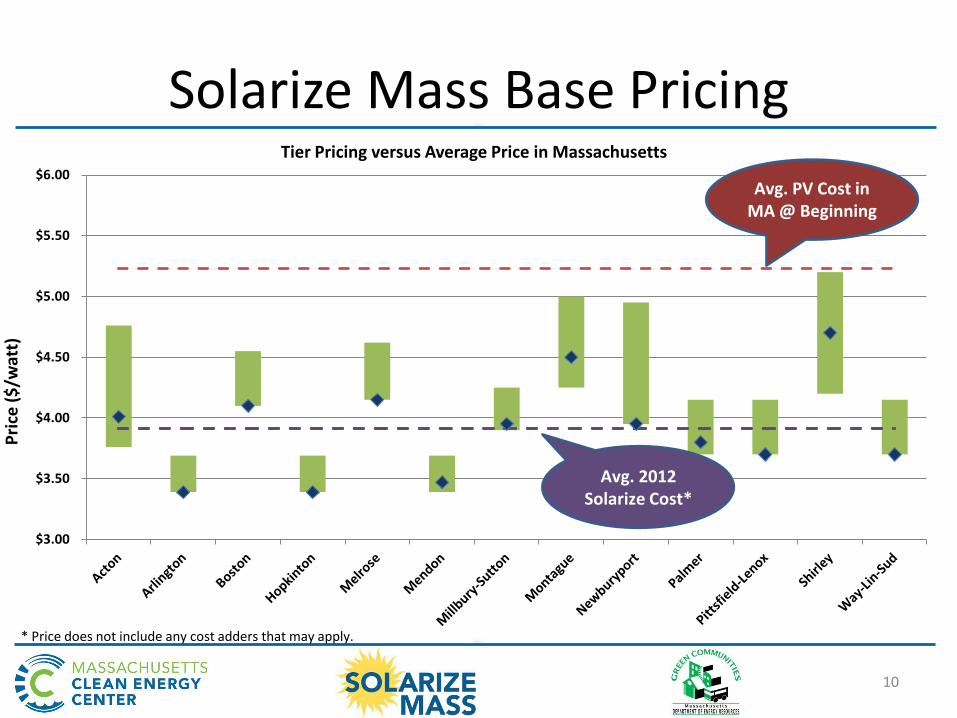
Solarize Mass Base Pricing
$3.00
$3.50
$4.00
$4.50
$5.00
$5.50
$6.00 Avg. PV Cost in
MA @ Beginning
Avg. 2012 Solarize Cost*
Pri
ce (
$/w
att)
Tier Pricing versus Average Price in Massachusetts
* Price does not include any cost adders that may apply.
11
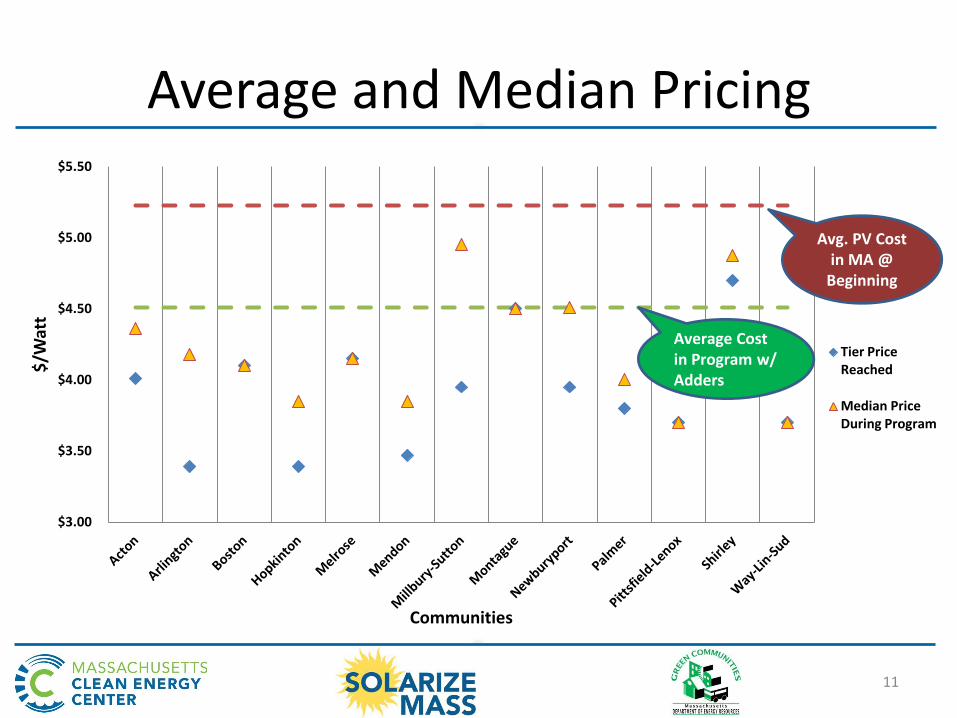
Average and Median Pricing
$3.00
$3.50
$4.00
$4.50
$5.00
$5.50
$/W
att
Communities
Tier Price Reached
Median Price During Program
Avg. PV Cost in MA @
Beginning
Average Cost in Program w/ Adders

12
Solarize Mass Adders • Adders were easier to track for Purchased Systems
• There were 381 Purchased systems, of which 86% included adders
Type of Project Adder Frequency Applied to Projects Average Adder Price ($/W)
Micro-Inverters* 57% $ 0.22
Structural Engineer Analysis 54% $ 0.11
Panel Upgrade* 25% $ 0.41
Monitoring* 23% $ 0.22
Line Side Tap 23% $ 0.09
Rafter Reinforcement 14% $ 0.18
Multiple Roof Arrays 12% $ 0.10
Electrical Sub-Panel 10% $ 0.10 * These adders were optional, while the other adders would be mandatory for a project to move forward.

13
Ownership Options
Based on data as of February 4, 2013
0%
10%
20%
30%
40%
50%
60%
70%
80%
90%
100%
% o
f C
on
trac
ts b
y O
wn
ers
hip
Op
tio
n
Communities
Lease/PPA
Direct Purchase
14
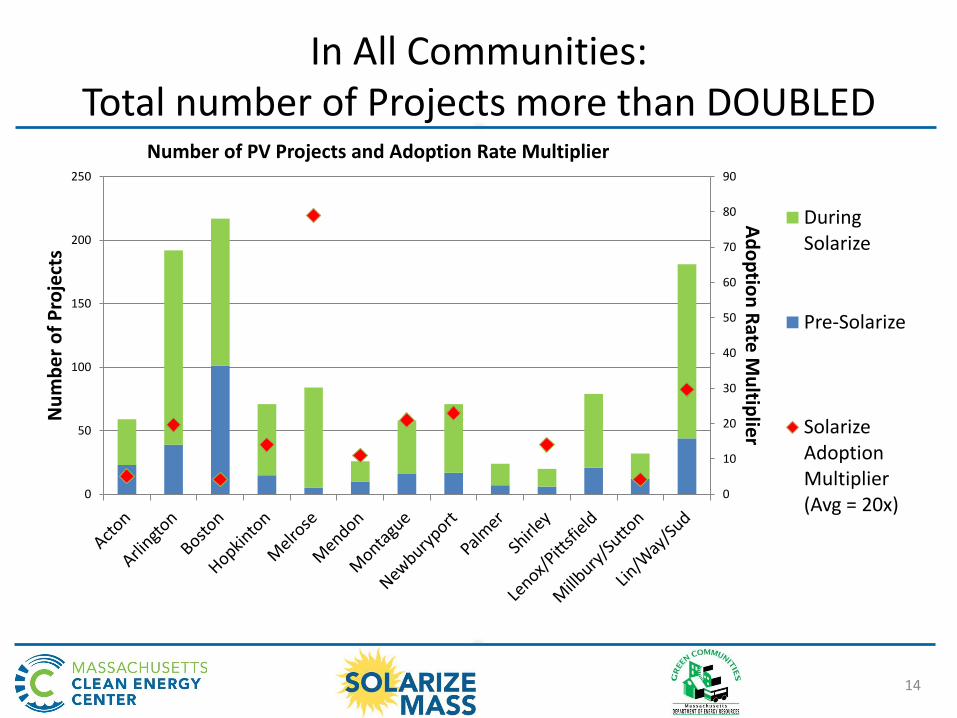
In All Communities: Total number of Projects more than DOUBLED
0
10
20
30
40
50
60
70
80
90
0
50
100
150
200
250
Ad
op
tion
Rate
Mu
ltiplie
r
Nu
mb
er
of
Pro
ject
s
Number of PV Projects and Adoption Rate Multiplier
During Solarize
Pre-Solarize
Solarize Adoption Multiplier (Avg = 20x)

15
Lessons Learned • Must fit within context of existing incentives
– Complexity of some incentives
• Messaging of benefits has shifted – Initially focused on price
– Benefit of Solarize vs. customer initiated competition
• Scaling Challenges – Administratively intensive
– Benefit of having state involved
16
Next Steps
• 2013 Solarize Mass Program
– Will do 2 rounds
– Minimum 8 proposals per round
• Considering Solarize for different affinity group
– E.g. Campus, corporation, faith community, etc.
• Potential to replicate model for other technologies
– SHW, energy efficiency, etc.

17
Thank you!
Elizabeth Kennedy Program Director, Solar Programs
MassCEC 55 Summer St., 9th Floor
Boston, MA 02110

Bob Wall, Director of Marketing & Outreach, CEFIA
Toni Bouchard, Vice President, SmartPower
CESA Solarize Webinar 2/21/13
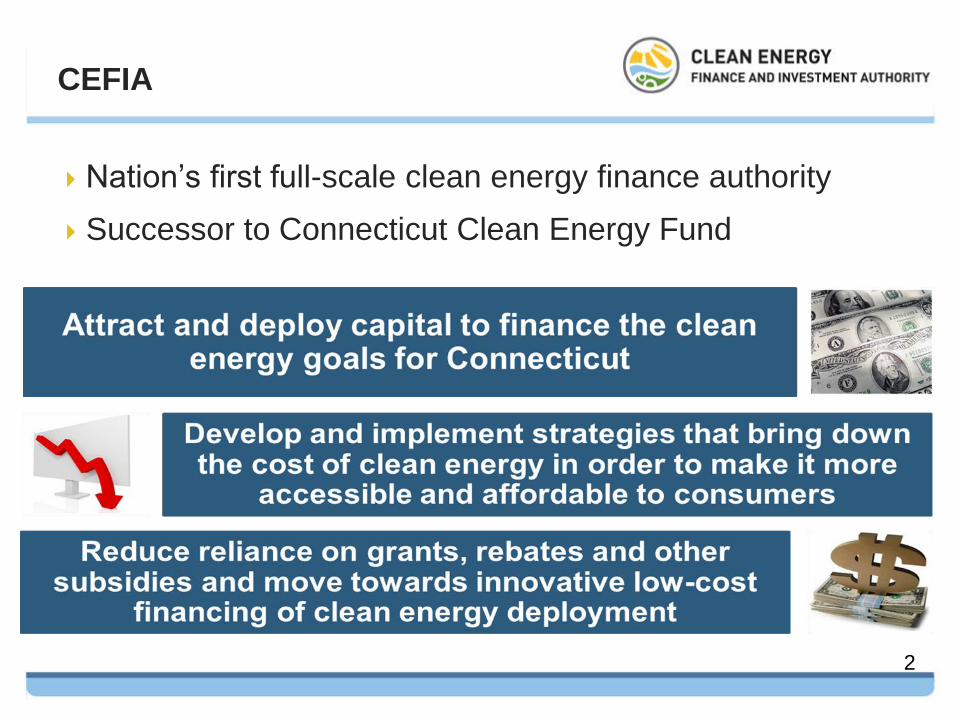
CEFIA
Nation’s first full-scale clean energy finance authority
Successor to Connecticut Clean Energy Fund
2

SmartPower
Nation’s leading non-profit marketing firm dedicated to
promoting energy efficiency and renewable energy
Leveraged matching foundation grants
Previous collaborations (Clean Energy Communities,
Neighbor to Neighbor Energy Challenge)
Extensive solar marketing experience
3
Collaboration with MassCEC
Basic program model (based upon on Oregon)
Lessons learned:
Strategically select towns for pilot
Adopt tiered pricing structure of Mass Phase II
Permit installers to offer purchase, lease or both options
Allow towns to select installer through RFP process
4

Pilot Towns
Clean Energy Communities Program
Highly motivated clean energy task forces
Historic support for solar
10 applied, 4 selected
5
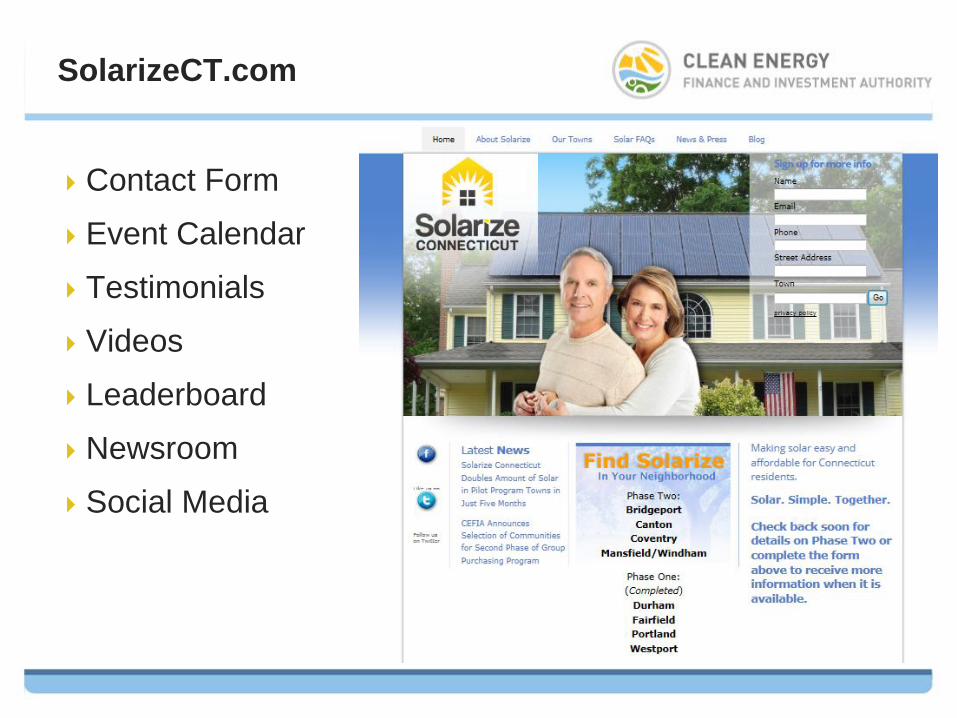
SolarizeCT.com
Contact Form
Event Calendar
Testimonials
Videos
Leaderboard
Newsroom
Social Media

Feeding the Pipeline
8
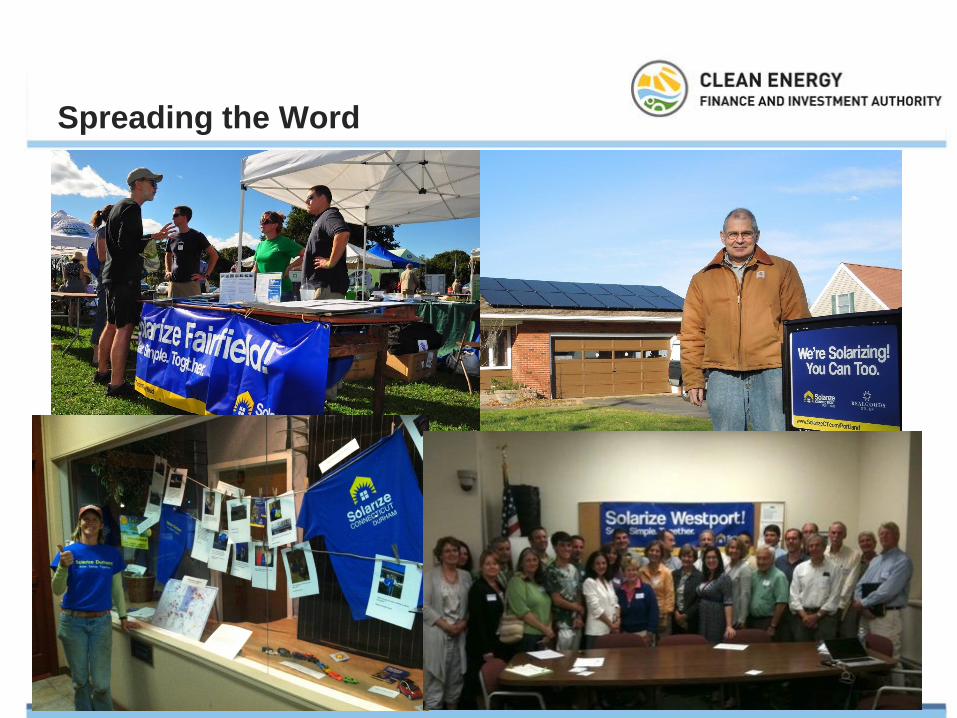
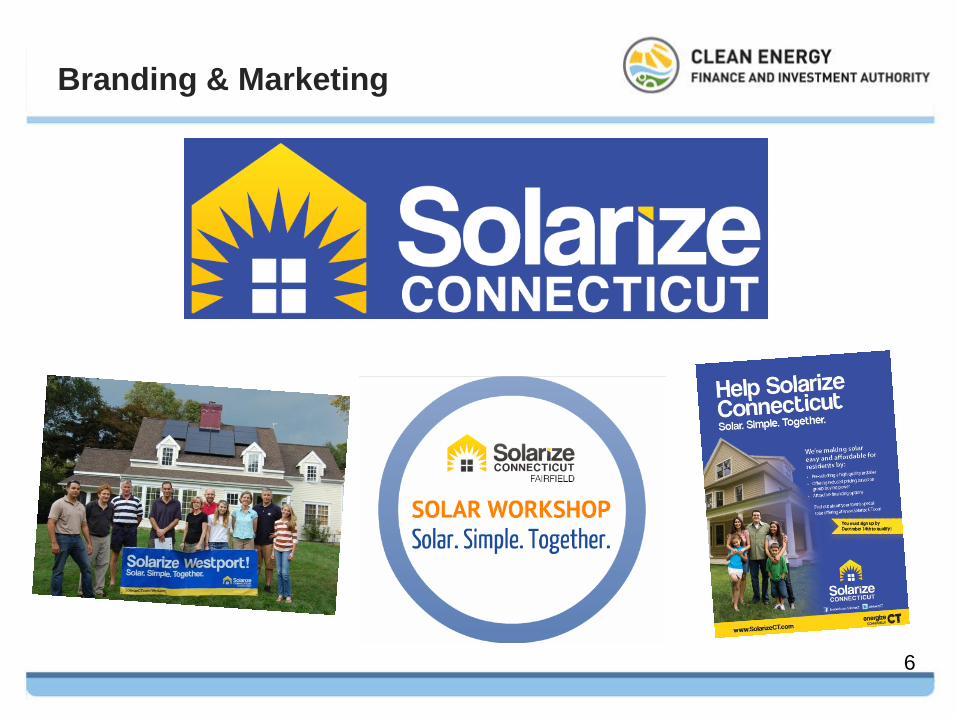
Spreading the Word
9

Timeline
10
Start Date
Sept. 1, 2012
End of summer vacation
Labor Day
School opening Holidays
Orig. End Date
Dec. 14, 2012
Extension
Jan. 14, 2013
Superstorm Sandy
Widespread power outages,
flooding & damage
Newtown shootings

Expanding the Market
11
# of Projects
Pre and Post-Solarize
Installed Capacity (kW)
Pre and Post-Solarize
Town # Projects
(Pre)
# New
Projects
(Post)
%
Increase
Projects
Installed
Capacity
(Pre)
New
Installed
Capacity
(Post)
%
Increase
Installed
Capacity
Durham 23 117 510% 189 1,012 540%
Fairfield 41 76 190% 265 615 230%
Portland 14 45 320% 81 329 410%
Westport 39 58 150% 244 382 160%
Total 118 296 250% 779 2,338 300%
REFERENCES Note – Solarize Connecticut results are still being tallied.
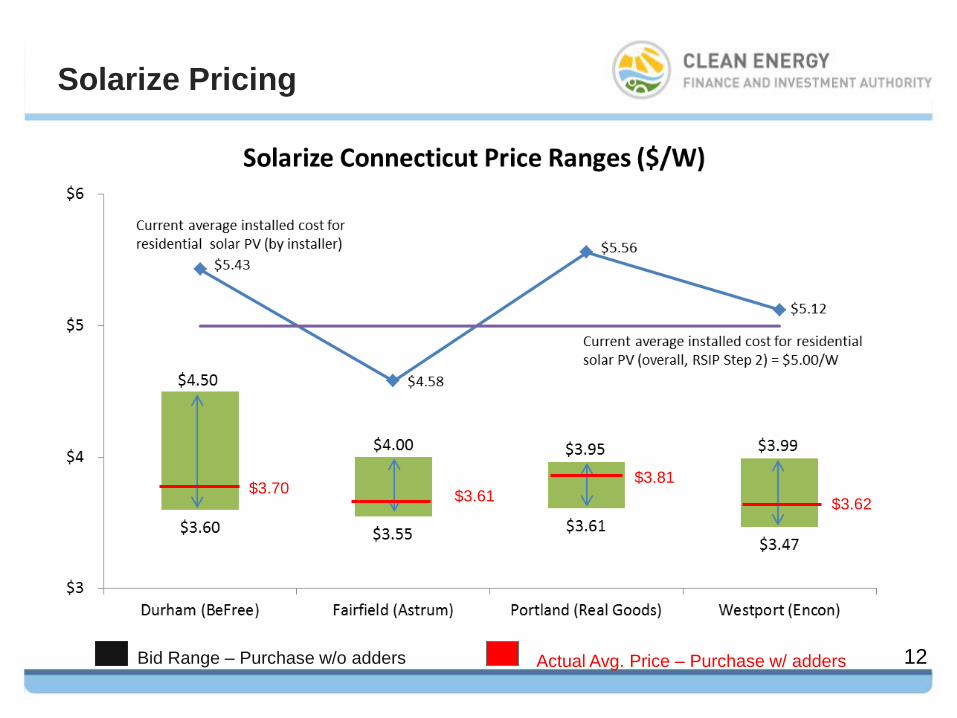
Solarize Pricing
12
$3.70 $3.61
$3.81
$3.62
Bid Range – Purchase w/o adders Actual Avg. Price – Purchase w/ adders

Ownership Options
13
0%
10%
20%
30%
40%
50%
60%
70%
80%
90%
100%
Lease/PPA
Purchase
* Based on information provided by installer at close of phase I

Deadline Drives Decision
Spikes at week 16 and week 20.
0
10
20
30
40
50
60
70
80
90
1 2 3 4 5 6 7 8 9 10 11 12 13 14 15 16 17 18 19 20
Nu
mb
er
of
Sig
ned
Co
ntr
acts
Weekly Signed Contracts for Solarize
Westport
Portland
Fairfield
Durham
Survey Objectives
Understand customer motivations to purchase
Barriers for prospects
Effective awareness and outreach strategies
Volunteer and Installer perspectives
Recommendations and direction for Phase 2
Survey Highlights
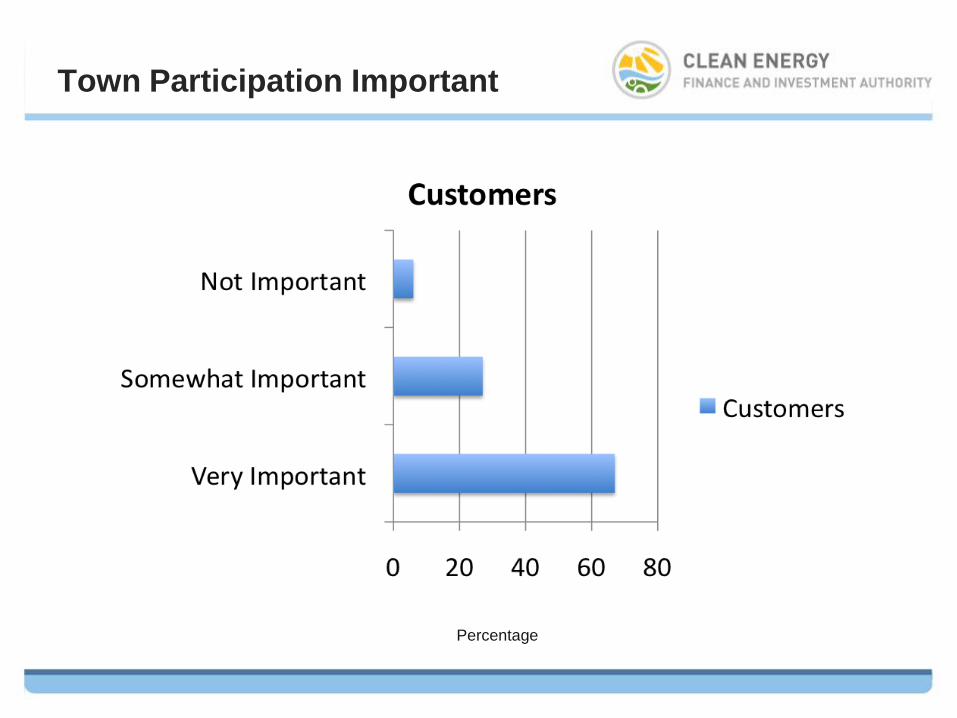
Town involvement was cited as important in their
decision to participate; town leaders are key.
Almost 20% of customers had never considered solar
before this program.
Seeing solar in the community influenced the decision
Residents learn about Solarize from multiple
communication channels.
Customers let others know about the Solarize project.

Campaign Awareness

Motivations
0 10 20 30 40 50
Town-sponsored
Stabilize costs
Short payback
Lower monthly bill
Lower carbon footprint
Discount pricing
Prospects
Customers
Percentage

Financing Options
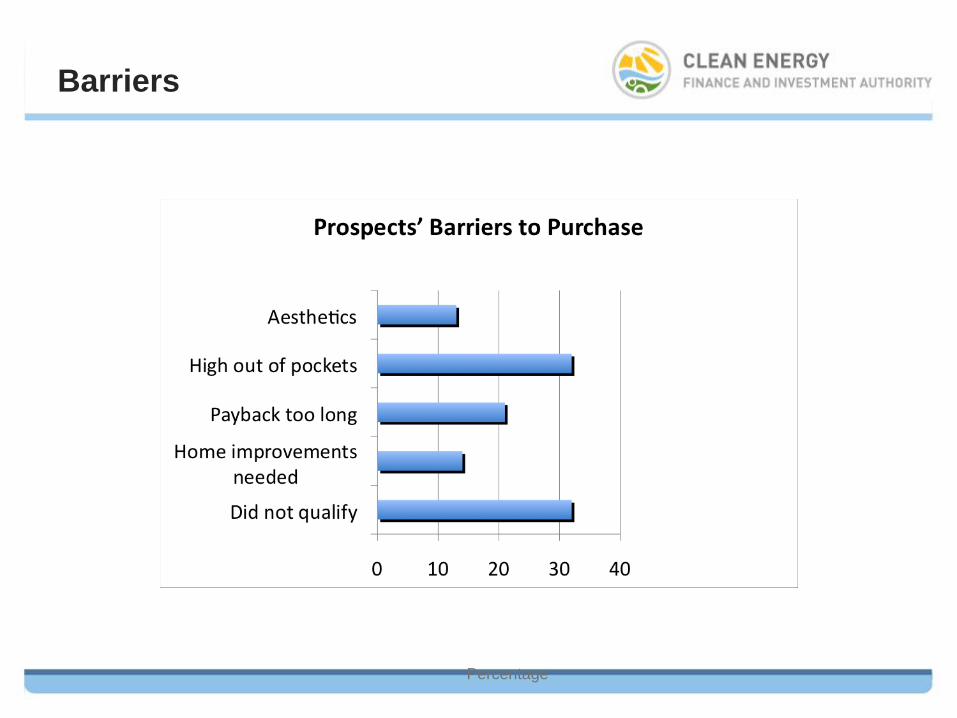
Barriers
Percentage

Campaign Awareness
Percentage

Decision Making Time
Percentage
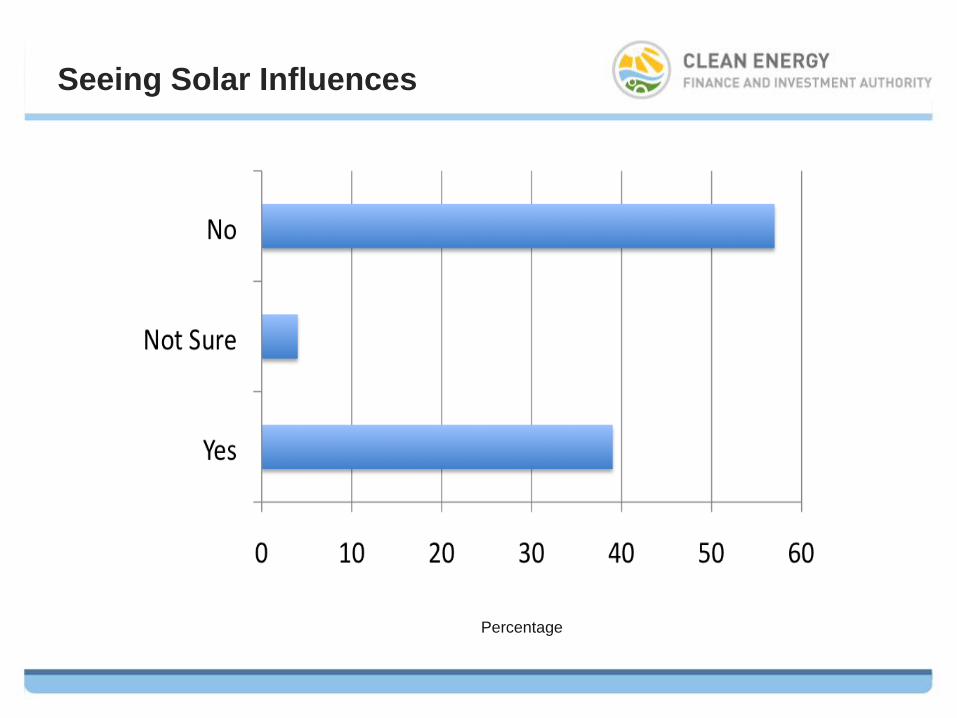
Seeing Solar Influences
Percentage
Percentage
Town Participation Important

Help Spread the Word
Percentage

Demographics
Percentage
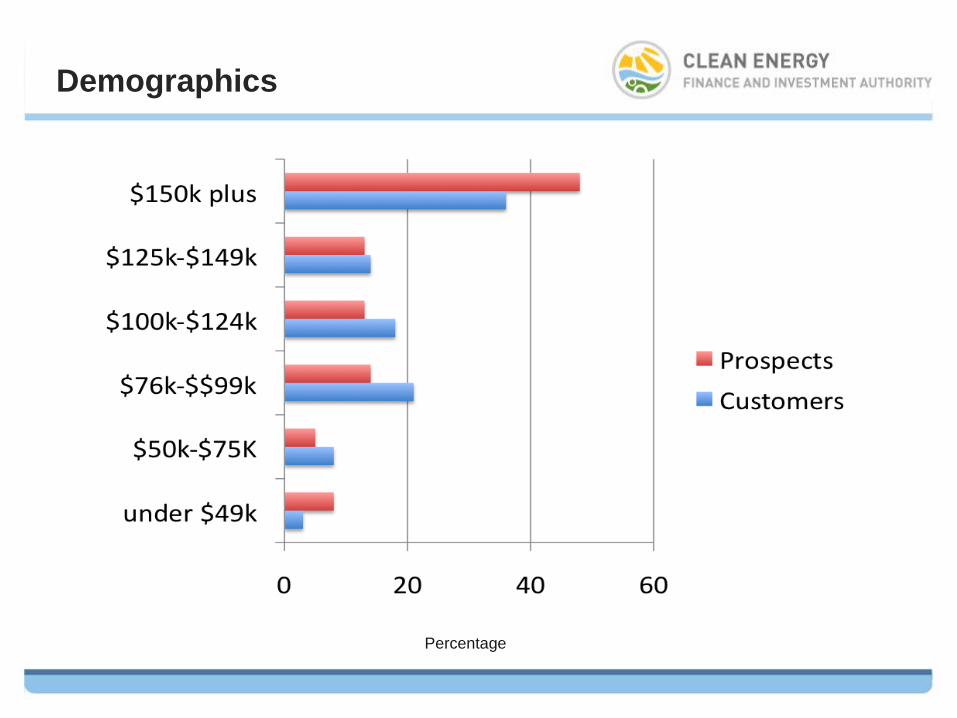
Demographics
Percentage

Next Steps
Distressed Municipalities – how will Solarize campaigns
work in distressed communities?
Financing – what happens when we add new lease and
loan products as a component?
Adaptation – can the Solarize model be adapted to
support the ramp-up of other clean energy technologies?
Fuel Conversion
Energy Efficiency or Weatherization Upgrades
Solar Hot Water Systems
28
