united states rendering and feed-manufacturing · pdf fileunited states rendering and...
TRANSCRIPT

United States Rendering and
Feed-Manufacturing Industries:
Evaluation of Practices
with Risk Potential for
Bovine Spongiform Encephalopathy
February 1993
USDA:APHIS:VS
Centers for Epidemiology and Animal Health
555 South Howes
Fort Collins, Colorado 80521

Table of Contents
Summary 1
Introduction 3
Survey Purpose and Response Rates 3
Rendering Industry Figures and Tables 5
Feed Industry Figures 13
Discussion 20
References 22

1
Summary
Since practices in the rendering and feed-manufacturing industry can affect the risk of cattle
contracting Bovine Spongiform Encephalopathy (BSE), surveys of the two industries were
conducted in 1991-92 by the American Protein Producers Industry (APPI) and the American
Feed Industry Association (AFIA), respectively. The rendering survey was sent to all 309
known renderers in the United States, with an overall response rate of 38 percent. The feed
manufacturers survey was mailed to 114 members of the AFIA Nutrition Council. Eighty-
three (83) of the questionnaires were returned for analysis. Both surveys requested
information for 1985 and 1990. Data were sent to the U.S. Department of Agriculture,
Animal and Plant Health Inspection Service, Veterinary Services for analysis.
There was a decrease in the percent of renderers processing mature (>1 yr.) sheep from 44
percent in 1985 to 13 percent in 1990. The proportion of renderers processing dead sheep
also decreased from 39 percent in 1985 to 7 percent in 1990. While 42 percent of
renderers processed heads from mature sheep in 1985, only 8 percent did so in 1990.
Of the total meat and bone meal/dry rendered tankage (MBM/DRT) sold in 1985 and 1990,
more than two-thirds went to feed companies and blenders/brokers. Likewise,
approximately two-thirds of the MBM/DRT was distributed to customers within 150 miles of
the renderer. The renderers also received almost all of their offal from suppliers within 150
miles of the rendering facility.
Approximately 75 percent of all offal by weight is reportedly processed by the continuous
method. None of the renderers reported using solvents. Fifty percent of the renderers
reported that their equipment was installed prior to 1978 and the oldest equipment in use
dated to 1945.
The total volume of feeds produced by the 83 feed manufacturers in 1990 was about 6.4
million tons. Complete feeds made up 56 percent of the total volume, and
supplements/concentrates made up another 38 percent. Approximately 80 percent of the
feed manufactures sold their products within 150 miles of the production facility, and 85
percent acquired their meat and bone meal/meat by-products (MBM/MBP) from within 150
miles.
Almost all of the manufacturers used MBM/MBP in their feeds. Although most (63%) of the
MBM/MBP went into swine feeds, 15 percent went into beef cattle feeds and 12 percent
into dairy cattle feeds. About three-fourths of the manufacturers did not require any animal
species to be excluded from the MBM/MBP that was used in the feeds. Of the feed
products intended for dairy cattle, 53 percent included MBM/MBP from unknown species
that did not exclude sheep. Fifty-six (56) percent of beef cattle feeds incorporated
MBM/MBP from unknown species which did not exclude sheep.

2
Acknowledgement
The American Protein Producers Industry and the American Feed Industry Association are to
be commended for conducting the surveys contained in this report. Thanks are also
extended to all those U.S. renderers and feed manufacturers who gave of their valuable
time to complete survey questionnaires.

3
Introduction
Bovine Spongiform Encephalopathy (BSE), a neurologic disease of cattle, was first recog-
nized in Great Britain in late 1986, and since that time there have been 78,503 confirmed
BSE cases on 22,399 farms. The later represent 23 percent of all farms with cattle in Great
Britain. In 1991, the rate of clinical disease diagnosed was 4.6 per thousand cattle over
two years of age. Epidemiologic studies conducted by scientists in Great Britain suggested
that exposure of cattle to a sheep scrapie agent, which produces a degenerative neurologi-
cal disease in sheep, lead to the onset of BSE. Results of their studies were consistent with
the hypothesis that the causative agent was introduced through feedstuffs that contain
ruminant-derived protein (1). The first cases of BSE in Great Britain were traced to 1985.
The incubation period in cattle has been estimated to be 4-5 years, which suggests that the
initial exposure of cattle occurred in 1981-82. At this same time, the rendering industry
reduced the use of hydrocarbon solvent extraction of fat in the rendering of animal tissues
for production of meat and bone meal (2,3).
To date there has not been a documented case of BSE in cattle in the United States. In
1991, the U.S. Department of Agriculture, Animal and Plant Health Inspection Service,
Veterinary Services (USDA:APHIS:VS) performed a qualitative and quantitative assessment
of the risk of the disease occurring in the United States. The authors concluded that there
was little evidence to support a broad risk of BSE at the national level (4,5). Factors that
were identified as influencing the risk of BSE occurrence include sheep and cattle demo-
graphics, sheep scrapie disease status, and rendering and feed industry practices.
Survey Purpose
Following the completion of the risk analysis studies noted above, it was recognized that
additional information was needed on rendering and feed manufacturing practices in the
U.S. Separate surveys were subsequently conducted by both industries. The goal of both
surveys was to provide additional information relevant to evaluating the risk of BSE
occurring in the U.S.
The rendering industry survey data were collected by the American Protein Producers
Industry (APPI) and the analysis was conducted by the USDA:APHIS:VS. The survey was
designed to provide data concerning the types of products being rendered, their origin,
rendering technology, and the distribution of the various final rendered products. Analysis
of data also incorporated information on the distribution of scrapie infected sheep flocks in
the U.S. Surveys were mailed to all known renderers in the United States by the APPI. A
second complete mailing of the survey was implemented approximately 7 weeks after the
initial mailing to increase the response rate.
The survey of feed manufacturers was intended to obtain information regarding the
incorporation of meat and bone meal and meat by-products (MBM/MBP) into feed for cattle.
Members of the American Feed Industry Association (AFIA) Nutrition Council were selected

4
by the AFIA to participate in the survey. Data were collected by the AFIA and forwarded to
the USDA:APHIS:VS for analysis.
Survey response
A total of 117 questionnaires were returned out of the 309 mailed to renderers (38% overall
response). The geographic distribution of renderers responding to the questionnaire was
significantly correlated with the distribution of all renderers as compared using Kendall's
Tau statistic (t=0.783, p<0.001). Rendering facilities were categorized as small, medium
and large and the size distribution of responders was compared with that of all renderers.
The plant size distribution for responders was not different from that of the industry (chi-
square=2.16 p=0.339). The response rate for the first portion of the survey, which
required yes or no answers, was generally good, ranging from 86 to 100 percent of the 117
responders. However, the response rate for the last part of the survey, which required
quantitative information, was lower (47-73% of 117 responders). In general, the response
rate to questions was similar across the three size categories of rendering plants.
There were 114 feed survey questionnaires sent to AFIA Nutrition Council members and 83
fully or partially completed questionnaires were returned. The representativeness of this
survey sample compared with the total feed industry is unknown.
Survey results follow and are presented in a series of graphs and tables with interpretive
comments and summary accompanying each.
5
Rendering Industry Figures
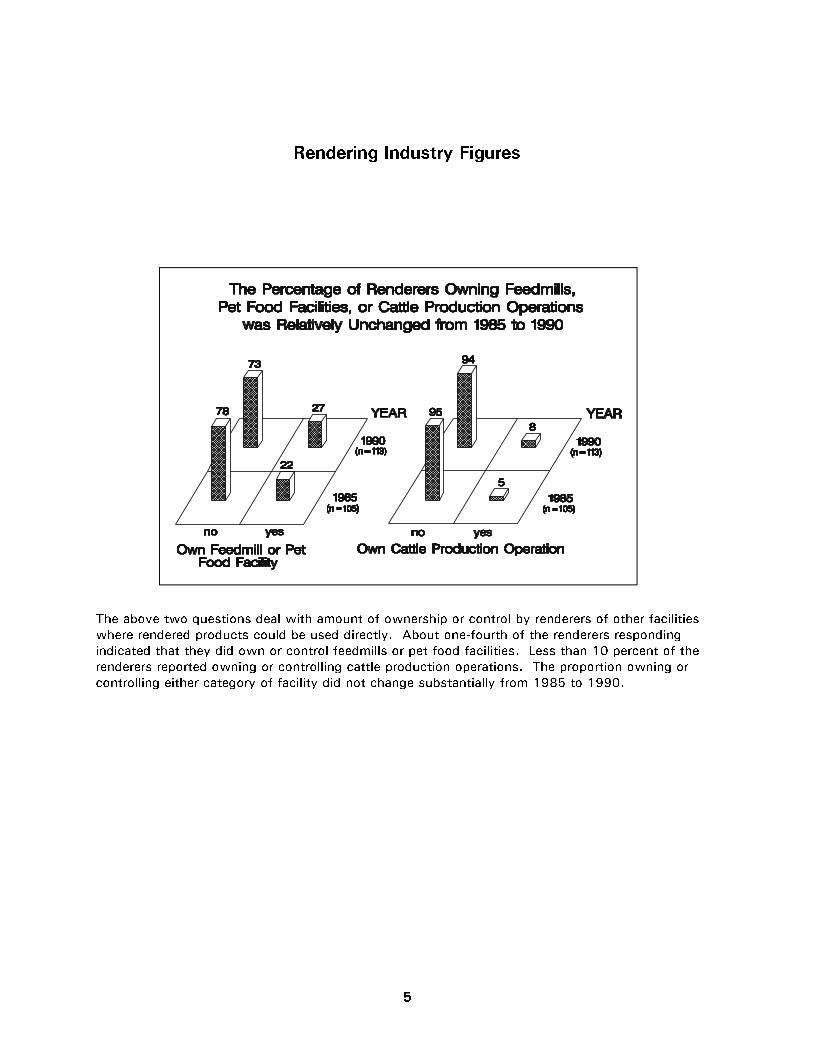
The above two questions deal with amount of ownership or control by renderers of other facilities
where rendered products could be used directly. About one-fourth of the renderers responding
indicated that they did own or control feedmills or pet food facilities. Less than 10 percent of the
renderers reported owning or controlling cattle production operations. The proportion owning or
controlling either category of facility did not change substantially from 1985 to 1990.
6
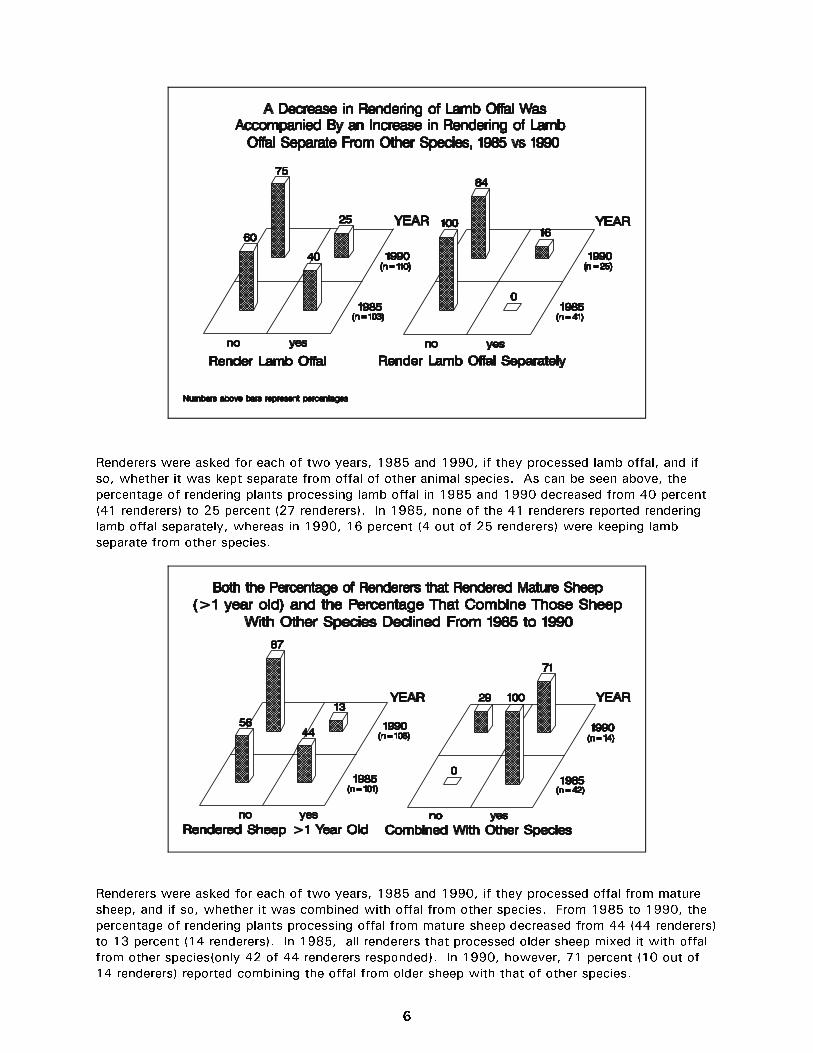
Renderers were asked for each of two years, 1985 and 1990, if they processed lamb offal, and if
so, whether it was kept separate from offal of other animal species. As can be seen above, the
percentage of rendering plants processing lamb offal in 1985 and 1990 decreased from 40 percent
(41 renderers) to 25 percent (27 renderers). In 1985, none of the 41 renderers reported rendering
lamb offal separately, whereas in 1990, 16 percent (4 out of 25 renderers) were keeping lamb
separate from other species.
Renderers were asked for each of two years, 1985 and 1990, if they processed offal from mature
sheep, and if so, whether it was combined with offal from other species. From 1985 to 1990, the
percentage of rendering plants processing offal from mature sheep decreased from 44 (44 renderers)
to 13 percent (14 renderers). In 1985, all renderers that processed older sheep mixed it with offal
from other species(only 42 of 44 renderers responded). In 1990, however, 71 percent (10 out of
14 renderers) reported combining the offal from older sheep with that of other species.

7
The heads from sheep greater than 1 year of age are considered to be a high risk tissue for scrapie
agent. Slightly over 40 percent of renderers reported processing heads from older sheep in 1985.
That proportion had decreased substantially by 1990, when only 8 percent reported rendering heads
from sheep greater than 1 year of age.
Renderers were asked whether they rendered dead sheep, and if so, whether the dead sheep offal
was combined with that from other species. There was a substantial decrease from 1985 to 1990
in the percentage of rendering plants processing dead sheep. There also was a decrease over the
same time interval in the percentage of renderers mixing dead sheep offal with that from other
species. The actual number of renderers reporting mixing dead sheep with other species decreased
from 37 in 1985 to 6 in 1990.
8
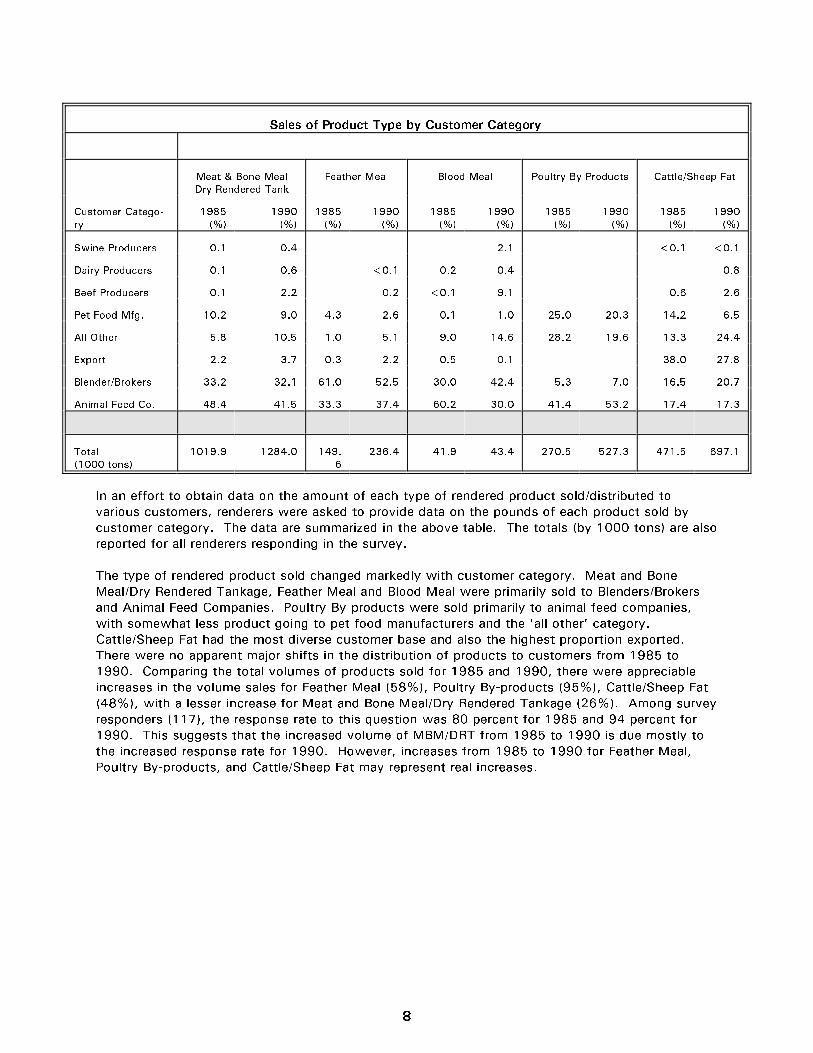
Sales of Product Type by Customer Category
Meat & Bone Meal Feather Meal Blood Meal Poultry By-Products Cattle/Sheep Fat
Dry Rendered Tank
Customer Catego- 1985 1990 1985 1990 1985 1990 1985 1990 1985 1990
ry (%) (%) (%) (%) (%) (%) (%) (%) (%) (%)
Swine Producers 0.1 0.4 2.1 <0.1 <0.1
Dairy Producers 0.1 0.6 <0.1 0.2 0.4 0.8
Beef Producers 0.1 2.2 0.2 <0.1 9.1 0.6 2.6
Pet Food Mfg. 10.2 9.0 4.3 2.6 0.1 1.0 25.0 20.3 14.2 6.5
All Other 5.8 10.5 1.0 5.1 9.0 14.6 28.2 19.6 13.3 24.4
Export 2.2 3.7 0.3 2.2 0.5 0.1 38.0 27.8
Blender/Brokers 33.2 32.1 61.0 52.5 30.0 42.4 5.3 7.0 16.5 20.7
Animal Feed Co. 48.4 41.5 33.3 37.4 60.2 30.0 41.4 53.2 17.4 17.3
Total 1019.9 1284.0 149. 236.4 41.9 43.4 270.5 527.3 471.5 697.1
(1000 tons) 6
In an effort to obtain data on the amount of each type of rendered product sold/distributed to
various customers, renderers were asked to provide data on the pounds of each product sold by
customer category. The data are summarized in the above table. The totals (by 1000 tons) are also
reported for all renderers responding in the survey.
The type of rendered product sold changed markedly with customer category. Meat and Bone
Meal/Dry Rendered Tankage, Feather Meal and Blood Meal were primarily sold to Blenders/Brokers
and Animal Feed Companies. Poultry By-products were sold primarily to animal feed companies,
with somewhat less product going to pet food manufacturers and the 'all other' category.
Cattle/Sheep Fat had the most diverse customer base and also the highest proportion exported.
There were no apparent major shifts in the distribution of products to customers from 1985 to
1990. Comparing the total volumes of products sold for 1985 and 1990, there were appreciable
increases in the volume sales for Feather Meal (58%), Poultry By-products (95%), Cattle/Sheep Fat
(48%), with a lesser increase for Meat and Bone Meal/Dry Rendered Tankage (26%). Among survey
responders (117), the response rate to this question was 80 percent for 1985 and 94 percent for
1990. This suggests that the increased volume of MBM/DRT from 1985 to 1990 is due mostly to
the increased response rate for 1990. However, increases from 1985 to 1990 for Feather Meal,
Poultry By-products, and Cattle/Sheep Fat may represent real increases.

9
Approximately Two-Thirds of MBM/DRT Sold Within 150 Miles
and Primarily to Feed Companies and Blenders/Brokers
1985 1990
< 50 51-150 151-300 > 300 All < 50 51-150 151-300 > 300 All
miles miles miles miles miles miles miles miles
Broker/ 13.7 6.1 2.2 9.7 31.7 8.9 8.3 2.6 10.2 30.0
Blender
a
Feed Co. 17.4 12.6 6.8 5.5 42.3 13.4 14.0 8.3 3.0 38.7
Livestock 0.3 0.1 <0.1 <0.1 0.4 0.2 0.3 <0.1 <0.1 0.5
Producer
Pet Food 6.0 2.2 0.5 2.9 11.6 3.8 1.6 2.2 3.7 11.3
Poultry 5.5 4.8 0.8 0.7 11.8 6.6 6.1 2.0 1.3 16.0
Producer
All Others 1.0 0.1 1.3 0.7 3.1 1.7 0.3 0.4 1.0 3.4
Total 43.9 25.9 10.7 19.5 100.0 34.6 30.5 15.6 19.3 100.0
Percent of annual totala
Renderers were asked to report the quantity of MBM/DRT which they sold/distributed by customer
category and zip code. This information was analyzed and is summarized above by customer
category and distance from the renderer. Blenders/Brokers and Feed Companies obtained 32
percent and 42 percent of the MBM/DRT in 1985 while comparable figures for 1990 were 30
percent and 39 percent, respectively. Pet Food Manufacturers and Poultry Producers each received
about 12 percent of the MBM/DRT directly from renderers. Approximately two-thirds of the
MBM/DRT for both 1985 and 1990 was sold to customers within a 150 mile radius of the rendering
facility.

10
Distance of Offal Suppliers From Rendering Facilities
Percentage of Total Offal by Species for Each Distance Category
1985 1990
Sheep Offal Cattle Offal Offal-All Others Sheep Offal Cattle Offal Offal-All Others
Distance Jan Jul Jan Jul Jan Jul Jan Jul Jan Jul Jan Jul
(%) (%) (%) (%) (%) (%) (%) (%) (%) (%) (%) (%)
< 50 miles 85.4 81.9 66.3 66.7 75.3 76.7 64.0 57.4 85. 83.2 60.6 60.1
7
50-150 miles 14.3 17.5 15.6 14.9 24.6 23.0 35.2 41.5 8.8 11.9 33.9 35.7
151-300 0.4 0.6 6.3 5.7 0.1 0.2 0.8 1.0 2.7 2.7 5.5 4.2
miles
> 300 miles <0.1 <0.1 11.9 12.7 0.0 <0.1 <0.1 <0.1 2.9 2.2 <0.1 <0.1
Percent of 1.0 0.6 18.3 17.6 30.1 32.4 0.7 0.6 14. 13.6 35.6 35.5
Total Offal 1
Reported totals come from renderers which responded to this question, which was 47 percent of 117 survey respondents
Renderers were asked to provide quantitative data on the kind and amount of offal received from
slaughter plants and lockers for 2 months, January and July, by zip code of the offal source. They
were asked for data for 2 years, 1985 and 1990. Using the zip code information to compute the
distance from suppliers to the renderer, the proportion of offal received by distance from suppliers
was calculated for each species for January and July of both years. The data are summarized above
using distance interval categories of approximately 50 miles.
Repeated measures analysis of variance results indicated that there was no seasonal difference in
the amount of offal received among the three species categories (sheep, cattle, and 'all other').
There was, however, a significant increase from 1985 to 1990 in the amount of cattle offal
received. The quantity of sheep and 'other species' offal received did not change over the same
time period. Colorado and California contributed 32 and 19 percent of the above total sheep offal
for 1990, respectively. These 2 States had 29 percent and 13 percent, respectively, of the total
sheep slaughtered in fiscal 1991.
A related question asked for similar data except it was limited to dead animals, and supplier location
by quadrant of the State was requested. Responses regarding location were quite variable and
inconsistent, making meaningful computations impossible. Analysis of the data for dead animal
offal indicated higher quantities of both dead cattle and 'other species' were received in January
compared with July, but the amount of dead sheep offal was not different between January and
July.

11
Percent of Total Pounds of Offal from Slaughter and Dead Sheep
by Scrapie Incidence in State of Suppliera
Scrapie Category
Year 0-0.016 0.017-0.23 0.24-2.63 2.64+b
Dead Sheep 1985 68.3% 20.1% 10.1% 1.5%
1990 85.5% 3.1% 11.3% 0.1%
Slaughter Sheep 1985 0.9% 70.1% 16.3% 12.7%
1990 15.9% 43.5% 40.6% 0.0%
Cumulative scrapie incidence, 1980-90.a
Infected flocks/10,000 ewesb
In an effort to look at the relative risk of renderers obtaining offal from sheep potentially infected
with the sheep scrapie agent, the offal received was classified by scrapie prevalence in the area
from which the offal came. For sheep received as deads, the largest percentage of total offal (86%)
in 1990 came from areas in the lowest scrapie prevalence category, and that proportion increased
from 1985 to 1990. For slaughter sheep offal approximately 85 percent of the offal came from
areas in the middle 2 scrapie prevalence categories for both 1985 and 1990. In 1985, about 13
percent of the offal reportedly came from regions in the highest scrapie category, however none of
the offal in 1990 was from the highest scrapie category. The risk of obtaining scrapie-contaminated
offal from dead sheep appears to be low. The similar risk for slaughter sheep offal is somewhat
higher in that most of the offal came from areas with a scrapie prevalence of 0.017 - 2.63 per
10,000 sheep; however in 1990 none of the offal came from areas in the highest scrapie category.

12
Renderers were asked to provide information on the process used for rendering offal. Data
requested were whether batch or continuous processes were used, the year equipment was
installed, whether extraction solvents were used, and the amount of sheep, cattle, and all other offal
processed. None of the renderers reported using solvents for either 1985 or 1990. Of renderers
responding with information for 1990, 50 percent reported that their equipment was installed prior
to 1978 and approximately 25 percent of the equipment was installed after 1983. The oldest
equipment in use dates to 1945. Batch processing was reportedly used 47 and 45 percent of the
time in 1985 and 1990, respectively; however approximately three-fourths or more of the offal by
weight was rendered by the continuous process.

1
Feed Industry Figures
Feed manufacturers were asked if they owned or controlled rendering or livestock production facilities
in either 1985 or 1990. None of 83 feed manufacturers reported owning or controlling rendering
facilities in either year but 26 percent and 27 percent responded affirmatively to owning livestock
production facilities in 1985 and 1990, respectively.
2
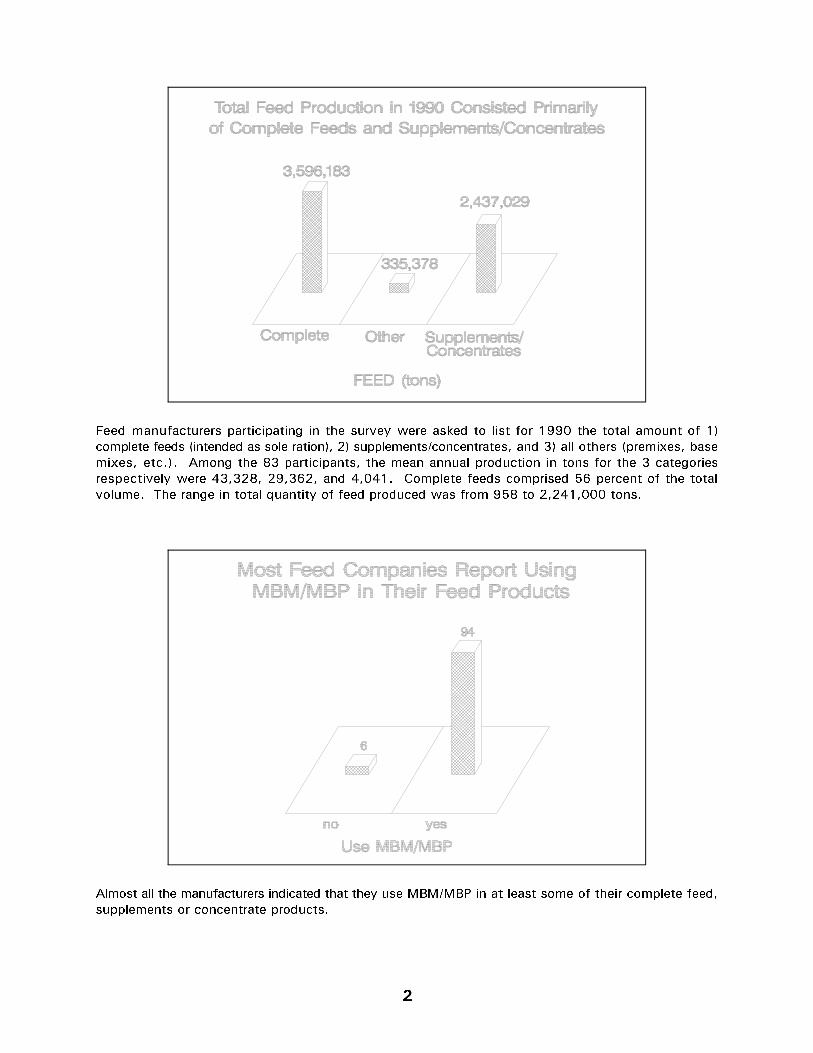
Feed manufacturers participating in the survey were asked to list for 1990 the total amount of 1)
complete feeds (intended as sole ration), 2) supplements/concentrates, and 3) all others (premixes, base
mixes, etc.). Among the 83 participants, the mean annual production in tons for the 3 categories
respectively were 43,328, 29,362, and 4,041. Complete feeds comprised 56 percent of the total
volume. The range in total quantity of feed produced was from 958 to 2,241,000 tons.
Almost all the manufacturers indicated that they use MBM/MBP in at least some of their complete feed,
supplements or concentrate products.

3
This question was intended to obtain information about the suppliers of MBM/MBP. Sixty-four percent
of the MBM/MBP was obtained directly from renderers, 35 percent from blenders, and less than 1
percent from others. Although almost two-thirds of the total MBM/MBP was obtained from renderers,
this was influenced by large producers in two States. Feed manufacturers in 8 of 19 States reported
obtaining a larger proportion of their MBM/MBP from blenders.
Feed manufacturers were asked for the total volume of MBM/MBP that they used in their feeds during
1990. The total MBM/MBP reported used by participants in the survey was 383,100 tons with an
average of 4,975 tons per manufacturer and a range of 2 to 150,000 tons. Seventy percent of the
manufacturers used at least 1,000 tons of MBM/MBP in their feed products in 1990.

4
Feed production manufacturers reported receiving almost 40 percent of their MBM/MBP from sources
within 50 miles of their facility and only 15 percent from more than 150 miles away. The proportion
received from more than 150 miles away is less than the proportion reported in the renderer survey as
distributed outside of a 150 mile range (30% in 1985 and 35% in 1990).
In order to obtain information on the distribution of feeds from the manufacturer, participants were
asked to list the proportion of total feed sold by the distance of customers from the manufacturers.
Percentages in each distance category were weighted by the total feed production for each respondent.
Respondents were grouped into one of four production categories to compare manufacturers of similar
production output. The percentages in the distance categories were similar for beef and dairy cattle
feeds. The smallest production facilities tended to distribute their product more than 150 miles more
frequently than the large facilities.
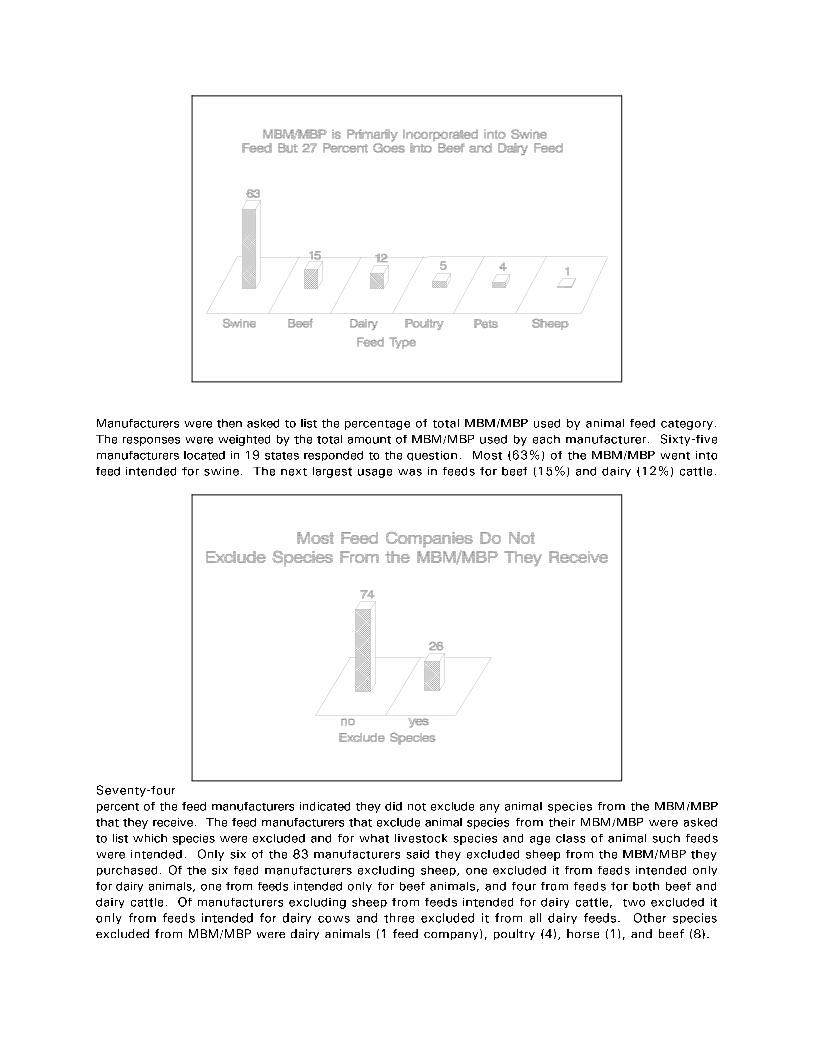
Manufacturers were then asked to list the percentage of total MBM/MBP used by animal feed category.
The responses were weighted by the total amount of MBM/MBP used by each manufacturer. Sixty-five
manufacturers located in 19 states responded to the question. Most (63%) of the MBM/MBP went into
feed intended for swine. The next largest usage was in feeds for beef (15%) and dairy (12%) cattle.
Seventy-four
percent of the feed manufacturers indicated they did not exclude any animal species from the MBM/MBP
that they receive. The feed manufacturers that exclude animal species from their MBM/MBP were asked
to list which species were excluded and for what livestock species and age class of animal such feeds
were intended. Only six of the 83 manufacturers said they excluded sheep from the MBM/MBP they
purchased. Of the six feed manufacturers excluding sheep, one excluded it from feeds intended only
for dairy animals, one from feeds intended only for beef animals, and four from feeds for both beef and
dairy cattle. Of manufacturers excluding sheep from feeds intended for dairy cattle, two excluded it
only from feeds intended for dairy cows and three excluded it from all dairy feeds. Other species
excluded from MBM/MBP were dairy animals (1 feed company), poultry (4), horse (1), and beef (8).

Feed manufacturers reported the animal source for 124 different dairy feed products. Sixty-six (53
percent) of the feed products contained MBM/MBP from unknown animal sources and from
manufacturers that do not exclude any species.
For 102 different feed products, MBM/MBP from unknown species sources was included in feeds for
2 dairy animal classes, calf grower/heifer and dairy cow. One feed product intended as calf grower
reportedly contains 10 percent unknown source MBM/MBP. Seventy-one additional products intended
for dairy cows contain an average of 8.5 percent unknown source MBM/MBP (range: 1.3%-33%).

Fifty-six
percent of the feed products for beef animals (151 out of the total 269 beef feed products) included
mixed source MBM/MBP that do not exclude any species.
Unknown source MBM/MBP was incorporated into all classes of beef animal feed. Ninety-two products
intended for feed-lot animals contained an average of 8.1 percent unknown source MBM/MBP. In
addition, unknown source MBM/MBP made up 7.0 percent, on average, of 20 products intended for
breeding animals, 5.5 percent of 66 products intended for growers/stockers, and 2.0 percent of 2 feed
products intended for creep feeds.

4
Discussion
Wilesmith et. al. (1988) noted several factors associated with an increase in the
occurrence of BSE in Great Britain. Factors relevant to this study are 1) probable
increase in the number of scrapie infected flocks, 2) inclusion of sheep heads in
material for rendering, 3) increased inclusion of casualty and condemned sheep in
rendering material, 4) use of continuous processing which may result in lower render-
ing temperatures and shorter processing times, and 5) the decline in the use of
hydrocarbon solvents and terminal heat treatment for fat extraction since the mid-
1970's, with a substantial decline in solvent use in the interval 1981-1983.
The underlying assumption regarding both the rendering and feed surveys was that
the causal factor for BSE was persistence of the sheep scrapie agent in meat and
bone meal. Assessment of the relative risk of BSE occurring in the U.S. necessarily
includes a consideration of rendering practices and the use of meat and bone meal
in bovine rations.
Observations from the rendering survey suggest that rendered sheep offal constitutes
a relatively small proportion of the total animal offal rendered. Sheep offal represents
less than two percent of all offal rendered. Responses regarding rendering practices
show a consistent decrease in the rendering of lamb and sheep offal between 1985
and 1990 and a decrease in the practice of combining sheep with other species
during rendering. This is most striking for dead sheep and heads from sheep greater
than 1 year of age.
Data from the renderers suggest that most raw material is obtained and most
MBM/MBP is sold within a limited distance from the rendering facility. Although the
amount of material purchased and product sold within a 50 mile radius decreased for
most species from 1985 to 1990, the decline did not appear to be substantial.
Similarly, feed manufacturers reported obtaining most of their MBM/MBP within 150
miles of their facility, and most feeds were sold within the same distance. Those
manufacturers in the smallest annual volume category sold more of their feed at
greater distances, but still marketed 70 percent within 150 miles.
A high proportion of feed manufacturers reported incorporating mixed MBM into their
products and most did not specify exclusion of any species from their MBM.
Although MBM was primarily incorporated into swine feed products, over half of the
dairy feed products also contained mixed source MBM. Since the survey did not
determine the species composition of the unknown source MBM, it was not possible
to establish if sheep offal had been incorporated into the product.

5
Significant results from the 2 surveys include the following:
! Sheep make up a small proportion of offal rendered.
! There has been a decline in the rendering of older sheep and sheep heads.
! Renderers generally purchase offal and market MBM relatively close to the
rendering facility.
! Feed manufacturers purchase MBM and market most of their feed products
within 150 miles of their facilities.
These observations support the conclusion that incorporation of scrapie contaminated
MBM into feeds would likely be infrequent and may be geographically limited in
scope. However, the extended time period to detection of such an event, because
of the long incubation period for BSE (4-5 years), would provide sufficient time for
amplification of the consequences from such an incident, especially if offal from
infected cattle subsequently re-entered the rendering stream.
Information obtained from the rendering and feed surveys generally supports a low
risk status for BSE in the U.S. There are however, factors associated with both the
rendering and feed industries which allow for the possibility of sheep scrapie agent
being incorporated in ruminant feeds.
A final cautionary note. The overall response to the rendering survey was low.
Although the sample resembles the population of renderers by size and geographic
location, the representativeness of other information collected is unknown because
the response rate for individual questions was quite variable, and in some cases very
low. Caution should also be exercised in drawing inferences from the feed survey
because the survey was sent only to feed manufacturers represented on the AFIA
Nutrition Council.

6
References
1. Wilesmith, J.W., G.A.H. Wells, M.P. Cranwell, J.B.M. Ryan. 1988. Bovine
spongiform encephalopathy: epidemiological studies. Vet. Rec. 123:638-644.
2. Wilesmith, J.W. 1991. Bovine spongiform encephalopathy: epidemiologic
approaches, trials and tribulations. In: Proc. 6th Int. Symp. Vet. Epidemiol.
and Economics, pp 32-43.
3. Wilesmith, J.W., J.B.M. Ryan, M.J. Atkinson. 1991. Bovine spongiform
encephalopathy: epidemiological studies on the origin. Vet. Rec. 128:199-
203.
4. USDA:APHIS:VS. 1991. Qualitative analysis of BSE risk factors in the United
States. Fort Collins, Colorado.
5. USDA:APHIS:VS. 1991. Quantitative risk assessment of BSE in the United
States. Fort Collins, Colorado.