(translation) summary of consolidated financial results for the fiscal year … · 2014-06-20 · 3...
TRANSCRIPT

1
(Translation)
Summary of Consolidated Financial Results for the Fiscal Year Ended March 31, 2014 (J-GAAP)
May 8, 2014
Listed Company Name: Oki Electric Industry Co., Ltd. Securities Code: 6703 Stock Exchange Listing: Tokyo Stock Exchange URL: http://www.oki.com/ Representative: Hideichi Kawasaki, President, Representative Director Contact: Atsushi Yamauchi, General Manager, Investor Relations TEL: +81-3-3501-3836 Date of Ordinary General Meeting of Shareholders (Scheduled): June 25, 2014 Commencement of Dividend Payment (Scheduled): June 26, 2014 Filing of Securities Report (Scheduled): June 25, 2014 Supplementary Document on Financial Results: Yes Financial Results Briefing: Yes (for institutional investors)
(Amounts less than one million yen have been truncated)
1. Consolidated Financial Results for the Fiscal Year Ended March 31, 2014 (from April 1, 2013 to March 31, 2014) (1) Consolidated operating results
(Percentage figures indicate year-on-year change)
Net sales Operating income Ordinary income Net income Million yen % Million yen % Million yen % Million yen %
Fiscal year ended March 31, 2014
483,112
6.0 27,196
101.8 36,655
80.5 27,359
101.2
March 31, 2013 455,824 7.6 13,475 12.5 20,304 123.7 13,599 774.2(Note) Comprehensive income Fiscal year ended March 31, 2014: ¥22,442 million (39.9%) Fiscal year ended March 31, 2013: ¥16,040 million (363.3%)
Net income
per share–basic Net income
per share–dilutedReturn on equity
Ordinary income to total assets
Operating income to net sales
Yen Yen % % %
Fiscal year ended March 31, 2014
36.21 26.13 37.8
9.6 5.6
March 31, 2013 17.24 12.05 28.0 5.7 3.0(Reference) Share of profit (loss) of entities accounted for using equity method Fiscal year ended March 31, 2014: ¥339 million Fiscal year ended March 31, 2013: ¥84 million
(2) Consolidated financial position
Total assets Net assets Shareholders’ equity
ratio Net assets per share
Million yen Million yen % Yen
As of March 31, 2014 412,514 91,918 21.5 79.32As of March 31, 2013 349,322 56,625 16.1 34.40
(Reference) Shareholders’ equity As of March 31, 2014: ¥88,735 million As of March 31, 2013: ¥56,072 million
(3) Consolidated cash flows Net cash
provided by (used in) operating activities
Net cash provided by (used in)
investing activities
Net cash provided by (used in) financing activities
Cash and cash equivalents
at end of period Million yen Million yen Million yen Million yen
Fiscal year ended March 31, 2014 31,868 (13,977)
(4,270) 50,866
March 31, 2013 (11,619) (9,214) (21,093) 35,894

2
2. Dividends Dividend per share Total
dividend amount
(Annual)
Dividend payout ratio(Consolidated)
Dividends to net assets(Consolidated)
First
quarter-end Second
quarter-end Third
quarter-endYear-end Total
Yen Yen Yen Yen Yen Million yen % %
Fiscal year ended March 31, 2013 ―
0.00
―0.00 0.00
0 0.0 0.0
March 31, 2014 ― 0.00 ― 3.00 3.00 2,184 8.3 5.3Fiscal year endingMarch 31, 2015 (Projection)
― 2.00 ― 2.00 4.00 17.6
(Note) The above “Dividends” are those on common stock. For the dividends on (unlisted) other class stock with different rights from those of common stock issued by the Company, please refer to “(Reference) Dividends on Other Class Stock” on page 3.
3. Consolidated Results Projection for the Fiscal Year Ending March 31, 2015 (from April 1, 2014 to March 31, 2015)
(Percentage figures indicate year-on-year change)
Net sales Operating income Ordinary income Net income Net income per share
Million yen % Million yen % Million yen % Million yen % Yen
First six months 220,000 7.8 3,000 7.1 1,000 -85.6 1,000 -44.9 0.69Full year 525,000 8.7 28,500 4.8 25,500 -30.4 17,500 -36.0 22.68 Notes
(1) Changes in significant subsidiaries during the period (changes in specified subsidiaries resulting in changes in the scope of consolidation): Yes
Companies included: 1 (OKI Brasil Indústria e Comércio de Produtos e Tecnologia em Automação S.A.) Companies excluded: ―
(2) Changes in accounting policies, changes in accounting estimates and restatements
1) Changes in accounting policies in accordance with revision of accounting standards, etc.: Yes 2) Any changes in accounting policies other than 1) above: None 3) Changes in accounting estimates: None 4) Restatements: None
(3) Number of outstanding shares (common stock)
1) Number of shares issued at the end of the period (including treasury shares) As of March 31, 2014 731,438,670 shares As of March 31, 2013 731,438,670 shares
2) Number of treasury shares at the end of the period As of March 31, 2014 3,614,428 shares As of March 31, 2013 3,465,556 shares
3) Average number of shares during the period Fiscal year ended March 31, 2014 727,899,294 shares Fiscal year ended March 31, 2013 728,938,908 shares
(Note) For information on the number of shares for the basis for calculating net income per share (consolidated), please refer to “Per Share Information” on page 43 of the Attachment.

3
(Reference) Summary of Non-consolidated Financial Results Non-consolidated Financial Results for the Fiscal Year Ended March 31, 2014 (from April 1, 2013 to March 31, 2014)
(1) Non-consolidated operating results (Percentage figures indicate year-on-year change)
Net sales Operating income Ordinary income Net income Million yen % Million yen % Million yen % Million yen %
Fiscal year ended March 31, 2014
238,786 5.7 12,626 0.9 13,259
-59.6 12,057 -41.9
March 31, 2013 225,953 10.2 12,517 97.9 32,816 392.1 20,763 511.6
Net income
per share–basic Net income
per share–diluted Yen Yen
Fiscal year ended March 31, 2014 15.18 11.51March 31, 2013 27.06 18.39 (2) Non-consolidated financial position
Total assets Net assets Shareholders’ equity
ratio Net assets per share
Million yen Million yen % Yen
As of March 31, 2014 321,099 85,763 26.7 75.10As of March 31, 2013 302,166 72,744 24.0 57.17
(Reference) Shareholders’ equity As of March 31, 2014: ¥85,684 million As of March 31, 2013: ¥72,665 million
Implementation status for auditing procedures The financial statements auditing procedure based on the Financial Instruments and Exchange Act had not been completed as of the release of this document. Explanation regarding appropriate use of results projection and other special notes (Warning on forward-looking statements) The forward-looking statements such as outlook for the financial results contained in this document are based on information currently available to the Company and certain assumptions that the Company deems to be reasonable, and actual results may differ from such statements due to a variety of factors. For the conditions assumed for the results projection and notes on the use of such projections, please refer to “Outlook for the fiscal year ending March 31, 2015” of “1. Analysis of Operating Results and Financial Position, (1) Analysis of Operating Results” on page 2 of the Attachment. (How to obtain supplemental document on financial results) The Company is scheduled to hold a financial results briefing for institutional investors on May 8, 2014 (Thursday). The document on financial results is disclosed on TDNet at the same time as this Summary of Consolidated Financial Results and is also made available on the Company’s website on the same day. (Reference) Dividends on Other Class Stock The breakdown of dividends per share on other class stock with different rights from those of common stock is as follows:
Class A preferred stock (Base date)
Dividend per share First
quarter-end Second
quarter-end Third
quarter-end Year-end Total
Yen Yen Yen Yen Yen
Fiscal year ended March 31, 2013 ― 0.00 ―
34,410.00 34,410.00
March 31, 2014 ― 0.00 ― 33,490.00 33,490.00Fiscal year ending March 31, 2015 (Projection)
― 16,525.00 ― 16,525.00 33,050.00
1
Contents of the Attachment
1. Analysis of Operating Results and Financial Position ..................................................................................... 2
(1) Analysis of Operating Results ................................................................................................................... 2
(2) Analysis of Financial Position ................................................................................................................... 3
(3) Basic Policy Concerning the Distribution of Profits and the Dividend Distributions for the Fiscal Year
Ended March 31, 2014 and the Fiscal Year Ending March 31, 2015 ......................................................... 4
(4) Risks Related to Business .......................................................................................................................... 4
2. Corporate Group ................................................................................................................................................ 8
3. Management Policies ......................................................................................................................................... 9
(1) Basic Management Policies ....................................................................................................................... 9
(2) The Company’s Mid- to Long-term Management Strategy, Management Targets and Issues to Be
Addressed ................................................................................................................................................... 9
4. Consolidated Financial Statements .................................................................................................................. 10
(1) Consolidated Balance Sheets ................................................................................................................... 10
(2) Consolidated Statements of Income and Comprehensive Income ........................................................... 12
(Consolidated Statements of Income) .................................................................................................... 12
(Consolidated Statements of Comprehensive Income) .......................................................................... 14
(3) Consolidated Statements of Changes in Equity ....................................................................................... 15
(4) Consolidated Statements of Cash Flows .................................................................................................. 17
(5) Notes to Consolidated Financial Statements ............................................................................................ 19
(Notes Relating to Going Concern Assumption) ..................................................................................... 19
(Significant Matters for the Basis of Preparation of Consolidated Financial Statements) ....................... 19
(Changes in Accounting Policies, etc.) .................................................................................................... 21
(Changes in Presentation) ........................................................................................................................ 22
(Consolidated Balance Sheets) ................................................................................................................ 24
(Consolidated Statements of Income) ...................................................................................................... 24
(Consolidated Statements of Comprehensive Income) ............................................................................ 24
(Consolidated Statements of Changes in Equity) ..................................................................................... 25
(Consolidated Statements of Cash Flows) ............................................................................................... 27
(Securities) ............................................................................................................................................... 28
(Retirement Benefits) ............................................................................................................................... 30
(Tax Effect Accounting) ........................................................................................................................... 34
(Business Combinations) ......................................................................................................................... 36
(Segment Information) ............................................................................................................................. 38
(Per Share Information) ........................................................................................................................... 43
(Significant Subsequent Event) ................................................................................................................ 43
5. Non-consolidated Financial Statements ........................................................................................................... 44
(1) Non-consolidated Balance Sheets ............................................................................................................ 44
(2) Non-consolidated Statements of Income ................................................................................................. 48
(3) Non-consolidated Statements of Changes in Equity ................................................................................ 50
(4) Notes to Non-consolidated Financial Statements ..................................................................................... 52
(Notes Relating to Going Concern Assumption) ..................................................................................... 52
6. Others ............................................................................................................................................................... 52
(1) Change in Officers ................................................................................................................................... 52
(2) Others ....................................................................................................................................................... 52
<Reference Material> Supplementary Materials ................................................................................................. 53
2
1. Analysis of Operating Results and Financial Position (1) Analysis of Operating Results
1) Results of operations for the fiscal year under review (April 1, 2013 to March 31, 2014) During the fiscal year under review, in the global economy, there were signs of economic recovery in the United States due to falling unemployment rate, increased consumer spending and other factors, while the economies in Europe and emerging countries were also recovering gradually. The Japanese economy too was gradually moving toward a recovery supported by increases in consumer spending and production, and the better employment conditions.
In this business environment, the OKI group recorded net sales of ¥483.1 billion (a year-on-year increase of 6.0% or ¥27.3 billion), owing to steady business performance in the major segments led by Info-telecom Systems and the effects of yen depreciation. Operating income was ¥27.2 billion (a year-on-year increase of ¥13.7 billion), due to a reduction in fixed costs arising from the structural reforms in the Printers business, the effects from improvement in the product mix, and the effects of yen depreciation.
Ordinary income came to ¥36.7 billion (a year-on-year increase of ¥16.4 billion), due to factors including foreign exchange gains. Also, net income increased by ¥13.8 billion year on year to ¥27.4 billion, due to factors including recording of business restructuring expenses in the Printers business, etc.
The results by business were as follows. <Info-telecom Systems> Net sales to external customers came to ¥303.6 billion (a year-on-year increase of 3.6% or ¥10.6 billion). In Solutions & Services, the sales decreased due to a decrease in the number of large-scale projects in services, despite an increase in solutions related to financial systems. Telecom Systems increased its sales as the core network steadily grew in addition to the enterprises network as well as maintenance and construction work. In Social Infrastructure Systems, the sales increased as the demand for digitalization of wireless communication systems for firefighting and emergency use and demand related to disaster prevention were steady. In Mechatronics Systems, sales increased due to robust domestic sales of ATMs for convenience stores, cash handling equipment and bank branch terminals for financial institutions, as well as mostly strong sales of ATMs in China, despite the shipment to one of the customers postponed to the next period. Positive impact from yen depreciation was ¥8.1 billion.
Operating income came to ¥23.4 billion (a year-on-year decrease of ¥0.4 billion) partially due to falling prices and an increase in expenses.
<Printers> Net sales to external customers amounted to ¥124.8 billion (a year-on-year increase of 12.1% or ¥13.4 billion). By product, sales of LED printers in office printer fields increased as their product lineup was enhanced due to a shift to high value-added models progressed after the revisions in sales strategies in addition to sales of new products geared toward the copier and professional fields were also strong. As to dot-impact printers, the shrinking trend in the market as a whole continued. Positive impact from yen depreciation was ¥17.0 billion.
Operating income largely improved to ¥5.1 billion (a year-on-year increase of ¥13.9 billion) mainly due to reduced fixed costs resulting from business structural reforms and other measures and improved product lineup.
<EMS, Others> Net sales in EMS to external customers came to ¥37.1 billion (a year-on-year increase of 13.6% or ¥4.4 billion). Net sales in Others amounted to ¥17.6 billion (a year-on-year decrease of 6.3% or ¥1.1 billion). In EMS, overall sales increased owing to the effect of consolidation of OKI Circuit Technology Co., Ltd.* in addition to strong sales in the telecom equipment market. In Others, although components-related business was steady, sales in amusement market declined, leading to a decrease in income.
Operating income in EMS increased by ¥0.1 billion year on year to ¥1.7 billion, and operating income in Others decreased by ¥0.2 billion year on year to ¥2.8 billion. * The company changed its corporate name to OKI Circuit Technology Co., Ltd. as of April 1, 2014.
(former name: OKI TANAKA Circuits Co., Ltd.)
2) Outlook for the fiscal year ending March 31, 2015 In the fiscal year ending March 31, 2015, although the global economy is on a recovery trend overall, concerns over the prolonged fiscal problem in Europe, the geopolitical risks, and the effects of the U.S. tapering monetary easing persisted. The Japanese economy is expected to continue its gradual recovery

3
as a whole, despite a partial negative effect of the last minute surge in demand prior to consumption tax increase.
In the fiscal year ending March 31, 2015, the first year of the “Mid-term Business Plan 2016,” the OKI Group will shift to “growth” mode, to ensure stable profits for base businesses while accelerating activities to achieve sustainable growth. In the Info-telecom Systems business, the OKI Group will capture steady domestic demand and focus on expanding profits in ATM business in China, which has entered into a stable growth period. In the Printers business, the Group will ensure stable profits by improving profitability through enhancing marketing strategies. In addition, the Group will accelerate global expansion by starting an ATM business in Brazil as well as expanding ATM sales in other regions. Furthermore, the OKI Group will start full-scale activities to enter the next-generation social infrastructure fields for our sustainable growth and explore the business fields including medical and new energy in the maintenance and EMS businesses. Based on these measures, we forecast a ¥41.9 billion year-on-year increase in net sales to ¥525.0 billion.
Operating income is expected to increase by ¥1.3 billion year on year to ¥28.5 billion by ensuring stable profits for base businesses. Net income is expected to decrease by ¥9.9 billion year on year to ¥17.5 billion due to no expectations for the effects of yen depreciation outside the sales, while the elimination of business restructuring expenses in the Printers business, etc. recorded in the previous fiscal year.
The exchange rates used in the consolidated results projection are ¥100.0 to the U.S. dollar and ¥135.0 to the euro.
For details, please refer to “Financial Results for the Fiscal Year ended March 31, 2014” disclosed today.
(Warning on forward-looking statements) The forward-looking statements such as outlook for the financial results contained in this document are based on information currently available to the Company and certain assumptions that the Company deems to be reasonable, and actual results may differ from such statements due to a variety of factors. Major factors that may affect actual results include market trends, a sharp rise in raw material prices, abrupt currency fluctuations and disasters. It should be noted, however, that factors that may affect actual results are not limited to these items.
(2) Analysis of Financial Position
1) Analysis of assets, liabilities, net assets and cash flows At the end of the fiscal year under review, total assets increased by ¥63.2 billion year on year to ¥412.5 billion. Meanwhile, shareholders’ equity increased by ¥32.6 billion year on year to ¥88.7 billion due to the recording of net income of ¥27.4 billion and other factors. As a result, shareholders’ equity ratio stood at 21.5%.
With respect to major increases and decreases in assets, there were increases of ¥17.0 billion in cash and deposits, of ¥9.5 billion in notes and accounts receivable-trade, of ¥10.3 billion in inventories, and of ¥27.5 billion in asset for retirement benefits.
Total liabilities increased by ¥27.9 billion. Loans decreased by ¥1.5 billion from ¥120.5 billion at the end of the previous fiscal year to ¥119.0 billion while notes and accounts payable-trade increased by ¥9.9 billion and deferred tax liabilities increased by ¥16.4 billion.
Net cash provided by operating activities amounted to ¥31.9 billion (net cash used in operating activities of ¥11.6 billion in the previous fiscal year), due mainly to improvements in income before income taxes and minority interests and working capital.
Net cash used in investing activities amounted to ¥14.0 billion (¥9.2 billion for the previous fiscal year), due mainly to purchase of property, plant and equipment.
As a result, free cash flows, which are the sum of cash flows from operating activities and investing activities, saw a net inflow of ¥17.9 billion (a net outflow of ¥20.8 billion for the previous fiscal year).
Net cash used in financing activities amounted to ¥4.3 billion (¥21.1 billion in the previous fiscal year), due mainly to distribution of preferred dividends and repayment of loans payable.
As a result, cash and cash equivalents at the end of the fiscal year under review increased from ¥35.9 billion at the end of the previous fiscal year to ¥50.9 billion.

4
2) Cash flow-related indicators As of
March 31,2010
As of March 31,
2011
As of March 31,
2012
As of March 31,
2013
As of March 31,
2014
Shareholders’ equity ratio (%) 10.7 10.4 11.2 16.1 21.5
Shareholders’ equity ratio on a market value basis (%)
14.1 13.1 24.8 24.4 39.0
Ratio of interest-bearing debt to cash flows
6.3 6.1 5.2 7.6 6.6
Interest coverage ratio 4.6 4.4 5.1 3.6 5.0
(Notes) 1. Formulas · Shareholders’ equity ratio: Shareholders’ equity/Total assets · Shareholders’ equity ratio on a market value basis: Total market value of stock/Total assets · Ratio of interest-bearing debt to cash flows: Interest-bearing debt/Cash flows from
operating activities · Interest coverage ratio: Cash flows from operating activities/Interest expenses
2. Basis of figures used in calculation · Total market value of stock: Number of shares issued excluding treasury shares · Cash flows from operating activities: “Cash flows from operating activities” in the
consolidated statements of cash flows (average of past 5 years) · Interest expenses: “Interest expenses paid” in the consolidated statements of cash flows
(average of past 5 years) · Interest-bearing debt: All debt bearing interest recorded in the consolidated balance sheets
(3) Basic Policy Concerning the Distribution of Profits and the Dividend Distributions for the Fiscal Year
Ended March 31, 2014 and the Fiscal Year Ending March 31, 2015 The Company recognizes at all times that strengthening its financial structure and securing internal reserves for enhancing the OKI Group’s corporate value, as well as striving to increase returns to shareholders who will hold shares over the medium to long term, are management’s highest priorities.
Regarding the use of internal reserves, the Company will make investments in research and development and equipment required for future growth with a view to strengthening the corporate structure and management bases. Furthermore, in determining the dividend amounts, the Company will place the most focus on the continuation of a stable return of profits to shareholders and also take financial results into account.
Based on this policy, the Company will distribute dividends of surplus (a year-end dividend) at ¥3.00 per share for the fiscal year under review.
As for dividends of surplus for the next fiscal year, the Company plans to pay an annual dividend of ¥4.00 per share, comprising an interim dividend of ¥2.00 per share and a year-end dividend of ¥2.00 per share.
(4) Risks Related to Business
The forward-looking statements such as the OKI Group’s outlook for the financial results contained in this document are based on information currently available to the Company and certain assumptions that the Company deems to be reasonable, and actual results may differ materially from such statements due to a variety of factors. The following are major factors that may affect the OKI Group’s actual financial results.
It should be noted, however, that factors that may affect the OKI Group’s financial results are not limited to these items. The OKI Group is aware of the potential impact these risks may have if any were to occur, and it is implementing measures to avoid such occurrence, as well as to minimize the weight of their impact should they occur.
1) Political and economic trends
Demand for the OKI Group’s products is subject to political and economic trends in the individual countries and regions in which they are sold. Accordingly, economic slowdowns, the resulting contraction of demand in the OKI Group’s principal operating markets including Japan, North America, Europe, Asia and South America and changes in the import-export policy for foreign products may adversely affect the OKI Group’s financial results and position.
5
2) Sudden technological innovation The OKI Group’s principal business segments, Info-telecom Systems and Printers, are subject to rapid technological innovations. Accordingly, the OKI Group strives to preserve its competitive advantage through new technology and new product development. However, the OKI Group’s financial results and position may be adversely affected in the event it is unable to keep pace with sudden technological innovations, burdened with obsolete technologies that the OKI Group is currently holding, and unable to deliver products and services that appeal to customers.
3) Market trends
(i) The product and geographical markets in which the OKI Group is operating are subject to persistently severe competition due to such factors as entry by new participants. In an effort to secure competitive advantages, the OKI Group strives to develop new products and reduce costs. However, the OKI Group’s financial results and position may be adversely affected in the event that the OKI Group is unable to implement effective measures for product development and cost rationalization and fails to maintain market share or secure profitability sufficiently.
(ii) The financial results of Info-telecom Systems may be adversely affected by a variety of factors including: 1) changes in investment trends by financial institutions due to revisions of financial regulations, poor performance and other factors; 2) changes in investment trends by telecom carriers owing to amendments to telecom regulations, shifts in business strategy and other factors; and 3) a significant decline in public-sector investment due to national and local government policies.
(iii) The printer market, in which the OKI Group is operating, is experiencing intense price competition, particularly in color printers. In an effort to secure a strong market position and profitability, the OKI Group is endeavoring to develop new products and reduce costs. Despite these efforts, continued declines in product prices below levels anticipated may adversely affect the financial results of Printers.
4) Raw materials and component procurement
The OKI Group procures a variety of raw materials and components in support of its production activities. The ability to ensure timely product shipment, avoid delays in product delivery, and minimize opportunity loss is dependent upon a stable supply of raw materials, components, specialized parts and alternative components. The OKI Group’s financial results and position may be adversely affected in the event of disruptions to that stable supply from natural disasters and other factors.
The OKI Group is reliant upon the direct or indirect supply of crude oil and raw materials such as metals for its production activities. A sharp rise in the prices of such raw materials may adversely affect the OKI Group’s financial results and position.
5) Product defects and delays in delivery
Despite every effort to maintain quality assurance, the OKI Group is unable to eliminate entirely the possibility of product or service defects. In the event of such defects, the OKI Group may be liable for damage incurred by the customers. In addition, any incidence of a defect may impact the OKI Group’s reputation, resulting in a drop in demand for the OKI Group’s products and services. In either case, the OKI Group’s financial results and position may be adversely affected.
While the OKI Group adopts complete and thorough measures to ensure the timely delivery of its products and services, unforeseen incidents in material procurement, production control and design may lead to a delay in delivery. In this case, the OKI Group may become liable for damage incurred by the customers due to delivery delays.
6) Success or failure of strategic alliances
The OKI Group is constructively engaged with other companies in strategic alliances for research and development, manufacturing, sales and other activities. However, there may be instances where the OKI Group is not able to maintain desired cooperation with a strategic partner in business strategy, product and technical development, fund procurement or other activities, or where the alliance does not yield satisfactory results. In such cases, the OKI Group’s financial results and position may be adversely affected.
7) Overseas business activities
The OKI Group is engaged in production and sales activities across a variety of countries and regions. Accordingly, it is subject to a number of risks specific to overseas business activities, including country risk and foreign exchange fluctuation risk.
The OKI Group has production sites in Thailand, China and Brazil. The OKI Group’s financial results

6
and position may be adversely affected by the occurrence of unforeseen events such as economic downturns, political turmoil and fluctuations in local currency exchange rates in these countries.
To minimize foreign exchange fluctuation risk, the OKI Group enters into forward exchange and currency swap contracts to address fluctuations of the yen against the U.S. dollar and euro. However, the OKI Group cannot guarantee the complete removal of risks, and abrupt fluctuations in foreign exchange rates in particular may adversely affect the OKI Group’s financial results and position.
8) Patents and intellectual property
The OKI Group strives to protect its patents and to secure new patents with the aim of differentiating the OKI Group from its competitors. A failure in these objectives may adversely affect the business performance of relevant businesses. The OKI Group also strives to secure the necessary licenses from third parties for the use of their patents required in the development and production of products. There may be possibilities that the OKI Group is unable to secure necessary licenses in the future, or is authorized to use patents or rights under unfavorable terms and conditions. In either case, the OKI Group’s financial results and position may be adversely affected.
The OKI Group endeavors to heed intellectual properties held by third parties. It is not, however, in a position to completely guarantee that the OKI Group will not be accused of violation of intellectual property rights held by third parties. The OKI Group’s financial results and position may be adversely affected in the event that a suit is instituted against the OKI Group and its lawsuit costs increase as a result, or in the event that the OKI Group is found to have breached such intellectual property rights and incurs damages.
9) Statutory and regulatory compliance
The OKI Group is subject to a variety of government regulations, including business and investment approvals, export restrictions relating to national security and other factors, and other import and export regulations such as customs, in each of the countries and regions in which it is operating. The OKI Group is also subject to laws and regulations relating to commerce, antitrust, patents, taxation, foreign currency controls, the environment and recycling. In the event that the OKI Group is unable to comply with any of the aforementioned laws and regulations, or any unexpected changes occur, the possibility is that its activities would be restricted or suspended. Accordingly, such laws and regulations may adversely affect the OKI Group’s financial results and position.
10) Natural and other disasters
The OKI Group conducts periodic inspection of facilities and periodic checking of accident and disaster prevention measures to minimize stoppages of its manufacturing lines. However, there is no guarantee that the OKI Group will be able to completely prevent accidents at its production facilities and the adverse impact of natural and other disasters. Moreover, the impact of the disruption of manufacturing lines due from such factors as earthquakes, wind or flood damage or electric outages, as well as the significant impact of various disasters on economic activities in the countries where the OKI Group is conducting sales activities, may adversely affect the OKI Group’s financial results and position.
11) Information management
Although the OKI Group implements defense measures to protect its internal systems against computer viruses and to prevent information leakage, the OKI Group cannot guarantee complete protection from system failure and information leakage caused by human error, new viruses, etc. The OKI Group may incur additional losses if such events occur.
12) Securing and fostering human resources
The ability to secure and foster high-performance human resources is a key factor in ensuring further growth as a company capable of generating stable profits. Accordingly, the OKI Group strives to recruit capable employees at every level, including new graduates and mid-career employees. In an effort to foster high-performance human resources, the OKI Group also conducts on-the-job training, education and a variety of supporting activities. In the event that the OKI Group is unable to secure and foster high-performance human resources, or a number of key employees leave the OKI Group, the OKI Group’s future growth may be adversely affected.
13) Interest-rate fluctuations
The OKI Group maintains interest-bearing debt that is subject to the impact of fluctuations in interest rates. The OKI Group utilizes interest-rate swaps and other instruments to manage the risks of the impact. However, a rise in interest rates may lead to an increase in interest charges and may adversely

7
affect the OKI Group’s ability to raise working capital due to increased costs of raising capital in the future.
14) Changes to accounting standards
The OKI Group prepares consolidated and non-consolidated financial statements in accordance with corporate accounting standards generally accepted as fair and valid. In the event that the OKI Group changes its accounting policy in association with the establishment or revision of accounting standards, etc., the OKI Group’s financial results and position may be adversely affected.
15) Debt recovery
The OKI Group constantly appraises the financial conditions of its customers and estimates and provides an appropriate amount of allowances for bad debts that are expected to accrue after the balance sheet date. However, a sudden deterioration of the financial condition of a customer may adversely affect the OKI Group’s financial results and position.
16) Impairment loss on noncurrent assets
In the event that it becomes necessary for the OKI Group to recognize impairment loss on property, plant and equipment, intangible assets, investments and other assets, the OKI Group’s financial results and position may be adversely affected.
17) Deferred tax assets
The OKI Group provides appropriate amounts of retained losses carried forward and other temporary differences for deferred tax assets. In the event that the OKI Group derecognizes deferred tax assets as it is unable to eliminate such retained losses carried forward and other temporary differences due to the decline in taxable income brought on by future changes in its financial results, the OKI Group’s financial results and position may be adversely affected.
18) Retirement benefit obligations
The OKI Group provides appropriate amounts of retirement benefit obligations based on assumptions and preconditions such as a discount rate established using actuarial calculations and on expected rate of return on pension assets. However, such assumptions and preconditions are susceptible to changes in market interest rates and stock market trends, which may cause actual results to differ from such provision and may lead to an increase in retirement benefit obligations. In such a case, the OKI Group’s financial results and position may be adversely affected.
19) Stock price fluctuations
The OKI Group holds shares of stocks in listed companies as part of its investment securities portfolio. A fall in stock prices may lead to valuation loss and/or a decrease in valuation difference, which may adversely affect the OKI Group’s financial results and position.
20) Dilution of stocks
The OKI Group issued Class A preferred stock through allocation to third parties on December 22, 2010, with the aim of building a strong business base capable of generating stable sustained profits, and of drastically improving its financial base. Class A preferred stock is issued with a put option in exchange for common stock (put option period: April 1, 2014 through March 31, 2024) and a put provision (lump purchase on April 1, 2024). In the event that common stock is issued as a result of the exercise of the put option and put provision in exchange for the common stock in the future, the outstanding shares of common stock will be diluted, which may affect the stock price.

8
2. Corporate Group In the OKI Group, the general business relationships between OKI (the parent company) and its affiliates are as shown below.
(Others)
(EMS)
(Info-telecom Systems)
- OKI Wintech - OKI Customer Adtech - OKI Software - Japan Business Operations
and others
<Manufacturing and sales companies>
<Design, development, software and service companies>
<Sales companies>- OKI Electric Industry (Shenzhen) - OKI Brasil
and others - OKI Banking Systems (Shenzhen) and others
Cu
stomer
- OKI Data
- OKI Digital Imaging - OKI Data Manufacturing (Thailand) - OKI Electric Industry (Shenzhen)
and others
- OKI Data Dalian and others
- OKI Data Americas - OKI Europe - OKI Trading (Beijing)
and others
<Design, development, software and service companies>
<Sales companies>
<Manufacturing and sales companies>
(Printers)
- Nagano OKI - OKI Printed Circuits - OKI Communication Systems
and others
- OKI Sensor Device - OKI Proserve
and others
OK
I

9
3. Management Policies (1) Basic Management Policies
Founded in 1881, Meikosha, Ltd. was the forerunner of today’s OKI and Japan’s first communications equipment manufacturer. Only five years after Alexander Graham Bell invented the first telephone in the United States, Meikosha made an early attempt to domestically manufacture telephones and was successful. This “enterprising spirit” has been passed down and remains in the DNA that runs through the history of the OKI Group. With OKI’s corporate philosophy* revolving around this enterprising spirit, the OKI Group adopts the basic policy of meeting the expectations of all its stakeholders, including customers, shareholders and employees, by aiming to become a company that generates stable profits and attains steady growth. * “The people of OKI, true to the Company’s enterprising spirit, are committed to creating superior
network solutions and providing outstanding information and communications services globally to meet the diversified needs of communities worldwide in the information age.”
(2) The Company’s Mid- to Long-term Management Strategy, Management Targets and Issues to Be
Addressed The OKI Group announced “Mid-term Business Plan 2016” in November 2013, with a goal “to become a high value-added creation business group, contributing to the realization of safety and comfort of society.” Under this plan, we have set our corporate policy to attain sustainable growth through continued investment by securing stable profits. The business targets for the fiscal year ending March 31, 2017, the last fiscal year of the plan, are net sales of ¥560.0 billion, operating income of ¥34.0 billion, operating profit margin of 6%, shareholders’ equity ratio of more than 30%, debt to equity ratio of less than 1 time, and overseas sales ratio of 40%. To ensure stable profits, in addition to securing renewing demand in financial, social and telecom systems, we will continue to firmly capture opportunities in the Chinese ATM market. Furthermore, we will generate profits stably from the effects of the structural reforms in the Printers business conducted in fiscal year ended March 31, 2014, and optimization of each business segment. To achieve sustainable growth, we will put forward “business expansion in the global market,” “support for customers’ ‘asset-free management’” and “entering the fields of next-generation social infrastructure” as the three pillars to implement future measures. In addition to the expansion through exploring new ATM markets in Brazil and other regions and expanding the deployment of cash handling equipment and maintenance service, we will advance global deployment of high value-added printers for the copier and professional markets. Furthermore, we will support customers’ “asset-free management” through enhancement of cloud computing services and LCM services. Ultimately, we will enter the fields of next-generation social infrastructure by leveraging our strength in sensing and network technologies to address measures for prevention and mitigation of disasters, and aging social infrastructure. Other measures to achieve the targets of the fiscal year ending March 31, 2017 include manufacturing and engineering reformation, reduction in procurement costs, activities to reduce working capital and strengthening research and development, as well as enhancing human resources by transferring personnel to growing segments, recruiting global human resources, promoting career opportunities for female employees.

10
4. Consolidated Financial Statements (1) Consolidated Balance Sheets
(Million yen)
Fiscal year ended March 31, 2013
(As of March 31, 2013)
Fiscal year ended March 31, 2014
(As of March 31, 2014)
Assets
Current assets
Cash and deposits 29,904 46,901
Notes and accounts receivable–trade 123,886 133,383
Securities 6,502 4,000
Finished goods 31,215 34,203
Work in process 18,856 22,652
Raw materials and supplies 24,890 28,429
Deferred tax assets 6,634 6,503
Other 12,704 11,133
Allowance for doubtful accounts (7,600) (8,684)
Total current assets 246,994 278,522
Non-current assets
Property, plant and equipment
Buildings and structures, net 23,595 22,471
Machinery, equipment and vehicles, net 11,170 10,808
Tools, furniture and fixtures, net 9,090 10,110
Land 12,343 12,201
Construction in progress 1,629 601
Total property, plant and equipment * 57,829 * 56,193
Intangible assets 7,655 9,600
Investments and other assets
Investment securities 28,570 32,634
Asset for retirement benefits — 27,507
Other 9,209 8,882
Allowance for doubtful accounts (936) (828)
Total investments and other assets 36,843 68,196
Total non-current assets 102,328 133,991
Total assets 349,322 412,514
Liabilities
Current liabilities
Notes and accounts payable–trade 63,416 73,312
Short-term loans payable 75,192 104,478
Accrued expenses 31,666 34,956
Other 26,855 29,525
Total current liabilities 197,129 242,272

11
(Million yen)
Fiscal year ended March 31, 2013
(As of March 31, 2013)
Fiscal year ended March 31, 2014
(As of March 31, 2014)
Non-current liabilities
Long-term loans payable 45,332 14,526
Lease obligations 3,626 4,912
Deferred tax liabilities 1,942 18,307
Provision for retirement benefits 19,823 —
Provision for directors’ retirement benefits 386 368
Liability for retirement benefits — 20,225
Other 24,456 19,982
Total non-current liabilities 95,567 78,322
Total liabilities 292,697 320,595
Net assets
Shareholders’ equity
Capital stock 44,000 44,000
Capital surplus 21,554 21,554
Retained earnings (7,788) 18,382
Treasury shares (399) (432)
Total shareholders’ equity 57,366 83,504
Accumulated other comprehensive income
Valuation difference on available-for-sale securities 2,192 4,333
Deferred gains or losses on hedges (656) (389)
Foreign currency translation adjustment (2,829) (10,358)
Retirement benefits liability adjustments — 11,644
Total accumulated other comprehensive income (1,293) 5,230
Subscription rights to shares 79 79
Minority interests 473 3,104
Total net assets 56,625 91,918
Total liabilities and net assets 349,322 412,514

12
(2) Consolidated Statements of Income and Comprehensive Income (Consolidated Statements of Income)
(Million yen)
Fiscal year ended March 31, 2013
(From April 1, 2012 to March 31, 2013)
Fiscal year ended March 31, 2014
(From April 1, 2013 to March 31, 2014)
Net sales 455,824 483,112
Cost of sales *2 337,406 *2 354,635
Gross profit 118,417 128,477
Selling, general and administrative expenses *1, *2 104,942 *1, *2 101,281
Operating income 13,475 27,196
Non-operating income
Interest income 161 103
Dividend income 489 796
Equity in earnings of affiliates 84 339
Foreign exchange gains 8,792 11,277
Miscellaneous income 1,293 1,350
Total non-operating income 10,822 13,867
Non-operating expenses
Interest expenses 3,003 2,522
Taxes and dues 86 448
Commission for syndicate loan 239 446
Miscellaneous expenses 664 991
Total non-operating expenses 3,993 4,409
Ordinary income 20,304 36,655
Extraordinary income
Gain on sales of non-current assets 2,783 —
Gain on sales of investment securities 678 553
Gain on bargain purchase — 102
Insurance income — 322
Gain on transfer of business — 123
Total extraordinary income 3,461 1,102

13
(Million yen)
Fiscal year ended March 31, 2013
(From April 1, 2012 to March 31, 2013)
Fiscal year ended March 31, 2014
(From April 1, 2013 to March 31, 2014)
Extraordinary losses
Loss on disposal of non-current assets 674 659
Impairment loss 219 184
Loss on valuation of investment securities 225 —
Business restructuring expenses — *3 4,311
Loss on liquidation of subsidiaries 4,011 *4 841
Total extraordinary losses 5,131 5,995
Income before income taxes and minority interests 18,634 31,761
Income taxes–current 4,106 3,820
Income taxes–deferred 656 394
Total income taxes 4,762 4,214
Income before minority interests 13,872 27,546
Minority interests in income 273 187
Net income 13,599 27,359

14
(Consolidated Statements of Comprehensive Income) (Million yen)
Fiscal year ended March 31, 2013
(From April 1, 2012 to March 31, 2013)
Fiscal year ended March 31, 2014
(From April 1, 2013 to March 31, 2014)
Income before minority interests 13,872 27,546
Other comprehensive income
Valuation difference on available-for-sale securities 3,993 2,099
Deferred gains or losses on hedges 317 266
Foreign currency translation adjustment (2,157) (7,511)
Share of other comprehensive income of entities accounted for using equity method
15 40
Total other comprehensive income * 2,167 * (5,104)
Comprehensive income 16,040 22,442
Comprehensive income attributable to
Comprehensive income attributable to owners of parent 15,734 22,237
Comprehensive income attributable to minority interests 305 205

15
(3) Consolidated Statements of Changes in Equity Fiscal year ended March 31, 2013 (From April 1, 2012 to March 31, 2013)
(Million yen) Shareholders’ equity
Capital stock
Capital surplus
Retained earnings
Treasury shares
Total shareholders’
equity Balance at beginning of current period
44,000 21,554 (20,968) (38) 44,547
Changes of items during period
Cash dividends paid (1,321) (1,321)Net income 13,599 13,599 Purchase of treasury shares
(361) (361)
Increase due to the merger
—
Change of scope of consolidation
902 902
Net changes of items other than shareholders’ equity
Total changes of items during period
— — 13,179 (361) 12,818
Balance at end of current period
44,000 21,554 (7,788) (399) 57,366
(Million yen)
Accumulated other comprehensive income
Subscription rights to shares
Minority interests
Total net assets
Valuation difference
on available-for-sale
securities
Deferred gains or losses on hedges
Foreign currency
translation adjustment
Retirement benefits liability
adjustments
Total accumu-
lated other comprehensive income
Balance at beginning of current period
(1,815) (973) (632) — (3,422) 79 46 41,251
Changes of items during period
Cash dividends paid
(1,321)
Net income 13,599 Purchase of treasury shares
(361)
Increase due to the merger
—
Change of scope of consolidation
902
Net changes of items other than shareholders’ equity
4,008 317 (2,196) — 2,128 — 426 2,554
Total changes of items during period
4,008 317 (2,196) — 2,128 — 426 15,373
Balance at end of current period
2,192 (656) (2,829) — (1,293) 79 473 56,625

16
Fiscal year ended March 31, 2014 (From April 1, 2013 to March 31, 2014) (Million yen)
Shareholders’ equity
Capital stock
Capital surplus
Retained earnings
Treasury shares
Total shareholders’
equity Balance at beginning of current period
44,000 21,554 (7,788) (399) 57,366
Changes of items during period
Cash dividends paid (1,032) (1,032)Net income 27,359 27,359 Purchase of treasury shares
(32) (32)
Increase due to the merger
157 157
Change of scope of consolidation
(313) (313)
Net changes of items other than shareholders’ equity
Total changes of items during period
— — 26,171 (32) 26,138
Balance at end of current period
44,000 21,554 18,382 (432) 83,504
(Million yen)
Accumulated other comprehensive income
Subscription rights to shares
Minority interests
Total net assets
Valuation difference
on available-for-sale
securities
Deferred gains or losses on hedges
Foreign currency
translation adjustment
Retirement benefits liability
adjustments
Total accumu-
lated other comprehensive income
Balance at beginning of current period
2,192 (656) (2,829) — (1,293) 79 473 56,625
Changes of items during period
Cash dividends paid
(1,032)
Net income 27,359 Purchase of treasury shares
(32)
Increase due to the merger
157
Change of scope of consolidation
(313)
Net changes of items other than shareholders’ equity
2,140 266 (7,528) 11,644 6,523 — 2,631 9,155
Total changes of items during period
2,140 266 (7,528) 11,644 6,523 — 2,631 35,293
Balance at end of current period
4,333 (389) (10,358) 11,644 5,230 79 3,104 91,918

17
(4) Consolidated Statements of Cash Flows (Million yen)
Fiscal year ended March 31, 2013
(From April 1, 2012 to March 31, 2013)
Fiscal year ended March 31, 2014
(From April 1, 2013 to March 31, 2014)
Cash flows from operating activities
Income before income taxes and minority interests 18,634 31,761
Depreciation 13,021 14,249
Impairment loss 219 184
Increase (decrease) in provision (5,040) (20,352)
Interest and dividend income (651) (900)
Interest expenses 3,003 2,522
Loss (gain) on sales of investment securities (672) (553)
Loss (gain) on disposal of non-current assets (2,109) 634
Decrease (increase) in notes and accounts receivable–trade 3,487 5,009
Decrease (increase) in inventories (1,307) (371)
Increase (decrease) in notes and accounts payable–trade (17,963) (3,075)
Increase (decrease) in accrued expenses (121) 586
Other (17,040) 3,639
Subtotal (6,540) 33,333
Interest and dividend income received 653 900
Interest expenses paid (3,040) (2,546)
Proceeds from insurance income 2,934 1,576
Income taxes paid (5,626) (1,396)
Net cash provided by (used in) operating activities (11,619) 31,868
Cash flows from investing activities
Purchase of securities (3,505) —
Proceeds from redemption of securities 4,000 500
Purchase of property, plant and equipment (11,881) (7,771)
Purchase of intangible assets (2,977) (3,664)
Proceeds from sales of investment securities 4,809 446
Purchases of investment in subsidiaries resulting in charge in scope of consolidation
(1,188) *2 (2,746)
Other payments (3,844) (1,815)
Other proceeds 5,374 1,073
Net cash provided by (used in) investing activities (9,214) (13,977)

18
(Million yen)
Fiscal year ended March 31, 2013
(From April 1, 2012 to March 31, 2013)
Fiscal year ended March 31, 2014
(From April 1, 2013 to March 31, 2014)
Cash flows from financing activities
Net increase (decrease) in short-term loans payable 571 (2,056)
Proceeds from long-term loans payable 4,325 20,440
Repayment of long-term loans payable (22,867) (21,212)
Proceeds from sales and leasebacks 885 1,969
Repayments of lease obligations (2,313) (2,338)
Cash dividends paid (1,321) (1,032)
Other (372) (41)
Net cash provided by (used in) financing activities (21,093) (4,270)
Effect of exchange rate change on cash and cash equivalents 1,368 1,084
Net increase (decrease) in cash and cash equivalents (40,558) 14,703
Cash and cash equivalents at beginning of period 74,996 35,894
Increase in cash and cash equivalents from newly consolidated subsidiary
1,426 32
Increase in cash and cash equivalents resulting from merger with unconsolidated subsidiaries
29 235
Cash and cash equivalents at end of period *1 35,894 *1 50,866
19
(5) Notes to Consolidated Financial Statements (Notes Relating to Going Concern Assumption)
Not applicable (Significant Matters for the Basis of Preparation of Consolidated Financial Statements)
1. Scope of consolidation Of 99 subsidiaries, 90 companies are consolidated subsidiaries. As for OKI INDIA PRIVATE LIMITED and 8 other subsidiaries, their total assets, retained earnings, net sales or net income and loss are small and immaterial on an individual and overall basis; thus, they are not included in the scope of consolidation.
The following companies are included in the scope of consolidation from the current fiscal year: OKI IDS Co., Ltd., which was newly established; OKI JAINET SUPPLY Co.,Ltd., HATSUCOH SUPPORT SERVICE Co.,Ltd., OKI Data Manufacturing and Engineering Service Corporation and OKI BRASIL INDÚSTRIA E COMÉRCIO DE PRODUTOS E TECNOLOGIA EM AUTOMAÇÃO S.A., which became new subsidiaries due to a new acquisition of stock; Takasaki Seimitsu Kogyosya Co., Ltd., which became a new subsidiary due to an additional acquisition of stock; and TOHO DENSHI Co.,Ltd., of which relative significance among subsidiaries has increased.
OKI SYSTEMS IBERICA, S.A.U. is extinguished from the scope of consolidation due to absorption-type merger with OKI EUROPE LTD., the Company’s consolidated subsidiary. OKI Telecommunications Technology (Changzhou) Co., Ltd. is extinguished from the scope of consolidation due to sales of shareholdings. OKI ELECTRIC AMERICA, INC. is extinguished from the scope of consolidation due to liquidation.
2. Application of the equity method
The equity method is applied to investments in 4 companies of 9 non-consolidated subsidiaries and 6 affiliates.
As for OKI INDIA PRIVATE LIMITED and 8 other non-consolidated subsidiaries as well as Oki Denki Bohsai Co., Ltd. and 1 other affiliate, all of which are not accounted for using the equity method, the effects of their net income or loss and retained earnings are minor, and immaterial overall.
3. Fiscal years, etc. of consolidated subsidiaries
The Company’s consolidated subsidiary, OKI BRASIL INDÚSTRIA E COMÉRCIO DE PRODUTOS E TECNOLOGIA EM AUTOMAÇÃO S.A. closes accounts on December 31, a different date from the consolidated closing date, and financial statements as of the closing date of the company are used. However, significant transactions that occurred between December 31 and the consolidated closing date are adjusted as required for the consolidation purposes.
4. Standards for accounting treatment
(1) Valuation standards and methods for significant assets 1) Securities
The Company and its domestic consolidated subsidiaries evaluate securities according to holding purposes, as follows. Overseas consolidated subsidiaries use the lower of cost or market value method. Held-to-maturity securities:
Amortized cost method Available-for-sale securities:
Securities with market quotations: Market value method based on the quoted market price at the fiscal year-end (Any unrealized gains or losses are reported directly as a component of shareholders’ equity and the cost of securities sold is calculated using the moving-average method.)
Securities without market quotations: Cost method using the moving-average method.
2) Inventories The Company and its domestic consolidated subsidiaries evaluate inventories as follows. Overseas consolidated subsidiaries mainly use the lower of cost or market value method. Finished goods:
Stated at cost mainly using the moving-average method (Amounts on the balance sheets take into account declines in book values based on reduced profitability.)
Work in process: Stated at cost mainly using the specific cost method (Amounts on the balance sheets take into account declines in book values based on reduced profitability.)

20
Raw materials and supplies: Stated at cost mainly using the moving-average method (Amounts on the balance sheets take into account declines in book values based on reduced profitability.)
3) Derivatives Stated at market value
(2) Depreciation methods for significant depreciable assets 1) Property, plant and equipment (excluding lease assets)
The Company and its domestic consolidated subsidiaries mainly use the declining-balance method, and overseas consolidated subsidiaries mainly use the straight-line method.
2) Intangible assets (excluding lease assets) The Company and its domestic consolidated subsidiaries use the straight-line method.
Software for sales in the market is amortized based on the estimated sales volume over the estimated valid sales period (3 years), and software for internal use is amortized using the straight-line method over the estimated available period (5 years).
Overseas consolidated subsidiaries mainly use the straight-line method. 3) Lease assets
Lease assets concerning non-transfer ownership finance lease transactions are depreciated using the straight-line method, defining the lease terms of respective assets as their useful lives, assuming the residual value is zero.
Among lease assets concerning non-transfer ownership finance lease transactions, lease transactions that commenced on or prior to March 31, 2008 are stated using the similar accounting treatment that is applied to regular rental transactions.
(3) Accounting standards for significant allowances and provisions 1) Allowance for doubtful accounts
The Company and its domestic consolidated subsidiaries provide for possible credit losses on notes and accounts receivable–trade and loans receivable. Allowance for ordinary bad debts are computed based on the historical rate of defaults, and the likelihood of recovery is considered on an individual basis for specific debts where recovery is doubtful. Overseas consolidated subsidiaries provide mainly for specific debts in consideration of the likelihood of recovery.
2) Provision for directors’ retirement benefits Some consolidated subsidiaries provide necessary amounts at the year-end for directors’ retirement benefits, in accordance with the companies’ internal rules.
(4) Accounting methods for retirement benefits 1) Method of attributing expected retirement benefit to periods
In calculation of retirement benefit obligations, the method of attributing the expected retirement benefit to periods before the end of the current fiscal year is on a point basis or straight-line basis.
2) Actuarial gain or loss, past service cost and net retirement benefit obligation at transition Net retirement benefit obligation at transition is amortized evenly over 15 years, excluding consolidated subsidiaries that amortize collectively in the first fiscal year of application and some overseas consolidated subsidiaries that deduct obligations directly from retained earnings.
Past service cost is amortized using the straight-line method over certain years (11 to 13 years) not exceeding the average remaining service years of employees at the time of occurrence.
Actuarial gain or loss is amortized evenly using the straight-line method over certain years (11 to 13 years) not exceeding the average remaining service years of employees at the time of occurrence, from the fiscal year following the year of occurrence.
(5) Accounting standards for significant revenue and expenses Accounting standards for revenue from contract works and software development contracts a) Works/developments with certainty of results recognized in the part in progress by the end of the
current fiscal year Stated using the percentage of completion method (Progress rate for works is estimated using the cost-to-cost method.)
b) Others Stated on an inspection basis (or by the completed-contract method at some domestic consolidated subsidiaries)
(6) Significant hedge accounting method 1) Hedge accounting method
The deferred hedge accounting is used. Allocation treatment is applied to foreign exchange forward

21
contracts and currency swap transactions that meet specific criteria for such treatment. Special treatment is applied to interest rate swap transactions that meet specific criteria for such treatment.
2) Hedging instruments and hedged items Foreign exchange forward contracts and currency swap transactions are used to hedge fluctuations in foreign exchange rates for foreign currency-denominated monetary claims and liabilities. Interest rate swap transactions are used to hedge market interest rate fluctuation risks in future for short-term and long-term loans payable at floating interest rates.
3) Hedging policy Derivatives transactions are used for the purpose of avoiding market fluctuation risks that monetary claims and liabilities are exposed to.
4) Method for evaluating hedging effectiveness From the time of implementation of hedging through the time of assessment of effectiveness, hedged items and hedging instruments, and respective market fluctuations or changes in cash flows are compared and evaluated based on the amount of changes in both.
(7) Amortization of goodwill and amortization period Goodwill is amortized evenly over its effective period (mainly 5 years).
(8) Scope of cash and cash equivalents in the consolidated statements of cash flows Cash and cash equivalents in the consolidated statements of cash flows consist of cash in hand, readily available deposits, and any short-term liquid investments with a maturity not exceeding 3 months at the time of purchase whose value is not subject to significant fluctuation risk.
(9) Other significant matters for the preparation of consolidated financial statements 1) Accounting treatment for consumption taxes, etc.
The tax exclusion method is applied for the accounting treatment for national and local consumption taxes.
2) Application of consolidated taxation system The consolidated taxation system is applied.
(Changes in Accounting Policies, etc.) Effective from the current fiscal year, the “Accounting Standard for Retirement Benefits” (ASBJ Statement No. 26, May 17, 2012; the “Retirement Benefits Accounting Standard”) and the “Guidance on Accounting Standard for Retirement Benefits” (ASBJ Guidance No. 25, May 17, 2012; the “Guidance on Retirement Benefits”) have been applied. (However, provisions stated in the main clause of Paragraph 35 of the Retirement Benefits Accounting Standard and the main clause of Paragraph 67 of the Guidance on Retirement Benefits are excluded.)
Under the new policy, pension assets are deducted from retirement benefit obligations and the resultant amount is stated as liability for retirement benefits. Unrecognized net retirement benefit obligation at transition, unrecognized past service cost and unrecognized net actuarial gain or loss are recognized within liability for retirement benefits. If pension assets are larger than retirement benefit obligations, the excess amount is recognized as asset for retirement benefits.
The Retirement Benefits Accounting Standard is being applied transitionally as determined in its Paragraph 37. As of March 31, 2014, the effect of the changes in accounting policies was added to or deducted from retirement benefits liability adjustments under accumulated other comprehensive income.
As a result, asset for retirement benefits of ¥27,507 million and liability for retirement benefits of ¥20,225 million were recorded as of March 31, 2014. Accumulated other comprehensive income increased by ¥11,644 million.
Net assets per share increased by ¥16.00.

22
(Changes in Presentation) (Consolidated Balance Sheets) “Deferred tax liabilities,” which was included in “Other” under “Non-current liabilities” for the previous fiscal year, is separately stated from the current fiscal year due to its increasing quantitative materiality. To reflect this change in presentation, the consolidated financial statements for the previous fiscal year have been reclassified.
As a result, “Other” of ¥4,534 million stated under “Non-current liabilities” on the consolidated balance sheets for the previous fiscal year has been reclassified into “Deferred tax liabilities” of ¥1,942 million and “Other” of ¥2,592 million. “Long-term accounts payable–other” under “Non-current liabilities,” which was separately stated for the previous fiscal year, is included in “Other” for the current fiscal year due to its decreasing quantitative materiality. To reflect this change in presentation, the consolidated financial statements for the previous fiscal year have been reclassified.
As a result, “Long-term accounts payable–other” of ¥21,864 million stated under “Non-current liabilities” on the consolidated balance sheets for the previous fiscal year has been reclassified into “Other.” (Consolidated Statements of Income) “Equity in earnings of affiliates,” which was included in “Miscellaneous income” under “Non-operating income” for the previous fiscal year, is separately stated from the current fiscal year due to its increasing quantitative materiality. To reflect this change in presentation, the consolidated financial statements for the previous fiscal year have been reclassified.
As a result, “Miscellaneous income” of ¥1,378 million stated under “Non-operating income” on the consolidated statements of income for the previous fiscal year has been reclassified into “Equity in earnings of affiliates” of ¥84 million and “Miscellaneous income” of ¥1,293 million. “Taxes and dues” and “Commission for syndicate loan,” which were included in “Miscellaneous expenses” under “Non-operating expenses” for the previous fiscal year, are separately stated from the current fiscal year due to their increasing quantitative materiality. To reflect this change in presentation, the consolidated financial statements for the previous fiscal year have been reclassified.
As a result, “Miscellaneous expenses” of ¥989 million stated under “Non-operating expenses” on the consolidated statements of income for the previous fiscal year has been reclassified into “Taxes and dues” of ¥86 million, “Commission for syndicate loan” of ¥239 million and “Miscellaneous expenses” of ¥664 million. (Consolidated Statements of Cash Flows) “Loss (gain) on valuation of investment securities” and “Increase (decrease) in long-term accounts payable-other” under “Cash flows from operating activities,” which were separately stated for the previous fiscal year, are included in “Other” for the current fiscal year due to their decreasing quantitative materiality. To reflect this change in presentation, the consolidated financial statements for the previous fiscal year have been reclassified.
As a result, “Loss (gain) on valuation of investment securities” of ¥225 million and “Increase (decrease) in long-term accounts payable–other” of ¥(4,998) million stated under “Cash flows from operating activities” on the consolidated statements of cash flows for the previous fiscal year have been reclassified into “Other.” “Increase (decrease) in accrued expenses,” which was included in “Other” under “Cash flows from operating activities” for the previous fiscal year, is separately stated from the current fiscal year due to its increasing quantitative materiality. To reflect this change in presentation, the consolidated financial statements for the previous fiscal year have been reclassified.
As a result, “Other” of ¥(12,389) million stated under “Cash flows from operating activities” on the consolidated statements of cash flows for the previous fiscal year has been reclassified into “Increase (decrease) in accrued expenses” of ¥(121) million and “Other” of ¥(12,267) million. “Proceeds from sales of property, plant and equipment” and “Purchase of investment securities” under “Cash flows from investing activities,” which were separately stated for the previous fiscal year, are included in “Other proceeds” and “Other payments,” respectively, for the current fiscal year due to their decreasing quantitative materiality. To reflect this change in presentation, the consolidated financial statements for the previous fiscal year have been reclassified.
23
As a result, “Proceeds from sales of property, plant and equipment” of ¥4,053 million and “Purchase of investment securities” of ¥(1,948) million under “Cash flows from investing activities” on the consolidated statements of cash flows for the previous fiscal year have been reclassified into “Other proceeds” and “Other payments,” respectively.

24
(Consolidated Balance Sheets) * Accumulated depreciation of property, plant and equipment
(Million yen) Previous fiscal year
(As of March 31, 2013)Current fiscal year
(As of March 31, 2014) Accumulated depreciation of property, plant and equipment
152,008 151,723
(Consolidated Statements of Income)
*1 The major items and amounts under selling, general and administrative expenses are as follows: (Million yen)
Previous fiscal year (From April 1, 2012 to March 31, 2013)
Current fiscal year (From April 1, 2013 to March 31, 2014)
Salaries and wages 28,815 29,744 Retirement benefit expenses 3,046 2,249 Research and development expenses 13,982 12,959
*2 Research and development expenses included in general and administrative expenses are as follows. Research and development expenses are not included in manufacturing costs.
(Million yen) Previous fiscal year
(From April 1, 2012 to March 31, 2013) Current fiscal year
(From April 1, 2013 to March 31, 2014) 13,982 12,959
*3 Business restructuring expenses Expenses for disposal of assets and personnel cuts resulting from the structural reforms in the Printers business are recorded for the current fiscal year.
*4 Loss on liquidation of subsidiaries Expenses for disposal of assets and personnel cuts related to the winding down of business of subsidiaries are recorded for the current fiscal year.
(Consolidated Statements of Comprehensive Income)
* Reclassification adjustment and tax effect related to other comprehensive income (Million yen)
Previous fiscal year (From April 1, 2012 to March 31, 2013)
Current fiscal year (From April 1, 2013 to March 31, 2014)
Valuation difference on available-for-sale securities: Amount arising during the period 4,934 3,645 Reclassification adjustment 203 (406)
Amount before income tax effect 5,137 3,239 Income tax effect (1,143) (1,139) Valuation difference on available-for-sale securities
3,993 2,099
Deferred gains or losses on hedges: Amount arising during the period 63 (45) Reclassification adjustment 261 286 Cost adjustment of assets — 29
Amount before income tax effect 325 270 Income tax effect (8) (3) Deferred gains or losses on hedges 317 266
Foreign currency translation adjustment: Amount arising during the period (2,157) (7,320) Reclassification adjustment — (190)
Foreign currency translation adjustment (2,157) (7,511) Share of other comprehensive income of entities accounted for using equity method:
Amount arising during the period 15 40 Total other comprehensive income 2,167 (5,104)

25
(Consolidated Statements of Changes in Equity) Previous fiscal year (from April 1, 2012 to March 31, 2013) 1. Type and number of issued shares and treasury shares
Number of sharesat beginning of
current fiscal year(Thousand shares)
Number of shares increased during
current fiscal year(Thousand shares)
Number of shares decreased during current fiscal year (Thousand shares)
Number of sharesat end of current
fiscal year (Thousand shares)
Issued shares Common stock 731,438 — — 731,438Class A preferred stock
30 — — 30
Total 731,468 — — 731,468Treasury shares
Common stock (Note)
612 2,853 — 3,465
Total 612 2,853 — 3,465(Note) The increase in common stock under treasury shares (2,853 thousand shares) includes the
increase of 2,700 thousand shares due to the purchase of shares from dissenting shareholders in accordance with Article 797, Paragraph 1 of the Companies Act, and the increase of 153 thousand shares due to the purchase of fractional shares.
2. Matters related to subscription rights to shares and treasury subscription rights to shares
Classification
Breakdown of subscription
rights to shares
Type of shares
underlying subscription
rights to shares
Number of shares underlying subscription rights to shares (Shares) Outstanding
shares at end of current fiscal year
(Million yen)
At beginningof current fiscal year
Increase during current
fiscal year
Decrease during current
fiscal year
At end of current
fiscal year
The Filing Company (Parent company)
Subscription rights to shares as stock options
— 79
Total — 79
3. Matters related to dividends (1) Dividends paid
(Resolution) Class of stock Total amount of dividends(Million yen)
Dividend resource
Dividendper share
(Yen) Record date Effective date
Ordinary General Meeting of Shareholders held on June 28, 2012
Class A preferred stock
1,321Retained earnings
44,047.00March 31,
2012 June 29,
2012
(2) Dividends whose record date falls in the current fiscal year but whose effective date comes in the
following fiscal year
(Resolution) Class of stock Total amount of dividends(Million yen)
Dividend resource
Dividendper share
(Yen) Record date Effective date
Ordinary General Meeting of Shareholders held on June 26, 2013
Class A preferred
stock 1,032
Retained earnings
34,410.00March 31,
2013 June 27,
2013

26
Current fiscal year (from April 1, 2013 to March 31, 2014) 1. Type and number of issued shares and treasury shares
Number of sharesat beginning of
current fiscal year(Thousand shares)
Number of shares increased during
current fiscal year(Thousand shares)
Number of shares decreased during current fiscal year (Thousand shares)
Number of sharesat end of current
fiscal year (Thousand shares)
Issued shares Common stock 731,438 — — 731,438Class A preferred stock
30 — — 30
Total 731,468 — — 731,468Treasury shares
Common stock (Note)
3,465 148 — 3,614
Total 3,465 148 — 3,614(Note) The increase in common stock under treasury shares (148 thousand shares) is attributed to the
purchase of fractional shares.
2. Matters related to subscription rights to shares and treasury subscription rights to shares
Classification
Breakdown of subscription
rights to shares
Type of shares
underlying subscription
rights to shares
Number of shares underlying subscription rights to shares (Shares) Outstanding
shares at end of current fiscal year
(Million yen)
At beginningof current fiscal year
Increase during current
fiscal year
Decrease during current
fiscal year
At end of current
fiscal year
The Filing Company (Parent company)
Subscription rights to shares as stock options
— 79
Total — 79
3. Matters related to dividends (1) Dividends paid
(Resolution) Class of stock Total amount of dividends(Million yen)
Dividend resource
Dividendper share
(Yen) Record date Effective date
Ordinary General Meeting of Shareholders held on June 26, 2013
Class A preferred stock
1,032Retained earnings
34,410.00March 31,
2013 June 27,
2013
(2) Dividends whose record date falls in the current fiscal year but whose effective date comes in the
following fiscal year
(Matters for deliberation)
Class of stock Total amount of dividends(Million yen)
Dividend resource
Dividendper share
(Yen) Record date Effective date
Ordinary General Meeting of Shareholders held on June 25, 2014
Common stock 2,184Retained earnings
3.00March 31,
2014 June 26,
2014 Class A preferred stock
1,004 33,490.00

27
(Consolidated Statements of Cash Flows) *1 Relationship between the fiscal year-end balance of cash and cash equivalents and the amounts of
consolidated balance sheets items (Million yen)
Previous fiscal year (From April 1, 2012 to March 31, 2013)
Current fiscal year (From April 1, 2013 to March 31, 2014)
Cash and deposits 29,904 46,901 Time deposits with original maturities of more than 3 months
(10) (34)
Short-term investments (securities) with maturities of less than 3 months
6,000 4,000
Cash and cash equivalents 35,894 50,866
*2 Details of assets and liabilities of a newly consolidated subsidiary through stock acquisition The breakdown of assets and liabilities at the time of initial consolidation of OKI BRASIL INDÚTRIA E COMÉRCIO DE PRODUTOS E TECNOLOGIA EM AUTOMAÇAO S.A. through stock acquisition, and the relationship between the stock acquisition cost and expenses (net) for the acquisition in the current fiscal year are as follows:
(Million yen) Current assets 12,526 Non-current assets 2,065 Goodwill 626 Current liabilities (5,597) Non-current liabilities (346) Minority interests (2,594) Stock acquisition cost 6,680 Outstanding stock acquisition cost payable (2,870) Cash and cash equivalents of a newly consolidated subsidiary (1,126) Purchases of investment in subsidiaries resulting in charge in scope of consolidation (net) 2,682

28
(Securities) 1. Securities–trading
Not applicable
2. Held-to-maturity securities Not applicable
3. Available-for-sale securities Previous fiscal year (as of March 31, 2013)
(Million yen)
Type Amount recorded in consolidated balance sheets
Acquisition cost Unrealized gain
or loss
Available-for-sale securities whose amount recorded in consolidated balance sheets exceeds their acquisition cost
Stocks 13,092 8,633 4,458
Bonds 301 301 0
Subtotal 13,393 8,935 4,458
Available-for-sale securities whose amount recorded in consolidated balance sheets does not exceed their acquisition cost
Stocks 3,528 4,547 (1,018)
Bonds 202 202 (0)
Negotiable certificates of deposit
6,000 6,000 —
Other 14 14 —
Subtotal 9,745 10,764 (1,018)
Total 23,139 19,699 3,439
Current fiscal year (as of March 31, 2014) (Million yen)
Type
Amount recorded in consolidated balance sheets
Acquisition cost Unrealized gain
or loss
Available-for-sale securities whose amount recorded in consolidated balance sheets exceeds their acquisition cost
Stocks 18,116 10,932 7,184
Other 7 7 0
Subtotal 18,124 10,939 7,184
Available-for-sale securities whose amount recorded in consolidated balance sheets does not exceed their acquisition cost
Stocks 1,773 2,280 (506)
Bonds 3 3 —
Negotiable certificates of deposit
4,000 4,000 —
Other 9 9 —
Subtotal 5,786 6,292 (506)
Total 23,910 17,232 6,677
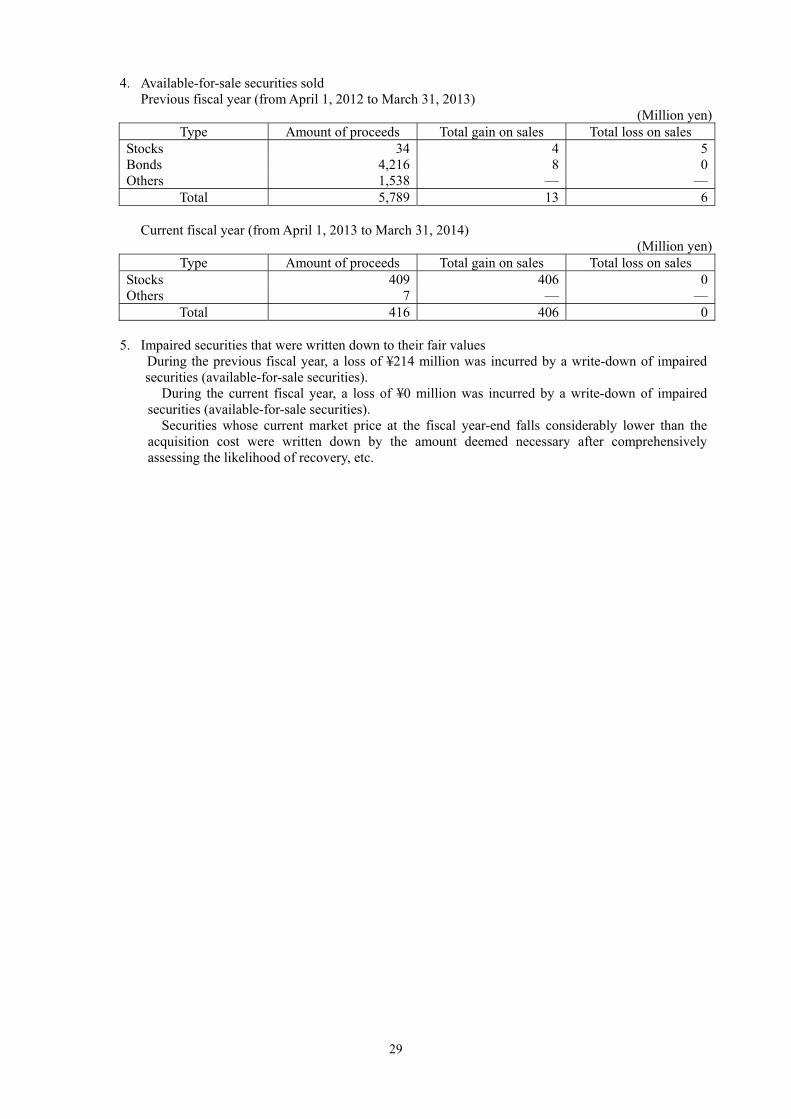
29
4. Available-for-sale securities sold Previous fiscal year (from April 1, 2012 to March 31, 2013)
(Million yen) Type Amount of proceeds Total gain on sales Total loss on sales
Stocks 34 4 5Bonds 4,216 8 0Others 1,538 — —
Total 5,789 13 6
Current fiscal year (from April 1, 2013 to March 31, 2014) (Million yen)
Type Amount of proceeds Total gain on sales Total loss on sales Stocks 409 406 0Others 7 — —
Total 416 406 0
5. Impaired securities that were written down to their fair values During the previous fiscal year, a loss of ¥214 million was incurred by a write-down of impaired securities (available-for-sale securities).
During the current fiscal year, a loss of ¥0 million was incurred by a write-down of impaired securities (available-for-sale securities).
Securities whose current market price at the fiscal year-end falls considerably lower than the acquisition cost were written down by the amount deemed necessary after comprehensively assessing the likelihood of recovery, etc.
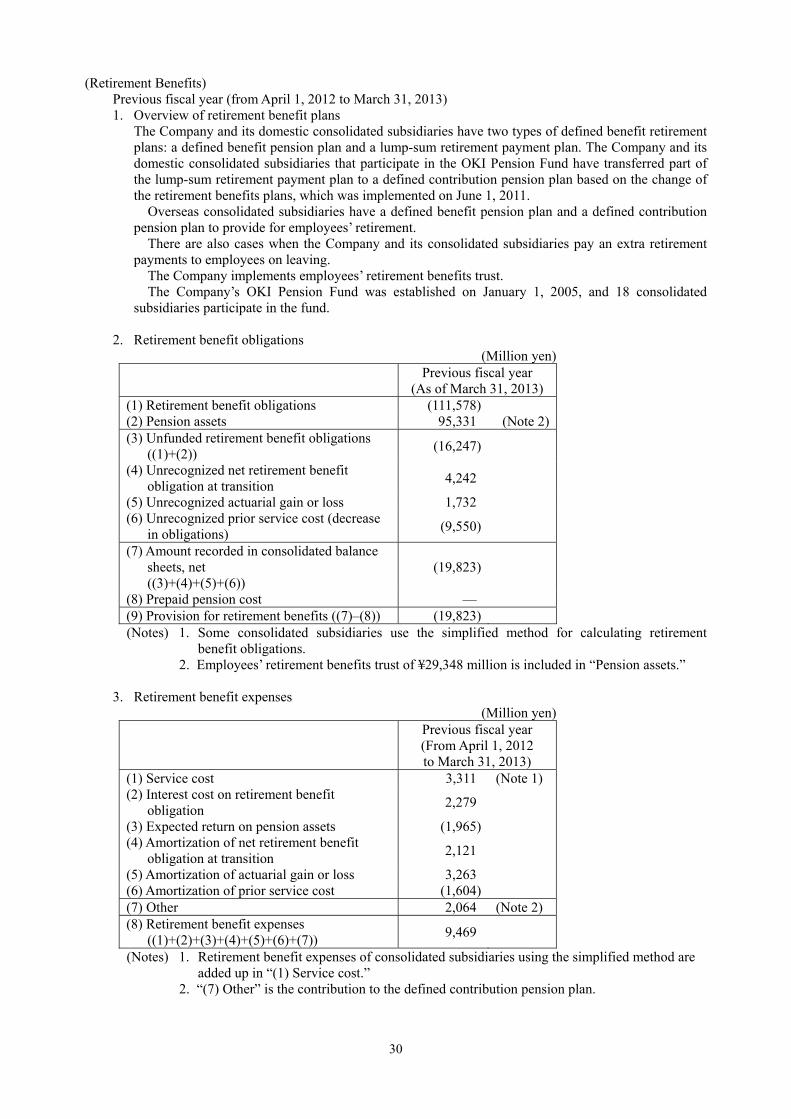
30
(Retirement Benefits) Previous fiscal year (from April 1, 2012 to March 31, 2013) 1. Overview of retirement benefit plans
The Company and its domestic consolidated subsidiaries have two types of defined benefit retirement plans: a defined benefit pension plan and a lump-sum retirement payment plan. The Company and its domestic consolidated subsidiaries that participate in the OKI Pension Fund have transferred part of the lump-sum retirement payment plan to a defined contribution pension plan based on the change of the retirement benefits plans, which was implemented on June 1, 2011.
Overseas consolidated subsidiaries have a defined benefit pension plan and a defined contribution pension plan to provide for employees’ retirement.
There are also cases when the Company and its consolidated subsidiaries pay an extra retirement payments to employees on leaving.
The Company implements employees’ retirement benefits trust. The Company’s OKI Pension Fund was established on January 1, 2005, and 18 consolidated
subsidiaries participate in the fund.
2. Retirement benefit obligations (Million yen)
Previous fiscal year (As of March 31, 2013)
(1) Retirement benefit obligations (111,578)(2) Pension assets 95,331 (Note 2)(3) Unfunded retirement benefit obligations
((1)+(2)) (16,247)
(4) Unrecognized net retirement benefit obligation at transition
4,242
(5) Unrecognized actuarial gain or loss 1,732 (6) Unrecognized prior service cost (decrease
in obligations) (9,550)
(7) Amount recorded in consolidated balance sheets, net ((3)+(4)+(5)+(6))
(19,823)
(8) Prepaid pension cost — (9) Provision for retirement benefits ((7)–(8)) (19,823)(Notes) 1. Some consolidated subsidiaries use the simplified method for calculating retirement
benefit obligations. 2. Employees’ retirement benefits trust of ¥29,348 million is included in “Pension assets.”
3. Retirement benefit expenses
(Million yen) Previous fiscal year
(From April 1, 2012 to March 31, 2013)
(1) Service cost 3,311 (Note 1) (2) Interest cost on retirement benefit
obligation 2,279
(3) Expected return on pension assets (1,965) (4) Amortization of net retirement benefit
obligation at transition 2,121
(5) Amortization of actuarial gain or loss 3,263 (6) Amortization of prior service cost (1,604) (7) Other 2,064 (Note 2) (8) Retirement benefit expenses
((1)+(2)+(3)+(4)+(5)+(6)+(7)) 9,469
(Notes) 1. Retirement benefit expenses of consolidated subsidiaries using the simplified method are added up in “(1) Service cost.”
2. “(7) Other” is the contribution to the defined contribution pension plan.

31
4. Assumptions in calculating retirement benefit obligations (1) Periodical allocation of estimated retirement benefits
Allocation on a point basis or allocation to each period by the straight-line method (Point basis is applied for the periodical allocation of estimated retirement benefits that are based on the point-system pension and cash balance pension plan.)
(2) Discount rate Previous fiscal year
(From April 1, 2012 to March 31, 2013) 1.4%
(3) Expected rate of return on pension assets
Previous fiscal year (From April 1, 2012 to March 31, 2013)
2.5% (4) Amortization period for prior service cost
11 to 13 years (Prior service cost is amortized using the straight-line method over certain years not exceeding the average remaining service years of employees at the time of occurrence.)
(5) Amortization period for actuarial gain or loss
11 to 13 years (Actuarial gain or loss is amortized using the straight-line method over certain years not exceeding the average remaining service years of employees at the time of occurrence, from the fiscal year following the year of occurrence.)
(6) Amortization period for net retirement benefit obligations at transition
15 years, excluding consolidated subsidiaries that amortize obligations collectively in the first fiscal year of application of changes in accounting standards and some overseas consolidated subsidiaries that deduct obligations directly from retained earnings.

32
Current fiscal year (from April 1, 2013 to March 31, 2014) 1. Overview of retirement benefit plans
To provide for employees’ retirement benefits, the Company and its domestic consolidated subsidiaries have saving and non-saving types of benefit plans: a defined benefit plan and a defined contribution plan.
In a saving-type defined benefit pension plan, the Company adopts a cash balance plan, in which cumulative points are saved in each member employee’s virtual personal account as a pool for pension or lump-sum retirement payment. The cumulative points are comprised of “pension points,” which are given based on each member employee’s salary level, and interests based on the yields of Japanese government bonds.
In a lump-sum retirement payment plan (this is a non-saving-type plan in general; one company has a saving-type plan as it set up an employees’ retirement benefits trust), lump-sum retirement payments are made based on “achievement points,” which are granted according to the results of each member employee’s performance, and service years.
Overseas consolidated subsidiaries have a defined benefit pension plan and a defined contribution pension plan to provide for employees’ retirement.
The Company implements employees’ retirement benefits trust for its defined benefit pension plan and lump-sum retirement payment plan.
In the lump-sum retirement payment plans of some consolidated subsidiaries, liability for retirement benefits and retirement benefit expenses are calculated by the simplified method.
2. Defined benefit plan (1) Adjustments to retirement benefit obligations between the beginning and end of the period
(Million yen) Retirement benefit obligations at the beginning of the period 111,578
Service cost 2,905 Interest cost on retirement benefit obligation 1,583 Actuarial gain or loss arising during the period (154) Payments of retirement benefits (7,740) Other 539
Retirement benefit obligations at the end of the period 108,713 (2) Adjustments to pension assets between the beginning and end of the period
(Million yen) Pension assets at the beginning of the period 95,331
Expected return on pension assets 2,383 Actuarial gain or loss arising during the period 19,256 Employer contribution 4,690 Payments of retirement benefits (5,670) Other 5
Pension assets at the end of the period 115,995 (Note) “Pension assets” include employees’ retirement benefits trust of ¥48,414 million.
(3) Adjustments between retirement benefit obligations and pension assets at the end of the period and
liability for retirement benefits and asset for retirement benefits stated on consolidated balance sheets (Million yen)
Retirement benefit obligations in saving-type plan 95,414 Pension assets (115,995) (20,581) Retirement benefit obligations in non-saving-type plan 13,298 Net liability/asset stated on consolidated balance sheets (7,282) Liability for retirement benefits 20,225 Asset for retirement benefits (27,507) Net liability/asset stated on consolidated balance sheets (7,282)

33
(4) Retirement benefit expenses and their breakdown (Million yen)
Service cost 2,905 Interest cost on retirement benefit obligation 1,583 Expected return on pension assets (2,383) Amortization of actuarial gain or loss 2,588 Amortization of prior service cost (1,604) Amortization of net retirement benefit obligation at transition 2,121 Other 3,258 (Note)Retirement benefit expenses related to defined benefit plan 8,470 (Note) “Other” includes extra retirement payments (¥2,662 million), and one-time amortization of
net actuarial gain or loss associated with the winding down of business of subsidiaries (¥595 million).
(5) Retirement benefits liability adjustments
The breakdown of retirement benefits liability adjustments (before deduction of tax effects) is as follows:
(Million yen) Unrecognized past service cost (8,161) Unrecognized actuarial gain or loss (20,836) Unrecognized net retirement benefit obligation at transition 2,120
Total (26,877) (6) Pension assets
1) Breakdown of major pension assets The proportion of each category to total pension assets is as follows:
(%) Bonds 36 Stocks 49 Others 15
Total 100 (Note) Total pension assets include employees’ retirement benefits trust (42%).
2) Method of determining long-term expected rate of return on pension assets
A long-term expected rate of return on pension assets is determined as a rate calculated based on the average of actual rates of return for the last 3 years (0 – 2.5%), which is multiplied by a future risk factor if portfolio assets include those of higher fluctuation risks.
(7) Assumptions in actuarial calculation
Major assumptions in actuarial calculation as of the end of the current fiscal year are as follows: Discount rate 1.4% Long-term expected rate of return on pension assets 2.5%
3. Defined contribution plan
The Company and its consolidated subsidiaries made a required contribution of ¥2,103 million to the defined contribution plan.

34
(Tax Effect Accounting) 1. Breakdown of major factors that caused deferred tax assets and liabilities
(Million yen) Previous fiscal year
(As of March 31, 2013) Current fiscal year
(As of March 31, 2014)Deferred tax assets
Retained losses carried forward 33,369 27,363 Nondeductible provision for retirement benefits
12,159
—
Liability for retirement benefits — 17,523 Excess allowance for doubtful accounts and nondeductible bad debts expenses
6,205
7,543
Nondeductible accounts payable from change of retirement benefit plan
9,365
7,302
Nondeductible accrued bonuses 4,211 4,591 Nondeductible loss on valuation of inventories 2,983 3,081 Nondeductible loss on valuation of investment securities
2,158
2,159
Nondeductible impairment loss 1,578 1,546 Other 6,992 7,059
Deferred tax assets (Subtotal) 79,024 78,172 Valuation allowance (68,065) (67,262)Total deferred tax assets 10,959 10,909 Deferred tax liabilities
Asset for retirement benefits — (15,448)Nondeductible gain on contribution of securities to retirement benefit trust
(3,830)
(3,830)
Valuation difference on available-for-sale securities
(1,222)
(2,362)
Other (490) (364)Total deferred tax liabilities (5,543) (22,006)Net deferred tax assets (liabilities) 5,415 (11,096)
2. Breakdown of items that caused the difference between the statutory tax rate and the effective tax rate after application of tax effect accounting
Previous fiscal year (As of March 31, 2013)
Current fiscal year (As of March 31, 2014)
Statutory tax rate 38.0 % 38.0 % (Adjustment)
Dividends and other income not counted for tax purposes
(0.5)
(0.5)
Entertainment and other expenses not counted for tax purposes
2.1
2.8
Increase (decrease) in valuation allowance related to deferred tax assets
4.4
(26.1)
Inhabitant tax on per capita basis 1.6 1.0 Reduction of deferred tax assets at year end due to change in tax rate
—
2.1
Other (20.0) (4.0) The effective tax rate after application of tax effect accounting
25.6
13.3
3. Revision to the amounts of deferred tax assets and deferred tax liabilities due to changes in the rate of
income taxes With the promulgation of the “Act for Partial Amendment of the Income Tax Act, etc.” (Act No. 10, 2014) on March 31, 2014, the Special Reconstruction Corporation Tax will no longer be imposed from the fiscal year beginning on and after April 1, 2014. In addition, pursuant to the “Act for Partial Amendment of the Local Tax Act, etc.” (Act No. 4, 2014) and the “Act for Partial Amendment of the Local Corporate Tax Act, etc.” (Act No. 11, 2014), which were proofficially announced on March 31,

35
2014, a local income tax will be imposed as part of national taxes, while the inhabitant tax rate will be reduced from the fiscal year beginning on April 1, 2015. In accordance with these changes, the statutory tax rate used for the calculation of deferred tax assets and deferred tax liabilities has been changed from 38.0% applicable hitherto to 36.0%, for the temporary differences likely to be eliminated in the fiscal year beginning on April 1, 2014.
As a result of this change in the tax rate, net amount of deferred tax assets (after deduction of deferred tax liabilities) decreased by ¥719 million. Income taxes-deferred and deferred gains or losses on hedges increased by ¥682 million and ¥0 million, respectively, and retirement benefits liability adjustments decreased by ¥37 million.
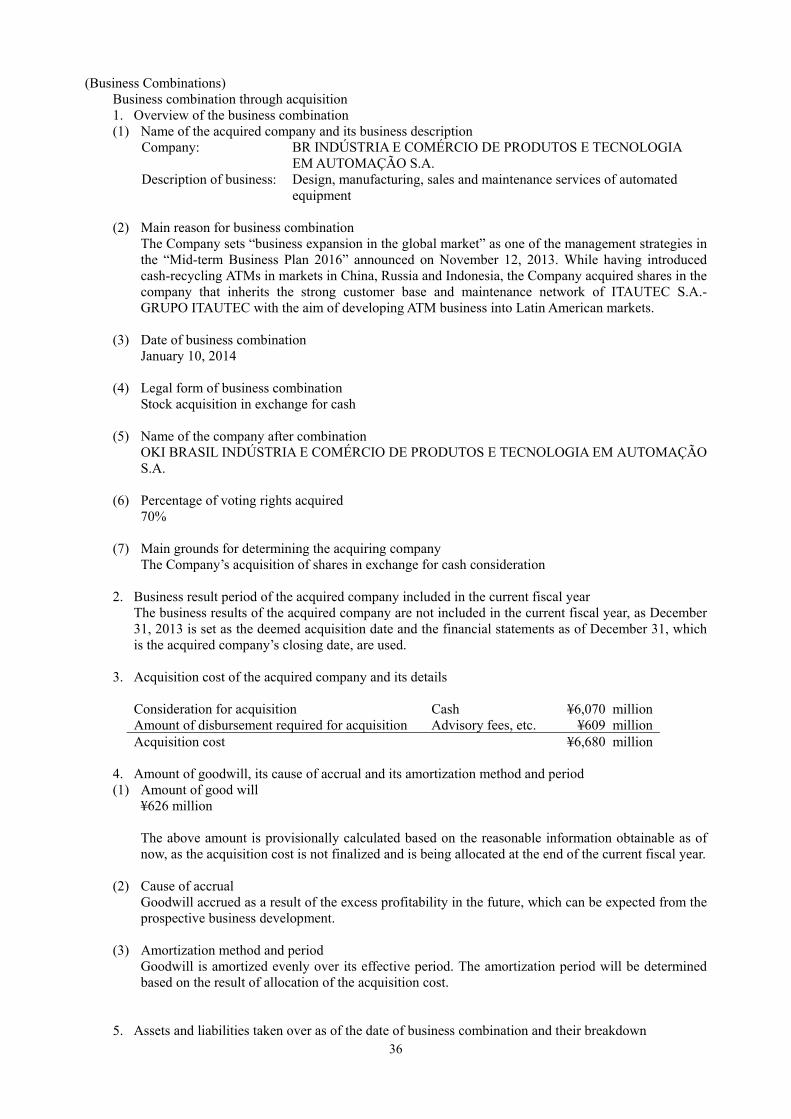
36
(Business Combinations) Business combination through acquisition 1. Overview of the business combination (1) Name of the acquired company and its business description
Company: BR INDÚSTRIA E COMÉRCIO DE PRODUTOS E TECNOLOGIA EM AUTOMAÇÃO S.A.
Description of business: Design, manufacturing, sales and maintenance services of automated equipment
(2) Main reason for business combination
The Company sets “business expansion in the global market” as one of the management strategies in the “Mid-term Business Plan 2016” announced on November 12, 2013. While having introduced cash-recycling ATMs in markets in China, Russia and Indonesia, the Company acquired shares in the company that inherits the strong customer base and maintenance network of ITAUTEC S.A.-GRUPO ITAUTEC with the aim of developing ATM business into Latin American markets.
(3) Date of business combination
January 10, 2014 (4) Legal form of business combination
Stock acquisition in exchange for cash (5) Name of the company after combination
OKI BRASIL INDÚSTRIA E COMÉRCIO DE PRODUTOS E TECNOLOGIA EM AUTOMAÇÃO S.A.
(6) Percentage of voting rights acquired
70% (7) Main grounds for determining the acquiring company
The Company’s acquisition of shares in exchange for cash consideration 2. Business result period of the acquired company included in the current fiscal year
The business results of the acquired company are not included in the current fiscal year, as December 31, 2013 is set as the deemed acquisition date and the financial statements as of December 31, which is the acquired company’s closing date, are used.
3. Acquisition cost of the acquired company and its details
Consideration for acquisition Cash ¥6,070 million Amount of disbursement required for acquisition Advisory fees, etc. ¥609 million Acquisition cost ¥6,680 million
4. Amount of goodwill, its cause of accrual and its amortization method and period (1) Amount of good will
¥626 million
The above amount is provisionally calculated based on the reasonable information obtainable as of now, as the acquisition cost is not finalized and is being allocated at the end of the current fiscal year.
(2) Cause of accrual
Goodwill accrued as a result of the excess profitability in the future, which can be expected from the prospective business development.
(3) Amortization method and period
Goodwill is amortized evenly over its effective period. The amortization period will be determined based on the result of allocation of the acquisition cost.
5. Assets and liabilities taken over as of the date of business combination and their breakdown

37
Current assets ¥12,526 millionNon-current assets ¥2,576 millionTotal assets ¥15,102 millionCurrent liabilities ¥5,597 millionNon-current liabilities ¥346 millionTotal liabilities ¥5,944 million
As the acquisition cost is currently being allocated, the above amounts are provisionally calculated as of the end of the current fiscal year.
6. Estimated amount of impact of the business combination on the consolidated statements of income of
the current fiscal year and its calculation method, assuming that the business combination had been completed at the beginning of the current fiscal year No estimation is attempted due to difficulty in reasonably calculating estimates.

38
(Segment Information) [Segment information] 1. Overview of reportable segments
The reportable segments of the Company are the business units for which the Company is able to obtain respective financial information separately in order for the Board of Directors to conduct periodic review to determine distribution of management resources and evaluate their business results.
The Company mainly conducts “Info-telecom Systems” and “EMS,” and the OKI Data Group (Oki Data Corporation and its group companies) conducts “Printers” as an independent management unit; each of them plans comprehensive strategies about their main product lines in domestic and overseas markets and deploys business activities.
Accordingly, the Company has three reportable segments by product lines based on the Company and the OKI Data Group: “Info-telecom Systems,” “Printers” and “EMS.”
“Info-telecom Systems” provides solutions and services focused on the know-how earned from various business systems for financial, transportation, retail, and manufacturing industries; communication equipment for telecom carriers; video and voice communication systems; systems dedicated to social infrastructure; and mechatronics technology products. “Printers” provides LED technology-featured printers. “EMS” conducts consigned manufacturing business based on the manufacturing technologies developed within the group.
Listed below are the major products and services of each reportable segment:
Business segment Major products and services
Info-telecom Systems
Financial systems, automation equipment systems (ATMs, cash handling equipment, ticket issuing equipment, etc.), systems dedicated to public sector (aviation and traffic, disaster prevention and firefighting, various info-telecom systems, etc.), systems dedicated to telecom carriers (switching, transmission, optical access, etc.), IP telecommunication systems (PBX, call center, video conference, etc.), various information systems (travel, retail, manufacturing, etc.), and relevant IT services (cloud computing services, system integration, support services, maintenance services, etc.)
Printers Color LED printers, monochrome LED printers, dot-impact printers, multifunction printers, etc.
EMS Design and manufacturing services, printed circuit boards, etc.
2. Calculation methods for the amount of net sales, income and loss, assets, liabilities and other items by
reportable segment The methods of accounting treatment for the reported business segments are the same as set forth in “Significant Matters for the Basis of Preparation of Consolidated Financial Statements.” Revenues from intersegment transactions and transfers are calculated based on prevailing market rates.

39
3. Information about amounts of net sales, income and loss, assets, liabilities and other items by reportable segment Previous fiscal year (from April 1, 2012 to March 31, 2013)
(Million yen) Reportable segments
Others(Note 1)
Total Adjustment
(Note 2)
Amount recorded in
consolidated financial
statements(Note 3)
Info-telecom Systems
Printers EMS Total
Net sales
Net sales to external customers
293,034 111,379 32,665 437,079 18,744 455,824 — 455,824
Intersegment net sales or transfers
3,203 5,669 135 9,008 22,746 31,754 (31,754) —
Total 296,238 117,049 32,800 446,088 41,490 487,578 (31,754) 455,824
Segment income (loss) 23,815 (8,837) 1,569 16,548 3,014 19,563 (6,087) 13,475
Segment assets 183,527 73,673 23,256 280,456 24,710 305,166 44,155 349,322
Other items
Depreciation 4,913 3,921 1,014 9,849 998 10,847 1,202 12,049
Amortization of goodwill
6 0 — 6 — 6 19 25
Investments in companies accounted for using equity method
1,433 — — 1,433 27 1,460 3,130 4,591
Increase in property, plant and equipment and intangible assets
6,953 5,722 1,065 13,741 874 14,615 1,003 15,619
Current fiscal year (from April 1, 2013 to March 31, 2014)
(Million yen) Reportable segments
Others(Note 1)
Total Adjustment
(Note 2)
Amount recorded in
consolidated financial
statements(Note 3)
Info-telecom Systems
Printers EMS Total
Net sales
Net sales to external customers
303,600 124,831 37,111 465,543 17,569 483,112 — 483,112
Intersegment net sales or transfers
4,189 5,048 137 9,376 21,099 30,475 (30,475) —
Total 307,790 129,879 37,249 474,919 38,669 513,588 (30,475) 483,112
Segment income (loss) 23,416 5,125 1,656 30,198 2,844 33,043 (5,846) 27,196
Segment assets 208,778 75,154 25,125 309,058 25,494 334,553 77,960 412,514
Other items
Depreciation 5,365 4,771 937 11,074 1,013 12,088 1,116 13,204
Amortization of goodwill
11 0 — 11 — 11 (0) 11
Investments in companies accounted for using equity method
1,653 — — 1,653 27 1,680 3,018 4,698
Increase in property, plant and equipment and intangible assets
8,049 2,725 800 11,576 784 12,361 1,063 13,424

40
(Notes) 1. “Others” consists of businesses not included in the reportable segments, such as provision of services, and manufacturing and sales of other equipment products.
2. Details of adjustment are as follows: (Million yen)
Segment income or loss Previous fiscal year Current fiscal year Elimination of intersegment transactions
149 161
Corporate expenses* (6,158) (5,978)Adjustment to non-current assets (79) (29)
Total (6,087) (5,846)* Corporate expenses are mainly general and administrative expenses and research and
development expenses that are not attributable to the reportable segments.
(Million yen) Segment assets Previous fiscal year Current fiscal year
Elimination of intersegment transactions
(121,471) (130,374)
Corporate assets* 166,879 209,605 Adjustment to non-current assets (1,252) (1,269)
Total 44,155 77,960 * Corporate assets are mainly surplus funds, fund for long-term investment and assets related to the
general administration section of the Filing Company. (Million yen)
Depreciation Previous fiscal year Current fiscal year Depreciation of corporate assets 1,365 1,293 Adjustment to non-current assets (163) (176)
Total 1,202 1,116
(Million yen) Investments in companies
accounted for using equity methodPrevious fiscal year Current fiscal year
Corporate investments 3,130 3,018
(Million yen) Increase in property, plant and
equipment and intangible assets Previous fiscal year Current fiscal year
Corporate assets 1,249 1,273 Adjustment to non-current assets (246) (210)
Total 1,003 1,063
3. Segment income or loss is adjusted with operating income on the consolidated statements of income.

41
[Related information] Previous fiscal year (from April 1, 2012 to March 31, 2013)
1. Information about products and services (Million yen)
Solutions &
Services
Telecom Systems
Social Infrastructure
Systems
Mechatronics Systems
Printers EMS Others Total
Net sales to external customers
91,093 75,711 49,357 76,872 111,379 32,665 18,744 455,824
2. Information by geographic areas
(1) Net sales (Million yen)
Japan North America Europe China Others Total 329,265 19,428 46,635 44,077 16,418 455,824
(Note) Net sales are sorted by countries or regions based on the location of customers.
(2) Property, plant and equipment (Million yen)
Japan Asia Others Total 47,454 7,821 2,553 57,829
Current fiscal year (from April 1, 2013 to March 31, 2014)
1. Information about products and services (Million yen)
Solutions &
Services
Telecom Systems
Social Infrastructure
Systems
Mechatronics Systems
Printers EMS Others Total
Net sales to external customers
85,510 79,989 52,566 85,533 124,831 37,111 17,569 483,112
2. Information by geographic areas
(1) Net sales (Million yen)
Japan North America Europe China Others Total 337,071 21,968 53,492 50,626 19,953 483,112
(Note) Net sales are sorted by countries or regions based on the location of customers.
(2) Property, plant and equipment (Million yen)
Japan Asia Others Total 46,430 6,590 3,172 56,193

42
[Information about impairment loss on non-current assets of each reportable segment] Previous fiscal year (from April 1, 2012 to March 31, 2013)
(Million yen) Info-
telecom Systems
Printers EMS Others Corporate/ elimination
Total
Impairment loss
133 7 — 79 — 219
Current fiscal year (from April 1, 2013 to March 31, 2014)
(Million yen) Info-
telecom Systems
Printers EMS Others Corporate/ elimination
Total
Impairment loss
163 20 — — — 184
[Information about amortization of goodwill and unamortized balance of each reportable segment]
Previous fiscal year (from April 1, 2012 to March 31, 2013) (Million yen)
Info-telecom Systems
Printers EMS Others Corporate/ elimination
Total
Goodwill at end of fiscal year
— 0 — — (0) —
Current fiscal year (from April 1, 2013 to March 31, 2014)
(Million yen) Info-
telecom Systems
Printers EMS Others Corporate/ elimination
Total
Goodwill at end of fiscal year
690 — — — — 690

43
(Per Share Information) Previous fiscal year
(From April 1, 2012 to March 31, 2013)
Current fiscal year (From April 1, 2013 to March 31, 2014)
Net assets per share ¥34.40 ¥79.32 Net income per share ¥17.24 ¥36.21 Net income per share–diluted ¥12.05 ¥26.13
(Note) 1. The basis for calculation of net income per share and net income per share–diluted is as follows:
Previous fiscal year (From April 1, 2012 to March 31, 2013)
Current fiscal year (From April 1, 2013 to March 31, 2014)
Net income per share Net income (Million yen) 13,599 27,359 Net income not attributable to common shareholders (Million yen)
1,032 1,004
[Dividends on Class A preferred stock included in the above]
[1,032] [1,004]
Net income related to common stock (Million yen)
12,566 26,354
Weighted average number of shares of common stock during the period (Thousand shares)
728,938 727,899
Net income per share–diluted
Adjustment to net income (Million yen)
1,032 1,004
[Dividends on Class A preferred stock included in the above]
[1,032] [1,004]
Increase of common stock (Thousand shares)
400,000 319,148
[Class A preferred stock included in the above]
[400,000] [319,148]
Outline of dilutive shares not counted in the calculation of net income per share–diluted due to no dilutive effect
Subscription rights to shares (5 classes)
Subscription rights to shares (4 classes)
2. The basis for calculation of net assets per share is as follows:
Previous fiscal year (As of March 31, 2013)
Current fiscal year (As of March 31, 2014)
Total net assets (Million yen) 56,625 91,918 Amount deducted from the total net assets (Million yen)
31,584 34,188
[Amount paid for Class A preferred stock included in the above]
[30,000] [30,000]
[Dividends on Class A preferred stock included in the above]
[1,032] [1,004]
[Subscription rights to shares included in the above]
[79] [79]
[Minority interests included in the above]
[473] [3,104]
Amount of net assets related to common stock at end of period (Million yen)
25,040 57,730
Number of common shares used to calculate net assets per share at end of period (Thousand shares)
727,973 727,824
(Significant Subsequent Event)
Not applicable

44
5. Non-consolidated Financial Statements (1) Non-consolidated Balance Sheets
(Million yen)
Fiscal year ended March 31, 2013
(As of March 31, 2013)
Fiscal year ended March 31, 2014
(As of March 31, 2014)
Assets
Current assets
Cash and deposits 13,578 22,755
Notes receivable–trade 695 783
Accounts receivable–trade 65,385 66,703
Lease investment assets 2,101 3,298
Securities 6,000 4,000
Finished goods 4,320 4,645
Work in process 12,927 14,445
Raw materials and supplies 7,211 6,950
Prepaid expenses 724 578
Short-term loans receivable 51,353 51,866
Accounts receivable–other 7,847 6,959
Deferred tax assets 2,690 2,697
Other 171 451
Allowance for doubtful accounts (45) (46)
Total current assets 174,961 186,089
Non-current assets
Property, plant and equipment
Buildings 37,333 37,229
Accumulated depreciation (27,085) (26,634)
Buildings, net 10,247 10,595
Structures 2,481 2,475
Accumulated depreciation (2,177) (2,165)
Structures, net 303 309
Machinery and equipment 14,282 13,872
Accumulated depreciation (12,160) (11,869)
Machinery and equipment, net 2,122 2,002
Vehicles 84 72
Accumulated depreciation (69) (60)
Vehicles, net 14 11
Tools, furniture and fixtures 32,522 33,381
Accumulated depreciation (27,130) (27,281)
Tools, furniture and fixtures, net 5,392 6,100
Land 8,397 8,397
Construction in progress 129 179
Total property, plant and equipment 26,606 27,597

45
(Million yen)
Fiscal year ended March 31, 2013
(As of March 31, 2013)
Fiscal year ended March 31, 2014
(As of March 31, 2014)
Intangible assets
Right of using facilities 118 116
Software 4,505 5,482
Total intangible assets 4,623 5,598
Investments and other assets
Investment securities 22,278 24,990
Shares of subsidiaries and associates 61,544 68,587
Investments in capital 94 89
Investments in capital of subsidiaries and associates 1,764 617
Long-term loans receivable from subsidiaries and associates
5,938 4,109
Long-term prepaid expenses 1,817 999
Claims provable in bankruptcy, claims provable in rehabilitation and other
111 33
Lease and guarantee deposits 3,152 3,164
Other 353 328
Allowance for doubtful accounts (1,080) (1,105)
Total investments and other assets 95,974 101,814
Total non-current assets 127,205 135,010
Total assets 302,166 321,099

46
(Million yen)
Fiscal year ended March 31, 2013
(As of March 31, 2013)
Fiscal year ended March 31, 2014
(As of March 31, 2014)
Liabilities
Current liabilities
Notes payable–trade 227 339
Accounts payable–trade 42,935 45,981
Short-term loans payable 37,676 36,176
Current portion of long-term loans payable 18,415 48,755
Lease obligations 527 851
Accounts payable–other 8,579 11,010
Accrued expenses 15,054 15,383
Income taxes payable — 650
Advances received 1,592 1,069
Deposits received 1,605 2,591
Provision for loss on construction contracts 41 —
Asset retirement obligations 8 11
Other 677 417
Total current liabilities 127,341 163,238
Non-current liabilities
Long-term loans payable 43,643 13,027
Lease obligations 1,838 3,082
Long-term accounts payable–other 12,290 9,588
Deferred tax liabilities 4,076 5,164
Provision for retirement benefits 13,396 11,516
Provision for loss on business of subsidiaries and associates 26,008 28,855
Asset retirement obligations 827 861
Total non-current liabilities 102,080 72,097
Total liabilities 229,421 235,336

47
(Million yen)
Fiscal year ended March 31, 2013
(As of March 31, 2013)
Fiscal year ended March 31, 2014
(As of March 31, 2014)
Net assets
Shareholders’ equity
Capital stock 44,000 44,000
Capital surplus
Legal capital surplus 15,000 15,000
Other capital surplus 6,553 6,553
Total capital surpluses 21,553 21,553
Retained earnings
Other retained earnings
Retained earnings brought forward 6,450 17,475
Total retained earnings 6,450 17,475
Treasury shares (386) (419)
Total shareholders’ equity 71,616 82,609
Valuation and translation adjustments
Valuation difference on available-for-sale securities 1,718 3,486
Deferred gains or losses on hedges (670) (411)
Total valuation and translation adjustments 1,048 3,074
Subscription rights to shares 79 79
Total net assets 72,744 85,763
Total liabilities and net assets 302,166 321,099

48
(2) Non-consolidated Statement of Income (Million yen)
Fiscal year ended March 31, 2013
(From April 1, 2012 to March 31, 2013)
Fiscal year ended March 31, 2014
(From April 1, 2013 to March 31, 2014)
Net sales 225,953 238,786
Cost of sales 171,040 183,624
Gross profit 54,912 55,161
Selling, general and administrative expenses 42,395 42,535
Operating income 12,517 12,626
Non-operating income
Interest income 643 705
Interest on securities 70 6
Dividend income 17,675 770
Royalty income from corporate brand 1,242 1,353
Foreign exchange gains 2,443 392
Miscellaneous income 1,031 444
Total non-operating income 23,107 3,672
Non-operating expenses
Interest expenses 2,202 1,935
Commission for syndicate loan 239 446
Miscellaneous expenses 367 657
Total non-operating expenses 2,808 3,039
Ordinary income 32,816 13,259
Extraordinary income
Gain on sales of non-current assets 2,772 17
Gain on sales of investment securities 568 406
Gain on sales of shares of subsidiaries and associates 19 — Gain on sales of investments in capital of subsidiaries and associates
— 31
Gain on extinguishment of tie-in shares 223 —
Total extraordinary income 3,582 456

49
(Million yen)
Fiscal year ended March 31, 2013
(From April 1, 2012 to March 31, 2013)
Fiscal year ended March 31, 2014
(From April 1, 2013 to March 31, 2014)
Extraordinary losses
Loss on disposal of non-current assets 340 423
Impairment loss 133 163
Loss on valuation of investment securities 217 33
Loss on valuation of investments in capital of subsidiaries and associates
— 277
Provision for loss on business of subsidiaries and associates 13,599 1,143
Total extraordinary losses 14,290 2,040
Income before income taxes 22,108 11,675
Income taxes–current 980 (513)
Income taxes–deferred 365 130
Total income taxes 1,345 (382)
Net income 20,763 12,057

50
(3) Non-consolidated Statement of Changes in Equity Fiscal year ended March 31, 2013 (From April 1, 2012 to March 31, 2013)
(Million yen)
Shareholders’ equity
Capital stock
Capital surplus Retained earnings
Treasury shares
Total shareholders’
equity
Legal capital surplus
Other capital surplus
Total capital surplus
Other retained earnings Total
retained earnings
Retained earnings brought forward
Balance at beginning of current period
44,000 15,000 6,553 21,553 (12,991) (12,991) (25) 52,536
Changes of items during the period
Cash dividends paid
(1,321) (1,321) (1,321)
Net income 20,763 20,763 20,763Purchase of treasury shares
(361) (361)
Net changes of items other than shareholders’ equity
Total changes of items during period
— — — — 19,441 19,441 (361) 19,080
Balance at end of current period
44,000 15,000 6,553 21,553 6,450 6,450 (386) 71,616
(Million yen)
Valuation and translation adjustments
Subscription rights to shares
Total net assets
Valuation difference
on available-for-sale
securities
Deferred gains or losses on hedges
Total valuation
and translation
adjustments
Balance at beginning of current period
(1,908) (810) (2,718) 79 49,897
Changes of items during period
Cash dividends paid
(1,321)
Net income 20,763Purchase of treasury shares
(361)
Net changes of items other than shareholders’ equity
3,626 139 3,766 — 3,766
Total changes of items during period
3,626 139 3,766 — 22,847
Balance at end of current period
1,718 (670) 1,048 79 72,744

51
Fiscal year ended March 31, 2014 (From April 1, 2013 to March 31, 2014) (Million yen)
Shareholders’ equity
Capital stock
Capital surplus Retained earnings
Treasury shares
Total shareholders’
equity
Legal capital surplus
Other capital surplus
Total capital surplus
Other retained earnings Total
retained earnings
Retained earnings brought forward
Balance at beginning of current period
44,000 15,000 6,553 21,553 6,450 6,450 (386) 71,616
Changes of items during period
Cash dividends paid
(1,032) (1,032) (1,032)
Net income 12,057 12,057 12,057Purchase of treasury shares
(32) (32)
Net changes of items other than shareholders’ equity
Total changes of items during period
— — — — 11,025 11,025 (32) 10,992
Balance at end of current period
44,000 15,000 6,553 21,553 17,475 17,475 (419) 82,609
(Million yen)
Valuation and translation adjustments
Subscription rights to shares
Total net assets
Valuation difference
on available-for-sale
securities
Deferred gains or losses on hedges
Total valuation
and translation
adjustments
Balance at beginning of current period
1,718 (670) 1,048 79 72,744
Changes of items during period
Cash dividends paid
(1,032)
Net income 12,057Purchase of treasury shares
(32)
Net changes of items other than shareholders’ equity
1,767 258 2,026 — 2,026
Total changes of items during period
1,767 258 2,026 — 13,019
Balance at end of current period
3,486 (411) 3,074 79 85,763

52
(4) Notes to Non-consolidated Financial Statements (Notes Relating to Going Concern Assumption)
Not applicable 6. Others (1) Change in Officers
Not applicable Any change of officers, if determined subsequent to the release of this Summary of Consolidated Financial Results, will be disclosed as soon as the details are confirmed.
(2) Others
Please also refer to the presentation materials “Financial Results for the Fiscal Year Ended March 31, 2014,” which is released today.

53
<Reference Material> Supplementary Materials Consolidated P/L (Billion yen; amounts less than hundred million yen are rounded)
Fiscal year ended March 31, 2013
Fiscal year ended March 31, 2014
Fiscal year ending March 31, 2015
(Projection) YoY change
(%) YoY change
(%) Net sales 455.8 483.1 6.0 525.0 8.7Operating income 13.5 27.2 101.8 28.5 4.8Ordinary income 20.3 36.7 80.5 25.5 -30.4Net income 13.6 27.4 101.2 17.5 -36.0 Net sales by segment (to external customers)
Fiscal year ended March 31, 2013
Fiscal year ended March 31, 2014
Fiscal year ending March 31, 2015
(Projection) YoY change
(%) YoY change
(%) Info-telecom Systems 293.0 303.6 3.6 340.0 12.0Printers 111.4 124.8 12.1 128.0 2.5EMS 32.7 37.1 13.6 40.0 7.8Others 18.7 17.6 -6.3 17.0 -3.2Total 455.8 483.1 6.0 525.0 8.7 Operating income (loss) by segment
Fiscal year ended March 31, 2013
Fiscal year ended March 31, 2014
Fiscal year ending March 31, 2015
(Projection) YoY change
(%) YoY change
(%) Info-telecom Systems 23.8 23.4 -1.7 22.5 -3.9Printers (8.8) 5.1 — 8.0 56.1EMS 1.6 1.7 5.5 2.0 20.8Others 3.0 2.8 -5.6 2.5 -12.1Adjustment (6.1) (5.8) — (6.5) — Total 13.5 27.2 101.8 28.5 4.8 Consolidated cash flows
Fiscal year ended March 31, 2013
Fiscal year ended March 31, 2014
Fiscal year ending March 31, 2015
(Projection) YoY change
(%) YoY change
(%) Net cash provided by (used in) operating activities
(11.6) 31.9 — 25.0 -21.6
Net cash provided by (used in) investing activities
(9.2) (14.0) — (15.0) —
Net cash provided by (used in) financing activities
(21.1) (4.3) — — —
Effect of exchange rate change on cash and cash equivalents
1.4 1.1 -20.8 — —
Net increase (decrease) in cash and cash equivalents
(40.6) 14.7 — — —
Cash and cash equivalents at end of period
35.9 50.9 41.7 — —

54
Capital investment by segment (Billion yen; amounts less than hundred million yen are rounded)
Fiscal year ended March 31, 2013
Fiscal year ended March 31, 2014
Fiscal year ending March 31, 2015
(Projection) YoY change
(%) YoY change
(%) Info-telecom Systems 5.0 5.6 13.0 8.5 51.7Printers 6.3 2.6 -58.2 4.0 52.1EMS 0.5 0.7 40.1 1.0 44.5Others and common 1.3 1.3 -7.5 1.5 21.1Total 13.1 10.2 -22.4 15.0 47.6Depreciation (of property, plant and equipment)
9.6 10.8 12.2 12.0 11.5
Research and development investment by segment
Fiscal year ended March 31, 2013
Fiscal year ended March 31, 2014
Fiscal year ending March 31, 2015
(Projection) YoY change
(%) YoY change
(%) Info-telecom Systems 9.5 8.9 -6.9 10.5 18.4Printers 2.4 2.0 -14.7 2.5 24.6EMS 0.0 0.0 0.0 0.0 -100.0Others and common 2.1 2.1 -1.0 2.0 -2.5Total 14.0 13.0 -7.3 15.0 15.7 Exchange rates (in yen)
Fiscal year ended March 31, 2013
Fiscal year ended March 31, 2014
Fiscal year ending March 31, 2015
(Projection) Average rate during period
USD 83 100 100 EUR 107 134 135
Number of employees at the end of the period
Fiscal year ended March 31, 2013
Fiscal year ended March 31, 2014
Non-consolidated 3,678 3,788 Domestic total 11,353 11,738 Overseas total 6,106 9,352 Total 17,459 21,090