fy2019 financial summary · consolidated financial summary. p4 ・ overview by business segments;...
TRANSCRIPT

Mitsubishi UFJ Securities Holdings Co., Ltd.April, 2020
FY2019Financial Summary

1
・ Consolidated Performance Highlights P2
・ Consolidated Performance Trends P3
・ Consolidated Financial Summary P4
・ Overview by Business Segments P7
Appendix
・ Consolidated Statement of Income P8
・ Consolidated Balance Sheet P9
・ Mitsubishi UFJ Morgan Stanley Securities (MUMSS) P10
・ au Kabucom Securities Co., Ltd. and Overseas Business P13
・ 【Reference】 Domestic Securities Companies P14
・ Financial Soundness Indicators (Credit Rating, Capital Adequacy Ratio) P15
・ Market Risks P16
Contents

2
Consolidated Performance Highlights
Annual Performance Trends Net operating revenue was JPY 322.1bn (+2% YoY), ordinary profit was JPY 48.5bn (+14% YoY) and profit attributable to owners of parent was JPY 21.1bn (-15% YoY) on financial accounting basis.
Net operating revenue was JPY 384.6bn (+4% YoY), ordinary profit was JPY 57.2bn (+17% YoY) and profit attributable to owners of parent was JPY 27.8bn (-4% YoY) on substantial basis including MUSA. Commission received decreased YoY due to low individual trading volume and the absence of large-scale IPO deals of the previous year. Meanwhile, net trading income (including net financial revenue)
significantly increased at overseas subsidiaries.• Domestic subsidiaries saw decreases in both revenue and profit due to the impact of sluggish Retail / middle markets and global markets businesses in 1H, although the investment banking business
including debt underwriting and M&As performed strongly. • Overseas subsidiaries saw significant increases in both revenue and profit due to the strong performance of the flow products business in Europe and in Americas, despite sluggish capital markets in 1H.
(JPY billion)
Net operating revenue
SG&A
Ordinary profit
Profit (owners of parent)
Financial basis
FY2018 FY2019YoY%
313.3 322.1 +2%
287.8 293.5 +2%
42.3 48.5 +14%
25.1 21.1 (15)%
Substantial basis including MUSA *
FY2018 FY2019YoY%
369.8 384.6 +4%
336.9 345.4 +2%
48.6 57.2 +17%
29.2 27.8 (4)%
Quarterly Performance Trends While commission received remained almost at the same level, net trading income (including net financial revenue) performed strongly, resulting in an increase in both revenue and profit for three
consecutive quarters. • Domestic subsidiaries led the consolidated performance of the Company on the back of the recovery of the Retail / middle markets and global markets businesses. • Overseas subsidiaries maintained the level of performance that recovered in 3Q in the capital markets business while struggled due to factors including the impact of the absence of large-scale deals of 3Q
in the flow products business in Europe.
(JPY billion)
Net operating revenue
SG&A
Ordinary profit
Profit (owners of parent)
Financial basis
FY20193Q
FY20193Q
QoQ%
86.0 94.4 +9%
75.0 75.9 +1%
14.3 24.1 +68%
6.3 10.5 +66%
Substantial basis including MUSA *
FY20193Q
FY20194Q
QoQ%
102.4 112.7 +10%
87.7 89.8 +2%
17.6 28.0 +58%
8.9 13.4 +50%
* Figures represent the aggregation with the results of MUFG Securities America Inc. (hereinafter “MUSA”), given that MUSA, despite its deconsolidation in 3Q16 as a result of theapplication of the U.S. Enhanced Prudential Standards, continues to be included in the Company’s internal revenue management.

3
8.46.8
5.1 4.6
0.7
3.4
6.3
10.5
0.0
5.0
10.0
15.0
20.0
25.0
FY181Q
FY182Q
FY183Q
FY184Q
FY191Q
FY192Q
FY193Q
FY194Q
15.113.6
5.97.5
0.5
9.4
14.3
24.1
0.0
5.0
10.0
15.0
20.0
25.0
FY181Q
FY182Q
FY183Q
FY184Q
FY191Q
FY192Q
FY193Q
FY194Q
40.932.3 38.2 37.2 32.0 36.1 37.7 37.4
45.047.1 36.1 36.3
34.838.6
48.357.0
86.079.5
74.3 73.566.8
74.8
86.0
94.4
0.0
10.0
20.0
30.0
40.0
50.0
60.0
70.0
80.0
90.0
100.0
FY181Q
FY182Q
FY183Q
FY184Q
FY191Q
FY192Q
FY193Q
FY194Q
Net Trading Income including Net Financial RevenueCommission received
25.1
21.1
0.0
5.0
10.0
15.0
20.0
25.0
30.0
35.0
40.0
FY2018 FY2019
148.7 143.2
164.6 178.8
313.3 322.1
0.0
50.0
100.0
150.0
200.0
250.0
300.0
350.0
400.0
FY2018 FY2019
Net Trading Income including Net Financial RevenueCommission received
42.3
48.5
0.0
10.0
20.0
30.0
40.0
50.0
60.0
FY2018 FY2019
Consolidated Performance Trends
Annual Performance TrendsNet operating revenue Ordinary profit
(Financial basis)
Profit (owners of parent)(JPY billion) (JPY billion) (JPY billion)
Quarterly Performance Trends Net operating revenue Ordinary profit Profit (owners of parent)(JPY billion) (JPY billion) (JPY billion)
4
8.9 8.2 8.0 6.5 5.7 6.2 7.2 7.9
7.05.5
12.1
7.9 8.8 7.1 6.8 5.7
5.95.4
3.8
3.6 3.3 4.7 4.9 4.2
5.95.8
5.5
5.2 5.2 5.4 5.45.1
13.1
7.3
8.7
13.88.7
12.413.1 14.3
40.9
32.3
38.2 37.2
32.0
36.137.7 37.4
0.0
10.0
20.0
30.0
40.0
50.0
FY20181Q
FY20182Q
FY20183Q
FY20184Q
FY20191Q
FY20192Q
FY20193Q
FY20194Q
Other fees received (Others)Other fees received (Beneficiary certificates)Offering and secondary distribution feesUnderwriting and distribution commissionBrokerage commission
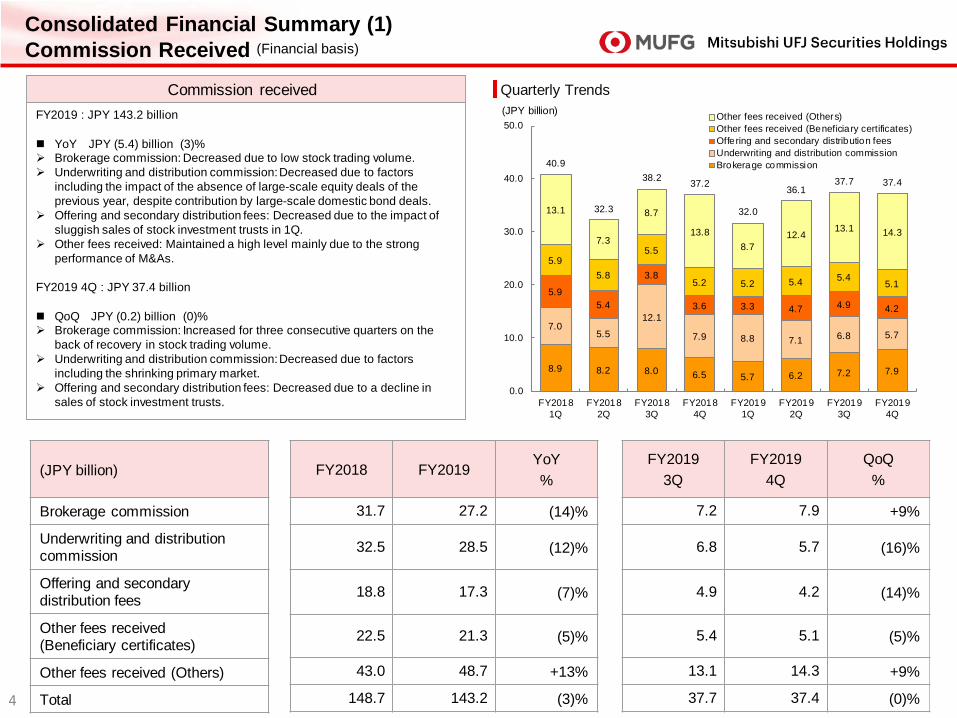
Consolidated Financial Summary (1) Commission Received (Financial basis)
Commission received FY2019 : JPY 143.2 billion
YoY JPY (5.4) billion (3)% Brokerage commission: Decreased due to low stock trading volume. Underwriting and distribution commission:Decreased due to factors
including the impact of the absence of large-scale equity deals of the previous year, despite contribution by large-scale domestic bond deals.
Offering and secondary distribution fees: Decreased due to the impact of sluggish sales of stock investment trusts in 1Q.
Other fees received: Maintained a high level mainly due to the strong performance of M&As.
FY2019 4Q : JPY 37.4 billion
QoQ JPY (0.2) billion (0)% Brokerage commission: Increased for three consecutive quarters on the
back of recovery in stock trading volume. Underwriting and distribution commission: Decreased due to factors
including the shrinking primary market. Offering and secondary distribution fees: Decreased due to a decline in
sales of stock investment trusts.
Quarterly Trends
(JPY billion)
Brokerage commission
Underwriting and distribution commission
Offering and secondary distribution fees
Other fees received(Beneficiary certificates)
Other fees received (Others)
Total
FY2018 FY2019YoY%
31.7 27.2 (14)%
32.5 28.5 (12)%
18.8 17.3 (7)%
22.5 21.3 (5)%
43.0 48.7 +13%
148.7 143.2 (3)%
FY20193Q
FY20194Q
QoQ%
7.2 7.9 +9%
6.8 5.7 (16)%
4.9 4.2 (14)%
5.4 5.1 (5)%
13.1 14.3 +9%
37.7 37.4 (0)%
(JPY billion)

5
(5.8)
4.4 (0.2)
5.2
26.4
6.0
15.1 11.8
43.227.1
24.820.7
5.6
27.5
21.935.0
7.6
15.5
11.5 10.32.7
5.1
11.1
10.145.0
47.1
36.1 36.3 34.838.6
48.3
57.0
(10.0)
0.0
10.0
20.0
30.0
40.0
50.0
60.0
FY20181Q
FY20182Q
FY20183Q
FY20184Q
FY20191Q
FY20192Q
FY20193Q
FY20194Q
Net financial revenueBonds and OthersStocks
Consolidated Financial Summary (2) Net Trading Income ・ Net Financial Revenue (Financial basis)
Net Trading Income ・ Net Financial RevenueFY2019 : JPY 178.8 billion
YoY JPY +14.2 billion +8% Domestic subsidiaries: Revenue decreased in total due to the sluggish equity
business resulting from factors including weak retail customer flow of foreign stocks, while the fixed income business increased revenue due to strong rates as interest rates fluctuated, and the accumulation of customer flow in the derivative business.
Overseas subsidiaries: Revenue increased significantly due to growth in the derivative and interest trading businesses in Europe and the strong performance in repo business in Americas.
FY2019 4Q : JPY 57.0 billion
QoQ JPY +8.6 billion +17% Domestic subsidiaries: The fixed income business increased revenue significantly
due to recovery in rates and customer flow in the derivative business on the back of a rebound in interest rate volatility.The equity business also increased revenue due to the accumulation of customer flow.
Overseas subsidiaries: Strong performance of repo business in Europe and the Americas partially covered the impact of the absence of derivative transactions of 3Q.
Quarterly Trends
(JPY billion)
Stocks
Bonds and Others
Net financial revenue
Total
FY2018 FY2019YoY%
3.5 59.5 -
115.9 90.1 (22)%
45.0 29.2 (35)%
164.6 178.8 +8%
FY20193Q
FY20194Q
QoQ%
15.1 11.8 (22)%
21.9 35.0 +59%
11.1 10.1 (8)%
48.3 57.0 +17%
(JPY billion)

6
20.5 20.0 20.7 20.2 17.6 19.2 21.8 21.0
28.0 25.2 26.4 24.9 26.127.5
27.9 28.9
6.06.0 6.1 5.8 6.2
5.96.0 6.0
8.28.0 8.3
7.3 8.47.6
8.0 7.9
6.76.7
7.37.2 7.6 7.5
7.4 8.05.2
3.24.5
4.1 4.8 3.33.7 3.8
75.0
69.473.5
69.7 71.1 71.375.0 75.9
0.0
10.0
20.0
30.0
40.0
50.0
60.0
70.0
80.0
90.0
FY20181Q
FY20182Q
FY20183Q
FY20184Q
FY20191Q
FY20192Q
FY20193Q
FY20194Q
Trading re lated expenses Personnel expenses Real estate expensesOffice cost Depreciation Others
Consolidated Financial Summary (3) SG & A (Financial basis)
SG & AFY2019 : JPY 293.5 billion
YoY JPY +5.7 billion +2% Domestic subsidiaries: Trading related expenses and provision for bonuses
that are linked to performance decreased. In addition, effects of curbing fixed costs in operation and cost cutting from branch office consolidations and other measures yielded results.
Overseas subsidiaries: In addition to an increase in provision for bonuses that are linked to performance, costs increased for retirement benefit expenses with a decline in European interest rates, and depreciation related to IT system investments for compliance with regulations, among others. Costs related to structural reforms and restructuring were also recorded.
FY2019 4Q : JPY 75.9 billion
QoQ JPY +0.8 billion +1% SG&A at overseas subsidiaries increased due to depreciation of the yen
against the pound.
Quarterly Trends(JPY billion)
(JPY billion)
Trading related expenses
Personnel expenses
Real estate expenses
Office cost
Depreciation
Others
Total
FY2018 FY2019YoY%
81.6 79.8 (2)%
104.6 110.6 +5%
24.1 24.3 +0%
31.9 32.1 +0%
28.1 30.6 +9%
17.2 15.8 (8)%
287.8 293.5 +2%
FY20193Q
FY20194Q
QoQ%
21.8 21.0 (3)%
27.9 28.9 +3%
6.0 6.0 (0)%
8.0 7.9 (0)%
7.4 8.0 +7%
3.7 3.8 +3%
75.0 75.9 +1%

7
0.0
20.0
40.0
60.0
80.0
100.0
120.0
FY2018 1QFY2018 2QFY2018 3QFY2018 4QFY2019 1QFY2019 2QFY2019 3QFY2019 4Q
Retail / Middle MarketsGlobal Markets BusinessInvestment Banking Business
(JPY billion)
Overview by Business Segments
Overview by Business Segments in FY2019 4Q The Retail / middle markets business and the global markets business
increased revenue for three and four consecutive quarters, respectively. The investment banking business also performed strongly.
Retail / Middle Markets: Sales recovered to the level before the abolition of profit and product sales targets with a tailwind from improvements of market conditions.
Global Markets: Overseas subsidiaries saw strong performance of repo business while struggled due to the absence of large-scale deals of 3Q. Domestic subsidiaries performed strongly by leveraging customer flow as interest rates fluctuated and the recording of profits upon closing positions, resulting in an overall increase in revenue.
Investment Banking: While overseas subsidiaries remained at the same level compared to 3Q due to the strong performance of debt underwriting, domestic subsidiaries slightly decreased revenue.
Quarterly Trends
* Figures are based on management accounting basis including MUSA.

8
AppendixConsolidated Statement of Income
Cumulative Quarter
FY2018 FY2019
Operating revenue 371,484 455,781
Commission received 148,788 143,291
Net trading income 119,559 149,668
Other operating revenue 3 4
Financial revenue 103,133 162,817
Financial expenses 58,085 133,616
Net operating revenue 313,399 322,164
SG & A 287,812 293,586
Operating profit (loss) 25,586 28,577
Non-operating income 18,863 21,542
Non-operating expenses 2,086 1,618
Ordinary profit 42,363 48,502
Extraordinary income 5,877 1,702
Extraordinary losses 1,379 2,470
Income taxes 10,574 15,390
Profit attributable to non-controlling interests 11,145 11,200
Profit attributable to owners of parent 25,141 21,142
FY2018 FY2019
1Q 2Q 3Q 4Q 1Q 2Q 3Q 4Q
92,611 92,925 91,152 94,794 97,828 106,826 117,999 133,125
40,974 32,379 38,218 37,216 32,012 36,117 37,720 37,441
37,354 31,575 24,606 26,022 32,114 33,555 37,162 46,836
3 - - - 4 0 - -
14,279 28,970 28,327 31,555 33,698 37,153 43,116 48,848
6,608 13,414 16,815 21,248 30,997 32,023 31,937 38,658
86,003 79,511 74,337 73,546 66,830 74,802 86,062 94,467
75,042 69,473 73,535 69,760 71,132 71,370 75,096 75,987
10,960 10,037 801 3,785 (4,301) 3,432 10,966 18,480
5,616 3,892 4,997 4,357 4,934 6,055 3,426 7,126
1,380 262 (103) 547 32 75 72 1,438
15,196 13,668 5,903 7,595 599 9,412 14,320 24,169
53 1,611 (1) 4,213 1 531 - 1,169
218 68 46 1,046 265 345 40 1,819
3,468 4,262 (575) 3,418 (441) 2,867 5,532 7,432
3,091 4,055 1,293 2,704 24 3,297 2,385 5,492
8,471 6,892 5,137 4,640 753 3,433 6,362 10,594
JPY million

9
As ofMar. 31,
2019
As ofMar. 31,
2020Change
ASSETS
Current assets 23,957 31,238 +7,281
Cash and deposits 1,977 2,185 +207
Trading products 10,607 12,869 +2,261
Loans secured by securities 8,981 13,241 +4,260
Others 2,390 2,941 +551
Non-current assets 551 627 +76
PP & E 28 32 +4
Intangible assets 108 106 (1)
Investments and other assets 414 488 +73
Total assets 24,508 31,866 +7,357
As ofMar. 31,
2019
As ofMar. 31,
2020Change
LIABILITIES
Current liabilities 21,670 29,128 +7,457
Trading products 9,321 11,765 +2,443
Borrowings secured by securities 6,173 10,234 +4,060
Short-term borrowings 2,517 3,259 +741
Others 3,657 3,868 +211
Non-current liabilities 1,885 1,789 (95)
Bonds payable 1,244 1,017 (227)
Long-term borrowings 628 753 +124
Others 12 19 +7
Total liabilities 23,559 30,922 +7,362
NET ASSETS
Shareholders’ equity 702 701 (1)
Accumulated other comprehensive income (30) (27) +3
Share acquisition rights 0 - (0)
Non-controlling interests 276 270 (6)
Total net assets 948 943 (4)
Total liabilities and net assets 24,508 31,866 +7,357
AppendixConsolidated Balance Sheet
JPY billion

10
36.226.7 32.3 31.4 26.9 31.8 31.7 32.0
31.937.4 23.5 29.3
24.525.7 31.3
37.3
68.264.2
55.960.8
51.457.6
63.169.3
0.0
10.0
20.0
30.0
40.0
50.0
60.0
70.0
80.0
FY181Q
FY182Q
FY183Q
FY184Q
FY191Q
FY192Q
FY193Q
FY194Q
Net Trading Income including Net Financial RevenueCommission received
6.1 5.4
(1.0)
0.9
(1.6)
2.2
4.7
7.8
(5.0)
0.0
5.0
10.0
15.0
20.0
25.0
FY181Q
FY182Q
FY183Q
FY184Q
FY191Q
FY192Q
FY193Q
FY194Q
9.3 8.4
(1.1)
5.7
(2.1)
3.8
6.4
11.5
(5.0)
0.0
5.0
10.0
15.0
20.0
25.0
FY181Q
FY182Q
FY183Q
FY184Q
FY191Q
FY192Q
FY193Q
FY194Q
11.5 13.1
0.0
5.0
10.0
15.0
20.0
25.0
30.0
FY2018 FY2019
22.4
19.7
0.0
5.0
10.0
15.0
20.0
25.0
30.0
FY2018 FY2019
126.9 122.5
122.1 118.9
249.1 241.5
0.0
50.0
100.0
150.0
200.0
250.0
300.0
FY2018 FY2019
Net Trading Income including Net Financial RevenueCommission received
AppendixMitsubishi UFJ Morgan Stanley Securities (MUMSS) (1)
Annual Performance TrendsNet operating revenue Ordinary profit (loss) Profit (loss) (owners of parent)(JPY billion) (JPY billion) (JPY billion)
Quarterly Performance Trends Net operating revenue Ordinary profit (loss) Profit (loss) (owners of parent)(JPY billion) (JPY billion) (JPY billion)
* Figures are on a consolidated basis, which include those of Mitsubishi UFJ Morgan Stanley PB Securities Co., Ltd. (MUMSPB).
11
389.4317.6 266.1
192.1257.2 287.6 324.3 287.6
365.5441.9
400.9
303.0290.8 266.2
409.7 487.0
58.4 68.7
39.0
68.5 4.4 5.7
6.65.4
0.0
100.0
200.0
300.0
400.0
500.0
600.0
700.0
800.0
900.0
FY20181Q
FY20182Q
FY20183Q
FY20184Q
FY20191Q
FY20192Q
FY20193Q
FY20194Q
JGBs for individual investorsForeign debt for individual investorsStock investment trusts
18.5 19.3 16.6 17.0 17.3 16.9 18.515.1
12.9 13.213.6 13.9 14.0 14.3
14.5
14.0
7.4 7.36.9 6.9 6.9 7.1
7.3
6.4
0.8 0.70.7 0.8 0.8 0.8
0.8
1.0
39.6 40.637.8 38.6 38.9 39.0
41.0
36.5
0
5
10
15
20
25
30
35
40
45
2018/6 2018/9 2018/12 2019/3 2019/6 2019/9 2019/12 2020/3
Stocks Bonds Inv estment trusts Others
.
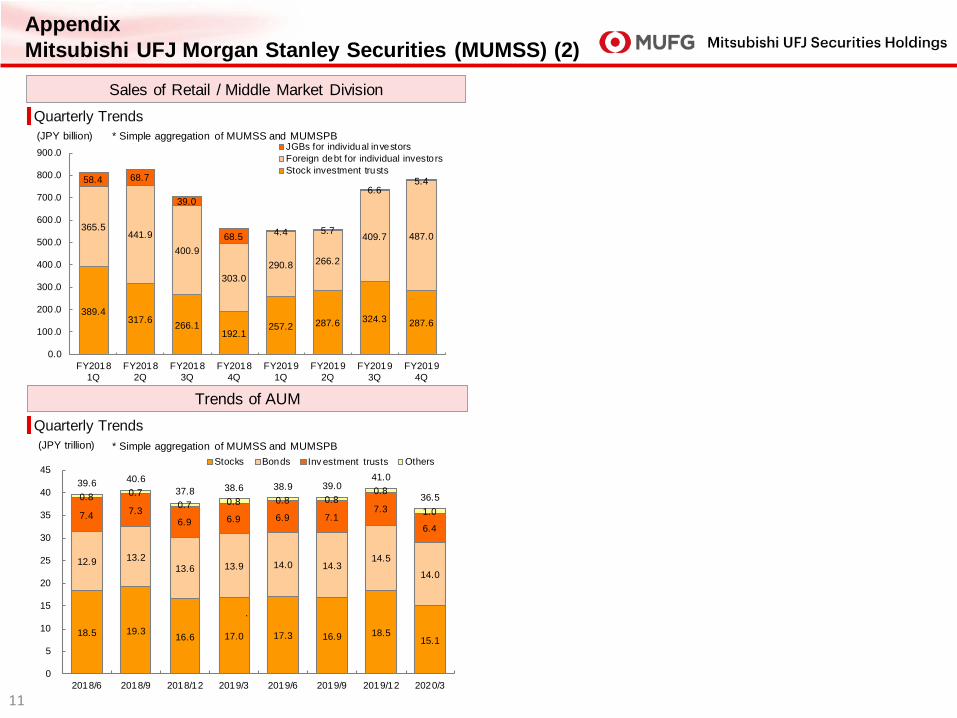
AppendixMitsubishi UFJ Morgan Stanley Securities (MUMSS) (2)
Sales of Retail / Middle Market DivisionQuarterly Trends(JPY billion)
Trends of AUMQuarterly Trends(JPY trillion) * Simple aggregation of MUMSS and MUMSPB
* Simple aggregation of MUMSS and MUMSPB

1212
AppendixMitsubishi UFJ Morgan Stanley Securities (MUMSS) (3)
*1 Source: REFINITIV, REFINITIV DealWatch (data compiled by Mitsubishi UFJ Morgan Stanley)Includes Japanese Straight Bonds, Ex-FILP Agency Bonds (incl. Expressway company's Bonds) and Municipal Bonds Related. Based on lead manager's credit.
*2 Source: REFINITIV (data compiled by Mitsubishi UFJ Morgan Stanley)Mitsubishi UFJ Morgan Stanley includes domestic offerings of Japanese issuers underwritten by Morgan Stanley MUFG Securities as well as global offerings of Japanese issuers underwritten by Morgan Stanley. Based on underwriting amount.
*3 Source: REFINITIV (data compiled by Mitsubishi UFJ Morgan Stanley)Any Japanese involvement announced including property acquisitions. Mitsubishi UFJ Morgan Stanley includes deals advised by Morgan Stanley.
Japan Domestic Debt*1
Rank Securities Firm Share(%)
1 Mizuho Securities 21.62 Mitsubishi UFJ Morgan Stanley 19.43 SMBC Nikko Securities 18.64 Nomura Securities 17.75 Daiwa Securities 17.66 Tokai Tokyo Securities 1.37 Goldman Sachs Japan 1.28 Shinkin Securities 0.89 SBI Securities 0.7
10 Okasan Securities 0.4
Japan Equity and Equity-linked*2
Rank Securities Firm Share(%)
1 Sumitomo Mitsui Financial Group 20.12 Nomura 18.83 Mitsubishi UFJ Morgan Stanley 16.44 Daiwa Securities Group 15.25 Mizuho Financial Group 14.26 Bank of America Merrill Lynch 4.87 Goldman Sachs & Co 4.38 JP Morgan 2.39 SBI Holdings 1.2
10 Credit Suisse 0.9
M&A Advisory / Based on Rank Value*3
Rank Financial Advisor JPY billion
1 Nomura 8,4742 Mitsubishi UFJ Morgan Stanley 7,5433 Mizuho Financial Group 6,8374 Bank of America Merrill Lynch 5,0315 JP Morgan 4,0056 Goldman Sachs & Co 3,9557 Deutsche Bank Group 2,5788 Deloitte 2,3429 Sumitomo Mitsui Financial Group 2,137
10 Citi 1,623
Investment banking business ~ League Table (from April, 2019 to March, 2020) In collaboration with Morgan Stanley, M&A Advisory is involved in a wide range of projects centered on cross-border trading, and maintained top-level position.
Debt and equity underwriting also maintained high presence in the overall investment banking business through involvement in large-scale deals.
Highly evaluated by leading media Awarded the Bond House of the year by Deal Watch Awarded the Best Corporate and Investment Bank by Asiamoney (*1) Awarded the Best Investment Bank in Japan by Euromoney (*2) Awarded the International M&A Financial Adviser of the Year by Mergermarket (*2)(*1) Awarded as MUFG and Morgan Stanley(*2) Awarded as Japanese Securities Joint Venture between MUFG and Morgan Stanley (comprising Mitsubishi UFJ Morgan Stanley Securities and
Morgan Stanley MUFG Securities)

1313
4.94.5
4.9
3.8 3.9 3.9 3.84.2
2.8 2.93.1
3.6
3.13.4 3.4 3.5
2.1
1.61.8
0.2
0.80.5 0.4
0.6
0.0
1.0
2.0
3.0
4.0
5.0
6.0
FY20181Q
FY20182Q
FY20183Q
FY20184Q
FY20191Q
FY20192Q
FY20193Q
FY20194Q
Net operating revenueSG&AOrdinary profi t
2.60 1.71 3.26
(0.90)1.46 1.51
4.07 5.39
2.87 2.77
1.48
(0.52)(0.44)
1.73
8.40 4.27
(0.78) (1.37) (0.89)
(1.54)(1.13)
(0.77) (0.87) (0.73)
4.69 3.11 3.86
(2.97)
(0.11)
2.47
11.60
8.93
(4.0)
(2.0)
0.0
2.0
4.0
6.0
8.0
10.0
12.0
14.0
FY20181Q
FY20182Q
FY20183Q
FY20184Q
FY20191Q
FY20192Q
FY20193Q
FY20194Q
AmericasEuropeAsiaTota l
6.68
12.44
6.61
13.97
(4.59) (3.51)
8.70
22.90
(5.0)
0.0
5.0
10.0
15.0
20.0
25.0
30.0
FY2018 FY2019
AmericasEuropeAsia
18.4
15.9
12.513.5
5.9
2.4
0.0
2.0
4.0
6.0
8.0
10.0
12.0
14.0
16.0
18.0
20.0
FY2018 FY2019
Net operating revenueSG&AOrdinary profi t
Appendixau Kabucom Securities Co., Ltd. and Overseas Business
au Kabucom Annual Performance Trends Trends(JPY billion)
Overseas Business Annual Performance TrendsOrdinary profit (loss) : Trends
*Figures are based on substantial basis including MUSA.
Overseas Business Quarterly Performance Trendsau Kabucom Quarterly Performance Trends Quarterly Trends Ordinary profit (loss) : Quarterly Trends(JPY billion)
(JPY billion)
(JPY billion) *Figures are based on substantial basis including MUSA.
EuropeAmericasAsiaTotal
EuropeAmericasAsiaTotal

14
349.0
296.7
54.6 37.1
0
50
100
150
200
250
300
350
400
Net operatingrevenue
SG&A Ordinary profit Profit
Japan JVau Kabucom
Net operating revenue of the Domestic Securities Companies is approximately JPY 350 billion on a simple sum basis.It includes the full net operating revenue from Morgan Stanley MUFG Securities Co., Ltd. (“MSMS”); this is one of the joint venture securities companies with Morgan Stanley in Japan and an associated company accounted for by using the equity-method.
“Domestic Securities Companies” consists of four companies including three joint venture companies with Morgan Stanley (“Japan JV”) and au Kabucom Securities Co., Ltd.
【Reference】 Domestic Securities Companies
Performance of FY 2019 Simple sum of the figures for the Domestic Securities Companies(JPY billion) FY 2019
Net operating revenue 349.0Japan JV 333.0
Mitsubishi UFJ Morgan Stanley Securities Co., Ltd.Consolidated base (“MUMSS” + “MUMSPB”) *1 241.5
Morgan Stanley MUFG Securities Co., Ltd. (“MSMS”) *2 91.5au Kabucom Securities Co., Ltd. (“au Kabucom”) 15.9
SG & A 296.7Japan JV 283.1
MUMSS Consolidated base 224.0MSMS 59.1
au Kabucom 13.5Ordinary profit 54.6Japan JV 52.1
MUMSS Consolidated base 19.7MSMS 32.4
au Kabucom 2.4Profit 37.1Japan JV 35.5
MUMSS Consolidated base(Profit attributable to owners of parent) 13.1
MSMS 22.4au Kabucom 1.5
(JPY billion)
* The figures in the graph above represent the simple sum of the Domestic Securities Companies.
*1 MUMSS Consolidated base includes Mitsubishi UFJ Morgan Stanley PBSecurities Co., Ltd. (MUMSPB).
*2 MSMS is an associated company accounted for by using the equity-method.
Domestic Securities Companies’ Performance

15
AppendixFinancial Soundness Indicators (Credit Rating, Capital Adequacy Ratio)
Capital Adequacy Ratio MUMSS (non-consolidated)
Capital adequacy ratio of MUMSS at FY2019 can be found on the following URL.
https://www.sc.mufg.jp/company/finance/cp_ratio.html
R&I JCR Moody’s S&P Fitch
Long-term AA- AA A1 A- -
Short-term a-1+ * - P-1 A-2 -
Long-term AA- AA A1 A A-
Short-term a-1+ * - P-1 A-1 F1
Long-term AA- ** AA ** A1 A -
Short-term - - P-1 A-1 -
Long-term - - - A A-
Short-term - - - A-1 F1
Long-term - - A1 A -
Mitsubishi UFJ Securities Holdings
Mitsubishi UFJ Morgan Stanley Securities
MUFG Securities EMEA plc
MUFG Securities (Canada), Ltd.
MUFG Securities (Europe) N.V.
*CP rating**Euro Medium Term Note Programme rating (senior bonds)
Credit Rating Capital Adequacy

16
9.8 9.3
12.5
9.2 9.7 9.4 8.7
19.8
0
5
10
15
20
25
2018/6 2018/9 2018/12 2019/3 2019/6 2019/9 2019/12 2020/3
Interest ratesEquitiesForeign exchangeTota l
9.8 9.3
12.5
9.2 9.7 9.48.7
19.8
0
5
10
15
20
25
2018/6 2018/9 2018/12 2019/3 2019/6 2019/9 2019/12 2020/3
Domestic Subsidiary Overseas Subsidiaries
(JPY billion) 2018/6 2018/9 2018/12 2019/3 2019/6 2019/9 2019/12 2020/3
Interest rates 7.5 7.4 10.1 7.2 7.6 7.3 7.1 18.0
Equities 2.0 2.1 2.5 1.7 2.6 2.9 1.7 1.4
Foreign exchange
0.9 0.9 1.2 0.8 0.7 0.5 0.2 0.6
Total 9.8 9.3 12.5 9.2 9.7 9.4 8.7 19.8
Quarterly trends of VaR by type of subsidiaryQuarterly trends of VaR by risk category
Historical simulation method (10-day holding period, 99% of confidence interval and 701-business day observation period)
(JPY billion) 2018/6 2018/9 2018/12 2019/3 2019/6 2019/9 2019/12 2020/3
Domestic Subsidiary
6.2 5.1 7.2 3.5 4.0 4.5 3.3 6.5
Overseas Subsidiaries
3.7 4.4 5.5 6.1 6.1 5.4 5.7 14.1
Total 9.8 9.3 12.5 9.2 9.7 9.4 8.7 19.8
Domestic Subsidiary: Mitsubishi UFJ Morgan Stanley Securities Overseas Subsidiaries: MUFG Securities EMEA plc , MUFG Securities Asia Limited ,
MUFG Securities (Canada), Ltd.
(JPY billion) (JPY billion)
AppendixMarket Risks
Methodology of VaR
Value at Risk (VaR) associated with the trading activities Since March 2020, credit risks at overseas subsidiaries have increased along with expanded market fluctuations due to the impact of
the novel coronavirus outbreak.

This document has been compiled solely for the purpose of providing information regarding the financial results for the fiscal year ended March 31, 2020, and is not intended as a solicitation or recommendation to invest in or dispose of the securities issued by the Company. This document was prepared based on information available as of April 30, 2020. Financial information and other information contained in this document are not subject to reviews by the accounting auditors. The facts and opinions presented in this document are facts that the Company acknowledged and opinions held by the Company as of the time of the preparation of this document. No guarantees or warranties are made by the Company as to the accuracy or completeness of the information contained therein, and such information is subject to change without notice. In addition, the Company is not liable for any omissions or errors in the data or representations contained in this document. Please note that all rights, including copyrights, to this document, in whole or in part, belong to Mitsubishi UFJ Securities Holdings Co., Ltd., and are not permitted to reproduce, distribute or transmit this document, digitally or otherwise in any format, for any purpose, without the express consent of Mitsubishi UFJ Securities Holdings Co., Ltd.