summary of consolidated financial statements for the third
TRANSCRIPT

―1―
Summary of Consolidated Financial Statements for the Third Quarter of Fiscal Year Ending December 31, 2021 (IFRS)
October 29, 2021
Name of listed company: Nabtesco Corporation Stock listed on: First Section of the Tokyo Stock Exchange Code number: 6268 URL: https://www.nabtesco.com Representative: Title: President and CEO Name: Katsuhiro Teramoto Inquiries: Title: General Manager, Corporate Communication Div. Name: Yasushi Minegishi TEL: +81-3-5213-1134 Scheduled date for filing of quarterly report: November 12, 2021 Scheduled dividend payment date: - Quarterly material to supplement the financial results: Yes Quarterly financial results conference: Yes (Teleconference for institutional investors and financial analysts)
(Amounts rounded to the nearest million)
1. Consolidated Results for the First Nine-month Period of FY 2021 (January 1, 2021 to September 30, 2021) (1) Consolidated Operating Results (Percentages indicate year-on-year change)
Net sales Operating income Income
before tax Net income
Net income attributable to owners
of the parent
Total comprehensive income
Million yen % Million yen % Million yen % Million yen % Million yen % Million yen %
First nine-month period, FY 2021
214,117 7.2 20,808 10.5 101,743 390.6 65,435 341.6 63,078 384.4 69,438 403.9
First nine-month period, FY 2020
199,800 (5.5) 18,838 2.5 20,739 5.9 14,819 8.3 13,022 6.3 13,780 17.7
Basic earnings per share Diluted earnings per share
Yen Yen
First nine-month period, FY 2021 518.71 518.61 First nine-month period, FY 2020 104.90 104.86
(2) Consolidated Financial Position
Total assets Total equity Equity attributable to owners of the parent
Ratio of equity attributable to owners of
the parent
Million yen Million yen Million yen %
As of September 30, 2021 482,978 248,572 234,718 48.6 As of December 31, 2020 351,723 211,641 198,031 56.3
2. Dividends
Dividends per share
First quarter Second quarter Third quarter Year end Full year
Yen Yen Yen Yen Yen
FY 2020 – 41.00 – 34.00 75.00 FY 2021 – 38.00
FY 2021 (Forecast) – 39.00 77.00 (Note) Revisions to the latest dividend forecasts: None
3. Forecast of Consolidated Operating Results for FY 2021 (January 1, 2021 to December 31, 2021)
(Percentages indicate year-on-year change for full year)
Net sales Operating income Income
before tax Net income attributable to owners of the parent
Total basic earnings
per share
Full Year Million yen % Million yen % Million yen % Million yen % Yen
306,000 9.5 33,000 15.7 169,000 401.2 110,800 440.4 914.30 (Note) Revisions to the latest forecast of operating results: None The valuation gain due to the exclusion of Harmonic Drive Systems Inc. from application of the equity-method in the forecast of consolidated operating results as noted above have not changed from the previously announced forecast, which was described in “Summary of Consolidated Financial Statements for the Second Quarter of Fiscal Year Ending December 31, 2021 (IFRS)” dated July 30, 2021 because it is difficult to predict the stock price as of the end of December 2021.

―2―
* Matters of note: (1) Changes in significant subsidiaries during the first nine-month period of FY 2021 (Changes in specified subsidiaries
resulting in a change in the scope of consolidation): None Newly added: 0 (Company name: – ) Excluded: 0 (Company name: – )
(2) Changes in accounting policies and accounting estimates
1) Changes in accounting policies required by IFRS: None 2) Other changes in accounting policies: None 3) Changes in accounting estimates: None
(3) Shares outstanding (Common shares) 1) Number of shares outstanding (including treasury stock) as of the end of the term 2) Amount of treasury stock 3) Average number of shares during the term
1) As of September 30, 2021 121,064,099 As of December 31, 2020 125,133,799
2) As of September 30, 2021 1,090,791 As of December 31, 2020 990,749
3) January 1, 2021 to September 30, 2021 121,605,124 January 1, 2020 to September 30, 2020 124,135,100
* Current status of audit procedures This “Summary of Consolidated Financial Statements” is not subject to audit procedures as stipulated under the Financial
Instruments and Exchange Act, and the audit procedures based on the said Act have not been completed as of the date of publication of this summary.
* Description concerning proper use of the forecast of operating results and other remarks:
Descriptions in this document concerning future figures including forecasts for operating results, etc. are based on currently available information and certain assumptions that the Company considers reasonable. Actual results may vary significantly from such forecasts due to a variety of factors.

Summary of Consolidated Financial Statements for the Third Quarter of Fiscal Year Ending December 31, 2021
―3―
1. Qualitative Information on Consolidated Operating Results for the Nine Months Ended September 30, 2021
(1) Analysis of Consolidated Operating Results
1) Amount of orders received, net sales and operating income [Amount of orders received]
(Million yen)
First nine-month period of consolidated FY 2020
(January 1, 2020 to September 30, 2020)
First nine-month period of consolidated FY 2021
(January 1, 2021 to September 30, 2021)
Change (%)
Component Solutions 76,979 104,795 36.1
Transport Solutions 60,201 45,958 (23.7)
Accessibility Solutions 57,954 55,981 (3.4)
Others 12,417 16,375 31.9
Total 207,551 223,110 7.5
[Net sales]
(Million yen)
First nine-month period of consolidated FY 2020
(January 1, 2020 to September 30, 2020)
First nine-month period of consolidated FY 2021
(January 1, 2021 to September 30, 2021)
Change (%)
Component Solutions 77,582 100,198 29.2
Transport Solutions 57,306 47,869 (16.5)
Accessibility Solutions 53,046 52,913 (0.3)
Others 11,866 13,137 10.7
Total 199,800 214,117 7.2
[Operating income]
(Million yen)
First nine-month period of consolidated FY 2020
(January 1, 2020 to September 30, 2020)
First nine-month period of consolidated FY 2021
(January 1, 2021 to September 30, 2021)
Change (%)
Component Solutions 11,867 16,703 40.7
Transport Solutions 4,720 3,728 (21.0)
Accessibility Solutions 4,913 5,193 5.7
Others 1,148 1,801 56.8
Corporate or Elimination (3,810) (6,617) -
Total 18,838 20,808 10.5
Summary of Consolidated Financial Statements for the Third Quarter of Fiscal Year Ending December 31, 2021
―4―
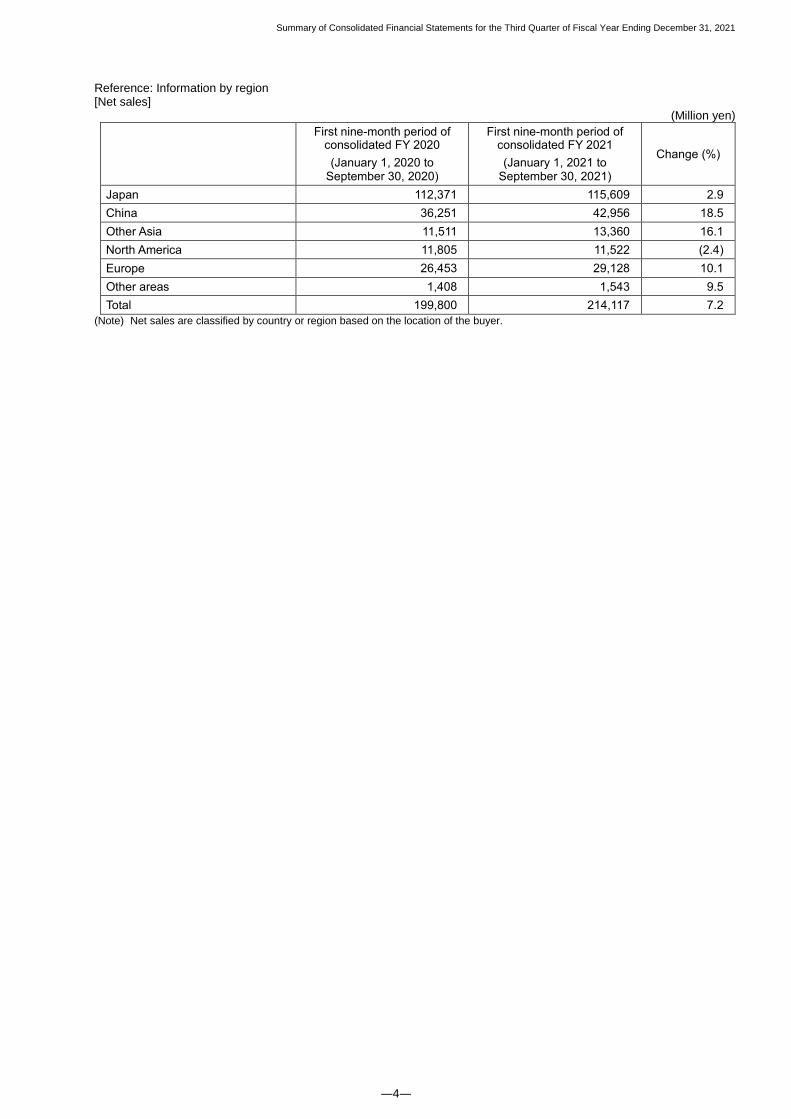
Reference: Information by region [Net sales]
(Million yen)
First nine-month period of consolidated FY 2020
(January 1, 2020 to September 30, 2020)
First nine-month period of consolidated FY 2021
(January 1, 2021 to September 30, 2021)
Change (%)
Japan 112,371 115,609 2.9
China 36,251 42,956 18.5
Other Asia 11,511 13,360 16.1
North America 11,805 11,522 (2.4)
Europe 26,453 29,128 10.1
Other areas 1,408 1,543 9.5
Total 199,800 214,117 7.2
(Note) Net sales are classified by country or region based on the location of the buyer.

Summary of Consolidated Financial Statements for the Third Quarter of Fiscal Year Ending December 31, 2021
―5―
(2) Analysis of Financial Position
1) Assets, liabilities and equity (Million yen)
As of the end of the previous consolidated fiscal year
(December 31, 2020)
As of the end of the first nine-month period of the current
consolidated fiscal year
(September 30, 2021)
Change
Assets 351,723 482,978 131,254
Liabilities 140,083 234,405 94,323
Equity 211,641 248,572 36,932

Summary of Consolidated Financial Statements for the Third Quarter of Fiscal Year Ending December 31, 2021
―6―
2. Summary of Quarterly Consolidated Financial Statements and Notes Thereto
(1) Summary of Quarterly Consolidated Statement of Financial Position
(Million yen)
Note No.
End of consolidated FY 2020
(as of December 31, 2020)
End of the first nine-month period of consolidated FY 2021
(as of September 30, 2021)
Assets
Current assets
Cash and cash equivalents 64,665 115,335
Trade receivables 74,632 62,593
Contract assets 1,230 1,266
Other receivables 1,114 911
Inventories 36,505 45,690
Other financial assets 2,582 9,427
Other current assets 2,382 3,733
Total 183,110 238,954
Assets held for sales - 49,465
Total current assets 183,110 288,419
Non-current assets
Property, plant and equipment 89,522 88,646
Intangible assets 3,905 3,999
Right-of-use assets 7,558 7,292
Goodwill 14,658 14,933
Investment property 2,192 2,151
Investments accounted for using the equity method
34,887 14,923
Other financial assets 12,646 59,498
Deferred tax assets 2,016 2,088
Other non-current assets 1,230 1,028
Total non-current assets 168,614 194,558
Total assets 351,723 482,978

Summary of Consolidated Financial Statements for the Third Quarter of Fiscal Year Ending December 31, 2021
―7―
(Million yen)
Note No.
End of consolidated FY 2020
(as of December 31, 2020)
End of the first nine-month period of consolidated FY 2021
(as of September 30, 2021)
Liabilities and equity
Liabilities
Current liabilities
Operating payables 44,838 48,892
Contract liabilities 5,763 5,835
Bonds and borrowings 37,001 23,843
Other payables 9,723 7,754
Income taxes payable 6,700 17,776
Provisions 1,065 1,321
Lease liabilities 2,209 2,056
Other financial liabilities - 77,879
Other current liabilities 6,362 9,387
Total current liabilities 113,662 194,744
Non-current liabilities
Bonds and borrowings 2,865 2,865
Lease liabilities 6,291 6,099
Liabilities concerning retirement benefit 10,211 10,487
Deferred tax liabilities 4,949 18,384
Other financial liabilities 69 -
Other non-current liabilities 2,035 1,826
Total non-current liabilities 26,421 39,661
Total liabilities 140,083 234,405
Equity
Capital stock 10,000 10,000
Share premium 14,998 14,904
Retained earnings 173,988 211,682
Treasury shares (2,471) (4,782)
Other components of equity 1,515 2,914
Equity attributable to owners of the parent
198,031 234,718
Non-controlling interests 13,610 13,855
Total equity 211,641 248,572
Total liabilities and equity 351,723 482,978

Summary of Consolidated Financial Statements for the Third Quarter of Fiscal Year Ending December 31, 2021
―8―
(2) Summary of Consolidated Statements of Income and Consolidated Statements of Comprehensive Income Summary of Consolidated Statements of Income
First Nine-month Period (Million yen)
Note No.
First nine-month period of consolidated FY 2020
(January 1, 2020 to September 30, 2020)
First nine-month period of consolidated FY 2021
(January 1, 2021 to September 30, 2021)
Net sales 2 199,800 214,117
Cost of sales (146,890) (155,532)
Gross profit 52,911 58,585
Other income 2,730 866
Selling, general and administrative expense
(36,396) (38,318)
Other expenses (407) (324)
Operating income 2 18,838 20,808
Financial income 197 126,622
Financial costs (683) (47,187)
Equity in earnings of affiliates 2,387 1,500
Profit before tax 20,739 101,743
Income tax expense (5,920) (36,308)
Net income 14,819 65,435
Net income attributable to
Owners of the parent 13,022 63,078
Non-controlling interests 1,797 2,357
Net income 14,819 65,435
Net income per share
Basic earnings per share 104.90 518.71
Diluted earnings per share 104.86 518.61

Summary of Consolidated Financial Statements for the Third Quarter of Fiscal Year Ending December 31, 2021
―9―
Summary of Consolidated Statements of Comprehensive Income
First Nine-month Period
(Million yen)
Note No.
First nine-month period of consolidated FY 2020
(January 1, 2020 to September 30, 2020)
First nine-month period of consolidated FY 2021
(January 1, 2021 to September 30, 2021)
Net income 14,819 65,435
Other comprehensive income
Items that will not be reclassified to profit or loss
Remeasurements of the net defined benefit liability (asset)
4 -
Net changes in financial assets measured at fair value through other comprehensive income
(802) 454
Share of other comprehensive income for equity method affiliates
199 -
Total components that will not be reclassified to profit or loss
(599) 454
Components that will be reclassified to profit or loss
Exchange differences on foreign operations
(440) 3,549
Total components that will be reclassified to profit or loss
(440) 3,549
Other comprehensive income after taxes (1,039) 4,003
Total comprehensive income 13,780 69,438
Comprehensive income attributable to
Owners of the parent 12,153 66,310
Non-controlling interests 1,627 3,128
Total comprehensive income 13,780 69,438
Summary of Consolidated Financial Statements for the Third Quarter of Fiscal Year Ending December 31, 2021
―10―
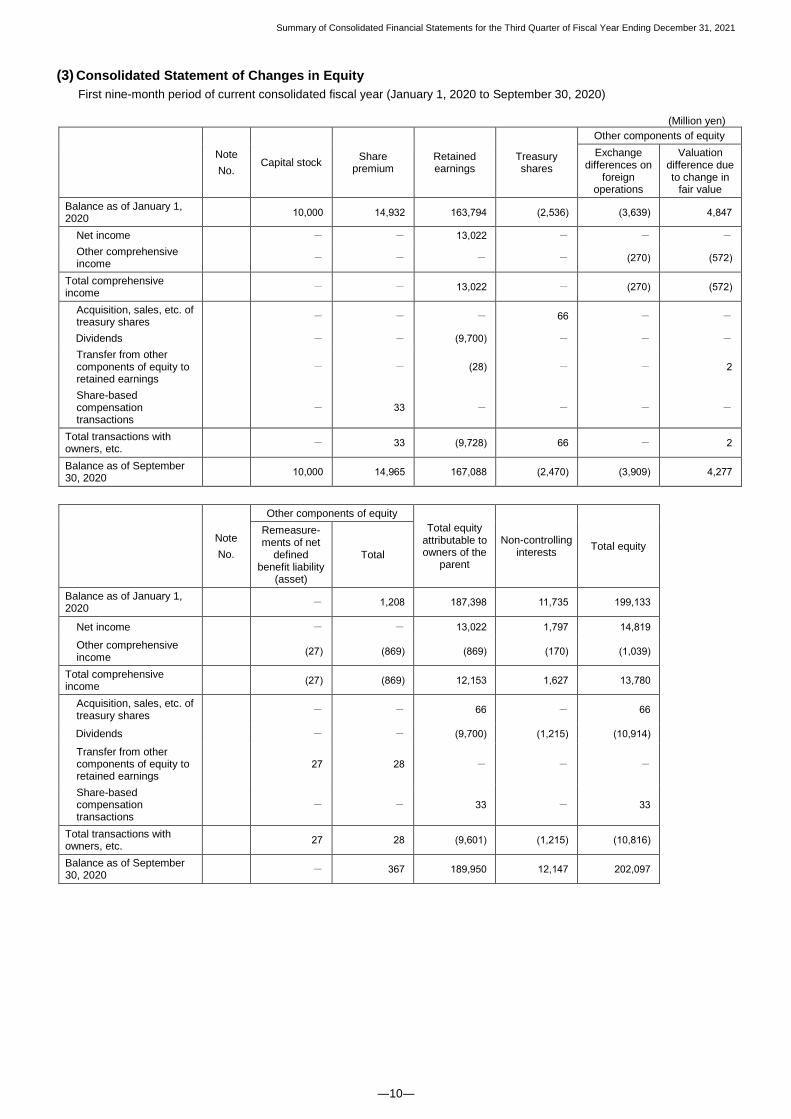
(3) Consolidated Statement of Changes in Equity
First nine-month period of current consolidated fiscal year (January 1, 2020 to September 30, 2020)
(Million yen)
Note
No. Capital stock
Share premium
Retained earnings
Treasury shares
Other components of equity
Exchange differences on
foreign operations
Valuation difference due to change in
fair value
Balance as of January 1, 2020
10,000 14,932 163,794 (2,536) (3,639) 4,847
Net income - - 13,022 - - -
Other comprehensive income
- - - - (270) (572)
Total comprehensive income
- - 13,022 - (270) (572)
Acquisition, sales, etc. of treasury shares
- - - 66 - -
Dividends - - (9,700) - - -
Transfer from other components of equity to retained earnings
- - (28) - - 2
Share-based compensation transactions
- 33 - - - -
Total transactions with owners, etc.
- 33 (9,728) 66 - 2
Balance as of September 30, 2020
10,000 14,965 167,088 (2,470) (3,909) 4,277
Note
No.
Other components of equity
Total equity attributable to owners of the
parent
Non-controlling interests
Total equity
Remeasure-ments of net
defined benefit liability
(asset)
Total
Balance as of January 1, 2020 - 1,208 187,398 11,735 199,133
Net income - - 13,022 1,797 14,819
Other comprehensive income
(27) (869) (869) (170) (1,039)
Total comprehensive income (27) (869) 12,153 1,627 13,780
Acquisition, sales, etc. of treasury shares
- - 66 - 66
Dividends - - (9,700) (1,215) (10,914)
Transfer from other components of equity to retained earnings
27 28 - - -
Share-based compensation transactions
- - 33 - 33
Total transactions with owners, etc.
27 28 (9,601) (1,215) (10,816)
Balance as of September 30, 2020 - 367 189,950 12,147 202,097

Summary of Consolidated Financial Statements for the Third Quarter of Fiscal Year Ending December 31, 2021
―11―
First nine-month period of current consolidated fiscal year (January 1, 2021 to September 30, 2021)
(Million yen)
Note
No. Capital stock
Share premium
Retained earnings
Treasury shares
Other components of equity
Exchange differences on
foreign operations
Valuation difference due to change in
fair value
Balance as of January 1, 2021
10,000 14,998 173,988 (2,471) (3,348) 4,863
Net income - - 63,078 - - -
Other comprehensive income
- - - - 2,784 448
Total comprehensive income - - 63,078 - 2,784 448
Acquisition, sales, etc. of treasury shares
- - (23) (20,706) - -
Cancellation of treasury shares
- - (18,394) 18,394 - -
Dividends - - (8,800) - - -
Transfer from other components of equity to retained earnings
- - 1,833 - - (1,833)
Share-based compensation transactions
- (94) - - - -
Total transactions with owners, etc.
- (94) (25,385) (2,311) - (1,833)
Balance as of September 30, 2021
10,000 14,904 211,682 (4,782) (564) 3,478
Note
No.
Other components of equity
Total equity attributable to owners of the
parent
Non-controlling interests
Total equity Remeasure-ments of net
defined benefit liability
(asset)
Total
Balance as of January 1, 2021
- 1,515 198,031 13,610 211,641
Net income - - 63,078 2,357 65,435
Other comprehensive income
- 3,232 3,232 771 4,003
Total comprehensive income - 3,232 66,310 3,128 69,438
Acquisition, sales, etc. of treasury shares
- - (20,728) - (20,728)
Cancellation of treasury shares
- - - - -
Dividends - - (8,800) (2,883) (11,684)
Transfer from other components of equity to retained earnings
- (1,833) - - -
Share-based compensation transactions
- - (94) - (94)
Total transactions with owners, etc.
- (1,833) (29,623) (2,883) (32,506)
Balance as of September 30, 2021
- 2,914 234,718 13,855 248,572

Summary of Consolidated Financial Statements for the Third Quarter of Fiscal Year Ending December 31, 2021
―12―
(4) Notes on the Summary of Quarterly Consolidated Financial Statements
1. Notes Relating to the Going Concern Assumption None
2. Business Segments
(1) Summary of reportable segments The Group’s reportable segments are components of the Group about which separate financial statement is available that is evaluated regularly at the Board of Directors’ meetings in deciding how to allocate the management resources and in assessing performance.
The Group classifies its business segments into the following three reportable segments, based on the similarity of business models: 1) the “Component Solutions Business;” 2) the “Transport Solutions Business;” and 3) the “Accessibility Solutions Business.”
The main lines of business of each reportable segment are as below.
Business segment Main lines of business
Component Solutions Business The design, manufacture, sale, maintenance and repair of industrial robot components and equipment for construction machinery and its components
Transport Solutions Business
The design, manufacture, sale, maintenance and repair of brake systems and automatic door operating systems for railroad vehicles, aircraft components, brake systems and drive control units for vehicles, control systems for marine vessels, and components thereof
Accessibility Solutions Business The design, manufacture, sale, installation, maintenance and repair of automatic door operating systems for buildings and general industry, platform safety systems, and components thereof
(2) Information on reportable segments I. For the nine months ended September 30, 2020 (January 1, 2020 to September 30, 2020)
(Million yen)
Reportable segments
Others Total Adjustments
Amount stated in summary of consolidated statements of
income
Component Solutions
Transport Solutions
Accessibility Solutions
Total
Net sales
Sales to external customers
77,582 57,306 53,046 187,934 11,866 199,800 - 199,800
Inter-segment sales 1,519 813 8 2,340 181 2,521 (2,521) -
Total sales 79,101 58,119 53,053 190,274 12,047 202,321 (2,521) 199,800
Segment income
(Operating income) 11,867 4,720 4,913 21,500 1,148 22,649 (3,810) 18,838
Finance income - 197
Finance costs - (683)
Equity in earnings of affiliates
- 2,387
Income before tax - 20,739
Notes: 1. “Others” is a business segment that is not a reportable segment and consists of businesses that are engaged in the design, manufacture, sale, maintenance and repair of packaging machines, three-dimensional model production device, machine tools, and components thereof.
2. Adjustment to sales is as a result of eliminations of inter-segment transactions. 3. Adjustment to segment income (operating income) is total profit/loss, etc. that are not allocated to the respective segments.

Summary of Consolidated Financial Statements for the Third Quarter of Fiscal Year Ending December 31, 2021
―13―
II. For the nine months ended September 30, 2021 (January 1, 2021 to September 30, 2021) (Million yen)
Reportable segments
Others Total Adjustments
Amount stated in summary of consolidated statements of
income
Component Solutions
Transport Solutions
Accessibility Solutions
Total
Net sales
Sales to external customers
100,198 47,869 52,913 200,980 13,137 214,117 - 214,117
Inter-segment sales
1,849 853 2 2,705 295 3,000 (3,000) -
Total sales 102,047 48,722 52,915 203,684 13,432 217,116 (3,000) 214,117
Segment income
(Operating income) 16,703 3,728 5,193 25,625 1,801 27,425 (6,617) 20,808
Financial income - 126,622
Financial costs - (47,187)
Equity in earnings of affiliates
- 1,500
Income before tax - 101,743
Notes: 1. “Others” is a business segment that is not a reportable segment and consists of businesses that are engaged in the design, manufacture, sale, maintenance and repair of packaging machines, three-dimensional model production devices, machine tools, and components thereof.
2. Adjustment to sales is as a result of eliminations of inter-segment transactions. 3. Adjustment to segment income (operating income) is total profit/loss, etc. that are not allocated to the respective segments.

Summary of Consolidated Financial Statements for the Third Quarter of Fiscal Year Ending December 31, 2021
―14―
3. Other Information
(1) Order Backlog by Business Segment
Reportable segments
As of the end of the first nine-month period of consolidated FY 2020
(September 30, 2020)
As of the end of the first nine-month period of consolidated FY 2021
(September 30, 2021)
Amount (million yen) % to total Amount (million yen) % to total
Component Solutions 27,144 20.6 36,132 25.8
Transport Solutions 59,237 44.9 52,000 37.2
Accessibility Solutions 37,012 28.1 41,400 29.6
Others 8,521 6.4 10,406 7.4
Total 131,914 100.0 139,937 100.0