summary of consolidated financial statements for the year
TRANSCRIPT

1
Disclaimer: This is a Japanese-English translation of the summary of financial statements of the Company produced for your convenience. Since no auditor audited this report, officially only the Japanese version is assumed to be the summary of financial statements of the Company. This summary does not constitute any guarantee and will not compensate any losses and/or damage stemming from actions taken based on these statements. In the case that there is any discrepancy between the Japanese and English versions, the Japanese version is assumed to be correct.
Summary of Consolidated Financial Statements for the Year Ended March 31, 2006
May 12, 2006 Listed Company Name: Nisshin Seifun Group Inc. Registered on Tokyo Stock Exchange Securities Code: 2002 and Osaka Securities Exchange URL: http://www.nisshin.com. Location of head office: Tokyo Representative: Hiroshi Hasegawa, President Contact: Izumi Inagaki, General Manager of Public Communications Group, General Administration Division Tel.: +81-3-5282-6650 Date of board meeting to approve results: May 12, 2006 U.S. GAAP: Not adopted 1. Consolidated Financial Results for the Year Ended March 31, 2006 (April 1, 2005 to March 31, 2006)
Figures shown are rounded down to the nearest million yen.
(1) Consolidated Business Results
Net sales Operating income Ordinary income Millions of yen % Millions of yen % Millions of yen %
2006 421,359 1.2 22,169 (3.2) 24,774 (1.4) 2005 416,222 (4.1) 22,896 5.2 25,120 9.7
Net income Net income per
share Diluted net income
per share Return on
shareholders’ equity Ordinary income to
assets Ordinary income to
net sales Millions of yen % Yen Yen % % %
2006 13,541 (0.4) 52.80 52.77 5.4 6.4 5.92005 13,597 17.5 58.06 58.00 5.8 6.9 6.0
Notes: 1. Equity in earnings of subsidiaries and affiliated companies: FY2006: ¥1,505 million; FY2005: ¥1,011 million 2. Average number of outstanding shares during the year (consolidated): FY2006: 253,143,692; FY2005: 231,210,789 3. Changes in accounting principles: None 4. Percentages for net sales, operating income, ordinary income, and net income represent the changes from the previous period. 5. On November 18, 2005 the company undertook a 1.1 for 1 common stock split. 6. Assuming that the stock split had taken place at the beginning of the previous fiscal period, FY2005 figures would be as follows: net income per share ¥52.79;
diluted net income per share ¥52.73.
(2) Consolidated Financial Position
Total assets Shareholders' equity Shareholders' equity ratio Shareholders’ equity per share
Millions of yen Millions of yen % Yen 2006 399,899 264,535 66.2 1,046.00 2005 372,968 241,282 64.7 1,042.92
Notes: 1. Number of shares outstanding at year-end (consolidated): FY2006: 252,735,048; FY2005: 231,187,493 2. Assuming that the stock split had taken place at the beginning of the previous fiscal period, FY2005 shareholders’ equity per share would be ¥948.11.
(3) Consolidated Cash Flows
Cash flows from operating activities
Cash flows from investing activities
Cash flows from financing activities
Cash and cash equivalents at end of year
Millions of yen Millions of yen Millions of yen Millions of yen 2006 21,054 (25,297) (7,274) 42,803 2005 21,567 (17,590) (4,317) 54,047
(4) Scope of Consolidation and Equity Method
Number of consolidated subsidiaries: 39 Number of non-consolidated subsidiaries accounted for by the equity method: 1 Number of affiliates accounted for by the equity method: 9
(5) Changes in the Scope of Consolidation and Equity Method
Newly consolidated subsidiaries: 3 Subsidiaries excluded from the scope of consolidation: 1 Companies newly accounted for by the equity method: 1 Companies excluded from the scope of the equity method: 1
2. Forecasts of Consolidated Business Results for the Year Ending March 31, 2007
Net sales Ordinary income Net income Millions of yen Millions of yen Millions of yen
Mid-term 212,000 11,200 5,700 Full year 435,000 25,300 14,000
Expected net income per share (year-end): ¥55.39 Note: Please refer to pages 13-16 of this statement regarding assumptions for the above forecasts and other related subjects.

2
I. Business Group Performance
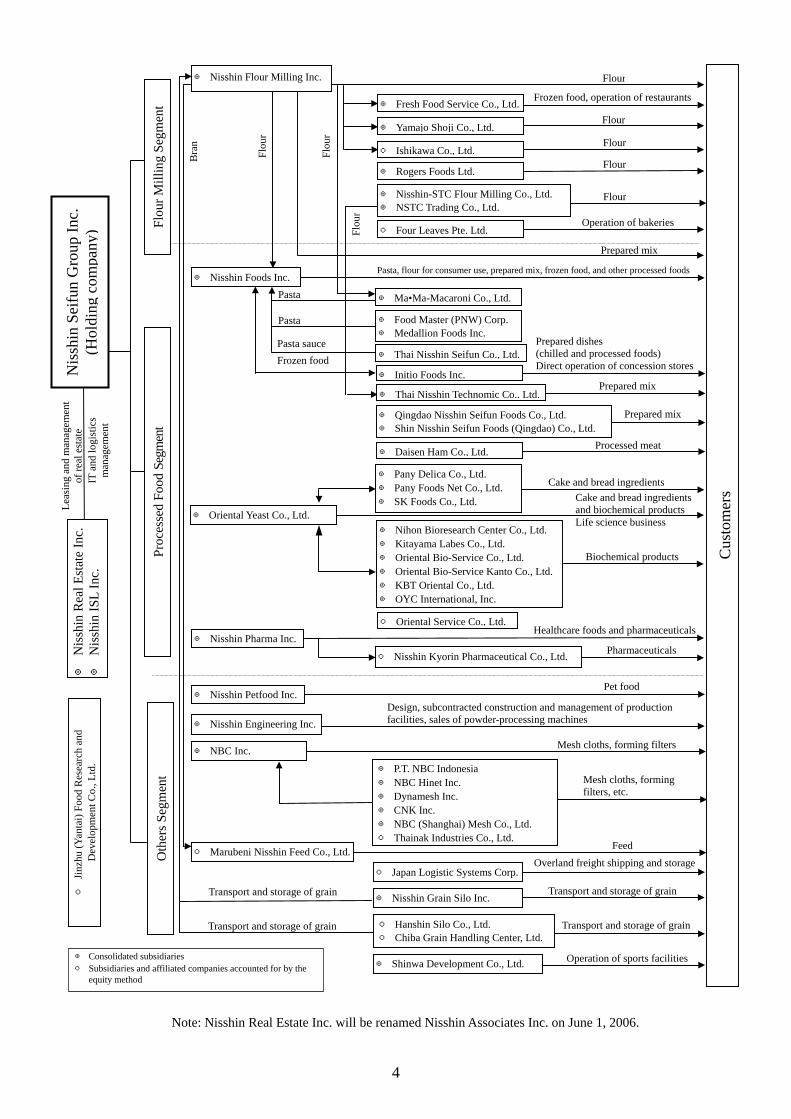
Nisshin Seifun Group consists of 48 subsidiaries and 15 affiliates. The following is a description of the businesses of the group and the relationships among the subsidiaries and affiliates within their respective business segments. The business operations are grouped by business segment.
(1) Flour Milling Segment
Nisshin Flour Milling Inc., a consolidated subsidiary, produces flour and bran, a by-product, and sells them through sales agents. Fresh Food Service Co., Ltd., a consolidated subsidiary, primarily sells frozen foods and their ingredients and operates restaurants serving food using flour-based commercial ingredients. It purchases flour and other ingredients from Nisshin Flour Milling. Yamajo Shoji Co., Ltd., a consolidated subsidiary, and Ishikawa Co., Ltd., an affiliate accounted for by the equity method, are Nisshin Flour Milling sales agents. Ishikawa also sells packaging materials to Nisshin Flour Milling.
Rogers Foods Ltd. in Canada and Nisshin-STC Flour Milling Co., Ltd. in Thailand, both consolidated subsidiaries, produce flour and sell it in the North American and Southeast Asian markets, respectively. Four Leaves Pte. Ltd., an affiliate accounted for by the equity method, operates bakeries, primarily in Singapore.
(2) Processed Food Segment
Nisshin Foods Inc., a consolidated subsidiary, produces and sells prepared mix and other processed food products. It sells flour for household use purchased from Nisshin Flour Milling and frozen foods and other processed foods procured from companies outside Nisshin Seifun Group. Ma•Ma-Macaroni Co., Ltd., a consolidated subsidiary, produces pasta whose primary ingredient is flour produced by Nisshin Flour Milling and sells the pasta through Nisshin Foods. Initio Foods Inc., a consolidated subsidiary, produces and sells chilled and prepared dishes and also directly operates concessions in stores including department stores. SANKO Co., Ltd., formerly a consolidated subsidiary, was taken over in a merger by Initio Foods in October 2005. Daisen Ham Co., Ltd., also a consolidated subsidiary, produces and sells processed meat products.
Medallion Foods Inc., a consolidated subsidiary in the U.S., produces pasta and Thai Nisshin Seifun Co., Ltd., a consolidated subsidiary in Thailand, produces pasta sauce and frozen food products. Nisshin Foods is the primary importer and seller of these products in Japan. Thai Nisshin Technomic Co., Ltd., a consolidated subsidiary, manufactures prepared mix and sells it in Southeast Asia, while Qingdao Nisshin Seifun Foods Co., Ltd., a consolidated subsidiary, manufactures and sells prepared mix in mainland China. In order to expand supply capacity in response to growing sales in China, the Company established another consolidated subsidiary, Shin Nisshin Seifun Foods (Qingdao) Co., Ltd., and is currently constructing a factory, due to come on line in December 2006.
Oriental Yeast Co., Ltd., a consolidated subsidiary, manufactures and sells cake and bread ingredients and biochemical products, as well as operating a life science business.
Nisshin Pharma Inc., a consolidated subsidiary, manufactures and sells healthcare foods and pharmaceuticals. Nisshin Kyorin Pharmaceutical Co., Ltd., an affiliate accounted for by the equity method, manufactures and sells pharmaceuticals.

3
(3) Others Segment Nisshin Petfood Inc., a consolidated subsidiary, manufactures and sells pet foods. Nisshin Engineering Inc., a consolidated subsidiary, undertakes design, subcontracted construction and
management of production and processing facilities for grain, food products, and chemical products. In addition, it manufactures and sells powder-processing machines and engages in powder-processing, as well as engaging in subcontracted construction for some Nisshin Seifun Group companies.
NBC Inc., a consolidated subsidiary, manufactures and sells mesh cloths and forming filters. Marubeni Nisshin Feed Co., Ltd., an affiliate accounted for by the equity method, manufactures and sells
compound feed. Japan Logistic Systems Corp., an affiliate accounted for by the equity method, is engaged in overland
freight shipping and storage. It ships and stores some of the Group's products. Nisshin Grain Silo Inc., a consolidated subsidiary, Hanshin Silo Co., Ltd. and Chiba Grain Handling Center, Ltd., affiliates accounted for by the equity method, are engaged in transport and storage operations for grain. Shinwa Development Co., Ltd., a consolidated subsidiary, operates sports facilities.
The diagram on the following page illustrates the structure of the Nisshin Seifun Group
4
Note: Nisshin Real Estate Inc. will be renamed Nisshin Associates Inc. on June 1, 2006.
Leas
ing
and
man
agem
ent
of re
al e
stat
e
Cus
tom
ers
◎ N
issh
in R
eal E
stat
e In
c.
◎ N
issh
in IS
L In
c.
IT a
nd lo
gist
ics
man
agem
ent
◎ Yamajo Shoji Co., Ltd.
○ Ishikawa Co., Ltd.
◎ Rogers Foods Ltd.
○ Four Leaves Pte. Ltd.
◎ Nisshin Petfood Inc.
Prepared dishes (chilled and processed foods) Direct operation of concession stores Frozen food
Pasta, flour for consumer use, prepared mix, frozen food, and other processed foods
Flour
Flour
Flour
Flour
Frozen food, operation of restaurants
Operation of bakeries
Prepared mix
Processed meat
Pet food
Healthcare foods and pharmaceuticals
Pharmaceuticals
Design, subcontracted construction and management of production facilities, sales of powder-processing machines
Overland freight shipping and storageFeed
◎ NBC Inc. Mesh cloths, forming filters
Transport and storage of grain
Flour
Flou
r
Flou
r
Bra
n
Transport and storage of grain
Pasta sauce
Pasta Fl
our
Nis
shin
Sei
fun
Gro
up In
c.
(Hol
ding
com
pany
)
◎ Nisshin Grain Silo Inc.
◎ Shinwa Development Co., Ltd.
Transport and storage of grain
Operation of sports facilities
Transport and storage of grain
◎ Consolidated subsidiaries ○ Subsidiaries and affiliated companies accounted for by the
equity method
◎ Initio Foods Inc.
◎ Nihon Bioresearch Center Co., Ltd. ◎ Kitayama Labes Co., Ltd. ◎ Oriental Bio-Service Co., Ltd. ◎ Oriental Bio-Service Kanto Co., Ltd.◎ KBT Oriental Co., Ltd. ◎ OYC International, Inc.
Cake and bread ingredients
Biochemical products
○ Marubeni Nisshin Feed Co., Ltd.
○ Oriental Service Co., Ltd.
Cake and bread ingredients and biochemical products Life science business
Prepared mix
◎ Fresh Food Service Co., Ltd.
◎ Nisshin-STC Flour Milling Co., Ltd. ◎ NSTC Trading Co., Ltd.
◎ Nisshin Flour Milling Inc.
◎ Ma•Ma-Macaroni Co., Ltd.
◎ Food Master (PNW) Corp. ◎ Medallion Foods Inc.
◎ Thai Nisshin Seifun Co., Ltd.
◎ Daisen Ham Co., Ltd.
◎ Pany Delica Co., Ltd. ◎ Pany Foods Net Co., Ltd. ◎ SK Foods Co., Ltd.
◎ Oriental Yeast Co., Ltd.
◎ Nisshin Pharma Inc.
○ Nisshin Kyorin Pharmaceutical Co., Ltd.
Flou
r Mill
ing
Segm
ent
Oth
ers S
egm
ent
○ Hanshin Silo Co., Ltd. ○ Chiba Grain Handling Center, Ltd.
○ Japan Logistic Systems Corp.
◎ Nisshin Foods Inc.
◎ Qingdao Nisshin Seifun Foods Co., Ltd. ◎ Shin Nisshin Seifun Foods (Qingdao) Co., Ltd.
Pasta
Prepared mix ◎ Thai Nisshin Technomic Co., Ltd.
Proc
esse
d Fo
od Se
gmen
t
◎ P.T. NBC Indonesia ◎ NBC Hinet Inc. ◎ Dynamesh Inc. ◎ CNK Inc. ◎ NBC (Shanghai) Mesh Co., Ltd. ○ Thainak Industries Co., Ltd.
Mesh cloths, forming filters, etc.
○ J
inzh
u (Y
anta
i) Fo
od R
esea
rch
and
Dev
elop
men
t Co.
, Ltd
.
◎ Nisshin Engineering Inc.

5
Subsidiaries and Affiliates
Notes: 1. SANKO Co., Ltd., formerly a consolidated subsidiary, was taken over in a merger by Initio Foods in October 2005. 2. Nisshin Flour Milling, Inc., Nisshin Foods Inc., Oriental Yeast Co., Ltd., Nisshin Pharma, Inc., NBC Inc. Nisshin-STC Flour
Milling Co., Ltd. and P.T. NBC Indonesia are special-purpose subsidiaries of Nisshin Seifun Group Inc. Nisshin-STC Flour Milling Co., Ltd. and P.T. NBC Indonesia are included in the 30 other consolidated subsidiaries.
3. The following companies are listed on stock exchanges in Japan: Subsidiaries: Oriental Yeast Co., Ltd. (Second Section of the Tokyo Stock Exchange) NBC Inc. (Second Section of the Tokyo Stock Exchange) Affiliated company accounted for by the equity method: Japan Logistic Systems Corp. (JASDAQ)
Name Location Paid-in capital Main business
Consolidated subsidiaries
Millions of yen
Nisshin Flour Milling Inc.
Chiyoda-ku, Tokyo
13,000 Production and sales of flour and prepared mix
Nisshin Foods Inc. Chiyoda-ku, Tokyo
5,000 Sales of pasta, flour for consumer use, frozen foods, other products Production and sales of prepared mix
Ma•Ma-Macaroni Co., Ltd.
Utsunomiya-shi, Tochigi
350 Production and sales of pasta
Initio Foods Inc. Chiyoda-ku, Tokyo
450 Production and sales of chilled and prepared dishes Direct operation of concessions in department stores, etc.
Oriental Yeast Co., Ltd. Itabashi-ku, Tokyo
2,617 Production and sales of cake and bread ingredients and biochemical products, life science business
Nisshin Pharma Inc. Chiyoda-ku, Tokyo
2,550 Production and sales of healthcare foods and pharmaceuticals
Nisshin Petfood Inc. Chiyoda-ku, Tokyo
1,315 Production and sales of pet foods
Nisshin Engineering Inc. Chuo-ku, Tokyo 107 Design, subcontracted construction and management of production facilities, sales of powder-processing machines
NBC Inc. Hino-shi, Tokyo 1,992 Manufacturing and sales of mesh cloths and forming filters 30 other consolidated subsidiaries
Subsidiaries and affiliated companies accounted for by the equity method
Marubeni Nisshin Feed Co., Ltd.
Chuo-ku, Tokyo 5,500 Production and sales of feed
Japan Logistic Systems Corp.
Shinagawa-ku, Tokyo
3,145 Freight shipping and storage
8 other companies

6
II. Business Policies (1) Basic Business Policy
In a Japanese economy that has now succeeded in making many of the changes necessary to align itself with global standards, Nisshin Seifun Group Inc. (“the Company”) espouses two corporate philosophies: “the basis of business is built on trust” and “in tune with the changing climate.” In combination with the principle “to contribute to a healthy and fruitful life for all,” these philosophies have formed the foundation for the Company to achieve continued growth and expansion of its businesses. In addition, the Company has adopted “Delivering Good Health and Reliability” as its corporate slogan. This expresses the commitment that every Nisshin Seifun Group member firm should strive to deliver products and services that contribute positively to health and build consumer trust.
Based on this philosophy, in its role as the holding company of the Nisshin Seifun Group, the Company specifies long-term maximization of enterprise value as the key business goal. Group management prioritizes the investment of resources in core operations and businesses with growth potential. At the same time, the Company promotes internal reform while fulfilling its corporate social responsibilities in terms of restructuring its internal control system, legal and regulatory compliance, food safety and environmental protection. Nisshin Seifun Group is fully committed to gaining the support of all stakeholders, including shareholders, customers, business partners, employees and local communities. (2) Policy on Profit Distribution
The Company aims to meet the expectations of shareholders to distribute profits, based on the current and future profitability of the business and the financial position, in addition to targeting a payout ratio of at least 30% on a consolidated basis. For the year ended March 31, 2006, the Company plans to raise returns to shareholders by increasing the dividend by ¥4 per share. This would result in total dividends for the year of ¥18 per share. The Company plans to submit to the Ordinary General Meeting of Shareholders a proposal to pay a final dividend of ¥11 per share. If approved, this would represent the fourth successive annual hike in dividend levels. Moreover, the Company has an ongoing policy of repurchasing treasury stock. In the period under review the Company purchased 2 million of its own shares at a cost of ¥2,296 million. In addition, the Company undertook a 1.1 for 1 common stock split on November 18, 2005. In response to the implementation of the Corporate Law, the Company plans to submit to the Ordinary General Meeting of Shareholders a proposal for an amendment to the Articles of Incorporation to allow the distribution of retained earnings and similar issues to be decided at meetings of the Board of Directors, as well as at General Meetings of Shareholders.
With the aim of raising future enterprise value, the Company prioritizes the use of retained earnings for strategic investments in areas of growth opportunity so that return on capital is maximized from a long-term perspective. The Company also adopts a dynamic posture on shareholder returns.
Furthermore, the Company also operates a system of special privileges for shareholders designed to increase familiarity with the products of Nisshin Seifun Group growth businesses. Under this system, shareholders may request the delivery of supplement-enhanced foods made by Nisshin Pharma. (3) Policy on Reduction in Minimum Share-Trading Unit
The Company recognizes that reduction of the minimum investment that is required to trade in its shares is an effective means of boosting liquidity and increasing the number of private investors.

7
Based on an examination of market trends and the current distribution of such units, the Company reduced the minimum share-trading unit for its shares from 1,000 to 500 on October 3, 2005. (4) Medium-to-Long-Term Business Strategy and Target Indicators
With its first medium-term business plan, the Nisshin Seifun Group significantly exceeded its pre-determined profit targets for the year ended March 31, 2005. The Company then formulated a second medium-term business plan covering the three fiscal years from the year ended March 31, 2006 to the year ending March 31, 2008, and is progressing measures to achieve the performance targets established therein.
The core theme of the second medium-term business plan is growth. The aim of the plan is to ensure that all Nisshin Seifun Group businesses are on a sustainable growth trajectory by the end of the three-year period. In terms of basic strategy, the plan calls for feasible measures to be drawn up in each business area from a growth-oriented perspective. In particular, the Company has identified overseas operations as well as prepared dishes and other prepared foods as the main engines of growth. In addition, ahead of the anticipated deregulation of the wheat market, the Company plans to progress with ongoing initiatives to strengthen the base of operations in flour milling and in processed food. The plan envisages more specific linkages between R&D activities and each business so that product innovation becomes the key driving force behind strategic business development. It also specifies the study of new cost-reduction initiatives based on fresh concepts to ensure that the Company is less sensitive to the various risks to growth. Through the implementation of such strategies, the Company aims to achieve sustained growth in earnings per share (EPS) over the long term, while also raising sales, ordinary income, net income and return on equity (ROE: defined as net income divided by shareholders’ equity). In doing so, the Company hopes to maximize the long-term value of the Nisshin Seifun Group. Performance targets for the final year of the plan (to March 2008) are net sales of ¥451.0 billion, ordinary income of ¥28.0 billion, net income of ¥14.5 billion, and ROE of 5.8%. The above target figures have been revised downwards since the figures released a year ago, principally reflecting delayed progress with business plans in the prepared dishes and other prepared foods business. As a result of the revisions, the targets have been reduced by the following amounts: net sales by ¥14.0 billion, ordinary income by ¥1.0 billion, net income by ¥0.5 billion, and ROE by 0.2 percentage points. Nevertheless, record-high net sales and earnings are forecast, and the Company intends to make up for the slow progress with business plans in the prepared dishes and other prepared foods business by improving the infrastructure to allow it to channel more resources into the business. (5) Prospective Challenges
The Company plans to invest in three areas as core businesses: flour milling (“the best in the world”); processed food (“a growth business”); and healthcare and biotechnology business (“good prospects for the future”). Including other operations, the basic goal remains to ensure the competitive survival of the Nisshin Seifun Group as a whole. 1) Segmental Overview of Business Strategy
The strategy in the flour milling business is to increase market share. To this end, Nisshin Flour Milling will further enhance relationship marketing and upgrade marketing initiatives to create

8
entirely new market segments, such as by proposing products that accurately reflect customer needs. Furthermore, ahead of the anticipated deregulation of the wheat market, Nisshin Flour Milling hopes to develop a dominant competitive position in the Japanese market. Plans are in hand to boost production efficiency and productivity with the ongoing construction of state-of-the-art flour milling equipment on two new production lines at the Higashinada Plant. These lines are due to commence operations in 2008, and at that time the company will close the Kobe Plant.
In the processed food business, Nisshin Foods continues to enhance its lineup of products commanding leading market shares by developing new products that are genuinely easy to use as well as being healthy. At the same time, the company is targeting enhanced cost competitiveness with measures such as the establishment of a new large-scale pasta production line at the Utsunomiya Plant of pasta manufacturing subsidiary Ma•Ma-Macaroni Co., Ltd. The production line is slated to come on line in November 2006. In addition, Nisshin Foods has expanded further into processed food segments spanning all temperature ranges, from frozen foods to chilled foods and other prepared dishes. Through these efforts it plans to establish itself as a “mealtime solution provider” to drive the growth of the Nisshin Seifun Group. In the chilled foods sector, subsidiaries Initio Foods and SANKO merged in October 2005 to accelerate the growth of operations in prepared dishes and other prepared foods. The merger serves to integrate production, management and sales resources amid a focus on developing a multi-channel approach that targets department stores and large retail chains, in addition to opening stores in roadside locations to sell chilled dishes directly to consumers.
With an aging Japanese society and generally heightened awareness of health issues, the Company continues to channel resources into development of the healthcare and biotechnology business, which possesses considerable growth potential. The goal in this sector is to develop this business to the point where it provides a third source of core earnings, on a par with flour milling and processed food. The two main companies in this field of operations are Oriental Yeast and Nisshin Pharma. Oriental Yeast aims to become a leader in the development of original yeast-based technology, an area with almost infinite possibilities. The firm is developing new products and technologies to support enhanced longevity and health. These efforts are also exploiting synergies within the Nisshin Seifun Group, in terms of joint product development and sales initiatives, spanning operations in flour milling, processed food and healthcare foods. In particular, Oriental Yeast forms the nucleus of the Nisshin Seifun Group’s biotech research strategy, which is expected to yield results across a variety of fields. Nisshin Pharma, meanwhile, is a healthcare foods manufacturer distinguished by its emphasis on establishing the scientific basis for products that prevent lifestyle-related diseases. Focusing on research into new ingredients and the development of original products, the firm continues to develop new sales channels and build up its production capabilities to establish an unrivalled position.
In other businesses, which include pet food, engineering and mesh cloths, the Company aims to develop a significant presence within each industry, either through self growth or through a strategy based on internal and external alliances. 2) Global Development Strategy
To accelerate progress and build operational scale as quickly as possible, the Company is focusing international business development efforts primarily in three regions in addition to Japan: the west coast of North America, Southeast Asia, and China. International operations are managed as a single

9
unit to ensure a cohesive Nisshin Seifun Group business strategy across the entire Pacific Rim, utilizing functional divisions between each base to exploit maximum synergy. To take the initiative in driving forward its strategy for China, which has huge potential as a consumer market, in June 2005 the Company set up its China Business Development Office. Besides working to expand trade between Chinese companies and Nisshin Seifun Group member firms based in Japan and overseas markets, the Company is pursuing new business opportunities that leverage core strengths in the flour milling and processed food sectors. To develop its Chinese operations, the Company commenced the manufacture and sale of prepared mix in Qingdao, Shandong, in 2002, and has been successful in achieving steadily increasing sales. To supply this sales expansion, the Company is currently constructing a new factory in Jimo, Shandong, due to come on stream in December 2006. This investment will double production capacity of prepared mix in China. Meanwhile, in October 2005, a sales subsidiary of NBC started operations and is expanding sales in the Chinese market. 3) R&D Strategy and Total Low-Cost Operations Drive
The development of next-generation products and new business models to complement and drive the growth of existing businesses is another important goal for the Nisshin Seifun Group. Rather than aim just to upgrade products, the ongoing theme of new product development (NPD) programs is to focus maximal effort on developing innovative, high-value-added products to win the support of customers and underpin sustained business expansion. The Company recognizes that such items are the key to generating continuous growth. In healthcare foods operations, in particular, it is accelerating initiatives aimed at efficiently researching new ingredients. Such measures include the October 2005 establishment of an endowed chair at the University of Shizuoka. The endowed position is to be known as the “Nisshin Seifun Group Endowed Chair, Department of Search for Higher Functional Foods.” Joint research has already commenced. New products launched in the year ended March 31, 2006 made a substantial contribution to growth across all sectors, particularly in the core businesses of flour milling, processed food and healthcare foods.
Besides new product development, another critical objective is to realize low costs throughout the Company’s operations, from purchasing and production to sales and distribution, as a fundamental means of increasing profitability. Cost-reduction initiatives are now focused on reviewing processes and systems to engineer reforms across the entire value chain from novel perspectives. The Company also continues to make investments where necessary to boost productivity and efficiency. 4) Wheat Policy Reforms
The outcome of ongoing World Trade Organization (WTO) negotiations on agriculture, as well as bilateral free trade agreements (FTAs) and economic partnership agreements (EPAs), could potentially have a significant impact on Nisshin Seifun Group’s flour milling and processed food interests, and on the industry as a whole. In Japan, following the November 2005 completion of a document on the future development of wheat policy by the Ministry of Agriculture, Forestry and Fisheries, a proposal was submitted to a regular session of the Diet for revision of the Japanese law governing the supply, demand and prices of staple foods. Assuming that the law will be amended to allow the Ministry of Agriculture, Forestry and Fisheries to proceed with making concrete plans for creating a new system, the Company’s policy will be to urge it to establish a strong foundation for the Japanese flour milling

10
industry to compete internationally. In view of the substantial premium of the government-controlled selling price over international prices for wheat, Company policy is to support the implementation of successive reductions in this price to reduce the gap on an ongoing basis. At the same time, the Company plans to increase the pace of structural reforms and its global business development program in order to accelerate the evolution of the Nisshin Seifun Group into a strong, globally competitive enterprise. 5) Corporate Social Responsibility (CSR)
Besides making steady progress on these strategic business issues, the Nisshin Seifun Group has been active in fulfilling its responsibilities as a corporate citizen, with the aim of retaining its status as a corporate entity that plays an essential role in society. To this end, the Company established a committee to study and develop Group operating companies’ basic attitudes as well as their actions with regard to all their stakeholders. Thus, the Company and all Group operating companies have focused on developing enhanced compliance procedures to ensure all business activities are legal and appropriate. Other specific programs – all of which are ongoing – include the strengthening of quality control systems to improve traceability and quality assurance (QA) procedures from a consumer perspective, alongside a range of environmental protection measures such as reduction of wastes and carbon dioxide emissions. As part of these programs, the Company is also actively working to obtain certification under international management standards. For example, it is focusing on its processed food and flour milling operations to address the requirements of the positive list system for agricultural chemical residues in foods, introduced in May 2006. In order to ensure the safety of the increasing volume of food ingredients it is importing from China, the Company collaborated in a joint venture with Nichirei Corporation to establish a company in Yantai, Shandong, to undertake food testing and analysis. The company is due to commence operations in May 2006. With regard to reducing carbon dioxide emissions, the Company has drawn up a plan for achieving Kyoto Protocol emissions targets. The voluntary target the Company is working to achieve under the plan is an 8.6% reduction in carbon dioxide emissions between the fiscal year ended March 1991 and the fiscal year ending March 2011.
The current environment is moving toward more stringent evaluation of internal controls over financial reporting by management, combined with increased legislation for internal control and auditing systems by external auditors. Against this backdrop, the Company initiated an overhaul of its internal control system, with the establishment in September 2005 of an Internal Control Preparatory Office. This office is charged with evaluating, reinforcing and reviewing the Group’s internal control system and its operation.
The Nisshin Seifun Group has received plaudits from independent evaluation organizations, media-related institutions and other bodies for the actions taken to fulfill corporate social responsibilities. The Company plans to continue such actions going forward. 6) Matters Concerning the Parent Company
There are no materially significant matters concerning the parent company, therefore this information has been omitted.

11
III. Review of Operations & Financial Position A. Review of Operations 1. Business Overview (Fiscal Year Ended March 31, 2006)
During the fiscal year ended March 31, 2006, the market environment was challenging, with weak demand due to unusual weather conditions and a consumer propensity for low prices throughout the food industry both continuing. Against this backdrop, the second medium-term business plan—with the core theme of growth—was launched, and the Nisshin Seifun Group worked to generate higher sales volumes. To this end, the Company undertook aggressive promotional activities and developed new sales channels in all its businesses.
As a result of the above, consolidated net sales increased 1.2% compared with the previous year to ¥421,359 million. However, earnings decreased with ordinary income down 1.4% to ¥24,774 million and net income also down 0.4% to ¥13,541 million. [Business Overview by Segment] (1) Flour Milling Segment
Nisshin Flour Milling Inc. worked to promote sales through relationship-based marketing with trusted business partners, but with the domestic flour market underperforming compared with the previous fiscal year as demand stagnated, shipments were unchanged year on year. In response to these challenges, Nisshin Flour Milling strove to expand flour demand by using flour in new ways to add value, an example being the August 2005 launch of its Maison Kayser Traditional premium flour for manufacturing use.
In production and distribution, the company continued to promote low-cost operations while working to produce high-quality flour efficiently. In quality control, meanwhile, in November 2005 Nisshin Flour Milling was the first Japanese manufacturer to win certification under ISO 22000 (the ISO standard for food safety management) for its entire manufacturing system including the headquarters and 12 domestic manufacturing plants.
In March 2006, Nisshin Flour Milling lowered prices for its flour products in response to the Japanese government’s February reduction of the price of wheat, the raw material for flour; this was the first reduction in two years.
The price of bran, a by-product of the milling process, remained strong due to high demand for animal feed products within Japan.
In overseas operations, the capacity utilization rate increased steadily at Rogers Foods Ltd.’s new flour milling plant in Canada. While working to increase overall flour shipments, the plant has also commenced sales to the U.S. west coast.
Due to the effects of increased expenditure on aggressive sales promotion and other measures, segment sales declined 0.7% year on year to ¥153,850 million, and operating income declined 1.9% to ¥10,760 million.
(2) Processed Food Segment
During the period under review, the operating environment for Nisshin Foods Inc. was challenging: continued sluggish demand and a consumer propensity for low prices throughout the food industry were compounded by sharply increased raw material procurement costs due to the rise in the price of

12
crude oil and other factors. Against this backdrop, Nisshin Foods Inc. implemented aggressive marketing and sales promotion activities centering on the campaign marking the 50th anniversary of the Ma•Ma pasta brand. As a result, shipments of pasta, pasta sauces, prepared mix and frozen foods were higher than a year earlier. In February 2006, the company introduced 13 new products and 22 updated products in home-use room-temperature foods. In home-use frozen foods, the company also introduced 5 new products and 5 updated products. In prepared dishes and other prepared foods, September 2005 saw the completion of a new manufacturing plant for prepared dishes in Shiraoka, Saitama. The following month saw the merger of subsidiaries Initio Foods Inc. and SANKO Co., Ltd. However, this and other measures designed to bolster the operational base, did not achieve the initial targets due to delayed progress with business plans. The overseas strategy of the business made a significant contribution to increased operating results, with all three operational bases—North America, Thailand and China—achieving steady business expansion. In light of its strong performance, the Chinese prepared mix business started work to double manufacturing capacity, targeting further penetration of the Chinese market.
At Oriental Yeast Co., Ltd., May 2005 saw completion of the P&B Center, which combines R&D functions with facilities for presentations to customers on new products and recipes. Since then, the company has been making good use of the center. In the processed foods division, sales were higher than a year earlier, due in part to growth in shipments of bread-making ingredients, including mainstay yeast and flour paste products, as well as mineral yeasts. Another contributor was the start of business at SK Foods Co., Ltd. following the July 2005 takeover of operations from Sankyo Foods Co., Ltd. In the biotechnology-related division, sales were roughly on a par with the previous year, with steady growth in shipments of bionutritional products offset by sluggish performances in feed products supplied to fish farms and other feed contracts.
Nisshin Pharma Inc. concentrated resources on bolstering the supply network and extending market penetration for its value-added products. For the company’s mainstay coenzyme Q10 product, it established a new manufacturing line for concentrated water-soluble coenzyme Q10 at its Ueda Plant in November 2005. In addition, the company focused on bolstering the lineup of finished products for the retail market and undertook a range of promotional activities, successfully increasing consumer awareness of its products.
Segment sales rose 1.4% compared to a year earlier to ¥221,571 million, but the effects of investment in sales promotion, and strategic and other expenses targeting growth under the new medium-term business plan resulted in a 7.9% decline in operating income to ¥7,352 million.
(3) Others Segment
Nisshin Petfood Inc. undertook aggressive sales promotion activities. In cat food, it posted significantly higher sales, particularly of mixed-type dried products and retort pouch products. Dog food sales also rose. In February 2006, the company launched mail order sales of JP-Style, a premium dog food product developed with a focus on good health and food safety.
Nisshin Engineering Inc. benefited from recovery in corporate capital expenditures accompanying the expansionary trend in the Japanese economy. Sales grew significantly with the successful completion of large contracts in the plant engineering division.
NBC Inc. recorded overall growth in sales with mainstay mesh cloths for screen-printing

13
applications posting steadily increased sales both domestically and overseas, while sales of industrial-use mesh cloths and forming filters also grew significantly. In November 2005, NBC took action to expand and upgrade production facilities by establishing a new plant in Kikugawa, Shizuoka prefecture.
Segment sales increased 7.3% to ¥45,938 million, but due to the effects of factors including strategic investment in new products at Nisshin Petfood in particular, operating income fell 2.5% to ¥4,907 million.
2. Business Outlook (Fiscal Year Ending March 31, 2007)
In the second year of the second medium-term business plan, the Nisshin Seifun Group will continue working to position all of its businesses on a firm growth trajectory. In particular, the Company will focus on expanding overseas operations, and prepared dishes and other prepared foods. To this end, it will progress with infrastructure improvements to support such expansion, while further bolstering the management structure. In conjunction with these initiatives, the Nisshin Seifun Group will take the initiative in fulfilling its corporate social responsibility (CSR). In the fiscal year ending March 31, 2007, net sales and ordinary income are both projected to achieve record highs.
(1) Flour Milling Segment
Domestic demand for flour is unlikely to increase, due partly to the demographic trend towards fewer children and more seniors, but also because of an increased inflow of overseas products such as preparations of wheat flour. Intensified sales competition between manufacturers is therefore a cause for concern. Against this backdrop, Nisshin Flour Milling will strive to create new markets and further increase its market share by stepping up efforts to deepen relationships with its customers. To achieve this, Nisshin Flour Milling will incorporate a rapid and accurate grasp of market trends and customer needs into its product development, as well as make proposals to promote sales.
Moreover, as wheat policy reform progresses both in Japan and abroad, Nisshin Flour Milling will act to pare down costs in all operations, including purchasing, production, distribution and sales. This will be achieved by improving operational efficiency through developments such as the May 2006 completion of the automatic rack warehouse at the Higashinada Plant. Through such measures Nisshin Flour Milling will work to secure its profitability in preparation for the deregulated wheat market of the future.
In overseas operations, Nisshin Flour Milling will continue to pursue a Pacific Rim strategy focusing on three regions: Japan, the west coast of North America, and Thailand.
(2) Processed Food Segment
As a “mealtime solution provider,” Nisshin Foods will pursue the development of new products with an emphasis on reliability, safety and health. These efforts are directed at enhancing its product lineup, including the range of Ma•Ma pasta products, which currently boast the leading market share. In addition, the company will further reinforce its quality control system in response to the May 2006 introduction of the positive list system for agricultural chemical residues in foods. On the production front, Nisshin Foods will target enhanced cost competitiveness with measures such as the establishment of a new large-scale pasta production line at the Utsunomiya Plant of pasta manufacturing subsidiary Ma•Ma-Macaroni Co., Ltd. The production line is slated to come on line in

14
November 2006. In prepared dishes and other prepared foods, Initio Foods will work towards further expansion of its operating base through development of unique products and reinforcement of its links with volume retailers. Overseas development entails steadily increasing the number of operational bases in the Pacific Rim region, including the planned doubling of production capacity in the Chinese prepared mix business. The newly expanded capacity is slated to become operational in December 2006.
In the processed food division of Oriental Yeast, plans call for measures to expand market share and stimulate demand through collaboration with customers. This will be achieved by further improving, and making even better use of, the P&B Center constructed in 2005. In its biotechnology-related division, the company will target expansion, particularly in the range of contract-based pharmaceutical R&D support services it offers. At the same time, the company will grow sales by bringing to market new products including biochemicals and immunochemicals.
At Nisshin Pharma, full-scale operations will be started at the Ueda Plant’s newly established manufacturing line for concentrated water-soluble coenzyme Q10. In addition, in the fiscal year ending March 31, 2007, the company will commence sales and promote market penetration of Aqua Q10 P40, an ingredient product made from concentrated coenzyme Q10. Meanwhile, the company will implement concerted advertising and sales promotion activities on an ongoing basis with regard to consumer-oriented products. In addition, it will channel resources into new product development and discovery of new ingredients with an emphasis on treating lifestyle-related illnesses. (3) Others Segment
Nisshin Petfood will work to enhance its market presence and awareness of its products in the premium pet food market. JP-Style, the premium dog food product which went on sale in February 2006, will be central to this initiative. In established business domains, also, the company will push ahead with new product development, expand and revamp its product lineup, and pursue an aggressive marketing strategy.
Nisshin Engineering will continue working to secure new contracts as well as actively boost sales in powder-processing services and sales of related equipment.
NBC plans to aggressively drive forward market launches of value-added products based on new technology. At the same time, it will target continuous growth in world markets to increase market shares for ultra-fine mesh cloths.
For the year ending March 31, 2007, record-high operating results are expected. The Company
forecasts net sales of ¥435.0 billion (up 3.2% year on year), ordinary income of ¥25.3 billion (up 2.1%) and net income of ¥14.0 billion (up 3.4%).

15
B. Financial Position 1. Overview (Fiscal Year Ended March 31, 2006) Cash flow from operating activities Income before income taxes and minority interests amounted to ¥25,101 million and depreciation and amortization amounted to ¥11,993 million. However, increased working capital, due partly to an increase in inventories of raw materials for flour manufacturing, combined with payment of income taxes and other factors, resulted in net cash provided by operating activities of ¥21,054 million. Cash flow from investing activities Capital investments to extend and upgrade production capacity amounted to ¥12,362 million, while purchase of marketable securities and investments in time deposits with terms exceeding three months amounted to ¥14,581 million. As a result, net cash used in investing activities was ¥25,297 million. Free cash flow, the sum of cash flow provided by operating and investing activities, amounted to an outflow of ¥4,242 million in the year ended March 31, 2006. Cash flow from financing activities Payment of dividends and re-purchase of treasury stock were among the factors that resulted in net cash used in financing activities of ¥7,274 million. Compared to the previous fiscal year, the cash outflow increased by ¥2,957 million, principally reflecting higher dividend payments and the repurchase of treasury stock. As detailed above, the cash inflow from consolidated operating activities in the fiscal year ended March 31, 2006 was allocated to strategic capital spending and increased returns to shareholders. In order to increase the efficiency of cash in hand utilization, funds earmarked for future strategic investments and similar were invested in time deposits with terms exceeding three months, marketable securities, and similar investments. As of March 31, 2006, consolidated cash and cash equivalents totaled ¥42,803 million, a decline of ¥11,244 million from the previous fiscal year-end. 2. Outlook (Fiscal Year Ending March 31, 2007)
The Company forecasts an increase in cash due to net income of ¥14.0 billion in the year ending March 31, 2007. The Company expects to use this cash for capital spending in excess of depreciation and the distribution of earnings to shareholders. As a result, consolidated cash and cash equivalents at March 31, 2007 are forecast to remain around the same level as at March 31, 2006
.

16
3. Cash-Flow Indicators
The main cash-flow indicators for the Nisshin Seifun Group are shown in the table below.
* Shareholders’ equity ratio = Shareholders’ equity / Total assets Market-value-based equity ratio = Market capitalization / Total assets Debt-repayment period = Interest-bearing debt / Operating cash flow Interest coverage ratio = Operating cash flow / Interest expense
1. All of the above cash-flow indicators are calculated on a consolidated basis. 2. Market capitalization is calculated by multiplying the closing share price on the final trading day
of the fiscal year by the total number of outstanding shares (excluding treasury common stock) as of the corresponding fiscal year-end.
3. Operating cash flow equals net cash provided by operating activities as stated in the Consolidated Statements of Cash Flows. Interest-bearing debt refers to bonds and debt as stated in the Consolidated Balance Sheets. Interest expense is equal to interest payments as stated in the Consolidated Statements of Cash Flows.
Fiscal year ended March 31, 2003
Fiscal year ended March 31, 2004
Fiscal year ended March 31, 2005
Fiscal year ended March 31, 2006
Shareholders’ equity ratio (%) 66.8 64.1 64.7 66.2Market value-based shareholders’ equity ratio (%)
62.2 65.4 70.7 76.0
Debt repayment period (years) 0.9 0.5 0.5 0.4Interest coverage ratio (times) 39.7 84.7 110.1 127.9
Forward-Looking Statements The statements contained in this document are based on various assumptions and do not constituteany guarantee or definite promise that projections of future performance or related business policieswill actually be realized.
17
C. Business Risks Risks that could have an impact on the business performance, share price and financial position of
the Nisshin Seifun Group are outlined below. All matters relating to the future in the section below are based on the current views of the Nisshin
Seifun Group as of the date of publication of the Summary of Consolidated Financial Statements (May 12, 2006). 1) Economic conditions and industry environment The Nisshin Seifun Group continues to work to reinforce its earnings base so as to minimize the impact of economic and industry conditions on business results. However, shipment levels of the Company’s major products are subject to economic trends, primarily in Japan. Price erosion for these products is also a possibility under a prevailing deflationary environment. Other risks include losses caused by the failure of investment or business partners due to deterioration in economic conditions.
2) Wheat policy reforms and international trade discussions Although the Nisshin Seifun Group has undertaken structural reforms of its flour milling and processed food operations to build a strong earnings base, these businesses remain subject to risk due to international negotiations by the Japanese government on agricultural issues. Talks are ongoing with the WTO and with various countries regarding free-trade agreements. The government is also reviewing its internal and trade policies with regard to wheat. Policy changes affecting the handling of wheat (including policies governing the government purchase, stockpiling and sale of wheat) imply serious ramifications for the domestic flour industry and the markets for secondary processed products, and could potentially lead to industry restructuring alongside major changes in methods of wheat procurement.
3) Product safety While the Nisshin Seifun Group continues to upgrade efforts to improve its product quality assurance systems, group operations are exposed to a variety of safety-related risks due to external and other factors. Events beyond the scope of the Company’s projections could lead to product recalls or the discovery of defective items. On the material procurement side, the Nisshin Seifun Group is also exposed to similar risks associated with diseases such as bovine spongiform encephalopathy (BSE) and avian influenza.
4) Sharp increases in raw materials prices The Nisshin Seifun Group continues to aim to develop low-cost operations to ensure that earnings are more resistant to deflationary pressures and the possibility of future wheat market deregulation. Nevertheless, the Company remains exposed to the risk of changes in raw material prices, and higher costs for distribution and raw materials, including packaging, due to oil price rises,. The resulting sharp rises in purchasing costs could make it impossible for the Company to achieve cost reductions.
5) Foreign exchange movements (principally yen-dollar and yen-euro) Although the Nisshin Seifun Group uses currency forwards and other hedging tools to minimize the

18
impact of foreign exchange movements on results, the sourcing of some raw materials and other inputs from overseas exposes some group operations to the risk of variance in purchasing costs due to currency market fluctuations, particularly in processed foods. The operational performance and financial position of overseas operations may also vary due to changes in the value of the yen. In flour milling operations, the level of prices for imported bran, which vary according to foreign exchange movements, also affect the price of bran, a milling by-product.
6) Contract manufacturing The Nisshin Seifun Group contracts out the manufacturing of some products to optimize production efficiency. Although the Company makes suitable efforts to ensure that contract manufacturers adhere to the same levels of quality control and input purchase stability, the Company remains exposed to the risk of the business failure of subcontractors due to circumstances beyond its control. Any such eventuality could result in higher purchasing costs or an interruption in product supply.
7) Information- and system-related risks The Nisshin Seifun Group has established appropriate levels of management controls for its internal systems. Problems encountered with the operation of these systems have the potential to interrupt supplies to customers or to incur extra costs. Although the Nisshin Seifun Group maintains proper controls to thwart viruses and other computer-related problems and manage IT systems, any unforeseen attacks by viruses or unauthorized access to internal systems have the potential to interrupt supplies to customers. Other information- and system-related risks include the leakage of operationally sensitive data or confidential personal information, which could also result in higher costs or damage to the Company’s reputation.
8) Alliances with other companies The Nisshin Seifun Group maintains alliances with other companies as part of efforts to optimize use of management resources and to maximize the benefits of technology. Disagreements with alliance partners could result in failure to realize such benefits.
9) Facility security and natural disasters The Nisshin Seifun Group continues to work to upgrade its safety and site management systems to ensure the security of production plants and other facilities and to prevent accidents such as fires or explosions. Management, maintenance and repair systems are also in place to minimize any injury to personnel or damage to facilities in the event of natural disasters such as earthquakes or storms. However, events beyond the scope of the Company’s projections could lead to damage or to the interruption of product supplies to customers. In particular, due to the high concentration of sales of Nisshin Seifun Group products in Tokyo and the surrounding metropolitan area, a major disaster affecting this region could have a negative impact on the Company’s operating performance.
10) Retirement benefits and pension liabilities Calculations of Nisshin Seifun Group retirement benefits and pension liabilities are based on actuarial assumptions (such as the discount rate) and an expected rate of return on pension plan

19
assets. There could be a material impact on the Company’s operating performance and financial position if actual results are significantly different from initial assumptions.
11) Regulatory compliance Although the Nisshin Seifun Group continues to focus on upgrading legal and regulatory compliance, unforeseen events have the potential to result in higher costs.
12) Overseas incidents Although the Nisshin Seifun Group makes efforts to prevent accidents at its overseas operations, the performance of these businesses is subject to various economic and political risks that could result in higher costs.
13) Intellectual property Ongoing efforts by the Nisshin Seifun Group to protect its intellectual property notwithstanding, the launch and sale of similar products by other firms could be potentially detrimental to the value of the Company’s brands. In addition, the Company also faces the risk of possible future claims against it by other companies for intellectual property infringement.
14) Environmental management The environmental impact of Nisshin Seifun Group businesses is relatively low compared to other industries. Nevertheless, the Company continues to make assiduous efforts to improve the environmental profile of Nisshin Seifun Group business activities in terms of environmental management systems, energy efficiency and waste reduction. Despite such efforts, events beyond the scope of the Company’s projections could force the Company to undertake measures that result in higher costs.

20
IV. Consolidated Financial Statements
(1) Consolidated Balance Sheets—As of March 31, 2006 and 2005
(Millions of yen) 2005 2006 Change 2005 2006 Change
Liabilities: Current liabilities: Notes and accounts payable Short-term debt Accrued income taxes Accrued expenses Other current liabilities Total current liabilities Non-current liabilities:
Long-term debt Deferred tax liabilities Allowance for employees’ retirement
benefits Allowance for directors’ retirement
benefits Allowance for repairs Guaranteed deposits received Consolidation adjustments account Other non-current liabilities
Total non-current liabilities Total liabilities
28,599 8,115 3,956
13,623 13,085
-------------67,380
1,680 13,014
14,928
1,192
893 5,701
134 –
-------------37,545
104,925
25,8197,7544,813
13,41012,732
-------------64,530
1,60921,708
12,614
314842
5,56890
587-------------
43,334
107,865
(2,779) (360)
857(213) (352)
-------------(2,849)
(71) 8,694
(2,314)
(878) (51)
(132) (44) 587
-------------5,789
2,940
Minority interests: Minority interests
26,760
27,498 737
Assets: Current assets: Cash on hand and in banks Notes and accounts receivable Marketable securities Inventories Deferred tax assets Other current assets Allowance for doubtful accounts Total current assets Fixed assets: Tangible fixed assets Buildings and structures Machinery and equipment Land Construction in progress Other tangible fixed assets Intangible fixed assets Investments and other assets: Investment in securities Long-term loans Deferred tax assets
Other investments and other assets
Allowance for doubtful accounts
Total investments and other assets Total fixed assets
54,065 59,468
6,783 38,580
4,517 7,146 (211)
------------- 170,349
42,407 32,741 29,729
1,152 2,830
------------- 108,860
9,124
77,262 261
4,099
3,641 (630)
------------- 84,634
202,618
50,111 57,678 14,339 39,601
4,431 6,935 (227)
-------------172,870
42,866 32,243 30,726
3,733 2,862
-------------112,432
7,977
101,369 131
2,434
3,081 (397)
-------------106,619
227,029
(3,954) (1,790)
7,555 1,021
(85) (210)
(15)-------------
2,520
459 (497)
997 2,581
31-------------
3,571
(1,146)
24,107(30)
(1,665)
(560) 232
------------- 21,984
24,410
Shareholders’ Equity: Common stock Capital surplus Retained earnings Unrealized holding gain (loss) on
securities Foreign currency translation
adjustments Treasury common stock Total shareholders’ equity
17,117 9,452
190,699
26,688
(1,216) (1,459)
------------- 241,282
17,1179,483
200,487
40,835
(212) (3,176)
-------------264,535
–31
9,788
14,146
1,003(1,717)
-------------23,252
Total Assets 372,968
399,899 26,930 Total Liabilities, Minority Interests and Shareholders’ Equity
372,968 399,899 26,930
21
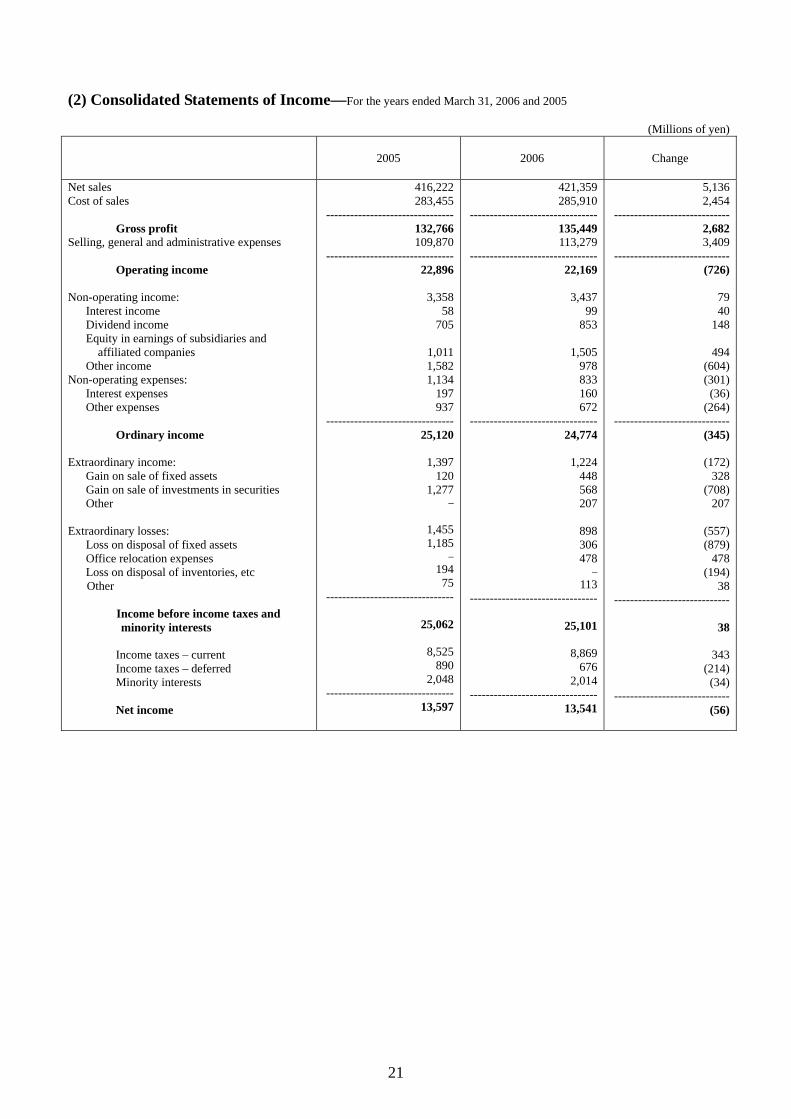
(2) Consolidated Statements of Income—For the years ended March 31, 2006 and 2005
(Millions of yen)
2005 2006 Change
Net sales Cost of sales Gross profit Selling, general and administrative expenses Operating income Non-operating income: Interest income Dividend income Equity in earnings of subsidiaries and
affiliated companies Other income Non-operating expenses: Interest expenses Other expenses Ordinary income Extraordinary income: Gain on sale of fixed assets Gain on sale of investments in securities Other Extraordinary losses: Loss on disposal of fixed assets Office relocation expenses Loss on disposal of inventories, etc
Other
Income before income taxes and minority interests
Income taxes – current Income taxes – deferred Minority interests Net income
416,222283,455
--------------------------------132,766109,870
--------------------------------22,896
3,35858
705
1,0111,5821,134
197937
--------------------------------25,120
1,397120
1,277–
1,4551,185
–19475
--------------------------------
25,062
8,525890
2,048--------------------------------
13,597
421,359 285,910
-------------------------------- 135,449 113,279
-------------------------------- 22,169
3,437
99 853
1,505
978 833 160 672
-------------------------------- 24,774
1,224
448 568 207
898 306 478
– 113
--------------------------------
25,101
8,869 676
2,014 --------------------------------
13,541
5,1362,454
-----------------------------2,6823,409
-----------------------------(726)
7940
148
494(604)(301)(36)
(264)-----------------------------
(345)
(172)328
(708)207
(557) (879)
478(194)
38-----------------------------
38
343(214)(34)
-----------------------------(56)

22
(3) Consolidated Statements of Retained Earnings—For the years ended March 31, 2006 and 2005
(Millions of yen)
2005 2006 Change
Capital surplus: Capital surplus at beginning of the year Increase in capital surplus Proceeds from sale of treasury common stock Capital surplus at end of the year Retained earnings: Retained earnings at beginning of the year Increase in retained earnings
Net income Increase in retained earnings due to merger of
consolidated subsidiaries Decrease in retained earnings Cash dividends paid Bonuses to directors Retained earnings at end of the year
9,44655
9,452
179,24114,37613,597
7782,9182,780
138190,699
9,452
31 31
9,483
190,699 13,541 13,541
–
3,753 3,580
172 200,487
5252531
11,457(834)(56)
(778)83480034
9,788

23
(4) Consolidated Statements of Cash Flows—For the years ended March 31, 2006 and 2005
(Millions of yen)
2005 2006 Change
I. Cash flows from operating activities: Income before income taxes and minority interests Depreciation and amortization Decrease in allowance for retirement benefits Interest and dividends income Interest expenses Equity in earnings of subsidiaries and affiliated companies Gain on sales of marketable securities Decrease (increase) in accounts receivable Increase in inventories Decrease (increase) in accounts payable Other Subtotal Interest and dividends received Interest paid Income taxes paid Net cash provided by operating activities II. Cash flows from investing activities: Payments for time deposits Proceeds from repayment of time deposits Payments for purchase of marketable securities Proceeds from sales of marketable securities Payments for purchases of fixed assets Proceeds from sales of fixed assets Payments for purchases of investments in marketable securities Proceeds from sales of investments in marketable securities Payments for long-term loans Proceeds from collections of long-term loans Other
Net cash used in investing activities III. Cash flows from financing activities:
Proceeds from short-term debt Repayments of short-term debt Proceeds from long-term debt Repayments of long-term debt
Proceeds from sale of treasury common stock Purchase of treasury common stock
Cash dividends paid Other Net cash used in financing activities IV. Effect of exchange rate changes on cash and cash equivalents V. Decrease in cash and cash equivalents VI. Cash and cash equivalents at beginning of the year VII. Increase in cash and cash equivalents due to merger of
consolidated subsidiaries VIII. Cash and cash equivalents at end of the year
25,06211,682(1,067)
(764)197
(1,011)(1,542)(4,201)(4,740)
5,7652,181
----------------------31,563
839(195)
(10,638)----------------------
21,567
00
(7,507)4,299
(16,052)44
(411)1,712
(65)189199
----------------------(17,590)
248(713)
–(419)
94(133)
(2,780)(613)
----------------------(4,317)
21
(317)
54,154
210
54,047
25,101 11,993 (2,317)
(953) 160
(1,505) (570) 2,469 (668)
(3,323) (2,483)
---------------------- 27,902
1,257 (164)
(7,939) ----------------------
21,054
(8,290) 18
(13,505) 7,196
(12,362) 535
(847) 1,671
(3) 133 156
---------------------- (25,297)
10 (660)
95 (29) 184
(2,430) (3,580)
(863) ----------------------
(7,274)
272
(11,244)
54,047
–
42,803
38310
(1,249)(188)(36)
(494)971
6,6714,072
(9,088)(4,665)
----------------------(3,660)
41731
2,699----------------------
(512)
(8,290)18
(5,997)2,8963,689
490(436)(40)
61(55)(43)
----------------------(7,707)
(238)5295
38990
(2,296)(800)(249)
---------------------- (2,957)
250
(10,926)
(107)
(210)
(11,244)

24
Basis of Presentation of Consolidated Financial Statements 1. Scope of consolidation (1) Consolidated subsidiaries: 39 ・ Names of principal subsidiaries: Nisshin Flour Milling Inc., Nisshin Foods Inc.,
Ma•Ma-Macaroni Co., Ltd., Initio Foods Inc., Oriental Yeast Co., Ltd., Nisshin Pharma Inc., Nisshin Petfood Inc., Nisshin Engineering Inc., NBC Inc.
・ Of the remaining subsidiaries, Nisshin Managerial Technology Center Co., Ltd. and 8 other companies are not consolidated. The assets, net sales, net income and retained earnings of each non-consolidated subsidiary are small, and the aggregate effect on the consolidated financial statements is immaterial.
(2) Changes in the scope of consolidation
Newly consolidated subsidiaries: 3 ・ Shin Nisshin Seifun Foods (Qingdao) Co., Ltd. and NBC (Shanghai) Mesh Co., Ltd. were
established in the fiscal year ended March 31, 2006, and have been included as consolidated subsidiaries. Moreover, SK Foods Co., Ltd., which was a non-consolidated equity-method affiliate until the previous fiscal year, has been included as a consolidated subsidiary from the fiscal year ended March 31, 2006 due to an increase in materiality.
Newly excluded subsidiary: 1 ・ SANKO Co., Ltd., which was a consolidated subsidiary until the fiscal year ended March 31,
2005, was taken over in a merger by Initio Foods Inc. in October 2005. The statements of income, retained earnings and cash flows for SANKO in the period prior to the merger have been consolidated.
2. Scope of the equity method (1) Equity-method subsidiaries and affiliates: 10 (one non-consolidated subsidiary and nine affiliates) ・ Names of principal equity-method subsidiaries and affiliates: Marubeni Nisshin Feed Co., Ltd.,
Japan Logistic Systems Corp. ・ The contributions to consolidated net income and consolidated retained earnings of each of the
eight non-consolidated subsidiaries and six affiliates not accounted for by the equity method are negligible and immaterial in the aggregate.
(2) Changes in the scope of the equity method
Affiliate newly included in scope of equity method: 1 ▪ Jinzhu (Yantai) Food Research and Development Co., Ltd. was newly established in the year ended March 31, 2006, and has therefore been included in the scope of the equity method
Newly excluded affiliate: 1 ・ SK Foods Co., Ltd. became a consolidated subsidiary, and has therefore been excluded from
the scope of the equity method from the fiscal year ended March 31, 2006.

25
(3) The financial statements for the accounting period of the company concerned are used in the cases of those equity-method subsidiaries and affiliates whose accounting period differs from the consolidated accounting period. 3. Accounting periods of consolidated subsidiaries
The consolidated subsidiaries listed below have accounting periods that differ from the consolidated accounting period. Since the year-end of each of these companies is within three months of the consolidated year-end, the current financial statements at the year-end of each consolidated subsidiary are used. However, necessary adjustments are made for material transactions that occurred during the period between the subsidiary’s year-end and the consolidated year-end.
Company name Year-end Rogers Foods Ltd. January 31 Thai Nisshin Seifun Co., Ltd. and 11 others December 31
4. Significant accounting principles (1) Valuation standards and methodology for material assets
a. Securities Held-to-maturity debt securities are stated at amortized cost. Other securities:
Securities with a readily determinable market value are stated at fair market value based on the quoted market price at the fiscal year-end (with any unrealized gains or losses being reported directly as a component of shareholders’ equity and the cost of any securities sold being computed by the moving average method). Securities with no readily determinable market value are stated at cost, with cost being determined by the moving average method.
b. Derivatives: Derivative financial instruments are stated at fair market value.
c. Inventories: Flour and bran are stated at the lower of cost or market, cost being determined by the retail cost method; other products are stated at the lower of cost or market, cost being determined by the periodic average method. Raw materials are stated at cost, with cost being determined by the moving average method.
(2) Depreciation methods for material depreciable assets
a. Tangible fixed assets Depreciation on tangible fixed assets owned by the parent company and domestic consolidated subsidiaries is computed principally by the declining balance method. However, the straight-line method is applied for buildings (excluding building fixtures) acquired on or after April 1, 1998. Foreign consolidated subsidiaries generally use the straight-line method.
26
b. Intangible fixed assets Depreciation is computed by the straight-line method. Software used in-house is depreciated over its estimated useful life (five years) based on the straight-line method.
(3) Basis of material allowances
a. Allowance for doubtful accounts The parent company and domestic consolidated subsidiaries provide for possible credit losses stemming from trade notes and accounts receivable. Estimates of irrecoverable amounts are based on historical loan-loss ratios for general receivables, and on a consideration of feasibly recoverable amounts in individual cases of suspected bad debt or other specific dubious accounts. Specific claims are generally deemed irrecoverable in the case of foreign consolidated subsidiaries.
b. Allowance for employees’ retirement benefits The parent company and domestic consolidated subsidiaries provide for employees’ retirement benefits based on the estimated amounts of projected benefit obligation and the fair value of the pension plan assets at the consolidated fiscal year-end. Prior service cost is amortized on a straight-line basis over a period equaling the average remaining service period of employees expected to receive pension benefits as of the consolidated fiscal year-end. Actuarial differences are amortized on a straight-line basis from the following fiscal year over a period equaling the average remaining service period of employees expected to receive pension benefits as of the consolidated fiscal year-end.
c. Allowance for directors’ retirement benefits Eight domestic consolidated subsidiaries provide for the payment of retirement benefits to directors in accordance with internal regulations, based on projected benefits as of the fiscal year-end.
(Additional information) During the fiscal year ended March 31, 2006, the parent company and seven consolidated subsidiaries abolished the directors’ retirement benefit system. With regard to reappointed directors, it was determined that retirement benefits applicable to the period in office up to the end of the Ordinary General Meeting of Shareholders held in June 2005, would be paid upon retirement. These unpaid retirement benefits have been reclassified under other non-current liabilities in the consolidated balance sheet.
(4) Significant lease transactions Finance leases other than those that transfer ownership of the leased assets to the lessee are accounted for using the same methods as those used for ordinary lease transactions.
(5) Significant hedging transactions
a. Basis of accounting Hedging transactions are accounted for on a deferred basis. However, the contracted exchange rates are applied in the case of any financial claims denominated in foreign currencies with assigned foreign currency forwards or other hedging instruments.

27
b. Hedging methods The Company uses derivative transactions (including forward exchange contracts and currency call options) to hedge currency risk exposure for all planned trading transactions that are denominated in foreign currencies.
c. Hedging policy The Company employs derivative financial instruments purely to manage fluctuations in foreign currency exchange rates. Company policy prohibits the use of derivative financial instruments for trading purposes.
d. Hedging evaluation Since hedging methods and the target of each hedging transaction share the same conditions that apply at the start of hedging activities and throughout subsequent periods, the Company’s hedging approach enables exchange rate fluctuations to be offset completely. Hence, the Company considers its hedging method to be highly effective.
(6) Consumption tax
All accounting transactions are booked exclusive of any national or local consumption taxes. 5. Valuation of assets and liabilities of consolidated subsidiaries Assets and liabilities of consolidated subsidiaries are stated at fair value using the partial fair value method.
6. Amortization of consolidated adjustment account Consolidated account adjustments are amortized in equal amounts over five years from the date of accrual. However, small sums are amortized on a lump-sum basis in the fiscal year in which the adjustment arises.
7. Appropriation of retained earnings The Consolidated Statements of Retained Earnings are prepared based on the distribution of profits as determined by consolidated subsidiaries during the fiscal year in question.
8. Cash and cash equivalents Cash and cash equivalents as stated in the Consolidated Statements of Cash Flows consist of cash in hand, readily available deposits, and any short-term liquid investments with a maturity not exceeding three months at the time of purchase whose value is not subject to significant fluctuation risk.
<Change in accounting policy> (Accounting standards relating to impairment of fixed assets) From the fiscal year ended March 31, 2006, the Company adopted the following accounting standards for impairment of fixed assets: “Opinion Concerning Establishment of Accounting Standard for Impairment of Fixed Assets,” (Business Accounting Council, August 9, 2002) and “Implementation Guidance for the Accounting Standard for Impairment of Fixed Assets” (Accounting Standards Board of Japan, October 31, 2003, Financial Accounting Standard Implementation Guidance No. 6). The adoption of these standards had no impact on operating results.

28
Notes to Consolidated Financial Statements (Consolidated Balance Sheets) 1. All amounts have been rounded down to the nearest million yen. 2. Accumulated depreciation of tangible fixed assets
FY 2005 FY 2006 ¥184,991 million ¥192,618 million
3. Value of land acquired through exchange, less accelerated depreciation FY 2005 FY 2006 ¥1,156 million ¥– million
4. Accumulated accelerated depreciation of tangible fixed assets purchased with government subsidy Accelerated depreciation of tangible fixed assets acquired during consolidated accounting period FY 2005 FY 2006 ¥103 million ¥– million
Accumulated accelerated depreciation of tangible fixed assets FY 2005 FY 2006 ¥264 million ¥264 million
5. Amounts corresponding to non-consolidated subsidiaries and affiliates are as follows. Investments in securities
FY 2005 FY 2006 ¥17,864 million ¥18,153 million
Others FY 2005 FY 2006 ¥– million ¥120 million
6. Assets pledged as collateral Buildings and structures FY 2005 FY 2006 ¥1,320 million ¥1,381 million
Machinery and equipment FY 2005 FY 2006 ¥828 million ¥784 million
Land FY 2005 FY 2006 ¥92 million ¥92 million
7. Warranty liabilities FY 2005 FY 2006 ¥879 million ¥1,008 million
8. Shares issued and outstanding Common stock FY 2005 FY 2006 233,214,044 shares 256,535,448 shares
9. Treasury common stock owned by consolidated subsidiaries, equity-method affiliates and non-consolidated subsidiaries accounted for by the equity method Common stock FY 2005 FY 2006 2,026,551 shares 3,800,400 shares

29
(Consolidated Statements of Income) 1. All amounts have been rounded down to the nearest million yen. (Consolidated Statements of Cash Flows) 1. All amounts have been rounded down to the nearest million yen. 2. The reconciliation between year-end balance of cash and cash equivalents and amounts stated in
Consolidated Statements of Cash Flows is as follows. (Millions of yen)
FY 2005 FY 2006 Cash on hand and in banks 54,065 50,111 Marketable securities 6,783 14,339 Total 60,849 64,450 Fixed deposits with periods greater than three months (18) (8,307) Bonds with redemption periods greater than three months at time of purchase (6,783) (13,339) Balance of cash and cash equivalents at end of year 54,047 42,803

30
a. Segment information (1) Business Segment Information
Year Ended March 31, 2005 (Millions of yen)
Flour Milling
Processed Food Others Total Eliminations /
Corporate Consolidated
I. Net Sales and Operating Income
Net sales (1) Net sales to external
customers (2) Internal sales and
transfers
154,888
19,211
218,529
764
42,804
2,326
416,222
22,301
–
(22,301)
416,222
– Total 174,099 219,294 45,130 438,524 (22,301) 416,222
Cost and Expenses 163,127 211,311 40,096 414,535 (21,209) 393,326 Operating Income 10,972 7,982 5,034 23,988 (1,092) 22,896 II. Assets, Depreciation and
Amortization, and Capital Expenditure:
Assets Depreciation and
amortization Capital expenditure
112,774
5,601 7,077
132,595
5,3776,138
53,821
9031,991
299,190
11,88315,207
73,778
(200)(146)
372,968
11,682 15,061
Year Ended March 31, 2006
(Millions of yen)
Flour Milling
Processed Food Others Total Eliminations /
Corporate Consolidated
I. Net Sales and Operating Income
Net sales (1) Net sales to external
customers (2) Internal sales and
transfers
153,850
17,984
221,571
908
45,938
2,514
421,359
21,407
–
(21,407)
421,359
– Total 171,834 222,479 48,452 442,767 (21,407) 421,359
Cost and Expenses 161,073 215,127 43,545 419,746 (20,556) 399,189 Operating Income 10,760 7,352 4,907 23,020 (850) 22,169 II. Assets, Depreciation and
Amortization, and Capital Expenditure:
Assets Depreciation and
amortization Capital expenditure
112,187
5,646 6,236
140,451
5,5285,680
52,228
1,0222,454
304,868
12,19714,371
95,031
(204) (213)
399,899
11,993 14,158
Notes: 1. Business segments were determined by considering similarities between product types. 2. Primary products for each business segment:
Flour Milling: Flour, bran Processed Food: Prepared mix, flour for consumer use, pasta, pasta sauce, frozen food, chilled food, cake and bread ingredients,
biochemical products, life science business, healthcare foods Others: Pet food, engineering, mesh cloths, transport and storage
3. Corporate assets included in the eliminations/corporate category were ¥81,869 million in FY2005 and ¥104,580 million in FY2006. The majority of the assets are held by the parent company as surplus funds (cash and marketable securities) and investments in securities.
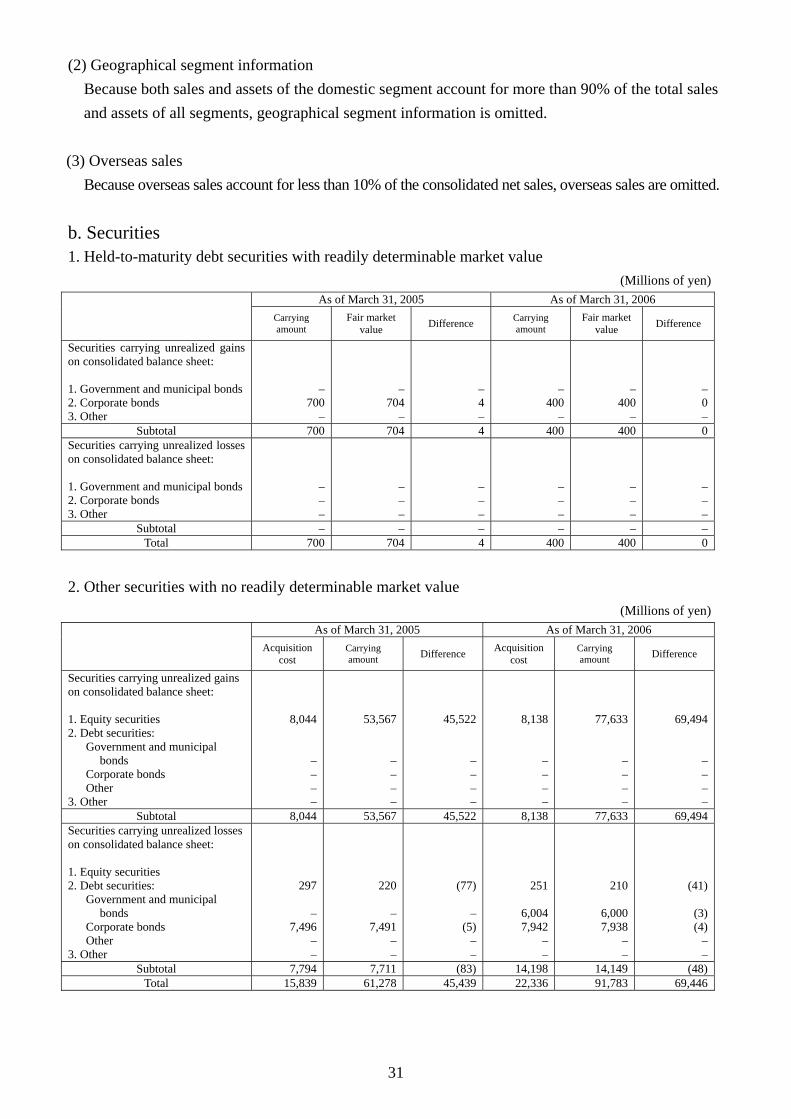
31
(2) Geographical segment information Because both sales and assets of the domestic segment account for more than 90% of the total sales and assets of all segments, geographical segment information is omitted.
(3) Overseas sales
Because overseas sales account for less than 10% of the consolidated net sales, overseas sales are omitted. b. Securities 1. Held-to-maturity debt securities with readily determinable market value
(Millions of yen)
As of March 31, 2005 As of March 31, 2006 Carrying amount
Fair market value Difference Carrying
amount Fair market
value Difference
Securities carrying unrealized gains on consolidated balance sheet: 1. Government and municipal bonds2. Corporate bonds 3. Other
– 700
–
–704
–
–4–
– 400
–
– 400
–
–0–
Subtotal 700 704 4 400 400 0Securities carrying unrealized losses on consolidated balance sheet: 1. Government and municipal bonds2. Corporate bonds 3. Other
– – –
–––
–––
– – –
– – –
–––
Subtotal – – – – – –Total 700 704 4 400 400 0
2. Other securities with no readily determinable market value
(Millions of yen) As of March 31, 2005 As of March 31, 2006
Acquisition cost
Carrying amount Difference Acquisition
cost Carrying amount Difference
Securities carrying unrealized gains on consolidated balance sheet: 1. Equity securities 2. Debt securities: Government and municipal
bonds Corporate bonds Other 3. Other
8,044
– – – –
53,567
––––
45,522
––––
8,138
––––
77,633
– – – –
69,494
––––
Subtotal 8,044 53,567 45,522 8,138 77,633 69,494Securities carrying unrealized losses on consolidated balance sheet: 1. Equity securities 2. Debt securities: Government and municipal
bonds Corporate bonds Other 3. Other
297
– 7,496
– –
220
–7,491
––
(77)
–(5)
––
251
6,0047,942
––
210
6,000 7,938
– –
(41)
(3)(4)
––
Subtotal 7,794 7,711 (83) 14,198 14,149 (48)Total 15,839 61,278 45,439 22,336 91,783 69,446

32
3. Other securities sold during fiscal year (Millions of yen)
Fiscal Year Ended March 31, 2005 Fiscal Year Ended March 31, 2006
Sales amount Total gain on sales Total loss on sale Sales amount Total gain on sales Total loss on sale
1,525 1,387 – 1,005 472 –
4. Principal securities not carried at market value
(Millions of yen) As of March 31, 2005 As of March 31, 2006
Carrying amount Carrying amount Other securities: Non-listed equity securities (except JASDAQ shares)
5,210 5,372
5. Projected redemption value of held-to-maturity debt securities within other securities
(Millions of yen)
As of March 31, 2005 As of March 31, 2006 Within 1 year Within 1–5 years Within 1 year Within 1–5 years
Debt securities: Government and municipal bonds Corporate bonds Other
–7,713
–
–400
–
6,000 8,300
–
–––
Total 7,713 400 14,300 –
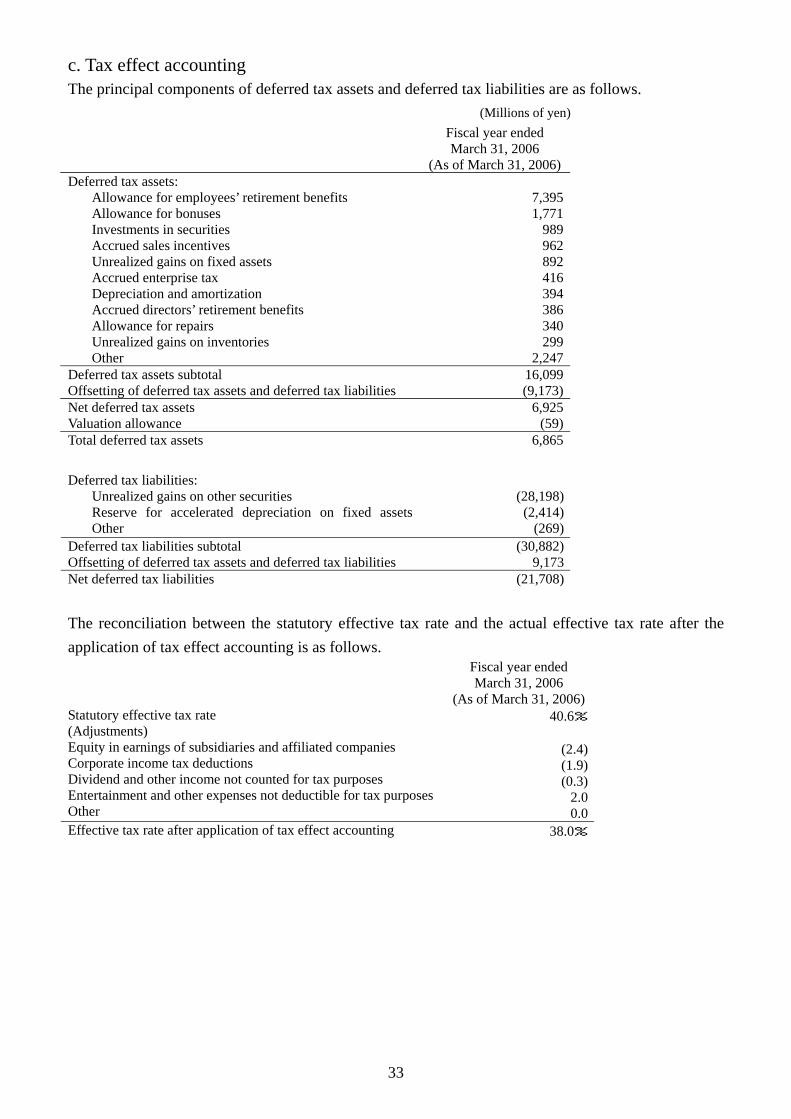
33
c. Tax effect accounting The principal components of deferred tax assets and deferred tax liabilities are as follows.
(Millions of yen)
Fiscal year ended March 31, 2006
(As of March 31, 2006) Deferred tax assets:
Allowance for employees’ retirement benefits Allowance for bonuses Investments in securities Accrued sales incentives Unrealized gains on fixed assets Accrued enterprise tax Depreciation and amortization Accrued directors’ retirement benefits Allowance for repairs Unrealized gains on inventories Other
7,395 1,771
989 962 892 416 394 386 340 299
2,247 Deferred tax assets subtotal Offsetting of deferred tax assets and deferred tax liabilities
16,099 (9,173)
Net deferred tax assets Valuation allowance
6,925 (59)
Total deferred tax assets 6,865 Deferred tax liabilities:
Unrealized gains on other securities Reserve for accelerated depreciation on fixed assets Other
(28,198)
(2,414) (269)
Deferred tax liabilities subtotal Offsetting of deferred tax assets and deferred tax liabilities
(30,882) 9,173
Net deferred tax liabilities (21,708) The reconciliation between the statutory effective tax rate and the actual effective tax rate after the application of tax effect accounting is as follows. Fiscal year ended
March 31, 2006 (As of March 31, 2006)
Statutory effective tax rate (Adjustments) Equity in earnings of subsidiaries and affiliated companies Corporate income tax deductions Dividend and other income not counted for tax purposes Entertainment and other expenses not deductible for tax purposesOther
40.6%
(2.4) (1.9) (0.3)
2.0 0.0
Effective tax rate after application of tax effect accounting 38.0%

34
d. Retirement benefits 1. Outline of retirement benefit plans The parent company and domestic consolidated subsidiaries primarily provide a tax-qualified pension plan together with a lump-sum retirement benefit plan. The parent company and some domestic consolidated subsidiaries have also established a retirement benefit trust. In some cases, employees leaving the Company may receive an additional severance payment beyond that computed on the basis of the actuarial retirement benefit calculated using the relevant accounting standard. 2. Retirement benefit obligation As of March 31, 2005 As of March 31, 2006 (A) Retirement benefit obligation
(Millions of yen)(50,453)
(Millions of yen)(49,868)
(B) Pension plan assets 32,610 38,834(C) Unfunded retirement benefit obligation [(A) + (B)] (17,843) (11,033)(D) Unrecognized actuarial differences 5,864 1,188(E) Unrecognized prior service cost (2,924) (2,725)(F) Net amount recorded on consolidated balance sheet
[(C) + (D) + (E)] (14,902) (12,571)(G) Prepaid pension costs 26 42Accrued employees’ retirement benefits [(F) – (G)] (14,928) (12,614)
Notes: 1. Certain subsidiaries adopt a simplified method for calculating retirement benefit obligation. 2. Following downward revisions to the expected rate of return on pension plan assets and the pension benefit ratios for the
tax-qualified pension plan effective January 1, 2005, the parent company and some domestic consolidated subsidiaries recognized a decrease in prior service cost.
3. Retirement benefit expense Fiscal Year Ended
March 31, 2005 Fiscal Year Ended March 31, 2006
(Millions of yen) (Millions of yen)(A) Service cost 1,690 1,597(B) Interest cost 1,200 1,150(C) Expected return on pension plan assets (727) (774)(D) Amortization of actuarial differences 460 502(E) Amortization of prior service cost (49) (198)(F) Retirement benefit expense [(A) + (B) + (C) + (D) + (E)] 2,575 2,278
Note: Retirement benefit expense incurred by consolidated subsidiaries that adopt simplified pension accounting methodology is recorded under “(A) Service cost.”
. 4. Assumptions used in retirement benefit obligation calculations Fiscal Year Ended March
31, 2005 Fiscal Year Ended March 31, 2006
(A) Method adopted for periodic distribution of projected retirement benefits
Equal amounts per period Equal amounts per period
(B) Discount rate Principally 2.5% Principally 2.5%(C) Expected rate of return on pension plan assets Principally 2.5% Principally 2.5%(D) Amortization period for actuarial differences*1 Principally 15 years Principally 15 years(E) Amortization period for prior service cost*2 15 years 15 years
Notes: 1. Actuarial differences are amortized on a straight-line basis from the following fiscal year based on the average remaining service period of employees expected to receive pension benefits as of the consolidated fiscal year-end.
2. Prior service cost is amortized on a straight-line basis over a period equaling the average remaining service period of employees expected to receive pension benefits as of the consolidated fiscal year-end.

35
e. Per share information (Yen)
Fiscal Year Ended March 31, 2005 Fiscal Year Ended March 31, 2006 Net assets per share 1042.92 Net assets per share 1,046.00Net income per share Fully diluted net income per share
58.0658.00
Net income per share Fully diluted net income per share
52.8052.77
By resolution of the meeting of the Board of Directors held on May 12, 2005, the Company plans to undertake a 1.1 for 1 common stock split on November 18, 2005. Per share information if this stock split had been conducted at the beginning of the fiscal years ended March 31, 2004 and March 31, 2005 is as follows:
Fiscal year ended March 31, 2004
Fiscal year ended March 31, 2005
Net assets per share ¥905.99
Net income per share ¥44.69
Fully diluted net income per share
¥44.69
Net assets per share ¥948.11
Net income per share ¥52.79
Fully diluted net income per share
¥52.73
On November 18, 2005, the Company undertook a 1.1 for 1 common stock split. Assuming that the stock split had taken place at the beginning of the previous fiscal period, the per share information for the year ended March 31, 2005, would be as follows: Net assets per share ¥948.11 Net income per share ¥52.79 Fully diluted net income per share ¥52.73
(Note) The basis of calculation for net income per share and fully diluted net income per share
Item Fiscal Year Ended March 31, 2005
Fiscal Year Ended March 31, 2006
Net income, as stated on Statements of Income (millions of yen) 13,597 13,541
Main components of amounts not attributable to owners of common stock (millions of yen)
Bonuses to directors
172 175Net income associated with common stock (millions of yen) 13,425 13,366Average number of shares of common stock during fiscal year (shares)
231,210,789 253,143,692
Main components of adjustment to net income used in calculation of fully diluted net income per share (millions of yen)
Interest income (after relevant deductions of tax)
(9) –Adjustment to net income (millions of yen) (9) –Main components of increase in number of shares of common stock used in calculation of fully diluted net income per share (shares)
New share subscription rights
86,901 137,735Details of shares not included in calculation of fully diluted net income per share due to non-dilutive effect
––
One issue of convertible bonds issued by affiliate
f. Transactions with related parties No significant transactions with related parties occurred. g. Lease transactions and derivative transactions Due to prior detailed disclosure using electronic processes, the Company has omitted this information in accordance with the provisions of Article 27, Paragraph 30 (6) of the Securities and Exchange Law.

36
h. Subsequent events Fiscal year ended March 31, 2005 Fiscal year ended March 31, 2006
(Stock split) By resolution of the meeting of the Board of Directors held on May 12, 2005, the Company plans to undertake a 1.1 for 1 common stock split on Friday, November 18, 2005, as part of efforts to increase returns to shareholders and to boost the liquidity of the Company’s shares. (1) Increase in number of shares due to stock split The increase shall equal 10% of the total number of shares of common stock outstanding as of the close of trading on Friday, September 30, 2005. Any fractional shares thus created shall be rounded off. (2) Method of stock split All shareholders and beneficial owners of record as of the close of trading on Friday, September 30, 2005 shall receive 1.1 shares for each registered share. Shareholders shall be paid cash in lieu of any fractional shares thus created. (3) Initial date of reckoning for dividend purposes The initial date of reckoning for dividend purposes for new shares created through the stock split shall be Saturday, October 1, 2005. (4) Any other matters pursuant to this stock split shall be resolved at the next meeting of the Board of Directors. Per share information if this stock split had been conducted at the beginning of the fiscal years ended March 31, 2004 and March 31, 2005 is as follows:
Fiscal year ended March 31, 2004
Fiscal year ended March 31, 2005
Net assets per share ¥905.99
Net income per share ¥44.69
Fully diluted net income per share
¥44.69
Net assets per share ¥948.11
Net income per share ¥52.79
Fully diluted net income per share
¥52.73
––

37
V. Status of Production, Orders Received and Sales (1) Production Production by business segments is as follows.
(Millions of yen)
Name of business segment Fiscal Year Ended March 31, 2005
Fiscal Year Ended March 31, 2006 Change (%)
Flour milling Processed food Others
144,080108,81517,277
143,626111,71819,098
(0.3) 2.7
10.5 Total 270,173 274,444 1.6
Notes: 1. The above monetary values were calculated using average sales values during the period under review. Inter-segment transactions
are eliminated. 2. The values listed above do not include consumption taxes.
(2) Orders Received The Company does not produce a significant volume based on orders and description is omitted. (3) Sales Sales by business segment are as follows.
(Millions of yen)
Name of business segment Fiscal Year Ended March 31, 2005
Fiscal Year Ended March 31, 2006 Change (%)
Flour milling Processed food Others
154,888218,52942,804
153,850221,57145,938
(0.7) 1.4 7.3
Total 416,222 421,359 1.2 Notes: 1. Inter-segment transactions are eliminated. 2. The values listed above do not include consumption taxes.