consolidated financial summary for the first …
TRANSCRIPT

CONSOLIDATED FINANCIAL SUMMARYFOR THE FIRST QUARTER ENDED JUNE 30, 2021
(IFRS)July 29, 2021
Company Name: ANRITSU CORPORATION Stock exchange listings: TokyoSecurities code: 6754 URL: https://www.anritsu.comRepresentative: Hirokazu Hamada ; President and DirectorInquiries: Akifumi Kubota ; Director, Executive Vice President, CFO Tel : +81 46 296 6507Quarterly statement filing date (as planned): August 13, 2021Dividend payable date (as planned): -Supplemental material of quarterly results: YesConvening briefing of quarterly results: Yes (for financial analysts and institutional investors)
(Millions of yen, round down)
1. Consolidated financial results of the first quarter ended June 30, 2021(From April 1, 2021 to June 30, 2021)
(1) Consolidated Operating Results (Note) Percentage figures indicate change from the same quarter a year ago.
Revenue Operating profit (loss)
Profit (loss) before tax Profit (loss)
Profit (loss) attributable to
owners of parent
Total comprehensive
incomeFor the three months ended Millions of yen % Millions of yen % Millions of yen % Millions of yen % Millions of yen % Millions of yen %
June, 2021 23,788 -7.4 3,083 -39.8 3,085 -39.7 2,100 -40.6 2,083 -40.7 2,330 -37.1
June, 2020 25,693 10.6 5,121 90.0 5,115 102.1 3,535 97.4 3,515 97.9 3,706 348.4
Basic earnings per share
Diluted earnings per share
For the three months ended Yen Yen
June, 2021 15.16 15.15June, 2020 25.58 25.57
(2) Consolidated Financial Positions
Total assets Total equity Equity attributable to owners of parent
Equity attributable to owners of parent to
total assets ratioFor the three months ended Millions of yen Millions of yen Millions of yen %
June, 2021 141,699 108,430 108,217 76.4For the year ended
March, 2021 144,100 109,455 109,258 75.8
2. DividendsAnnual dividend
First quarter Second quarter Third quarter Fiscal year end TotalFor the year ended Yen Yen Yen Yen Yen
March, 2021 - 15.50 - 24.50 40.00For the year ending
March, 2022 -
For the year ending March, 2022(Forecast) 20.00 - 20.00 40.00
(Note) Correction of dividend forecast from the most recent dividend forecast: No
3. Consolidated Forecast for the year ending March 31, 2022 (From April 1, 2021 to March 31, 2022)(Note) Percentage figures indicate change from the previous period.
Revenue Operating profit (loss)
Profit (loss)before tax Profit (loss)
Profit (loss) attributable to
owners of parent
Basic earnings per share
Millions of yen % Millions of yen % Millions of yen % Millions of yen % Millions of yen % Yen
Annual 114,000 7.6 20,500 4.3 20,500 3.3 16,200 0.3 16,200 0.6 117.85(Note) Correction of financial forecast from the most recent financial forecast: No

※ Others (1) Material changes in subsidiaries during this period
(Changes in scope of consolidations resulting from change in subsidiaries) : None Number of subsidiaries newly consolidated : - Number of subsidiaries excluded from consolidation : -
(2) Changes in accounting policies and accounting estimates 1. Changes in accounting policies required by IFRS : None 2. Changes in accounting policies other than IFRS requirements : None 3. Changes in accounting estimates : None
(3) The number of issued shares 1. Number of issued shares at the period end (including treasury stock)
Q1FY2021 (Jun. 30, 2021) 138,299,494 shares FY2020 (Mar. 31, 2021) 138,282,494 shares 2. Total number of treasury stock at the period end
Q1FY2021 (Jun. 30, 2021) 830,512 shares FY2020 (Mar. 31, 2021) 830,502 shares 3. Average number of issued shares during the period (quarterly period-YTD)
Q1FY2021 (Jun. 30, 2021) 137,460,735 shares Q1FY2020 (Jun. 30, 2020) 137,432,824 shares
This financial summary is not subject to audit by a certified public accountant or an audit corporation.
Notes for using forecasted information and others ・As the business forecast mentioned above are based on the recent information, actual results may vary substantially from projections above due to known or unknown risks, changes relating to uncertainties, and others. The reader should be aware that actual results may be materially different from any future results expressed herein due to various factors. ・With regard to notes for utilizing preconditions of outlook and business forecast, please refer to 1. Consolidated Financial Results (2) Outlook for the Fiscal Year Ending March 31, 2022 at page 4. ・Additional supplemental material related to the financial statements will be available at Anritsu's web site since the results briefing session to be held on July 29, 2021.

INDEX
1. Consolidated Financial Results 2
(1) Operating Results 2
(2) Outlook for the Fiscal Year Ending March 31, 2022 4
2. Condensed Quarterly Consolidated Financial Statements 6
(1) Condensed Quarterly Consolidated Statement of Financial Position 6
(2) Condensed Quarterly Consolidated Statement of Comprehensive Income 8
(3) Condensed Quarterly Consolidated Statements of Changes in Equity 9
(4) Condensed Quarterly Consolidated Statements of Cash Flows 10
(5) Notes to the Consolidated Financial Statements 11
3. Reference Information 12
Consolidated Quarterly Financial Highlights 12
Consolidated Quarterly Financial Position 13
Consolidated Quarterly Segment Information 14
Anritsu Corporation Supplement 15
ANRITSU CORPORATION(6754) Financial Summary of 1st Quarter FY2021
1

1. Consolidated Financial Results(1) Operating Results Three Months Ended June 30, (Millions of yen)
2020 2021 Change
Orders 29,019 28,087 (932) -3.2%
Backlog 25,237 27,249 2,011 8.0%
Revenue 25,693 23,788 (1,904) -7.4%
Operating profit (loss) 5,121 3,083 (2,037) -39.8%
Profit (loss) before tax 5,115 3,085 (2,029) -39.7%
Profit (loss) 3,535 2,100 (1,435) -40.6%
Profit (loss) attributable to owners of parent 3,515 2,083 (1,432) -40.7%
In the field of information and communication, which is the main field of Test and Measurement Business, 5G commercialization schedules of operators in each country are making progress smoothly. In July 2020, 3GPP has standardized release 16*, which prescribe ultralow latency communications and multiple simultaneous connections for expansion of use case. 3GPP is working on standards of release 17*, targeting improved 5G efficiency and capability such as expansion of high frequency range, expansion of communication area, low-power consumption, and low-cost communication. In response, research and development for 5G utilization in the automotive field has begun, as well as research and demonstration experiments for building 5G networks in private domains such as local 5G. Furthermore, research and development for the next generation communication standard, 6G, has begun.
Since the data traffic is expanding rapidly due to sophisticated cloud computing services and the progress of 5G services, the network infrastructure is under strain. To solve this issue, service providers that are pursuing higher-speed networks are concentrating on the promotion of 100Gbps services, and network equipment manufacturers are developing 400Gbps network equipment.
In terms of the business environment, the spread of vaccinations against the COVID-19 is expected to normalize economic activities. However, there are concerns that the reemergence of the infection will have a prolonged impact. In addition, procurement risks due to the global shortage of semiconductors have also become apparent.
Amid such environment, the Test and Measurement Business Group has focused on solution development for the 5G investment demand as well as improvement of organizational infrastructure. Consequently, the group acquired development demand for 5G commercialization. Furthermore, it acquired development and production demand for higher-speed networks.
While in the field of PQA (Product Quality Assurance), automation investment on processed foods production lines is underway, and demand for contaminant inspection using X-rays and quality guarantee toward packaging remained steady. Amid such environment, the PQA Group has worked to reinforce competitiveness of its solutions focused on X-rays, as well as strengthen its sales structure.
As a result, during the first-quarter of the fiscal year ending March 31, 2022, orders decreased 3.2 percent compared with the same period of the previous fiscal year to 28,087 million yen, and revenue decreased 7.4 percent to 23,788 million yen. Operating profit decreased 39.8 percent to 3,083 million yen, profit before tax decreased 39.7 percent to 3,085 million yen. Profit decreased 40.6 percent to 2,100 million yen, and profit attributable to owners of parent decreased 40.7 percent to 2,083 million yen. (*) standard number used in 3GPP
ANRITSU CORPORATION(6754) Financial Summary of 1st Quarter FY2021
2

Operating results by segment are as follows.
1. Test and MeasurementThree Months Ended June 30, (Millions of yen)
2020 2021 Change
Revenue 19,260 16,791 (2,468) -12.8%
Operating profit (loss) 4,946 2,851 (2,095) -42.4%
This segment group develops, manufactures and sells measuring instruments and systems for a variety of communication applications, and service assurance. The group delivers them to service providers, network equipment manufacturers, and maintenance and installation companies.
During the first-quarter of the fiscal year ending March 31, 2022, development demand for 5G chipsets and mobile devices was growing steadily. In addition, we acquired development and production demand for network speedup in data centers. However, revenue have decreased compared with the same period of previous fiscal year due to the global shortage of semiconductors.
Consequently, segment revenue decreased 12.8 percent compared with the same period of previous fiscal year to 16,791 million yen, operating profit decreased 42.4 percent to 2,851 million yen.
2. Products Quality AssuranceThree Months Ended June 30, (Millions of yen)
2020 2021 Change
Revenue 4,416 5,103 687 15.6%
Operating profit (loss) 138 377 239 172.9%
This segment group develops, manufactures and sells production management systems and quality management systems, such as high-precision and high-speed auto checkweighers, automatic combination weighers and metal detectors, for the food, pharmaceutical and cosmetics industries.
During the first-quarter of the fiscal year ending March 31, 2022, capital investment in the food market for the purpose of automating quality assurance processes and saving manpower remained strong both in Japan and overseas. As a result, segment revenue increased 15.6 percent compared with the same period of previous fiscal year to 5,103 million yen, and operating profit increased 172.9 percent to 377 million yen.
3. Others
Three Months Ended June 30, (Millions of yen)
2020 2021 Change
Revenue 2,016 1,893 (123) -6.1%
Operating profit (loss) 194 49 (145) -74.7%
This segment comprises Environmental Measurement, Sensing & Devices, Logistics, Welfare services, Real estate leasing and other businesses.
During the first-quarter of the fiscal year ending March 31, 2022, revenue decreased compared with the same period of previous fiscal year due to intensified price competition in Sensing & Device business. Segment revenue decreased 6.1 percent compared with the same period of the previous fiscal year to 1,893 million yen, and operating profit decreased 74.7 percent to 49 million yen.
ANRITSU CORPORATION(6754) Financial Summary of 1st Quarter FY2021
3

(2) Outlook for the Fiscal Year Ending March 31, 2022Anritsu Group has not changed the performance forecasts announced on April 27, 2021. The economic impact of the COVID-19 varies from region to region, and the impact on our business
also varies from region to region. This forecast assumes that COVID-19 infection status will remain the same in each region. Going forward, the Company will swiftly publish any expectations of material impacts that should be disclosed.
BUSINESS FORECAST FOR THE FISCAL YEAR ENDING MARCH 31, 2022
(Millions of yen) FY2021
Revenue 114,000
Operating profit (loss) 20,500
Profit (loss) before tax 20,500
Profit (loss) 16,200
Profit (loss) attributable to owners of parent 16,200
Assumed annual exchange rate : 1US$=105Yen
ANRITSU CORPORATION(6754) Financial Summary of 1st Quarter FY2021
4

(Reference) FORECAST OF SEGMENT INFORMATION
(Millions of yen)
FY2020 From Apr. 1, 2020
To Mar. 31, 2021
FY2021 From Apr. 1, 2021
To Mar. 31, 2022
Change
Revenue by Segment
Revenue 105,939 114,000 7.6%
Test and Measurement 74,809 82,000 9.6%
PQA 21,419 23,000 7.4%
Others 9,709 9,000 -7.3%
Operating Profit by Segment
Operating Profit 19,651 20,500 4.3%
Test and Measurement 17,714 18,500 4.4%
PQA 1,340 1,800 34.3%
Others 1,797 1,200 -33.3%
Adjustment (1,201) (1,000) -
Revenue by Region
Revenue 105,939 114,000 7.6%
Japan 32,202 37,000 14.9%
Overseas 73,736 77,000 4.4%
Americas 21,380 22,500 5.2%
EMEA 11,021 11,500 4.3%
Asia and Others 41,334 43,000 4.0%
(Note) EMEA: Europe, Middle East and Africa (Note)
Statements made in these materials with respect to Anritsu’s current plans, strategies and beliefs that are not historical fact are forward-looking statements of future business results or other forward-looking projections pertinent to the business of Anritsu. These descriptions are based on assumptions and judgments made by Anritsu’s management from information currently available, and include certain risks and uncertain factors. Actual business results are the outcome of a number of unknown variables, and may substantially differ from the figures projected herein. Furthermore, Anritsu disclaims any obligation, unless required by law, to update or revise any forward-looking statements as a result of new information, future events or otherwise.
Factors which may affect the actual business results include but are not limited to the economic situation in the geographic areas where Anritsu conducts business, including but not limited to Japan, Americas, Europe, and Asia, pressure on prices due to trends in demand for Anritsu’s products and services or to increased competition, Anritsu’s ability to continue supplying products and services that are accepted by customers in a highly competitive market environment, and currency exchange rates.
ANRITSU CORPORATION(6754) Financial Summary of 1st Quarter FY2021
5

2. Condensed Quarterly Consolidated Financial Statements(1) Condensed Quarterly Consolidated Statement of Financial Position
(Millions of yen)
End of FY2020 as of 3.31.21
Q1 FY2021 as of 6.30.21
Assets
Current assets
Cash and cash equivalents 49,810 53,052
Trade and other receivables 26,184 20,442
Other financial assets 14 24
Inventories 20,043 21,382
Income tax receivables 89 88
Other assets 3,672 2,418
Total current assets 99,815 97,409
Non-current assets
Property, plant and equipment 25,277 25,180
Goodwill and intangible assets 5,184 5,431
Investment property 482 440
Trade and other receivables 355 367
Investments accounted for using equity method - 5
Other financial assets 1,826 1,796
Deferred tax assets 6,839 6,770
Other assets 4,319 4,298
Total non-current assets 44,285 44,290
Total assets 144,100 141,699
ANRITSU CORPORATION(6754) Financial Summary of 1st Quarter FY2021
6

(Millions of yen)
End of FY2020 as of 3.31.21
Q1 FY2021 as of 6.30.21
Liabilities and equity
Liabilities
Current liabilities
Trade and other payables 6,671 5,789
Bonds and borrowings 4,131 4,131
Other financial liabilities 844 804
Income tax payables 2,572 1,371
Employee benefits 8,007 5,299
Provisions 396 383
Other liabilities 8,596 12,022
Total current liabilities 31,220 29,802
Non-current liabilities
Trade and other payables 382 377
Other financial liabilities 923 905
Employee benefits 737 735
Provisions 112 110
Deferred tax liabilities 78 78
Other liabilities 1,190 1,259
Total non-current liabilities 3,424 3,466
Total liabilities 34,645 33,269
Equity
Common stock 19,171 19,182
Additional paid-in capital 28,391 28,392
Retained earnings 56,402 55,122
Treasury stock (1,120) (1,120)
Other components of equity 6,413 6,639
Total equity attributable to owners of parent 109,258 108,217
Non-controlling interests 196 213
Total equity 109,455 108,430
Total liabilities and equity 144,100 141,699
ANRITSU CORPORATION(6754) Financial Summary of 1st Quarter FY2021
7

(2) Condensed Quarterly Consolidated Statement of Comprehensive Income(Millions of yen)
FY2020 (3 months)
From April 1, 2020 to June 30, 2020
FY2021 (3 months)
From April 1, 2021 to June 30, 2021
Revenue 25,693 23,788 Cost of sales 11,242 11,317
Gross profit 14,450 12,470
Other revenue and expenses
Selling, general and administrative expenses 6,483 6,732
Research and development expense 2,871 2,783 Other income 67 150 Other expenses 41 20
Operating profit (loss) 5,121 3,083 Finance income 84 82 Finance expenses 89 80 Profit (loss) before tax 5,115 3,085 Income tax expense 1,579 984 Profit (loss) 3,535 2,100 Other comprehensive income
Items that will not be reclassified to profit or loss
Change of financial assets measured at fair value
215 (33)
Total 215 (33) Items that may be reclassified subsequently to profit or loss
Exchange differences on translation (44) 263
Total (44) 263
Total of other comprehensive income 170 229
Comprehensive income 3,706 2,330
Profit (loss), attributable to :
Owners of parent 3,515 2,083
Non-controlling interests 19 17
Total 3,535 2,100
Comprehensive income attributable to :
Owners of parent 3,686 2,313
Non-controlling interests 19 17
Total 3,706 2,330
Earnings per share
Basic earnings per share (Yen) 25.58 15.16
Diluted earnings per share (Yen) 25.57 15.15
ANRITSU CORPORATION(6754) Financial Summary of 1st Quarter FY2021
8

(3) Condensed Quarterly Consolidated Statements of Changes in EquityThree months ended June 30, 2020 (From April 1, 2020 to June 30, 2020)
(Millions of yen)
Common
stock
Additional paid-in capital
Retained earnings
Treasury stock
Other
components
of equity
Total equity
attributable
to owners of
parent
Non-controlling interests
Total equity
Balance at April 1, 2020 19,151 28,277 43,182 (1,119) 4,681 94,172 159 94,331
Profit (loss) - - 3,515 - - 3,515 19 3,535
Other comprehensive income - - - - 170 170 - 170
Total comprehensive income - - 3,515 - 170 3,686 19 3,706
Share-based payments 10 50 (0) 0 - 61 - 61
Dividends paid - - (2,748) - - (2,748) - (2,748)
Purchase of treasury stock - - - (0) - (0) - (0)
Dividends to non-controlling interests
- - - - - - (0) (0)
Transfer from other components of equity to retained earnings
- - 2 - (2) - - -
Total transactions with owners and other transactions
10 50 (2,745) (0) (2) (2,687) (0) (2,687)
Balance at June 30, 2020 19,161 28,328 43,952 (1,119) 4,849 95,171 178 95,350
Three months ended June 30, 2021 (From April 1, 2021 to June 30, 2021) (Millions of yen)
Common
stock
Additional paid-in capital
Retained earnings
Treasury stock
Other
components
of equity
Total equity
attributable
to owners of
parent
Non-controlling interests
Total equity
Balance at April 1, 2021 19,171 28,391 56,402 (1,120) 6,413 109,258 196 109,455
Profit (loss) - - 2,083 - - 2,083 17 2,100
Other comprehensive income - - - - 229 229 - 229
Total comprehensive income - - 2,083 - 229 2,313 17 2,330
Share-based payments 11 1 - - - 13 - 13
Dividends paid - - (3,367) - - (3,367) - (3,367)
Purchase of treasury stock - - - (0) - (0) - (0)
Dividends to non-controlling interests
- - - - - - (0) (0)
Transfer from other components of equity to retained earnings
- - 3 - (3) - - -
Total transactions with owners and other transactions
11 1 (3,363) (0) (3) (3,354) (0) (3,354)
Balance at June 30, 2021 19,182 28,392 55,122 (1,120) 6,639 108,217 213 108,430
ANRITSU CORPORATION(6754) Financial Summary of 1st Quarter FY2021
9

(4) Condensed Quarterly Consolidated Statements of Cash Flows
(Millions of yen)
FY2020 (3 months)
From April 1, 2020 to June 30, 2020
FY2021 (3 months)
From April 1, 2021 to June 30, 2021
Cash flows from (used in) operating activities
Profit (Loss) before tax 5,115 3,085
Depreciation and amortization expense 1,219 1,246
Interest and dividends income (69) (38)
Interest expenses 23 14
Loss (Gain) on disposal of property, plant and equipment 1 (7)
Decrease (Increase) in trade and other receivables 2,788 5,641
Decrease (Increase) in inventories (2,185) (1,326)
Increase (Decrease) in trade and other payables (580) (650)
Increase (Decrease) in employee benefits (2,190) (2,691)
Other, net 3,434 4,847
Sub Total 7,555 10,120
Interest received 34 17
Dividends received 34 21
Interest paid (30) (12)
Income taxes paid (2,695) (2,335)
Income taxes refund 1 82
Net cash flows from (used in) operating activities 4,900 7,895
Cash flows from (used in) investing activities
Payments into time deposits (4) -
Proceeds from withdrawal of time deposits 4 3
Purchase of property, plant and equipment (679) (821)
Proceeds from sale of property, plant and equipment 0 7
Purchase of other financial assets (0) (25)
Proceeds from sale of other financial assets 5 7
Other, net (446) (515)
Net cash flows from (used in) investing activities (1,120) (1,344)
Cash flows from (used in) financing activities
Net increase (decrease) in short-term borrowings (73) -
Redemption of bonds (8,000) -
Repayments of lease liabilities (176) (216)
Dividends paid (2,748) (3,367)
Other, net 16 18
Net cash flows from (used in) financing activities (10,982) (3,565)
Effect of exchange rate change on cash and cash equivalents (15) 256
Net increase (decrease) in cash and cash equivalents (7,217) 3,242
Cash and cash equivalents at beginning of period 47,669 49,810
Cash and cash equivalents at end of period 40,451 53,052
ANRITSU CORPORATION(6754) Financial Summary of 1st Quarter FY2021
10

(5) Notes to the Condensed Quarterly Consolidated Financial Statements(Notes regarding Going Concern) None
ANRITSU CORPORATION(6754) Financial Summary of 1st Quarter FY2021
11

3. Reference InformationConsolidated Quarterly Financial HighlightsYear ended March 31, 2021
1st Quarter 2nd Quarter 3rd Quarter 4th Quarter (Millions of yen) Revenue 25,693 26,468 24,403 29,374 Gross profit 14,450 13,927 13,327 15,498 Operating profit (loss) 5,121 4,725 4,213 5,590 Quarterly profit (loss) before tax 5,115 4,609 4,208 5,905 Quarterly profit (loss) 3,535 3,554 3,387 5,666 Quarterly profit (loss) attributable to owners of parent
3,515 3,545 3,383 5,660
Quarterly comprehensive income 3,706 3,406 3,372 9,382 (Yen) Quarterly basic earnings per share 25.58 25.80 24.62 41.18 Quarterly diluted earnings per share 25.57 25.79 24.60 41.16 (Millions of yen) Total assets 129,681 134,069 132,876 144,100 Total equity 95,350 98,736 99,991 109,455 (Yen) Equity attributable to owners of parent per share 692.46 717.00 726.08 794.88 (Millions of yen) Cash flows from operating activities 4,900 8,471 1,206 5,903 Cash flows from investing activities (1,120) (1,418) (1,248) (1,241) Cash flows from financing activities (10,982) (242) (2,434) (800) Net increase (decrease) in cash and cash equivalents
(7,217) 6,778 (2,277) 4,858
Cash and cash equivalents at end of period 40,451 47,230 44,952 49,810
Year ending March 31, 2022 1st Quarter 2nd Quarter 3rd Quarter 4th Quarter
(Millions of yen) Revenue 23,788 - - -
Gross profit 12,470 - - -
Operating profit (loss) 3,083 - - -
Quarterly profit (loss) before tax 3,085 - - -
Quarterly profit (loss) 2,100 - - -
Quarterly profit (loss) attributable to owners of parent
2,083 - - -
Quarterly comprehensive income 2,330 - - -
(Yen) Quarterly basic earnings per share 15.16 - - -
Quarterly diluted earnings per share 15.15 - - -
(Millions of yen) Total assets 141,699 - - -
Total equity 108,430 - - -
(Yen) Equity attributable to owners of parent per share 787.21 - - -
(Millions of yen) Cash flows from operating activities 7,895 - - -
Cash flows from investing activities (1,344) - - -
Cash flows from financing activities (3,565) - - -
Net increase (decrease) in cash and cash equivalents
3,242 - - -
Cash and cash equivalents at end of period 53,052 - - -
ANRITSU CORPORATION(6754) Financial Summary of 1st Quarter FY2021
12

Consolidated Quarterly Financial PositionYear ended March 31, 2021 (Millions of yen)
1st Quarter 2nd Quarter 3rd Quarter 4th Quarter
Assets 129,681 134,069 132,876 144,100 Current assets 89,451 93,424 92,506 99,815 Non-current assets 40,230 40,644 40,370 44,285
Property, plant and equipment 25,204 25,469 25,184 25,277 Goodwill and intangible assets 4,016 4,343 4,686 5,184 Investment property 622 565 524 482 Other non-current assets 10,386 10,266 9,974 13,341
Liabilities 34,331 35,332 32,885 34,645 Current liabilities 27,152 31,202 29,077 31,220 Non-current liabilities 7,178 4,129 3,807 3,424
Equity 95,350 98,736 99,991 109,455 Common stock 19,161 19,167 19,169 19,171 Additional paid-in capital 28,328 28,300 28,311 28,391 Retained earnings 43,952 47,500 48,753 56,402 Treasury stock (1,119) (1,119) (1,120) (1,120) Other component of equity 4,849 4,701 4,686 6,413 Non-controlling interests 178 187 191 196
Interest-bearing debt (including lease liabilities)
6,642 6,603 6,374 5,848
Year ending March 31, 2022 (Millions of yen)
1st Quarter 2nd Quarter 3rd Quarter 4th Quarter
Assets 141,699 - - -
Current assets 97,409 - - -
Non-current assets 44,290 - - -
Property, plant and equipment 25,180 - - -
Goodwill and intangible assets 5,431 - - -
Investment property 440 - - -
Other non-current assets 13,238 - - -
Liabilities 33,269 - - -
Current liabilities 29,802 - - -
Non-current liabilities 3,466 - - -
Equity 108,430 - - -
Common stock 19,182 - - -
Additional paid-in capital 28,392 - - -
Retained earnings 55,122 - - -
Treasury stock (1,120) - - -
Other component of equity 6,639 - - -
Non-controlling interests 213 - - -
Interest-bearing debt (including lease liabilities)
5,818 - - -
ANRITSU CORPORATION(6754) Financial Summary of 1st Quarter FY2021
13

Consolidated Quarterly Segment InformationYear ended March 31, 2021 (Millions of yen)
1st Quarter 2nd Quarter 3rd Quarter 4th Quarter
Orders by Segment 29,019 25,022 25,754 27,770 Test and Measurement 22,047 16,764 17,981 19,597 PQA 4,696 5,645 5,220 6,008 Others 2,276 2,612 2,552 2,165
Backlog by Segment 25,237 23,571 24,326 22,571 Test and Measurement 18,239 16,522 17,082 15,926 PQA 5,208 4,882 5,117 5,185 Others 1,790 2,166 2,127 1,459
Revenue by Segment 25,693 26,468 24,403 29,374 Test and Measurement 19,260 18,262 16,920 20,367 PQA 4,416 5,960 4,971 6,071 Others 2,016 2,245 2,511 2,936
Operating profit (loss) by Segment 5,121 4,725 4,213 5,590 Test and Measurement 4,946 4,052 3,549 5,165 PQA 138 566 273 362 Others 194 328 593 681 Adjustment (158) (222) (203) (618)
Revenue by Region 25,693 26,468 24,403 29,374 Japan 6,162 7,601 7,432 11,006 Americas 5,585 4,928 5,014 5,852 EMEA 2,357 2,773 2,585 3,305 Asia and Others 11,588 11,164 9,371 9,209
Year ending March 31, 2022 (Millions of yen)
1st Quarter 2nd Quarter 3rd Quarter 4th Quarter
Orders by Segment 28,087 - - -
Test and Measurement 19,937 - - -
PQA 5,867 - - -
Others 2,282 - - -
Backlog by Segment 27,249 - - -
Test and Measurement 19,246 - - -
PQA 6,049 - - -
Others 1,953 - - -
Revenue by Segment 23,788 - - -
Test and Measurement 16,791 - - -
PQA 5,103 - - -
Others 1,893 - - -
Operating profit (loss) by Segment 3,083 - - -
Test and Measurement 2,851 - - -
PQA 377 - - -
Others 49 - - -
Adjustment (194) - - -
Revenue by Region 23,788 - - -
Japan 6,130 - - -
Americas 5,101 - - -
EMEA 2,964 - - -
Asia and Others 9,591 - - -
ANRITSU CORPORATION(6754) Financial Summary of 1st Quarter FY2021
14

Anritsu Corporation Supplement1. Supplement of Trend of Results (Millions of yen)
Actual Forecast
2017/3 2018/3 2019/3 2020/3 2021/3 2022/3 Revenue 87,638 85,967 99,659 107,023 105,939 114,000
Change % -8.3% -1.9% 15.9% 7.4% -1.0% 7.6%
Operating profit (loss) 4,234 4,912 11,246 17,413 19,651 20,500 Change % -28.2% 16.0% 128.9% 54.8% 12.8% 4.3%
as % of Revenue 4.8% 5.7% 11.3% 16.3% 18.5% 18.0%
Profit (loss) before taxes 3,628 4,602 11,362 17,181 19,838 20,500 Change % -33.2% 26.8% 146.9% 51.2% 15.5% 3.3%
as % of Revenue 4.1% 5.4% 11.4% 16.1% 18.7% 18.0%
Profit (loss) 2,734 2,898 8,991 13,397 16,143 16,200 Change % -27.4% 6.0% 210.2% 49.0% 20.5% 0.3%
as % of Revenue 3.1% 3.4% 9.0% 12.5% 15.2% 14.2%
Basic earnings per share ¥19.65 ¥20.97 ¥65.20 ¥97.20 ¥117.18 ¥117.86 Orders 88,934 88,542 100,819 107,709 107,567 114,000
Change % -6.0% -0.4% 13.9% 6.8% -0.1% 6.0%
Cash flows from operating activities 9,246 7,946 12,247 14,721 20,481 21,500 Change % -9.3% -14.1% 54.1% 20.2% 39.1% 5.0%
Free cash flows 5,581 4,014 11,631 11,035 15,452 15,500 Change % 384.0% -28.1% 189.7% -5.1% 40.0% 0.3%
Capital expenditures ( * 1,4) 2,588 3,430 2,436 4,518 5,449 6,000 Change % -52.1% 32.5% -29.0% 85.5% 20.6% 10.1%
Depreciation ( * 2,4) 3,935 3,964 4,031 4,732 4,545 5,000 Change % 5.3% 0.7% 1.7% 17.4% -4.0% 10.0%
R&D expenses ( * 3) 11,212 10,556 12,008 13,321 11,246 13,000 Change % -14.3% -5.9% 13.8% 10.9% -15.6% 15.6%
as % of Revenue 12.8% 12.3% 12.0% 12.4% 10.6% 11.4%
Number of Employees 3,788 3,717 3,778 3,881 3,954 - ( * 1) Capitalized development cost booked as intangible asset is not included. ( * 2) Amortization of capitalized development cost booked as intangible asset is not included. ( * 3) R&D expenses are amounts of R&D investment including capitalized development cost.
Thus, these amounts do not agree the R&D expense booked on the consolidated statement of comprehensive income.
( * 4) From the year ended March 31, 2020 include the impact of the application of IFRS 16.
2. Supplement of Quarterly Results (Millions of yen) 2020/Q1 2020/Q2 2020/Q3 2020/Q4 2021/Q1 2021/Q2 2021/Q3 2021/Q4 Revenue 25,693 26,468 24,403 29,374 23,788 - - -
Y o Y 10.6% -0.4% -8.3% -4.0% -7.4% - - - Operating profit 5,121 4,725 4,213 5,590 3,083 - - -
Y o Y 90.0% 20.0% -10.0% -8.3% -39.8% - - - as % of Revenue 19.9% 17.9% 17.3% 19.0% 13.0% - - -
Profit before tax 5,115 4,609 4,208 5,905 3,085 - - -
Y o Y 102.1% 20.0% -13.5% -0.7% -39.7% - - - as % of Revenue 19.9% 17.4% 17.2% 20.1% 13.0% - - -
Profit 3,535 3,554 3,387 5,666 2,100 - - -
Y o Y 97.4% 22.9% -7.4% 12.1% -40.6% - - - as % of Revenue 13.8% 13.4% 13.9% 19.3% 8.8% - - -
(Millions of yen) Upper : Revenue Lower : Operating profit
2020/Q1 2020/Q2 2020/Q3 2020/Q4 2021/Q1 2021/Q2 2021/Q3 2021/Q4
Test and Measurement 19,260 18,262 16,920 20,367 16,791 - - -
4,946 4,052 3,549 5,165 2,851 - - -
PQA 4,416 5,960 4,971 6,071 5,103 - - -
138 566 273 362 377 - - -
Others 2,016 2,245 2,511 2,936 1,893 - - -
194 328 593 681 49 - - -
Adjustment - - - - - - - -
(158) (222) (203) (618) (194) - - -
Total revenue 25,693 26,468 24,403 29,374 23,788 - - -
Total operating profit 5,121 4,725 4,213 5,590 3,083 - - -
ANRITSU CORPORATION(6754) Financial Summary of 1st Quarter FY2021
15
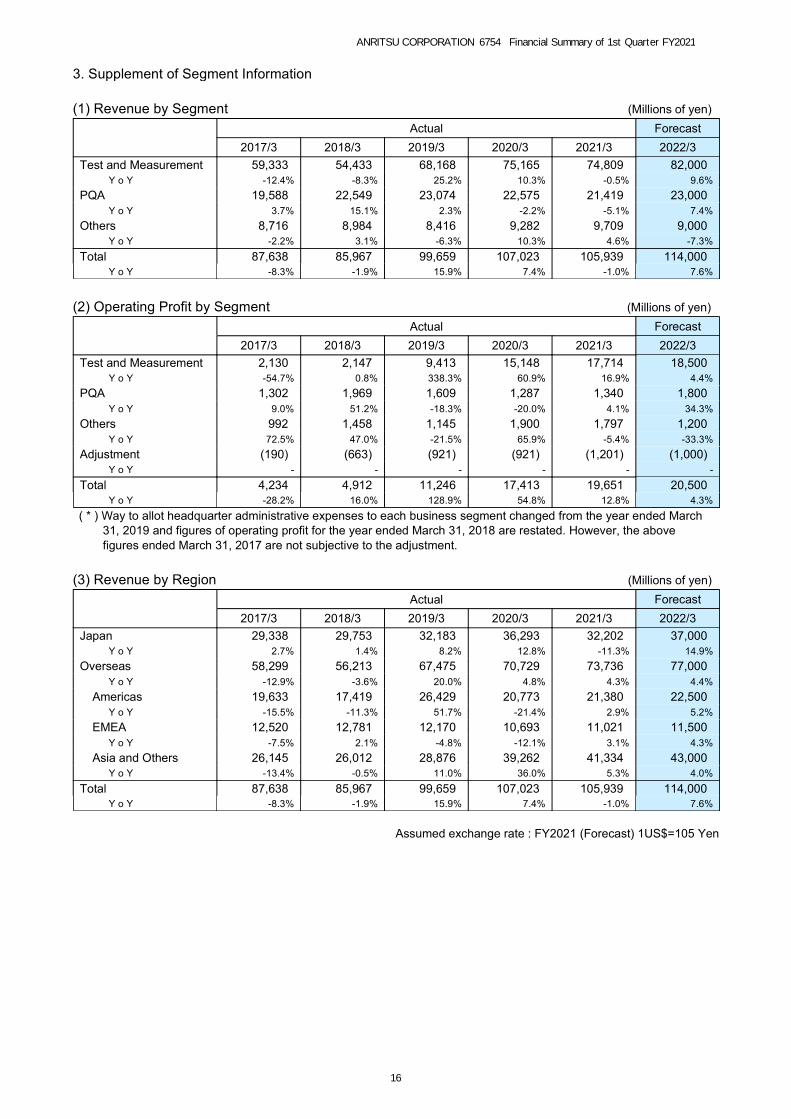
3. Supplement of Segment Information
(1) Revenue by Segment (Millions of yen)
Actual Forecast
2017/3 2018/3 2019/3 2020/3 2021/3 2022/3 Test and Measurement 59,333 54,433 68,168 75,165 74,809 82,000
Y o Y -12.4% -8.3% 25.2% 10.3% -0.5% 9.6%
PQA 19,588 22,549 23,074 22,575 21,419 23,000 Y o Y 3.7% 15.1% 2.3% -2.2% -5.1% 7.4%
Others 8,716 8,984 8,416 9,282 9,709 9,000 Y o Y -2.2% 3.1% -6.3% 10.3% 4.6% -7.3%
Total 87,638 85,967 99,659 107,023 105,939 114,000 Y o Y -8.3% -1.9% 15.9% 7.4% -1.0% 7.6%
(2) Operating Profit by Segment (Millions of yen)
Actual Forecast
2017/3 2018/3 2019/3 2020/3 2021/3 2022/3 Test and Measurement 2,130 2,147 9,413 15,148 17,714 18,500
Y o Y -54.7% 0.8% 338.3% 60.9% 16.9% 4.4%
PQA 1,302 1,969 1,609 1,287 1,340 1,800 Y o Y 9.0% 51.2% -18.3% -20.0% 4.1% 34.3%
Others 992 1,458 1,145 1,900 1,797 1,200 Y o Y 72.5% 47.0% -21.5% 65.9% -5.4% -33.3%
Adjustment (190) (663) (921) (921) (1,201) (1,000) Y o Y - - - - - -
Total 4,234 4,912 11,246 17,413 19,651 20,500 Y o Y -28.2% 16.0% 128.9% 54.8% 12.8% 4.3%
( * ) Way to allot headquarter administrative expenses to each business segment changed from the year ended March 31, 2019 and figures of operating profit for the year ended March 31, 2018 are restated. However, the above figures ended March 31, 2017 are not subjective to the adjustment.
(3) Revenue by Region (Millions of yen)
Actual Forecast
2017/3 2018/3 2019/3 2020/3 2021/3 2022/3 Japan 29,338 29,753 32,183 36,293 32,202 37,000
Y o Y 2.7% 1.4% 8.2% 12.8% -11.3% 14.9%
Overseas 58,299 56,213 67,475 70,729 73,736 77,000 Y o Y -12.9% -3.6% 20.0% 4.8% 4.3% 4.4%
Americas 19,633 17,419 26,429 20,773 21,380 22,500 Y o Y -15.5% -11.3% 51.7% -21.4% 2.9% 5.2%
EMEA 12,520 12,781 12,170 10,693 11,021 11,500 Y o Y -7.5% 2.1% -4.8% -12.1% 3.1% 4.3%
Asia and Others 26,145 26,012 28,876 39,262 41,334 43,000 Y o Y -13.4% -0.5% 11.0% 36.0% 5.3% 4.0%
Total 87,638 85,967 99,659 107,023 105,939 114,000 Y o Y -8.3% -1.9% 15.9% 7.4% -1.0% 7.6%
Assumed exchange rate : FY2021 (Forecast) 1US$=105 Yen
ANRITSU CORPORATION(6754) Financial Summary of 1st Quarter FY2021
16