‘transforming data to knowledge for the livestock...
TRANSCRIPT

B R S S E M I N A R S E R I E S P R E S E N T S :
Friday 4 February(Scroll down to view details of BRS Seminar - Friday 11 February)
‘Transforming Data to Knowledgefor the Livestock Industry’
Greg Laughlin - BRS
This seminar is a demonstration of how to ‘transform data into knowledge’ and disseminate it to a wideaudience. Our integrated toolset for assessing current rainfall and pasture conditions as well as their near-future prospects, will improve climate risk management in Australia’s southern livestock industry. These toolswill be widely accessible to farmers via the internet, and will improve their ability to understand climatevariability and risk. Farmers will be able to convert this knowledge into better within-season managementdecisions.
11.00am - 12:00noon (morning tea at 10:45am)Edmund Barton Conference Centre (in the courtyard)
Edmund Barton BuildingKings Avenue, Canberra
Bookings not required.For further details, please call the BRS Seminar Coordinator on 6272 3440.
For further information on BRS Seminars or to obtain papers/presentations supplied by previous seminarpresenters, please visit our website at: www.brs.gov.au/brsseminars

S C I E N C E F O R D E C I S I O N M A K E R SD E P A R T M E N T O F A G R I C U L T U R E , F I S H E R I E S A N D F O R E S T R Y
S C I E N C E F O R D E C I S I O N M A K E R S
B u r e a u o fR u r a l S c i e n c e s
Transforming data into knowledge for the Livestock Industry
Greg Laughlin, Simon Knapp and Simon Barry
S C I E N C E F O R D E C I S I O N M A K E R S
• Meat and Livestock Australia
Hutton Oddy and Peter Speck
• BRS
Tim Brinkley, Kema Ranatunga, Ian McNaught, Robert Smart, Stuart Row,
John Sims, Brett Cullen, Antti Roppola, bound to be more!
• BoM
David Jones, Mike Coughlan, Mike Manton
• CRES ANU
Mike Hutchinson, Anthony Clark
• The MLA Reference Group
Barry White (MCVP), Ian Johnson, John Black, Peter Horwood, Terrey
Johnson, Tom Ellis
• CSIRO PI
John Donnelly, Libbey Salmon
Acknowledgements

S C I E N C E F O R D E C I S I O N M A K E R S
Outline
• Feel free to ‘interrupt’
• An overview of the project (development of an electronic
toolset for livestock producers)
• Examples of how the toolset has evolved as a
result of meaningful dialog with farmers- e.g. 1 mode of presenting dynamic outputs
- e.g. 2 choice of pasture growth model
• Progress on seasonal forecasting and the
pasture growth model
• Concluding remarks

S C I E N C E F O R D E C I S I O N M A K E R S
Overall mission
Develop and deliver via the web, an integrated toolset for
assessing current rainfall and pasture conditions…to
improve climate risk management in Australia’s southern
livestock industry
To incorporate climate forecasts into the toolset if they add
‘value’ to decision making
Provide outputs that are ‘farmer-friendly’ and ‘farmer
relevant’

S C I E N C E F O R D E C I S I O N M A K E R S
In Plain English please
Web deliver the following for many sites in southern
Australia
• Useful information about the sitese.g. Growing season, livestock numbers, soils, climate variability
• Relevant information about how this season is trackingRainfall, pasture
Placed in historical context
Up-to-date (i.e. automatically updated weekly)
• Useful insights (if available) about how the season might
unfold
STATIC REPORT
DYNAMIC REPORT
S C I E N C E F O R D E C I S I O N M A K E R S
In Plain English please
So why climate variability and not climate change as the
emphasis?
For most Australian agricultural industries, within-season variability remains the
most important feature of climate that affects profitability. The ways in which
underlying, long-term trends in climate affect within-season variability is the
most important feature of climate change for rural industries.
Source: Farming Profitably in a Changing Climate: Workshop
Summary 2004 (Will Steffen, former ED International Geosphere Biosphere Program; BRS fellow)
S C I E N C E F O R D E C I S I O N M A K E R S
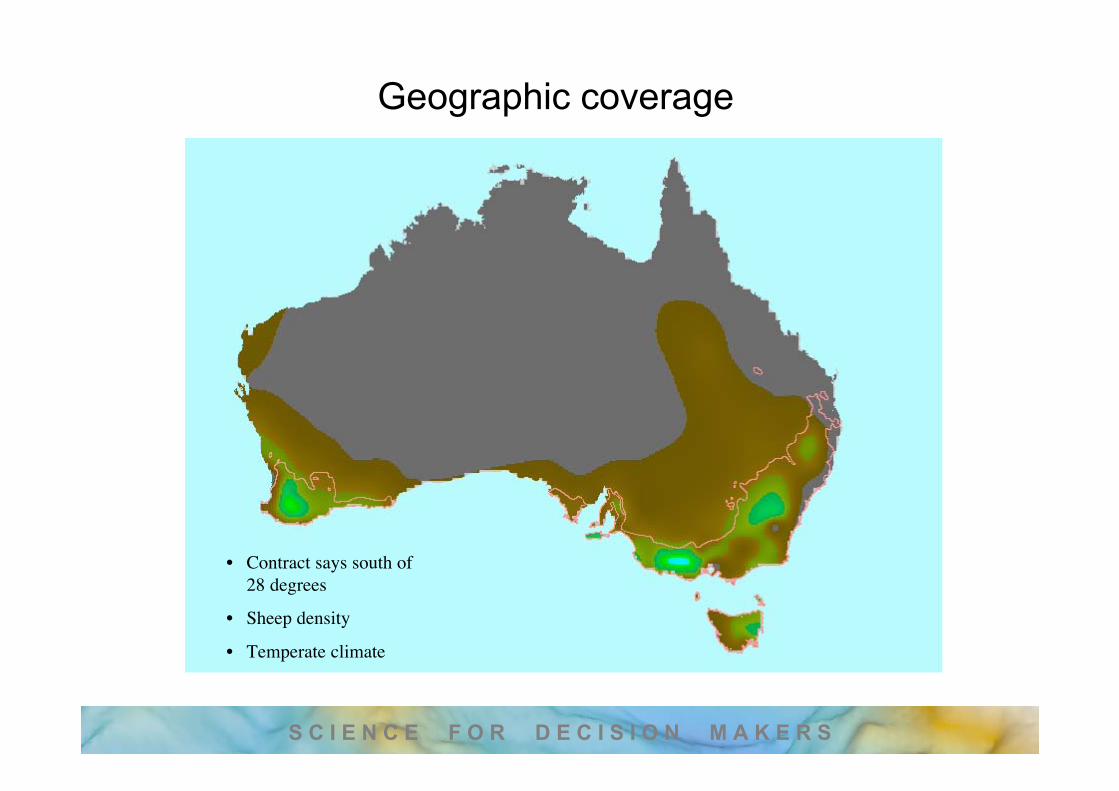
Geographic coverage
• Contract says south of28 degrees
• Sheep density
• Temperate climate

S C I E N C E F O R D E C I S I O N M A K E R S
Daily meteorological data 1886 to now
• SILO PPD is a subset of all availablemet. sites
• In-filled missing data• 3000+ sites to support toolset• a lot of data!• Simon has written a fair bit of code

S C I E N C E F O R D E C I S I O N M A K E R S
Selecting one of the SILO PPD sites
• Log onto the Internet
• Select one or more SILO PPD sites (previous figure) froma simple map interface
• Toolset ‘remembers’ users’ selections

S C I E N C E F O R D E C I S I O N M A K E R S
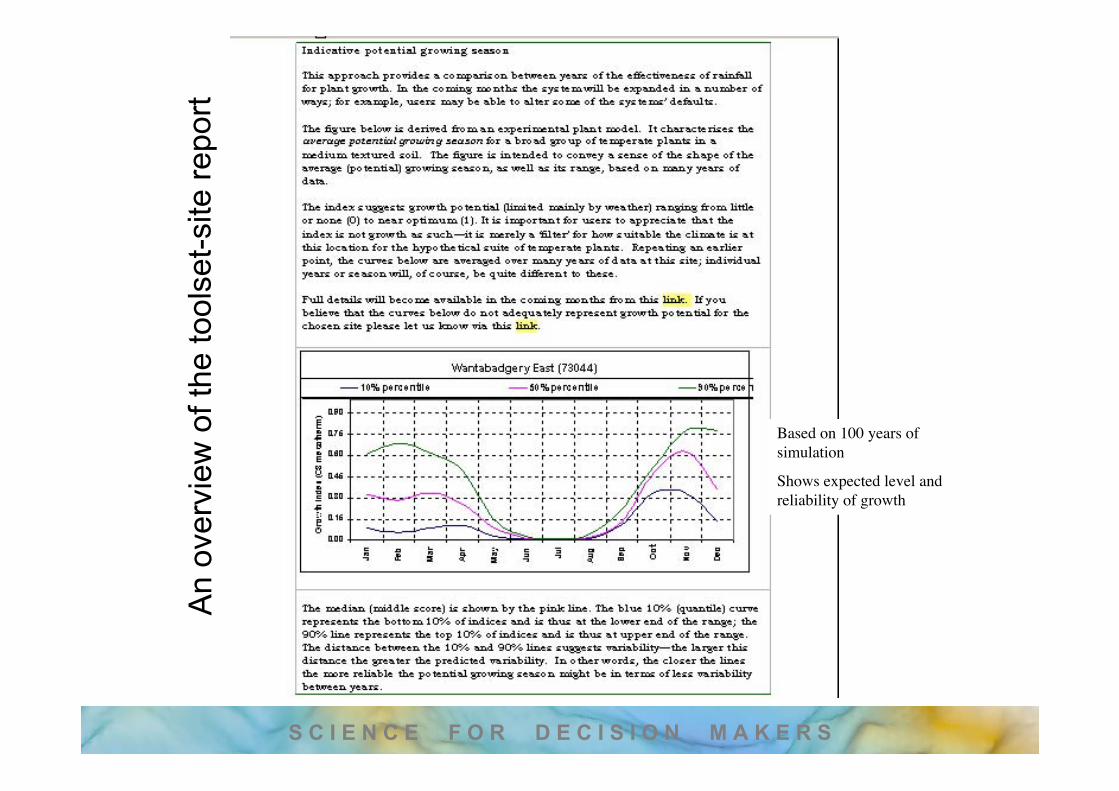
An
over
view
of t
he to
olse
t-si
te r
epor
t
S C I E N C E F O R D E C I S I O N M A K E R S
An
over
view
of t
he to
olse
t-si
te r
epor
t
Based on 100 years ofsimulation
Shows expected level andreliability of growth

S C I E N C E F O R D E C I S I O N M A K E R S
Examples of how the toolset has evolved as a
result of meaningful dialog with farmers
• Example 1: Dynamic outputs (updated weekly)
- year-to-date rainfall and pasture
- future prospects
S C I E N C E F O R D E C I S I O N M A K E R S
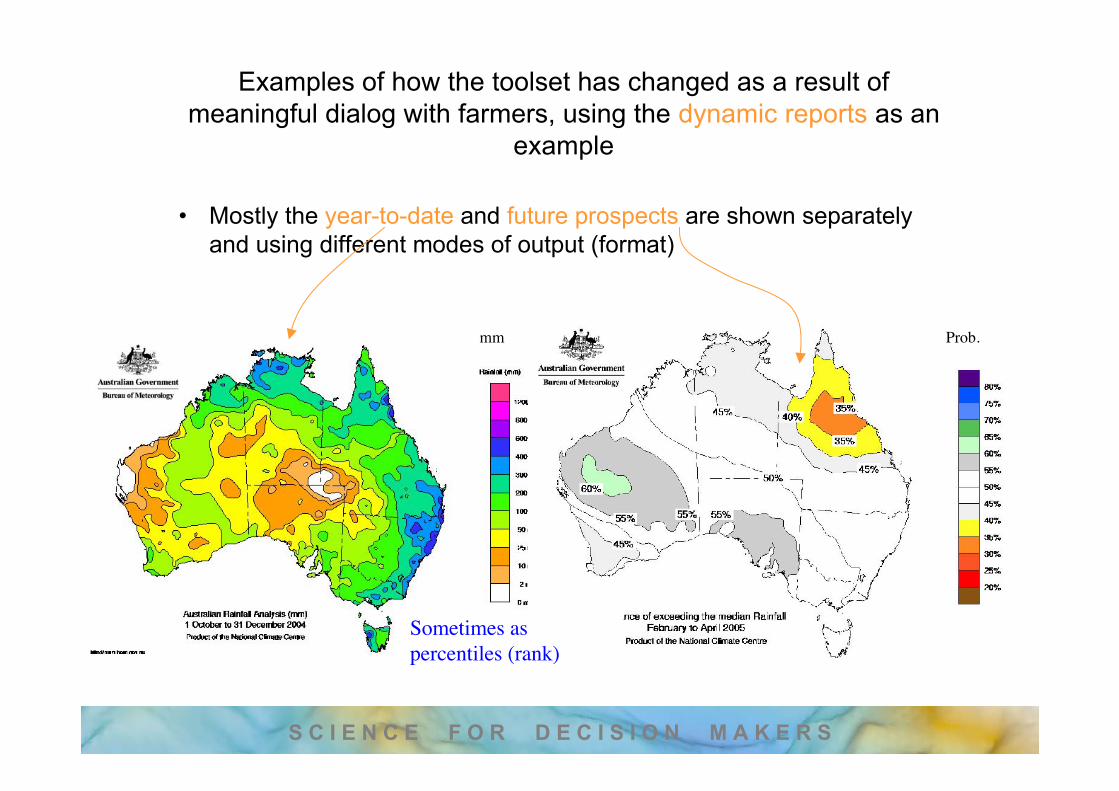
Examples of how the toolset has changed as a result ofmeaningful dialog with farmers, using the dynamic reports as an
example
• Mostly the year-to-date and future prospects are shown separatelyand using different modes of output (format)
mm Prob.
Sometimes aspercentiles (rank)
S C I E N C E F O R D E C I S I O N M A K E R S
Dialog with farmers
• From a farmer’s perspective the year-to-date and futureprospects need to be combined
• 35% probability concept is hard to understand
- how far above or below the median?
- how variable might a ‘correct’ prediction be?
• Next slides show how we tried to combine these into a singlemode of output…for a site in SA

S C I E N C E F O R D E C I S I O N M A K E R S
Week number (1-52)
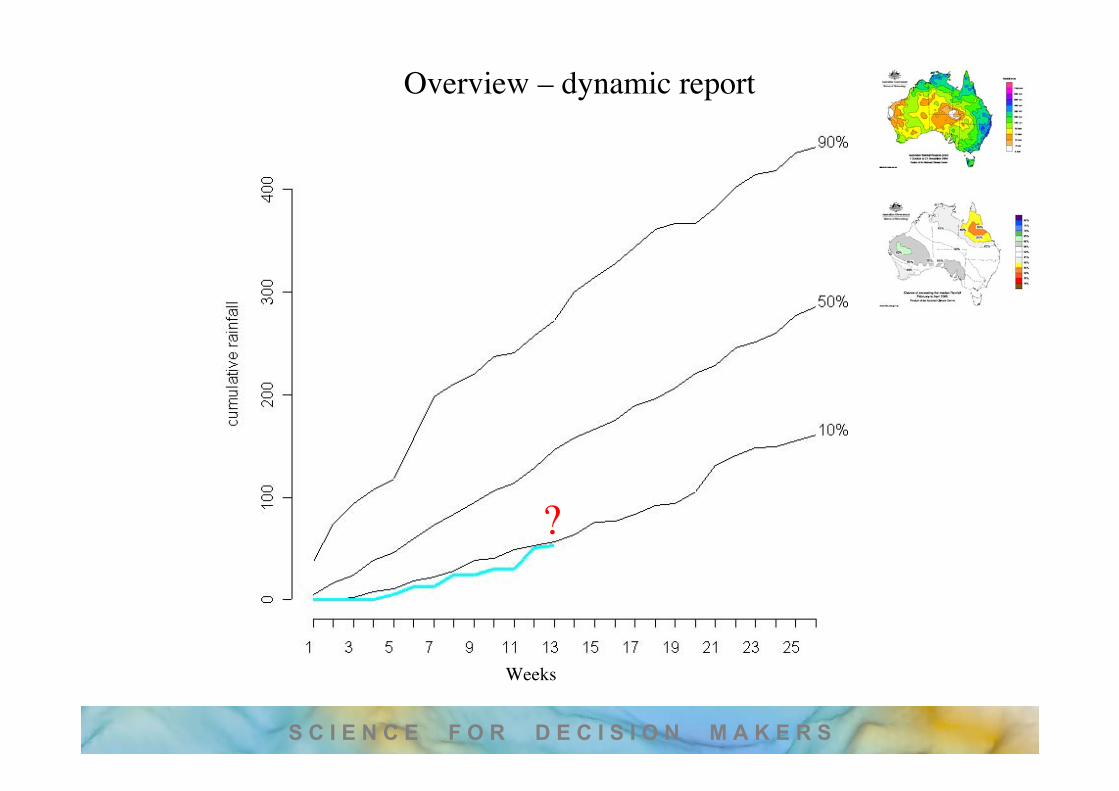
Overview – dynamic report

S C I E N C E F O R D E C I S I O N M A K E R S
Overview – dynamic report
These lines aresummaries of 118 yearsof records
S C I E N C E F O R D E C I S I O N M A K E R S
Overview – dynamic report
?
Weeks

S C I E N C E F O R D E C I S I O N M A K E R S
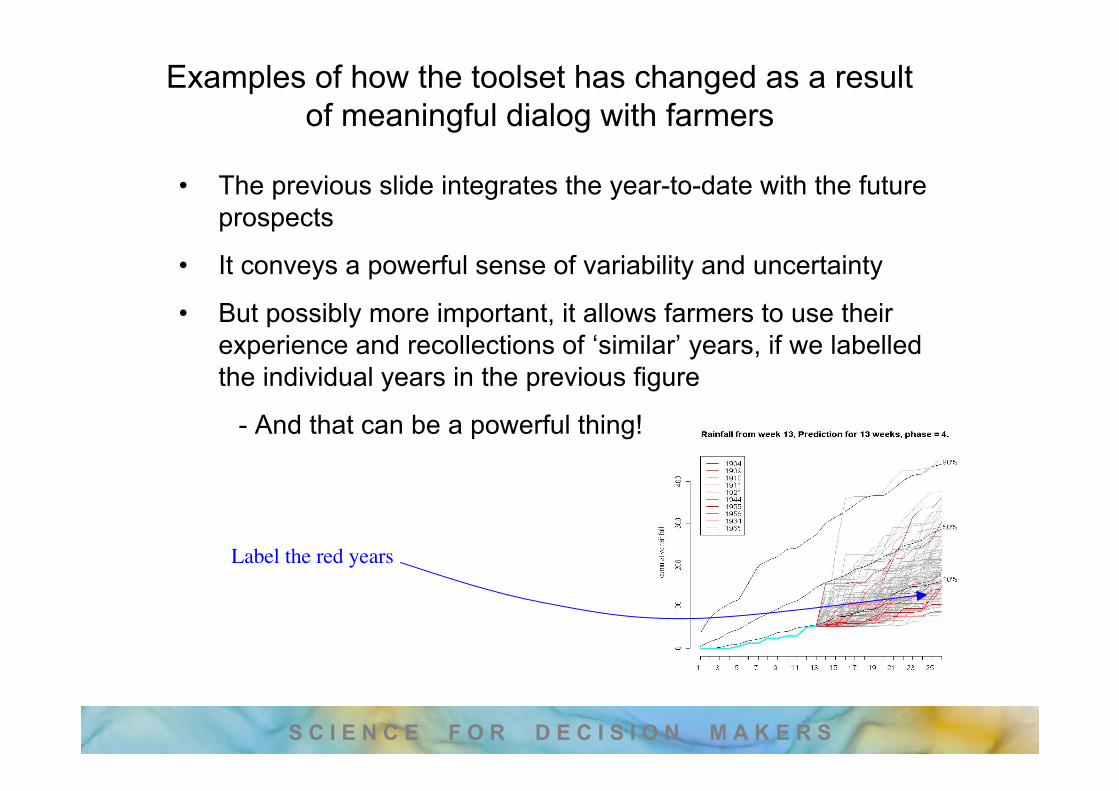
•Grey = full range ofpossibilities•Red= chosen by forecastingsystem•Individual years convey avery different sense ofcertainty
Chosen because these yearshad the same ocean temp.patterns at the same time ofyear
S C I E N C E F O R D E C I S I O N M A K E R S
Examples of how the toolset has changed as a resultof meaningful dialog with farmers
• The previous slide integrates the year-to-date with the futureprospects
• It conveys a powerful sense of variability and uncertainty
• But possibly more important, it allows farmers to use theirexperience and recollections of ‘similar’ years, if we labelledthe individual years in the previous figure
- And that can be a powerful thing!
Label the red years

S C I E N C E F O R D E C I S I O N M A K E R S
Examples of how the toolset has changed as a result of meaningfuldialog with farmers
• Having arrived at such a format for rain, we assumed pasture growth wouldbe similarly handled, and so produced this
Test
Past, present and future onone figure…nice
S C I E N C E F O R D E C I S I O N M A K E R S
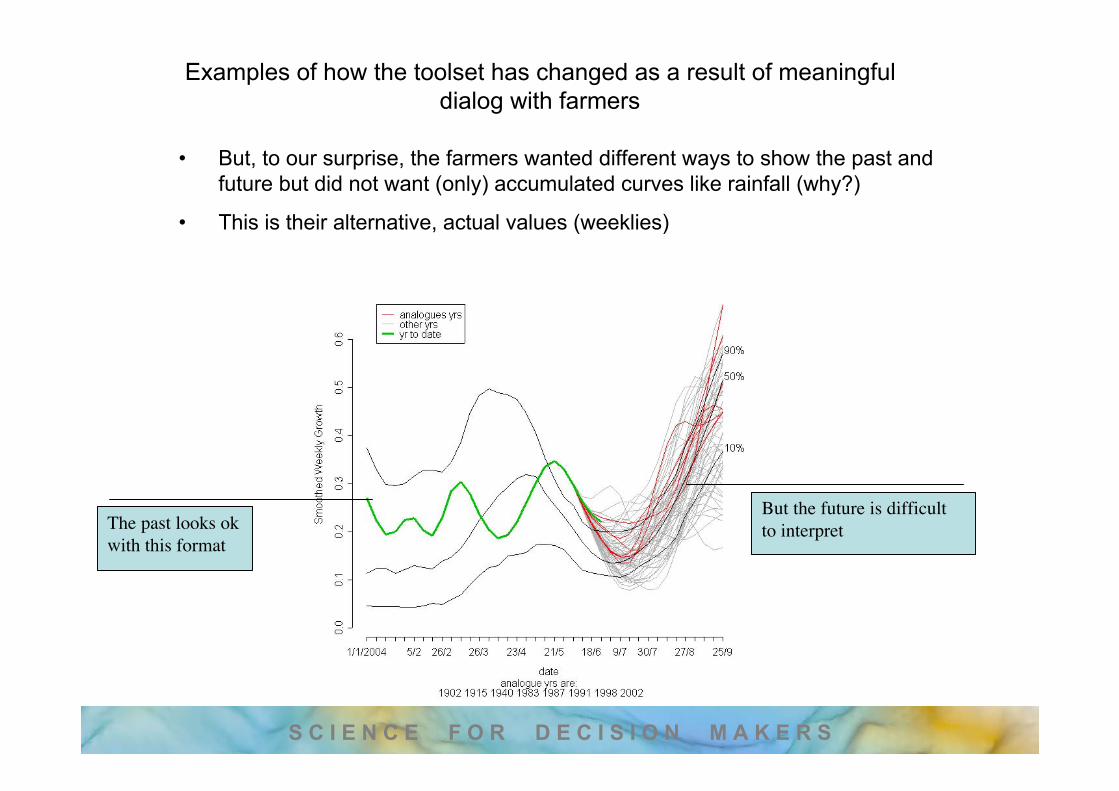
Examples of how the toolset has changed as a result of meaningfuldialog with farmers
• But, to our surprise, the farmers wanted different ways to show the past andfuture but did not want (only) accumulated curves like rainfall (why?)
• This is their alternative, actual values (weeklies)
The past looks okwith this format
But the future is difficultto interpret
Test

S C I E N C E F O R D E C I S I O N M A K E R S
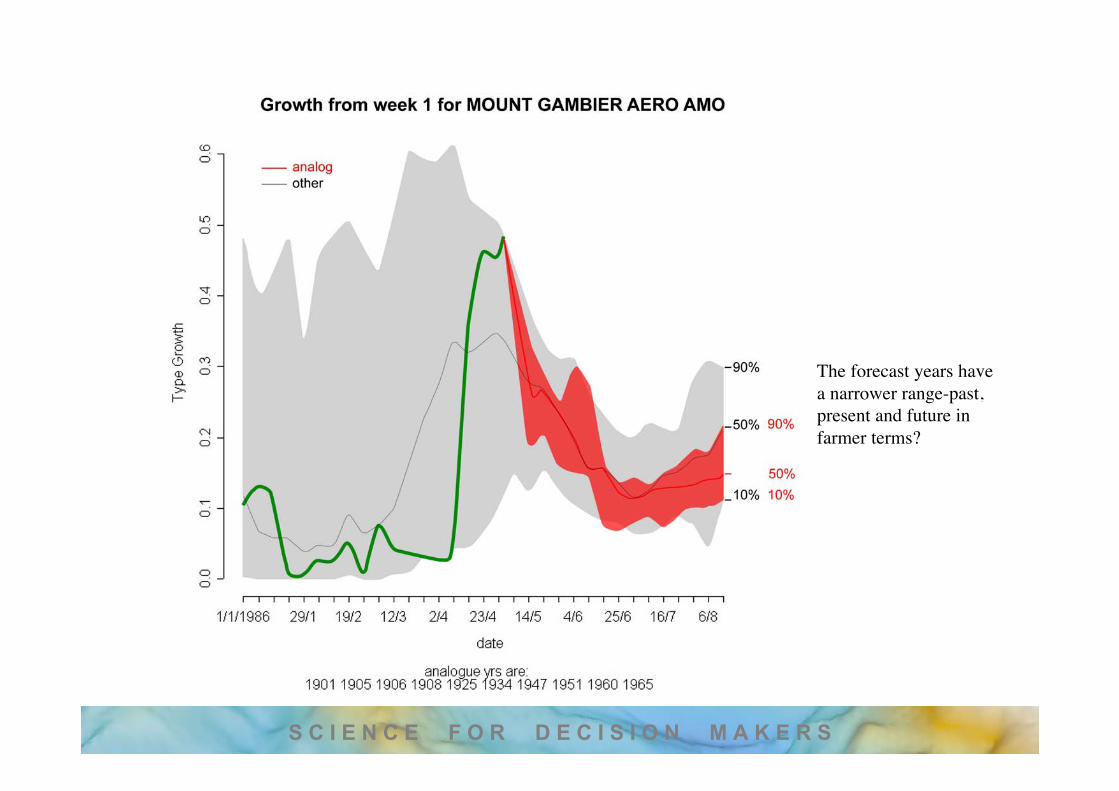
Examples of how the toolset has changed as a result of meaningfuldialog with farmers
• Many, many iterations later …
Test
S C I E N C E F O R D E C I S I O N M A K E R S
Test
The forecast years havea narrower range-past,present and future infarmer terms?

S C I E N C E F O R D E C I S I O N M A K E R S
TestExamples of how the toolset has changed as a
result of meaningful dialog with farmers
• Example 2: Choice of pasture model
- we assumed that since the contract specified rainfalland pasture conditions, then, eventually, we would needto be able to predict pasture growth
- pasture growth is complex and requires many site-specific variables (soil, management, stocking rates etc)
- could take years to achieve this for 3,000 sites
- was our assumption correct?
S C I E N C E F O R D E C I S I O N M A K E R S
Test What did the farmers say?
¸ we know what feed we have on the ground
¸ we know what soils and pastures we have in ourdifferent paddocks, as well as stocking rates etc
¸you let us worry about those (above) things and youworry about the weather
¸ in other words, you tell us about how conducive theweather has been/will be for growth and let us link that towhat’s in our paddocks

S C I E N C E F O R D E C I S I O N M A K E R S
TestExamples of how the toolset has changed as a
result of meaningful dialog with farmers
• What did we do?
GROWEST Version 2.0
M.F. Hutchinson, H.A. Nix and C. McTaggart
GI = LI x TI x MI (mostly weather-driven)
A simple 0-1 index
GROWEST PLUS – A tool for rapid assessment ofseasonal growth for environmental planning andassessment
Timothy R. Brinkley, Gregory P. Laughlin and Michael F.Hutchinson

S C I E N C E F O R D E C I S I O N M A K E R S
TestExamples of how the toolset has changed as a
result of meaningful dialog with farmers
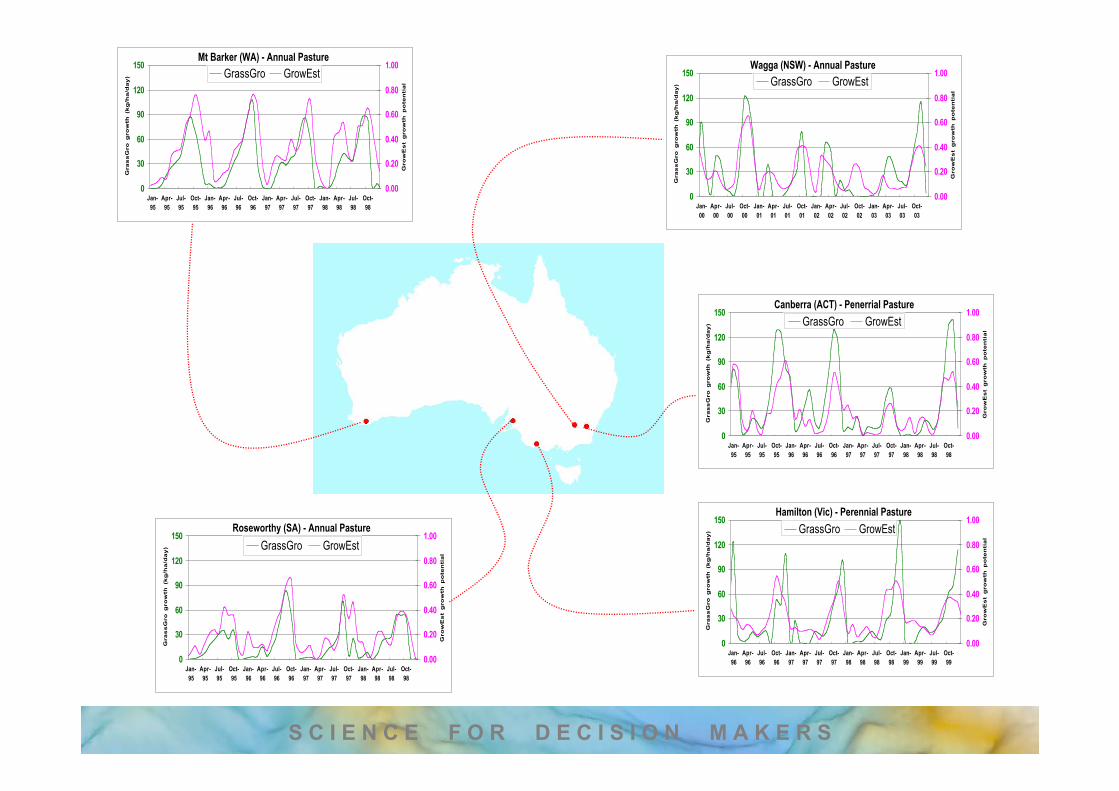
• What did the farmers say?
- this simple little model has been able tomeaningfully characterise the average growingseason (site reports)
- it has been able to rank the various seasons
- and more important (?) … the farmers can relateto its use, advantages and especially its‘limitations’ (weather-driven)
- it is basically keeping a ‘running account’ of the weatherand farmers have always known how to manage aroundthat

S C I E N C E F O R D E C I S I O N M A K E R S
TestProgress on seasonal forecasting and the pasture
growth model
• Maintaining farmers’ ‘trust’ is crucial
• We must continue to ask questions like
How good are the forecasts?
Although we use GrowEst in a particular way,how might it compare to growth that a farmer cansee (and sooner or later farmers will compare)

S C I E N C E F O R D E C I S I O N M A K E R S
TestSeasonal forecasting
• Based on persistent patterns of oceantemperatures in Pacific and Indian oceans
• 9 patterns (phases)
• Red lines (forecast) are those years in the recordwhich had the ocean temp. patterns at the sametime of year
• 1 month lead, 3 month coverage

S C I E N C E F O R D E C I S I O N M A K E R S
Test

S C I E N C E F O R D E C I S I O N M A K E R S
Test
Same test, randomised phase table, 200 re-samples…oh dear
More work needed!
S C I E N C E F O R D E C I S I O N M A K E R S
Wagga (NSW) - Annual Pasture
0
30
60
90
120
150
Jan-00
Apr-00
Jul-00
Oct-00
Jan-01
Apr-01
Jul-01
Oct-01
Jan-02
Apr-02
Jul-02
Oct-02
Jan-03
Apr-03
Jul-03
Oct-03
Gra
ss
Gro
g
row
th (k
g/h
a/d
ay
)
0.00
0.20
0.40
0.60
0.80
1.00
Gro
wE
st
gro
wth
p
ote
nti
al
GrassGro GrowEst
Mt Barker (WA) - Annual Pasture
0
30
60
90
120
150
Jan-95
Apr-95
Jul-95
Oct-95
Jan-96
Apr-96
Jul-96
Oct-96
Jan-97
Apr-97
Jul-97
Oct-97
Jan-98
Apr-98
Jul-98
Oct-98
Gra
ss
Gro
g
row
th (k
g/h
a/d
ay
)
0.00
0.20
0.40
0.60
0.80
1.00
Gro
wE
st
gro
wth
p
ote
nti
al
GrassGro GrowEst
Roseworthy (SA) - Annual Pasture
0
30
60
90
120
150
Jan-95
Apr-95
Jul-95
Oct-95
Jan-96
Apr-96
Jul-96
Oct-96
Jan-97
Apr-97
Jul-97
Oct-97
Jan-98
Apr-98
Jul-98
Oct-98
Gra
ss
Gro
g
row
th (k
g/h
a/d
ay
)
0.00
0.20
0.40
0.60
0.80
1.00
Gro
wE
st
gro
wth
p
ote
nti
al
GrassGro GrowEst
Canberra (ACT) - Penerrial Pasture
0
30
60
90
120
150
Jan-95
Apr-95
Jul-95
Oct-95
Jan-96
Apr-96
Jul-96
Oct-96
Jan-97
Apr-97
Jul-97
Oct-97
Jan-98
Apr-98
Jul-98
Oct-98
Gra
ss
Gro
g
row
th (k
g/h
a/d
ay
)
0.00
0.20
0.40
0.60
0.80
1.00
Gro
wE
st
gro
wth
p
ote
nti
al
GrassGro GrowEst
Hamilton (Vic) - Perennial Pasture
0
30
60
90
120
150
Jan-96
Apr-96
Jul-96
Oct-96
Jan-97
Apr-97
Jul-97
Oct-97
Jan-98
Apr-98
Jul-98
Oct-98
Jan-99
Apr-99
Jul-99
Oct-99
Gra
ss
Gro
g
row
th (k
g/h
a/d
ay
)
0.00
0.20
0.40
0.60
0.80
1.00
Gro
wE
st
gro
wth
p
ote
nti
al
GrassGro GrowEst

S C I E N C E F O R D E C I S I O N M A K E R S
TestConcluding comments in the context of science for
agriculture
• Facts do not necessarily speak forthemselves
• Useful to ask whether the science is reallylimiting the effectiveness of the project?
• Or could it be the communication of thescience?

S C I E N C E F O R D E C I S I O N M A K E R S
Test• A user reference group can really help
• If the group works well:
be prepared to have ‘your science’ questioned
be more prepared to have your outputs changed (andchanged again)
• Keep it simple if you can, but …
• Continue to develop the scientific andstatistical underpinnings
• Try not to think of statisticians as scary
They have added agreat deal to thisproject