future of canola - data.daff.gov.au
TRANSCRIPT

FUTURE OF
CANOLAPRODUCTIONin Australia
ABARE Research Report 01.6
Rohan Nelson
David Barrett
Max Foster
Scott Turner
Amy Beasley
Proudly supported by

© Commonwealth of Australia 2001
This work is copyright. The Copyright Act 1968 permits fair dealing for study,research, news reporting, criticism or review. Selected passages, tables ordiagrams may be reproduced for such purposes provided acknowledgmentof the source is included. Major extracts or the entire document may not bereproduced by any process without the written permission of the ExecutiveDirector, ABARE.
ISSN 1037–8286ISBN 0 642 76440 9
Nelson, R., Barrett, D., Foster, M., Turner, S. and Beasley, A. 2001, The Futureof Canola Production in Australia, ABARE Research Report 01.6, Canberra.
Australian Bureau of Agricultural and Resource EconomicsGPO Box 1563 Canberra 2601
Telephone +61 2 6272 2000 Facsimile +61 2 6272 2001Internet www.abareconomics.com
ABARE is a professionally independent government economic researchagency.
GRDC disclaimerAny recommendations, suggestions or opinions contained in this publica-tion do not necessarily represent the policy or views of the Grains Researchand Development Corporation. No person should act on the basis of thecontents of this publication without first obtaining specific, independentprofessional advice.
The Grains Research and Development Corporation will not be liable forany loss, damage, cost or expense incurred or arising by reason of any personusing or relying on the information in this publication.
ABARE project 1627

Foreword
The Australian canola industry expanded dramatically during the 1990s.Canola became profitable as a break crop because of favorable export pricesand internationally competitive production costs. Whether the industry cancontinue to expand at this rate depends on whether world prices remain favor-able, and the degree to which Australian production remains internationallycompetitive.
World consumption of canola is expected to rise strongly to 2010, creatinga good market outlook for the Australian canola industry. However, realcanola prices are unlikely to return to the high levels of the mid-1990s becauseof increasing world production of low cost soybean and palm oil. Competitionfrom low cost substitutes will be offset by growing consumer awareness ofthe health benefits of monounsaturated canola oil. The speed and extent oftrade liberalisation will significantly effect Australia’s access to these grow-ing world markets.
Although current international constraints on trade are significant, this reportconcludes that the Australian canola industry will recover from its recentdownturn, albeit at a slower rate than the expansion of the 1990s. ABARE’sprojections for the canola industry are likely to be influenced by a range ofissues surrounding genetically modified varieties and trade issues. Thesepotential influences are analysed in the report using the OECD’s Aglinkmodel.
BRIAN S. FISHER
Executive Director
June 2001
iiiFuture of canola production

Acknowledgments
This study was funded by the Grains Research and Development Corporation.The support of Mike Taverner from the GRDC is greatly appreciated.
The research involved consultation with researchers, farmers, consultantsand state department officers from around Australia, whose contributionsare gratefully acknowledged. The authors particularly wish to thank BobColton and Neil Wratten from New South Wales Agriculture; Ian Riley fromthe University of Adelaide; Adrian Cox, Ross Kingwell, Ian Pritchard andRob Loughman from Agriculture Western Australia; John Slee from JoyceIndustries at Pinjarra; Geoff Black from Cootamundra Oilseeds; Steve Brill,Justin Kudnig and John Lamont from the Canola Association of Australia;Peter Jones from AWB International; Phil Salisbury and Steve Marchantfrom the Victorian Institute of Dryland Agriculture; Tony Eyres and membersof the Birchip Cropping Group; Peter and Bob MacSmith from ‘Little Boree’of Cudal, New South Wales; Lloyd George from Cargill; and John Knoxfrom Australian Drilling Specialties.
The assistance in the preparation of earlier drafts of this report and with datagathering from Christine Byrnes, Stephen Hooper, Geoff Bailey and CatherineRees from ABARE’s Agriculture and Natural Resources Directorate is grate-fully acknowledged, as is the assistance of other ABARE staff, particularlyIan Shaw for his technical assistance with the Aglink model, Trish Gleesonfor assistance with the Aglink baseline, and Vince O’Donnell for projectoversight. Comments by Ahmed Hafi and Rhonda Treadwell on earlier draftsare also gratefully acknowledged.
iv ABARE research report 01.6
Contents
Summary 1
1 Australian and world oilseeds markets 5Expansion of the canola industry 5Australia’s role in world canola markets 7
2 Prospects for world oil markets 14Market outlook 14World supply 14World demand 17
3 Prospects for trade 23World canola trade 23Competing and trading nations 25
4 Prospects for Australian canola 39ABARE’s baseline projections 39Impact of potential developments 40Scenario 1: Adoption of GM canola in Australia 42Scenario 2: An increase in world wheat prices 47Scenario 3: Impact of Agenda 2000 51Scenario 4: A reduction in Chinese oilseed tariffs 54
AppendixA Agronomic performance of canola in Australia 61
References 68
vFuture of canola production
FiguresA Australian canola area, production and exports 5B Australian oilseeds production 6C Gross margins for Central East zone, New South Wales 6D Index of world oil consumption 9E Change in oil consumption per person, 1990-91 to
1999-2000 11F Australian vegetable oil consumption 11G Australian consumption of oilseeds meal 12H Australian canola exports as a percentage of production 12I Projected real world indicator prices for soybeans and canola14J World vegetable oil prices 15K Relationships between vegetable oil consumption and
income, selected countries 17L Volume of Australian oilseeds exports, by destination 25M Production costs and gross margins for canola, Australia
and Canada 26N Canadian plantings of genetically modified canola 28O Canola/rapeseed stocks and prices 28P Australian canola area, production and oilseeds exports 39Q World price indexes for wheat, coarse grains and oilseeds 40R Changes in key oilseeds market variables under two
scenarios 43S OECD field trials of genetically modified canola,
by category 65
Tables1 World production of oilseeds, by major producer 82 World consumption of vegetable oils 93 Major oilseeds processing nations in the world 134 World importers of oilseeds, excluding intra-European
Union trade 245 World exporters of oilseeds, excluding intra-European
Union trade 246 Production costs and gross margins for canola in Australia
and Canada, 2000 27
vi ABARE research report 01.6

7 Simulated impacts of Australia adopting genetically modifiedcanola 44
8 Simulated impacts of a higher wheat price, 2001–03 489 Simulated impacts of a higher wheat price, 2001–10 50
10 Simulated impacts of Agenda 2000, using Aglink 5211 Simulated impacts of a reduction in China’s oilseeds tariffs,
using Aglink 5612 Simulated impacts of a reduction in China’s oilseeds,
oilseed meal and vegetable oil tariffs, using Aglink 5813 Key forms of genetically modified canola in the
development pipeline 6614 Field trials of generically modified canola in Australia 67
viiFuture of canola production


Summary
Between 1992-93 and 1999-2000, the area planted to canola in Australiaincreased from 0.1 million hectares to an estimated 1.9 million hectares,while exports increased from just under half a million tonnes to 1.9 milliontonnes. The dramatic expansion of the Australian canola industry was drivenby favorable world prices for varieties with preferred oil characteristics, andthe international competitiveness of Australian canola production. Whetherthe Australian canola industry can continue to expand at the rate experiencedduring the 1990s depends on developments in world markets for oilseedsand derived products. An interaction of policy and market developments indomestic and world markets will shape the future of Australia’s canolaindustry.
World consumption of canola oilThe demand for Australian canola seed exports is driven by world demandfor canola oil. China and the European Union were the largest consumers ofcanola oil in 1999-2000. During the 1990s, canola oil comprised around 15per cent of total world vegetable oil consumption, which continues to bedominated by soybean and palm oil. The European Union, China, Canadaand India produced over 80 per cent of world canola production during the1990s.
World consumption of canola oil rose at a similar rate to that of soybean oilduring the 1990s, but at a slower rate than consumption of palm oil. Canolaoil’s share of total oil consumption per person rose in Australia, the EuropeanUnion, Pakistan and the United States, mostly at the expense of soybean oil.
With small domestic markets for oilseeds products, the Australian canolaindustry is reliant on export markets.
World consumption of canola is expected to rise strongly over the projec-tion period, creating a favorable outlook for the Australian canola industry.ABARE’s commodity research using the OECD’s Aglink model projectsthat world indicator prices for canola seed and soybeans will rise slightly inthe medium term, before falling slightly toward 2010. ABARE’s projectionof stable real prices for canola are based on strong expected world demand
1Future of canola production

for canola oil, and increasing world production of low cost soybean and palmoil.
Population growth in developing countries, particularly China and India, isexpected to be a major influence on world demand for oilseed products,including canola. The potential for increased per person consumption of oilsis highest in developing countries where low incomes have limited consump-tion to very low levels. In developed countries, increases in population areexpected to be only marginal, thus increases in the consumption of canolaoil are expected to be more closely related to changes in consumer prefer-ences.
Changing consumer preferences are expected to increase world demand forcanola oil. Growing consumer awareness of the health benefits of replacingsaturated oils with monounsaturated and polyunsaturated oils is expected toincrease canola oil’s share of world consumption. A consumer backlashagainst perceived health risks and genetic ‘contamination’ associated withgenetically modified (GM) crops has resulted in some countries imposingstrict labeling regulations on imports. Australia may face a growing demandfor non-GM canola, but only by incurring the substantial costs for identitypreservation if GM canola is adopted and forgoing its agronomic benefits ifit is not adopted.
Australian canola exportsThe prospects for the Australian canola industry will be influenced by devel-opments in the world vegetable oil markets, together with changes in poli-cies affecting world oilseed and vegetable oil trade. The European Unionand Japan have been significant importers of oilseeds, while China hasrecently become a major importer. The United States, Brazil and Argentinahave dominated world oilseed exports, while Canada has been by far thelargest exporter of canola. Australia is the next largest exporter of canola,contributing a quarter of total world exports in 1999-2000. Australian exportsof oilseeds, principally canola and cotton seed, are exported to Japan,Bangladesh, Mexico and, more recently, China.
The Australian canola industry’s ability to expand its share of world canolatrade depends, in part, on its comparative advantage relative to other worldproducers, particularly Canada. The value of the Australian dollar againstthe currencies of other exporting nations has a marked influence on thecompetitiveness of Australian canola on world markets. As a measure of
2 ABARE research report 01.6

Australia’s competitiveness in canola production estimated gross margins inCanada (at an exchange rate of A$1 = C$0.86) are roughly in the mid tolower range of estimates for Australia.
The speed and extent of trade liberalisation achieved through WTO negoti-ations will have a significant effect on access to growing world markets.Domestic support paid to producers in the United States and the EuropeanUnion reduces their import demand and increases world exportable supplies,depressing world canola prices. Similarly, import tariffs imposed by China,India, Japan and Pakistan to protect domestic oilseeds producers increasedomestic prices for commodities and reduce demand, lowering world prices.
Canola production in AustraliaDespite the constraints on trade, the market outlook for the Australia canolaindustry is positive but unlikely to support the dramatic rates of expansionof the 1990s. While Australian canola plantings fell from 1.8 million hectaresin 1999 to 1.2 million hectares in 2000, the area sown is projected to risegradually to 1.6 million hectares by 2010. Productivity gains will enableAustralian canola production to exceed the 1999 peak of 2.2 million tonnesby 2010, rising to an estimated 2.4 million tonnes from a low of 1.6 milliontonnes in 2000. Most of Australia’s canola production will continue to beexported, with exports estimated to rise gradually to 1.9 million tonnes follow-ing a fall to 1.1 million tonnes in 2000.
ABARE’s baseline estimates for the Australian canola industry assumeconservative productivity gains to 2010 because of emerging agronomiclimitations on the extent to which canola can be included in winter cerealrotations. In addition, strong world prices for wheat and coarse grains areprojected to provide an incentive for Australian producers to reduce the repre-sentation of canola in winter cereal rotations.
Several agronomic, market and policy influences have the potential to influ-ence ABARE’s baseline estimates for the Australian canola industry to 2010.The OECD Aglink model was used to analyse four alternative scenarios forthe Australian canola industry.
• The introduction of herbicide tolerant canola to Australia is unlikely tobe economically viable if identity preservation is required to overcomeconsumer acceptance problems. Alternatively, a significant premium fornongenetically modified over genetically modified canola is likely to benecessary to offset the additional costs of identity preservation.
3Future of canola production
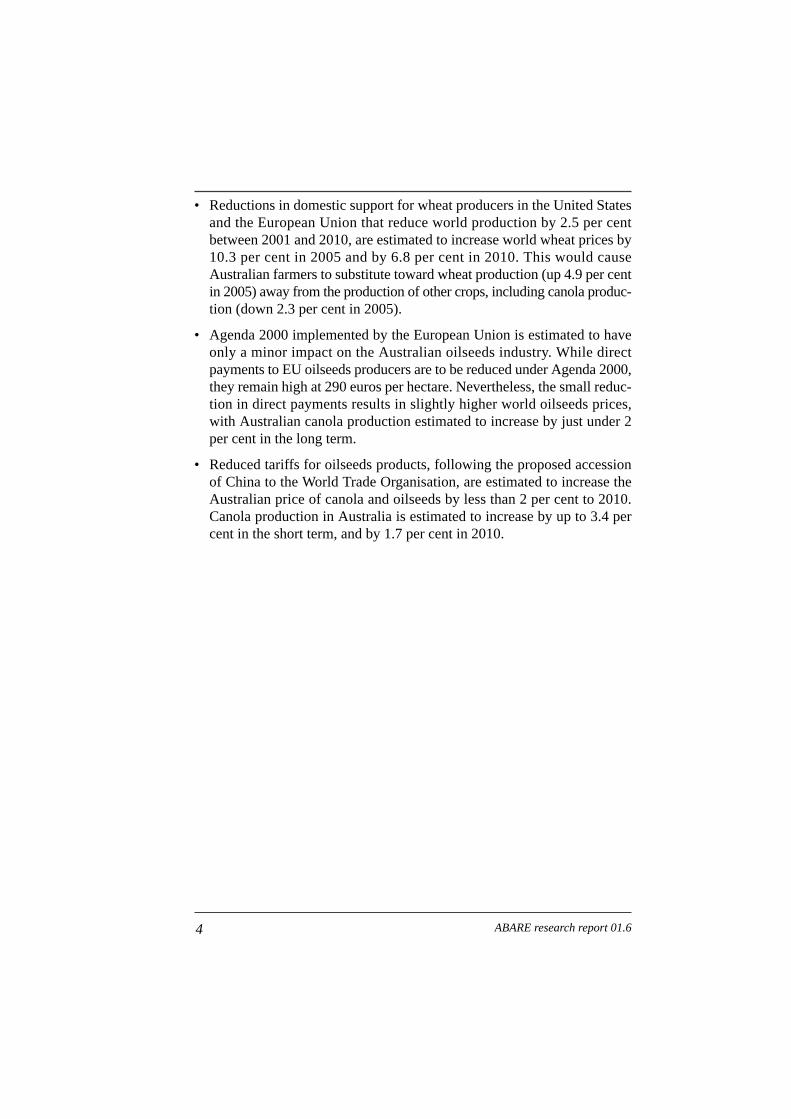
• Reductions in domestic support for wheat producers in the United Statesand the European Union that reduce world production by 2.5 per centbetween 2001 and 2010, are estimated to increase world wheat prices by10.3 per cent in 2005 and by 6.8 per cent in 2010. This would causeAustralian farmers to substitute toward wheat production (up 4.9 per centin 2005) away from the production of other crops, including canola produc-tion (down 2.3 per cent in 2005).
• Agenda 2000 implemented by the European Union is estimated to haveonly a minor impact on the Australian oilseeds industry. While directpayments to EU oilseeds producers are to be reduced under Agenda 2000,they remain high at 290 euros per hectare. Nevertheless, the small reduc-tion in direct payments results in slightly higher world oilseeds prices,with Australian canola production estimated to increase by just under 2per cent in the long term.
• Reduced tariffs for oilseeds products, following the proposed accessionof China to the World Trade Organisation, are estimated to increase theAustralian price of canola and oilseeds by less than 2 per cent to 2010.Canola production in Australia is estimated to increase by up to 3.4 percent in the short term, and by 1.7 per cent in 2010.
4 ABARE research report 01.6

Australian and world oilseed markets
Expansion of the canola industryBetween 1992-93 and 1999-2000, the area planted to canola in Australiaincreased from 0.1 million hectares to an estimated 1.9 million hectares,while seed production rose from 0.2 million tonnes to an estimated 2.4 milliontonnes (figure A). With small domestic oilseeds markets, the Australianoilseeds industry is reliant on exports. Australia’s canola exports increasedfrom 48 700 tonnes (27 per cent of production) to 1.9 million tonnes (78 percent of production) between 1992-93 and 1999-2000. The dramatic expan-sion of canola production has taken canola from less than 10 per cent ofAustralian oilseeds production in 1990-91, to nearly 65 per cent in 1999-2000 (figure B).
Canola’s introduction to Australia in the early 1960s met with limited successbecause demand for the low quality oil produced at that time was limited,and production was inhibited by agronomic problems. In the 1990s, favor-able world prices for varieties with preferred oil characteristics facilitated arapid expansion of Australia’s canola industry. The international competi-tiveness of the Australian canola industry (discussed in chapter 3) has enabledAustralia to become a major exporter of canola. Canola has been profitablerelative to winter cereal crops, and has proved to be a useful break crop inwinter cereal rotations (appendix A). For example, estimated gross margins
5
1
Future of canola production
0
500
1000
1500
2000
2500
1983-84
1981-82
1985-86
1987-88
1989-90
1991-92
1993-94
1995-95
199798
1999-2000
Production (kt)
Exports (kt)
Area (’000 ha)
Australian canola area, production and exportsA

for canola in the Central East zone of New South Wales reported by NewSouth Wales Agriculture (2001) indicate that canola provides relatively highreturns compared with wheat and barley when yields are high (figure C).
In marginal areas with a high probability of low yields, growing canola mayincrease the risk of low returns because of the high costs of cultivation,fertilisers, insecticides and harvesting relative to other winter crops. In suit-able regions, however, canola gross margins are attractive relative to barleyand wheat even when compared using yields from the lower end of theexpected range (figure C).
Can the Australian canola industry continue to expand at the rate experi-enced during the 1990s? The answer to this question depends on develop-
6 ABARE research report 01.6
Canola 9.5% Cotton 26.4%
Other 2.3%Soybean 2.8%
Sunflower 4.0%
Canola 64.5%
Sunflower 14.6%
Soybean6.0%
Other4.0%
Cotton 66.0%
Australian oilseeds productionB1990–91 1999–2000
Gross margins for Central East zone, New South WalesC
$/ha 100 200 300
Barley 1.5 to 3.0 t/ha1.5 to 3.0 t/ha
1.5 to 3.0 t/ha1.5 to 3.0 t/ha
1.2 to 2.1 t/ha1.2 to 2.1 t/ha
Wheat
Canola $300/t
$145/t
$112/t
Price

ments in world markets for oilseeds and derived products, and the positionof the Australian oilseeds industry in world markets. World demand foroilseeds is influenced by oilseeds prices and the price of substitutes, economicand population growth rates, and consumer preferences. Market access forAustralian canola exports, and their competitiveness in world markets, willcontinue to be influenced by policy and market developments in other oilseedsexporting nations, particularly Canada and the United States, as well ascurrent and potential importing nations such as China, India, Japan, theEuropean Union and Pakistan. An interaction of policy and market devel-opments in domestic and world markets will shape the future of Australia’scanola industry.
Australia’s role in world canola marketsDespite the rapid expansion of Australian canola production during the 1990s,by 1999-2000 Australian production contributed only 1 per cent of worldoilseeds production, and less than 6 per cent of world canola production(table 1). The European Union, China, Canada and India produced over 80per cent of world canola1 production during the 1990s. World canola produc-tion increased by 69 per cent over the decade, and accounted for 15 per centof world oilseeds production in 1999-2000. During the 1990s, around 80 percent of all oilseeds were produced in the United States, China, Brazil, India,Argentina and the European Union. World oilseeds production increased byaround 38 per cent during the 1990s, reaching almost 300 million tonnes in1999-2000, with soybeans and canola accounting for much of this growth.
The demand for Australian canola seed exports is driven by world demandfor canola oil. China and the European Union were the largest consumers ofcanola oil in 1999-2000, while India’s apparent high per person consump-tion of canola oil is mostly of domestically produced mustard and rapeseedoil (table 2). World canola oil consumption grew strongly during the 1990s,with the largest absolute growth in China, the European Union and the UnitedStates.
Canola oil comprised around 15 per cent of total world vegetable oil con-sumption during the 1990s (table 2). World vegetable oil consumption
7Future of canola production
1 Reflecting data availability, supply and disposal information for canola, rapeseed and mustard havebeen amalgamated throughout this report and are collectively referred to as canola. In some countriesthis can be misleading. For example, mustard is a significant oilseed in India and rapeseed still repre-sents a large proportion of ‘canola’ production.

8 ABARE research report 01.6
1 World production of oilseeds, by major producer
1990-91 1999-2000 Change inproduction
Share ShareProduction of world Production of world
Mt % Mt % %Canola aAustralia 0.1 0.4 2.4 6 96Canada 3.3 13 8.8 21 169China 7.0 28 10.1 24 45European Union 6.7 27 11.3 27 68India 5.2 21 5.5 13 5Other 2.8 11 4.5 9 –13World total 25.1 100 42.6 100 69
SoybeansArgentina 11.5 11 20.7 13 80Australia 0.06 0.1 0.1 0.1 41Brazil 15.8 15 32 20 99China 11.0 11 14.3 9 30United States 52.4 50 72.3 46 37Other 13.4 13 17.8 12 25World total 104.2 100 157.2 100 50
SunflowerArgentina 4.2 18 6.1 23 48Australia 0.2 0.7 0.1 0.6 –3China 1.3 6 1.3 5 –3Eastern Europe 2.1 9 3.0 11 45European Union 4.3 19 3.2 12 –26Former Soviet Union 3.4 15 7.3 27 112United States 1.0 5 2.0 7 91Other 6.5 27 3.3 15 –89World total 22.9 100 26.4 100 16
Total oilseeds bArgentina 16.5 8 27.5 8 50Australia 1.04 0.5 3.7 1 67Brazil 17.1 8 33.3 11 84China 33.3 15 45.2 15 32European Union 13.6 6 16.5 5 20India 20.5 10 23.6 9 26United States 60.6 28 82.3 31 50Other 52.9 25 65.8 20 –23World total 215.5 100 297.9 100 38
a Includes canola rapeseed and mustard seed. b Includes canola custard copra cottonseed soybeansunflower seed and peanuts.Source: US Department of Agriculture (2000a).

9Future of canola production
2 World consumption of vegetable oils
1990-91 1999-2000Change in
Consumption Share Consumption Share consumption
kt % kt % %Canola oilAustralia 40 0.5 126 1.0 215.0Canada 377 4.4 540 4.1 43.2China 2 490 28.9 4 225 32.2 69.7European Union 1 553 18.0 3 027 23.1 94.9India 1 620 18.8 1 560 11.9 –3.7Japan 785 9.1 895 6.8 14.0Pakistan 74 0.9 192 1.5 159.5United States 275 3.2 662 5.0 140.7Other 1 398 16.2 1 886 14.4 34.9
World total 8 612 100.0 13 113 100.0 52.3
Continued ➮
continues to be predominantly of soybean (30 per cent in 1999-2000 ) andpalm oil (24 per cent in 1999-2000).
World consumption of canola oil rose at a similar rate to that for soybean oilduring the 1990s, and at a slower rate than for palm oil (figure D). Canolaoil’s share of total per person oil consumption rose in Australia, the EuropeanUnion, Pakistan and the United States, mostly at the expense of soybean oil(figure E). The share of rapeseed and mustard oils in total consumption
200019981996199419921990
Index
50
100
150
200
PalmSoy
Canola
Index of world oil consumptionD

2 World consumption of vegetable oils continued
1990-91 1999-2000Change in
Consumption Share Consumption Share consumption
kt % kt % %Soybean oilAustralia 53 0.3 48 0.2 –9.4Canada 172 1.1 279 1.1 62.2China 1 055 6.8 2 841 11.6 169.3European Union 1 752 11.3 1 643 6.7 –6.2India 445 2.9 1 582 6.5 255.5Japan 624 4.0 684 2.8 9.6Pakistan 210 1.4 239 1.0 13.8United States 5 506 35.6 7 283 29.8 32.3Other 5 628 36.4 9 821 40.2 74.5
World total 15 445 100.0 24 420 100.0 58.1
Palm oilAustralia 130 1.2 185 0.9 42.3Canada 14 0.1 15 0.1 7.1China 1 194 10.7 1 200 6.0 0.5European Union 1 496 13.5 2 209 11.0 47.7India 259 2.3 3 300 16.5 1 174.1Japan 304 2.7 377 1.9 24.0Pakistan 800 7.2 1 108 5.5 38.5United States 116 1.0 152 0.8 31.0Other 7 992 71.9 12 704 63.4 59.0
World total 11 111 100.0 20 050 100.0 80.5
Total oilsAustralia 382 0.7 522 0.6 36.6Canada 649 1.2 942 1.1 45.1China 6 518 11.6 11 424 13.9 75.3European Union 9 168 16.3 12 017 14.6 31.1India 5 010 8.9 9 702 11.8 93.7Japan 1 861 3.3 2 080 2.5 11.8Pakistan 1 420 2.5 1 952 2.4 37.5United States 7 140 12.7 9 543 11.6 33.7Other 30 479 54.3 45 412 55.3 49.0
World total 56 109 100.0 82 170 100.0 46.4
Source: US Department of Agriculture (2000a).
10 ABARE research report 01.6

11Future of canola production
–20
–10
%
10
20
Australia
Euro
pean
Union
Pakista
n
Korea
United
State
s
Japan
Canada
ChinaIn
dia
CanolaSoybeanPalm
Change in oil consumption per person1990-91 to 1999-2000E
Canola 11% Canola 21%
Sunflower17% Sunflower
15%
Soybean14%
Soybean5%Olive
4%
Olive5%
Palm22%
Palm26%
Cotton23%
Cotton19%
Other 9% Other 9%
Australian vegetable oil consumptionF1990–91 1999–2000
declined in India (see footnote 1), where the consumption of palm oilincreased significantly.
Australian consumption of vegetable oils shifted significantly toward canolaoil in the 1990s. Over the decade, Australian demand for vegetable oilsincreased by 25 per cent to 24.5 kilograms per person, or 465 000 tonnes.Canola oil consumption increased twelvefold to 5.0 kilograms per personover the decade to 1999-2000, while the consumption of soybean oil fell byaround 46 per cent to 1.5 kilograms per person. The demand for palm oil(mostly palm olein) and olive oil has also grown over the decade and theirconsumption continues to be a significant proportion of the total fats and oilsin Australian diets (figure F).

Soybean meal remained an important source of protein for Australian live-stock throughout the 1990s, making up over 40 per cent of meal consump-tion throughout the decade (figure G). The consumption of oilseeds meal inAustralia expanded by 42 per cent to 768 000 tonnes between 1990-91 and1999-2000, as intensive livestock production expanded. Canola meal repre-sented 10 per cent of Australian consumption in 1990-91 and 25 per cent in1999-2000, displacing cotton seed meal in overall consumption (figure G).
With small domestic markets for oilseeds products, the Australian canolaindustry has become reliant on export markets. The proportion of Australiancanola production exported increased during the 1990s, to almost 80 per centin 1999-2000 (figure H).
12 ABARE research report 01.6
%
20
40
60
80
100OtherSoybean
CottonseedSunflower
Canola
1990-91
1991-92
1992-93
1993-94
1994-95
1995-96
1996-97
1997-98
1998-99
1999-2000
Australian consumption of oilseeds mealG
1990-91
1991-92
1992-93
1993-94
1994-95
1995-96
1996-97
1997-98
1998-99
1999-2000
%
20
40
60
80
Australian canola exports as a percentage of productionH

Over the decade to 1999-2000 there was a 45 per cent increase in theAustralian oilseeds crush to 1.2 million tonnes in response to increaseddemand for both vegetable oil and oilseeds meal (table 3). In 1999-2000, 43per cent of the oilseeds crushed in Australia were cotton seed, 31 per centcanola, 13 per cent sunflower and 10 per cent soybean. Between 1990-91and 1999-2000, the global oilseeds crush increased by 33 per cent to around247 million tonnes. The United States, China and the European Union crushednearly 50 per cent of world production during the 1990s. Australian crush-ing of oilseeds to produce vegetable oil and protein meal represents a verysmall proportion (less than 1 per cent) of world production.
13Future of canola production
3 Major oilseeds processing nations in the world
1990-91 1999-2000Growth
Crush Share Crush Share in crush
Mt % Mt % %
Argentina 11.6 6 22.6 8 94Australia 0.8 .004 1.2 .006 33Brazil 14.1 8 21.7 9 54Canada 2.4 1 4.9 2 104China 20.2 11 40.9 16 102European Union 28.5 15 30.2 14 6Former Soviet Union 10.6 6 8.2 3 –23India 17.2 9 19.6 8 14Japan 5.3 3 6.0 2 12United States 36.4 20 47.9 18 32
World 185.7 100 247.3 100 40
Source: US Department of Agriculture (2000a).

Prospects for world oil markets
Market outlookWorld consumption of canola is expected to rise strongly over the projec-tion period, creating a favorable outlook for the Australian canola industry.Key factors that will influence world canola demand to 2010 include: theprice of canola and substitute vegetable oils, population growth and demo-graphic changes, economic growth, changing consumer preferences, anddomestic trade and food policies.
14
2
ABARE research report 01.6
1990 1992 1994 1996 1998 2000 2002 2004 2006 2008 2010
$US/t
100
150
200
250
300
Canola
Soybeans
Projected real world indicator prices forsoybeans and canolaI
ABARE’s commodity research using the OECD’s Aglink model projectsthat world indicator prices for canola seed and soybeans will rise slightly inthe medium term, before falling slightly toward 2010 (figure I). Realcommodity prices tend to fall over time in response to increasing produc-tivity. Strong world demand for canola oil is expected to result in increasedcanola and soybean prices to 2002. After 2002, however, prices are projectedto fall in response to increasing world production of low cost soybean andpalm oil.
World supplyThese price projections are derived from a detailed analysis of influences onthe supply and demand of canola and other vegetable oils, as well as world

population and income growth. The potential for the Australian canolaindustry to continue to expand depends on the prospects for favorable worldcanola oil prices relative to the price of substitute vegetable oils. Mostvegetable oils have similar end uses in the food industry and, in many cases,food products are derived by blending vegetable oils. Manufacturers canalter the mix of vegetable oils depending on their relative prices. The rela-tively high degree of substitutability among vegetable oils means that theirprices in international markets are not likely to diverge greatly from eachother, at least in the long run (In and Inder 1997).
World prices, in real terms, for soybean oil, canola oil, sunflower oil andpalm oil for the period 1982-83 to 1999-2000 are shown in figure J. In andInder (1997) examined the relationship between the world prices of eightvegetable oils over the period October 1976 and March 1990. They concludedthat there was a long run relationship between sunflower and soybean, andsunflower and rapeseed, reflecting a high degree of substitution among them.
ABARE’s projections of stable rather than increasing real prices for canolaand soybeans, despite strong projected demand (discussed below), is basedon expected increases in world soybean and palm oil production. Worldproduction of vegetable oils is projected to expand by around 27 per cent to87 million tonnes by 2009-10. This supply outlook will be influenced bypolicy developments in the major producing countries, particularly in theUnited States and China, as well as expanded production in low cost export-ing countries. Palm oil production is expected to increase faster than theproduction of other vegetable oils.
15Future of canola production
1983-84
1985-86
1987-88
1989-90
1991-92
1993-94
1995-96
1997-98
1999-2000
$US/t 1999-2000
200
400
600
800
1000
1200
Sunflower
Soybean oil
Palm oilCanola oil
World vegetable oil pricesJ

In recent years there has been a significant expansion of soybean productionin South America. Between 1995-96 and 2000-01, soybean production inArgentina more than doubled to 25 million tonnes, while in Brazil, soybeanproduction increased by 25 per cent to 35 million tonnes. These recentincreases in South American oilseeds production are expected to be sustainedover the projection period. Investments in infrastructure developments suchas port facilities and privatisation of railways have improved the competi-tiveness of South American grain and oilseeds industries.
The yield of vegetable oil per hectare from palm is around 3.5 tonnes,compared with about one tonne for rapeseed and less than half a tonne forsoybeans. The high productivity for palm oil combined with its relativelylow cost of production (in US dollar terms) means that palm oil plays a signif-icant role in determining the overall price of vegetable oils. Therefore, inperiods when there are abundant supplies of palm oil and palm oil prices arelow, the prices of other vegetable oils are also likely to be low.
Palm oil production is forecast to increase by 36 per cent to 30 million tonnesover the next ten years in the two major producing countries, Malaysia andIndonesia. These two countries account for just over 80 per cent of worldproduction. Given the importance of palm oil to these two economies thegovernments in both countries have provided production incentives. Thevarious schemes used include direct investment by the government, grant-ing access to credit at concessionary rates for estate development, new cropplanting and crushing facilities, and further incentives to both domestic andinternational investors.
Most recently, the Malaysian government has provided a financial incentiveof 1000 ringgit per hectare for replanting palm trees. This is because a largeportion of oil palms in Malaysia are more than 25 years old, and new higheryielding varieties are now available. The government is aiming to have alarge percentage of these palms replanted by the end of 2001. However, theextent of the growth in palm oil production will be somewhat curbed byacreage limitations in west Malaysia and also by labor shortages and risingproduction costs relative to the prices received (Oil World 2001).
In the second half of the 1990s world palm oil production expanded at around7–9 per cent a year, leading to increased stocks and low prices. However,the growth in palm oil production, experienced in recent years, is expectedto slow over the next three or four years. As palms need four to five yearsgrowth before oil production becomes commercial, reduced palm plantings
16 ABARE research report 01.6

during the Asian financial downturn of 1997–99, particularly in Indonesia,will reduce medium term production. However, reduced Indonesian produc-tion in the medium term is expected to be offset by increased production inMalaysia and central America.
World demandABARE’s projection of strong demand for canola oil is based on an analy-sis of world production and prices, population growth, economic growth andchanging consumer preferences. Population growth in developing countriesis expected to result in an increase in the world demand for canola oil. Strongpopulation growth in China and India is expected to be a major influence onworld demand for oilseeds products, including canola. The population growthrate in China is expected to increase slightly in the short term, and besustained at an average of around 1 per cent to 2010. India’s population isexpected to continue increasing at around 1.8 per cent a year over this period.
In developed countries, increases in population are expected to be slow, thusincreases in the consumption of canola oil are expected to be more closelyrelated to changes in consumer preferences. For example, although the popu-lation of Australia is assumed to increase gradually to 2010, factors such ashealth awareness are likely to have a greater impact on the demand foroilseeds products.
Economic growthThere is a strong relationship between consumption of vegetable oil andincomes (figure K). The potential for increased consumption of oils per
17Future of canola production
K
0
5
10
15
20
25
30
0 5 10 15 20 25 30 35
Relationship between vegetable oil consumption and income, selected countries
GDP, purchasing power parity, per person (US$’000)
Co
nsu
mp
tion
pe
r pe
rso
n (
kg)
United States
Greece
Iraq
Nigeria
Pakistan
ThailandUruguay
SloveniaMexico
Saudi Arabia
Malaysia
MaltaKorea
Chile
Turkey
Vietnam
Indonesia
Papua New Guinea
Denmark
Norway
Australia
Japan
Netherlands
Ge
rma
ny
AustriaCanada
PhilippinesChinaIndiaEgypt
Egypt
Sweden
Russian Fed.
United Arab Emirates
NewZealand
Kuwait
Spain
PortugalCyprus
Czech Republic
Brazil
S Afric
a
Argentina
Iran
Italy
Belgium-Luxembourg

person is highest in developing countries where low incomes have limitedconsumption to very low levels. In contrast, per person consumption is highin developed countries, with less potential to increase as incomes increase.Economic growth, particularly in developing countries, is therefore likelyto have a strong influence on the world demand for canola oil.
World economic growth is assumed to average around 3.7 per cent a yearover the medium term to 2005. An easing of world economic growthcompared with the previous five years reflects an expected moderation ofstrong economic growth in the United States. The US economy is the largestin the world and its economic performance, and hence import demand, cansignificantly influence world markets. Over the medium term, economicgrowth in the United States is assumed to average around 3.0 per cent a year.
The economic prospects for non-OECD Asia (which excludes Japan andKorea) in the short term is largely dependent on movements in world crudeoil prices and economic developments in the United States. Economic growthin the region is expected to remain relatively robust, provided import demandin the United States does not decline sharply and oil prices do not increasesubstantially. For non-OECD Asia as a whole, economic growth is assumedto ease marginally from 6.8 per cent in 2000 to 6.2 per cent in 2001 and 6.0per cent a year over the medium to long term.
The economic recovery in east and south east Asia is expected to continuein the short term. In the Republic of Korea, recent indicators suggest thateconomic growth is likely to moderate to a lower but more sustainable ratein 2001. Economic growth in Korea is assumed to ease from an estimated9.2 per cent in 2000 to 5.0 per cent a year over the long term. For south eastAsia as a whole, economic growth is assumed to moderate from 5.7 per centin 2000 to 4.3 per cent in 2001. With economic conditions assumed toimprove in Indonesia, economic growth in south east Asia is assumed tostrengthen to around 5.0 per cent a year over the medium and long term.
In China, strong economic growth continues, with the economy recordinggrowth of around 8.0 per cent in 2000, compared with 7.1 per cent in 1999.Despite the recent improvement in China’s economic performance, consid-erable reforms, especially in the banking sector, are still required to sustainhigh economic growth. The expected entry of China into the World TradeOrganisation, which will increase external competition in many parts of theeconomy, underscores the need to accelerate structural reform in China.
18 ABARE research report 01.6

Economic growth in China is assumed to average 7.8 per cent in 2001 and7.0 per cent a year over the medium to long term.
In India, the domestic economy has been displaying signs of weakeningactivity. High oil prices have placed upward pressure on inflation, as well ason the current account deficit. Economic growth in India is assumed to aver-age around 6.0 per cent in 2001, compared with 6.0 per cent in 2000 and 6.4per cent in 1999. Over the medium and long term, economic growth isassumed to average 5.5 per cent a year.
In Latin America, economic prospects have improved over the past year.Higher oil prices have benefited a number of regional economies, such asVenezuela, Mexico and Colombia. Higher copper prices have providedeconomic support for Chile. For Latin America as a whole, economic growthis assumed to average around 3.5 per cent in 2001, compared with an esti-mated 3.5 per cent in 2000 and weak growth of 0.1 per cent in 1999. Beyond2001, economic growth in the region is assumed to average 3.7 per cent ayear.
Consumer preferencesWhile population growth, economic growth and exchange rates influenceoverall demand for oilseeds products, consumer preferences have a stronginfluence on the demand for canola products relative to those derived fromother oilseeds. Health considerations are expected to continue to have a stronginfluence on the demand for canola oil versus other vegetable oils. Otherinfluences on consumer preferences for oilseeds products include the use ofgenetically modified varieties and environmental benefits of vegetable oilsin industrial applications.
Health considerationsOne of the most important influences on world demand for canola oil hasbeen growing consumer awareness of the health benefits of replacing satu-rated vegetable oils and animal fats with monounsaturated and polyunsatu-rated oils. These oils have been found to help reduce cholesterol levels, whichhas been linked to reduced incidence of cardiovascular disease (Verheijenand Jimmink 1995). Animal fats (excluding fish oil), coconut oil, palm oiland palm kernel oil are high in saturated fats and are being replaced wherepossible by health conscious consumers with vegetable oils that are low insaturated fats. Relative to other vegetable oils, canola has the lowest levelof saturated fats and is a source of omega 3 fatty acids that have been demon-
19Future of canola production

strated to reduce blood cholesterol and cardiovascular disease levels (Morris2000).
The health benefits of canola oil have attracted more health consciousconsumers who have been able to pay premiums for vegetable oils that havea lower saturated fat content. The preference for monounsaturated oils hassignificantly increased the growth in demand for canola over other vegetableoils such as sunflower, soy and palm oils in developed countries, and thissubstitution is expected to continue. Research into differences in qualitybetween Australian and Canadian canola revealed that Australian canolaaveraged a higher level of omega 3 fatty acid (Adolphe 2000). High omega3 content could attract consumers to Australian canola until Canadian produc-ers select canola varieties that match these attributes.
In developing countries, the health benefits of canola oil are only beginningto be recognised and incorporated into the changing diets of their popula-tion. For example, canola oil is becoming popular among health consciousconsumers in Pakistan because of the high quality of the oil, leading to inter-est from within the private processing sector (Akhtar 1998). This interestmay lead to greater demand for canola imports into Pakistan over the mediumterm until local producers increase domestic production. However, pricecontinues to have a strong influence on demand in developing countries, andlower cost palm and soybean oils continue to be attractive to less wealthyconsumers.
Genetically modified canolaGenetically modified oilseeds varieties have emerged as another major influ-ence on world demand in the late 1990s. A consumer reaction against per-ceived health risks and genetic ‘contamination’ associated with GM cropshas resulted in some countries imposing strict labeling regulations on imports.The consumer reaction has already resulted in the European Union membercountries only importing canola seed that is GM free. EU imports of canolafrom Australia were substantial in 1998-99 and again in 2000-01, whileCanada has been unable to export to this market because of the GM statusof its canola. It is unclear whether consumer concerns about GM canola willfade or intensify toward 2010. Australia may face a growing demand fornon-GM canola, but only by incurring the substantial costs for identity preser-vation if GM canola is adopted and by forgoing its agronomic benefits if itis not adopted.
20 ABARE research report 01.6

Consumers in north America appear to have largely accepted products madefrom genetically modified inputs. However, as consumers have become moreaware of the existence of these products in the food chain, there has beengrowing demand for access to certified GM free foods. This has been partic-ularly so in Europe.
Consumer concerns are focused on the perceived safety of GM products infood, possible environmental consequences of releasing GM varieties, andthe extent of control that appears to be exercised by a few companies thatown key gene technologies. Some livestock feeders in Europe, Japan,Thailand and the Republic of Korea are now indicating that they will notfeed genetically modified feedstuffs to their animals because of possibleramifications for demand for their meat products.
In response to perceived safety concerns, a number of countries have imple-mented market access restrictions and conditions. The European Unionenforces the most significant trade restrictions. It does not allow the importof any genetically modified crops other than soybeans and some forms ofcorn. Moreover, there is a trend toward mandatory labeling of productscontaining genetically modified materials on the grounds that this enablesconsumers to make more informed decisions. Mandatory labeling can be asignificant barrier to trade because of the costs imposed on suppliers to sepa-rate GM and non-GM foods in handling and storage. While the EuropeanUnion already requires labeling, other key grain importers, Japan and Korea,intend to introduce labeling from mid-2001.
Some marketers are claiming that they are earning premiums for non-GMcanola in world markets. For example, it was reported in August 2000 thatEuropean buyers paid a premium of up to a US$5 a tonne on 150 000 tonnesof Australian non-GM canola (Reuters, 20 August 2000).
The developments to date in world grain markets are indicative of a pricediscovery phase in which marketers and processors are trying to determinewhether consumers are willing to pay premiums for grain and grain prod-ucts that are certified GM free. A clearer picture should emerge in the firsthalf of 2001 as the new season’s northern hemisphere grain crops — partic-ularly the US soybean and corn crops, both of which will include a substan-tial proportion of genetically modified product — are brought to market, andas the influence of mandatory labeling regimes scheduled to start in Asia inmid-2001 begin to exert an influence.
21Future of canola production

Environmental concernsConsumers appear to be placing increasing importance on environmentalissues affecting the products they consume. This could have an impact onfuture demand for oilseeds, particularly in developed countries. For exam-ple, research into the use of vegetable oil lubricants and fuels as a substitutefor mineral oils could lead to more widespread use of vegetable oils for indus-trial purposes (Verheijen and Jimmink 1995). Although there would be coststo the environment from producing industrial vegetable oil, the ‘green andclean’ perception may cause these biofuels to be preferred over mineral oilsby some consumers.
22 ABARE research report 01.6

Prospects for trade
Prospects for the Australian canola industry will be influenced by changesin its comparative advantage relative to major competitors, especially Canada,and policies affecting world oilseeds and vegetable oils trade. The potentialagronomic benefits of Canada’s adoption of genetically modified canola needto be assessed in the light of potential consumer reactions. Domestic supportpaid to producers in the United States and the European Union reduces theirimport demand and increases world exportable supplies of canola, depress-ing world prices. Import tariffs imposed by China, India, Japan and Pakistanto protect domestic oilseeds producers increase domestic prices for commodi-ties and reduce demand, lowering world prices. The speed and extent of tradeliberalisation achieved through WTO negotiations will have a significanteffect on access to growing world markets.
World canola tradeThe European Union and Japan have been significant importers of oilseeds,while China has recently become a major importer (table 4). China and Japanwere the world’s largest importers of canola seed in 1999-2000, with grow-ing markets in Mexico, Pakistan and Bangladesh.
The United States, Brazil and Argentina have dominated world exports ofoilseeds (table 5). Canada has been by far the largest exporter of canola,with Australia contributing nearly a quarter of total world exports in 1999-2000.
Australian oilseeds exports, principally canola and cotton seed, are exportedto Japan, Bangladesh and Mexico (figure L). In 1999-2000, China becamethe major destination for Australian canola exports, importing around 1.2million tonnes of seed.
The value of the Australian dollar against the currencies of other exportingnations has a marked influence on the competitiveness of Australian canolaon world markets. The rate at which the Australian dollar can be exchangedagainst the currencies of major importing countries, including China, theUnited States, the European Union and Japan, influences the relative cost ofAustralian exports to these markets.
23
3
Future of canola production

24 ABARE research report 01.6
4 World importers of oilseeds, excluding intra-European Union trade
1990-1991 1999-2000
Imports Share Imports Share
kt % kt %Total oilseedsChina 17 0.1 10 336 17.9Chinese Taipei 2 208 7.1 2 350 4.1European Union (net imports) 13 885 44.6 18 304 31.7Japan 6 593 21.2 7 169 12.4Korea, Rep. of 1 022 3.3 1 751 3.0Mexico 1 915 6.2 5 480 9.5Middle East 510 1.6 2 166 3.8Other 4 985 16.0 10 122 17.5
World 31 135 100.0 57 678 100.0
CanolaBangladesh 40 1.4 200 3.1China 15 0.5 2 500 38.8Japan 1 892 68.1 2 100 32.6Mexico 270 9.7 910 14.1Pakistan 0 0.0 350 5.4Other 562 20.2 377 5.9
World 2 779 100.0 6 437 100.0
5 World exporters of oilseeds, excluding intra-European Union trade
1990-1991 1999-2000
Exports Share Exports Share
kt % kt %Total seedsArgentina 4 849 16.6 5 225 8.9Australia 187 0.6 2 446 4.2Brazil 1 647 5.6 10 903 18.5Eastern Europe 382 1.3 803 1.4Former Soviet Union 404 1.4 2 147 3.6United States 15 640 53.6 27 460 46.7Other 6 073 20.8 9 868 16.8
World 29 182 100.0 58 852 100.0
CanolaAustralia 0 0.0 2 034 24.3Canada 1 859 84.0 4 350 52.0Eastern Europe 323 14.6 472 5.6United States 14 0.6 275 3.3Other 16 0.7 1 240 14.8
World 2 212 100.0 8 371 100.0

Over the short to medium term, the Australian dollar is assumed to appre-ciate gradually from below US50c in 2001, both against the US dollar andon a trade weighted basis. By 2005, the Australian dollar is assumed to aver-age around US67c and TWI 57, compared with an average of US58c andTWI 52 in 2000.
Over the past two years, the US dollar has appreciated significantly againstother major international currencies, especially the euro. The significantappreciation of the US dollar appears to have been supported by favorablefinancial market sentiment stemming from the strong growth achieved in theeconomy. As strong economic growth eases in the United States, the USdollar is assumed to depreciate gradually in the short term. A lower US dollaris expected to increase the competitiveness of US soybeans on world markets.Over the medium term, the US dollar is assumed to continue to depreciateagainst the euro, but remain relatively stable against the Japanese yen.
Competing and trading nations
Australia’s comparative advantage versus CanadaThe Australian canola industry’s ability to expand its share of world canolatrade depends in part on its comparative advantage relative to other worldproducers, particularly Canada. Gross margins can be used as a crude measureof comparative advantage between canola producing regions in Australiaand Canada. Gross margins are derived by subtracting variable costs fromthe gross income generated by each farm enterprise. The main shortcomingof gross margins is that they do not take account of capital costs associated
25Future of canola production
kt
200
400
600
800
1000
1989-90
1990-91
1988-89
1991-92
1992-93
1993-94
1994-95
1995-95
1996-97
199798
199899
1999-2000
Volume of Australian oilseeds exports, by destinationL
Pakistan
Mexico
Malaysia
Japan
China
Bangladesh

with land, plant and machinery, or labor costs other than those included incontracted operations. This comparison between Australian and Canadiancanola production assumes that labor and capital costs are similar betweenregions, which may not be true. It should also be noted that the gross marginestimates come from a number of different sources; where possible adjust-ments have been made to account for differences in estimation methods.
Some benchmarks of production costs and gross margins in the key produc-ing regions of Australia and Canada are shown in table 6 and illustrated infigure M. For the purposes of comparison, the same information for conven-tional and genetically modified (herbicide tolerant) canola in Canada hasbeen converted to Australian dollar terms. Genetically modified canola makesup around 55 per cent of total Canadian canola plantings.
On the basis of gross margins for Australian regions, canola production seemsto be most profitable in the Wimmera region of Victoria ($319 a hectare).The most marginal (and probably not profitable) region shown in the tableis the Victorian Mallee region ($47 a hectare). In Canada, genetically modi-fied varieties of canola are more profitable than conventional varieties —$152 a hectare compared with $115 a hectare. The Canadian estimates ofgross margins are roughly in the mid to lower range of the estimates for theAustralian regions.
26 ABARE research report 01.6
Production costs and gross margins for canola,Australia and CanadaM
Genetically modified
Conventional
Scaddan
Katanning
North Central
Mallee
Wimmera,
North east zone
East central zone
0 50 100 150 200 250 300
Gross marginVariable costs
New South Wales
Victoria
Western Australia
Canada

Canada is virtually the only producer of genetically modified canola; smallquantities are also grown in the United States. The other main canolaexporters — the European Union and Australia — are free of geneticallymodified canola, apart from production from field trials that does not enter
27Future of canola production
6 Production costs and gross margins for canola in Australia and Canada,2000
New South Wales Victoria
Central Northern Northzone, east a zone, west Wimmera Mallee central
A) Unit price $/t 250 250 250 250 250B) Average yield t/ha 1.80 1.20 2.00 1.00 2.00
C) Gross returns (A x B) $/ha 450 300 500 250 500
Variable costsSeed $/ha 12 1 15 30 15Herbicides $/ha 49 42 36 39 43Fertiliser $/ha 110 39 69 71 73Machinery operations $/ha 94 86 57 57 86Other $/ha 26 22 4 6 17
D) Total variable costs $/ha 290 189 181 203 234
Gross margin (C – D) $/ha 160 111 319 47 266
Canada b
Western Australia Conven-tional Genetically
Katanning Scaddan canola modified c
A) Unit price d $/t 250 250 233 238B) Average yield t/ha 1.45 1.40 1.79 1.97
C) Gross returns (A x B) $/ha 363 350 417 469
Variable costsSeed d $/ha 13 18 36 86Herbicides $/ha 26 45 65 39Fertiliser $/ha 69 62 76 81Machinery operations $/ha 53 54 120 106Other $/ha 5 4
D) Total variable costs $/ha 161 179 303 317
Gross margin (C – D) $/ha 201 171 115 152
a Short fallow. b Converted to A$ at an exchange rate of A$1=C$0.86. c With genetically modifiedcanola includes technology fee. d For Canada includes dockages for foreign material in grain samples.Sources: ABARE (1999); Serecon et al. (2001).

the market through bulk handling systems. Canada has developed a rangeof canola varieties that are resistant to herbicides (glyphosate, glufosinateammonium, bromoxynil and ioxynil). The adoption rate with these varietieshas been very strong and they are now estimated to make up around 60 percent of total Canadian canola area. Canada also has conventional varietiesof canola that have been bred to be herbicide tolerant. Plantings of canolain Canada declined in 2000 but the evidence to date is that the share of genet-ically modified varieties was maintained (figure N).
Canada does not, at any stage, segregate the crop into GM and non-GM cate-gories. From figure O it can be seen that Canadian canola appears to havenot incurred a discount in world markets in recent years compared withAustralia, despite the anecdotal evidence of increasing consumer concerns
28 ABARE research report 01.6
N
1995 1996 1997 1998 1999 2000
Canadian plantings of genetically modified canola
million ha
1
2
3
O
1997-98 1998-99 1999-2000
Canola/rapeseed stocks and prices
US$/t
100
150
200
250
Other
StocksEuropean Union
Canada
Mt
0.5
1.0
1.5
2.0Australian price
Canadian price

over genetically modified products. One possible explanation of this is thatthere are enough nongenetically modified supplies from Australia and theEuropean Union to meet requirements simply through adjustments in thepattern of world trade.
The United States
• The United States is the world’s largest soybean producer and in 1999exported an estimated 26 million tonnes.
• Depressed oilseeds prices since 1998 have led to an increase in supportpayments in the United States. Although these measures are onlytemporary, and do not directly intervene in trade, some of them arelinked to market prices and indirectly cause production and exportsupplies to be higher than would otherwise be expected.
The majority of agricultural support in the United States has been providedthrough domestic income support programs. Of particular interest to thecanola industry is the soybean loan program, which in the past provided asource of short term liquidity to producers until they sold their crop. However,strong US and global production in more recent times have led to buildingstocks and a reduction in market prices for soybeans to well below thesoybean loan rates.
In 1991 the introduction of marketing loan provisions to the commodity loanprogram for soybeans was designed to change the nature of domestic supportfor soybeans from the price supporting role of the earlier loan programs.Marketing loan provisions allow repayment of commodity loans at less thanthe original loan rate when market prices fall below the market loan rate.The difference between the original loan rate and the loan repayment rate isreferred to as the marketing loan gain and represents a program benefit toproducers, with US taxpayers covering the cost.
At the end of a loan period the farmer can choose to forfeit ownership of thecollateral (the crop) to the government and retain the loan money rather thanrepay the loan with interest. With market prices falling to levels lower thanthe loan rate, producers are better off financially to simply keep the loanpayment. Furthermore, the loan rate provides the incentive to plant the cropregardless of low prices because market receipts are augmented by the loanbenefits.
29Future of canola production

Therefore, marketing loans have and will continue to raise US soybeanproduction above otherwise expected levels and thus place downward pres-sure on world oilseeds prices. This system is supposed to decrease the loanprogram’s potential effect on support prices because stock accumulation bythe government through loan defaults is reduced. However, the marketingloan gain to producers means that production decisions are related to theloan rate rather than the market price and the area planted to supported cropsis higher than it would be without the support program. The net outlay fordomestic support payments for soybeans is estimated to be US$2.7 billionfor 2000 and US$3.3 billion for 2000.
Compounding the distorting effects of the marketing loan program was anagreement by the US government to provide additional support funds in theform of lump sum payments to reduce the impact of depressed commodityprices when agricultural prices fell in 1998 and 1999, reducing the risksfacing US producers (Turner et al. 2000). This year, a US$1.64 billion bailoutpackage has been earmarked for commodities not covered by market tran-sition contracts, including soybeans, peanuts, tobacco, fruit and vegetables.
In addition to these payments, a further US$8.2 billion will go to reducingpremiums on federally subsidised crop insurance over the next five years.
The effects of these various support payments are not offset by the acreagereduction programs, as was the case prior to 1996. Therefore, it is no longercertain whether the US reforms since the Uruguay Round have reducedmarket distortions arising from farm support programs (Roberts et al. 2000).The outlook for oilseeds exports from the United States is partly associatedwith farm programs that are due for reauthorisation in 2002 and partly withthe temporary assistance programs whose future is uncertain (OECD 2000c).
The European Union
• The European Union accounts for around a quarter of world canolaimports and in 1998-99 was Australia’s third largest export market.
• Reductions in producer payments for oilseeds production plannedunder Agenda 2000 are expected to result in a drop in EU canolaproduction.
After World War II, an underlying concern over food security influenced EU policy makers to implement a system that protected agriculture, while
30 ABARE research report 01.6

removing barriers to trade internally. This approach resulted in the EuropeanUnion changing from being a net importer of food to a large net exporter offood, and the Common Agricultural Policy (CAP) was soon used to managesurpluses.
In 1999, agreement on the reform of the CAP, referred to as Agenda 2000,was reached at the Berlin Summit (US Department of Agriculture 1999b).This covered a range of agricultural and other issues, including reform ofsupport policies for cereals and arable crops. These reforms were a contin-uation of those introduced in 1992 that reduced market support but largelycompensated producers by making direct payments (based on areas plantedfor cereals). The main components of the Agenda 2000 agreement directlyapplicable to oilseeds include:
• a reduction in direct payments for oilseeds of more than 30 per cent inthree equal steps to 63 euro a tonne by 2002-03;
• compulsory and voluntary set-asides maintained, with compensation beingset at 63 euro a tonne and payment commencing in 2001-02 — the nominalset-aside rate will be reduced from 17.5 per cent to 10 per cent in 2000-01 for arable crops, while the actual set-aside rate to be applied will beadministratively determined (Turner et al. 2000).
While the base compulsory set-aside rate will be 10 per cent, the actual rateapplied may vary from this. Historically, the actual set-aside rate has oftenbeen far lower than the base rate, particularly when world commodity marketprices were high. For example, in 1996-97 when the base set-aside rate was17 per cent, the actual rate was 10 per cent following high world prices in1995, and dropped further to 5 per cent in 1997-98. The result was greaterproduction from EU producers, which contributed to larger stocks anddepressed world prices in 1997-98. It is expected that actual set-aside rateswill again be lower than the base set-aside rates to 2010, resulting in increasedsupply and low world prices.
Other components of the agreement that, while not directly applicable tooilseeds, will have a significant impact on the area of oilseeds planted include:
• a reduction in the cereal intervention price of 15 per cent in two equalsteps as of 1 July 1999;
• the direct payments for cereals, fixed on an area basis, increased in twoannual steps from the current 54.34 euro a tonne to 63 euro a tonne forthe 2001-02 marketing year — the payment will be based on the area
31Future of canola production

actually planted to arable crops and fixed regional yields established underthe 1992 reforms; the increase in direct payments accounts for 50 per centof the intervention price cut (Turner et al. 2000); and
• supplementary aid for protein crops will be set at 9.5 euro a tonne, in addi-tion to the 63 euro a tonne area payment.
Overall, the change in support under Agenda 2000 means that the area plantedto cereals is likely to increase as farmers move away from oilseeds. As willbe discussed in chapter 4, oilseeds production is likely to fall under Agenda2000 relative to the level expected without the policy changes. The impactof lowering the base set-aside rate is expected to be minimal, because thebase rates were rarely, if ever, enforced under the CAP 1992 reforms.
Direct payments provide some incentive to at least maintain, if not increase,the area planted in order to maintain or increase the size of payments, as thepayments are based on current areas planted (Turner et al. 2000). Furthermore,this shift in production away from oilseeds toward cereals may lead to aslight fall in demand for oilseeds meal as the increased cereal supply isexpected to make the price of cereals for feed use more attractive to somelivestock producers (US Department of Agriculture 2000b).
As will be discussed in chapter 4, the Agenda 2000 reforms are expectedto have a small beneficial impact on world oilseeds trade, due to lower EUproduction and higher imports. Currently, oilseeds and oil meals can beimported duty free into the European Union while duties for vegetable oilare generally lower than 10 per cent. Since the implementation of theUruguay Round, the European Union has not used export subsidies forcanola although the WTO schedule of the European Union still includes asubsidy quantity and outlay commitment level for canola exports (USDepartment of Agriculture 2000d).
It is assumed therefore that total imports of both oilseeds and edible oilswill need to increase over the long term in order to meet the EuropeanUnion’s increasing vegetable oil demands if the expected shift away fromoilseeds production does occur. Furthermore, canola may be a more favor-able option to some crushers because of its high oil and low meal compo-nent compared with other substitutes, particularly soybeans, if a small shiftdoes occur away from oilseeds meals toward cereals for feed use in live-stock production.
32 ABARE research report 01.6

China
• Vegetable oil consumption in China increased from 6.5 million tonnesto an estimated 11.4 million tonnes between 1990-91 and 1999-2000,and now accounts for around 13 per cent of total world vegetable oilconsumption.
• Australia began exporting canola to China in 1997-98 with 132 600tonnes, increasing to an estimated 1.2 million tonnes in 1999.
• China’s planned accession to the World Trade Organisation isexpected to have a significant impact on demand for vegetable oil,increasing oil imports and dampening the recent growth in demandfor imported oilseeds.
China’s agricultural policies have a significant impact on the pattern of worldoilseeds trade. As Australia’s largest canola export market, changes in marketaccess have implications for the canola industry. An increase in market accessseems likely as China is currently in the process of trying to gradually reducetrade protection in order to become a member of the WTO.
The Chinese government still supports a policy of self sufficiency, the objec-tives of which arose for three main reasons. First, China has historicallysuffered from several food shortages that resulted in starvation, politicalturmoil and rural uprising. Second, during the 1950s to the 1970s, thirtyyears of isolation and frequent political conflict with the United States andother western countries made the Chinese government very cautious aboutrelying on international grain markets for its food supply. Third, Chinesepolicy makers have been concerned that the international grain market maynot be able to meet the demands of China’s increasing population if a foodshortage was to occur.
The policy of self sufficiency in food has had a number of significant impacts,such as extremely high pressure on natural resources, and the loss of compar-ative advantage through the increasing cost of grain production. It also hasa significant impact on international trade. However, markets for almost allnongrain products (soybean oil and cotton were exceptions) were liberalisedby the 1990s. China is now the largest world importer of oilseeds, whichhave partly replaced imports of soybean meal and oil.
This recent shift in policy is designed to promote and protect the domesticcrushing industry. The objective of expanding China’s oilseeds crushing
33Future of canola production

capacity has resulted in general tariffs on seed being reduced, in contrast tothe high tariffs imposed on imports of oil (OECD 2000c).
The recent increase in demand for vegetable oil, coupled with restricted oiland meal imports, has led to a greater emphasis on imports of canola seed(which has a high oil content) to satisfy oil needs. As a consequence,Australian canola producers have exported increasing quantities of canolaseed to China (US Department of Agriculture 1999a).
Currently, high in- and out-of-quota duties (US Department of Agriculture2000b) effectively eliminate the feasibility of exporting canola oil to Chinaand provide incentives for processors to smuggle vegetable oil, particularlycheap palm oil. The Chinese government began trying to stop smuggledvegetable oils during 1998 and 1999 and strictly regulated the allowablequota of imported vegetable oils. The result was a substantial increase inChinese imports of canola seed because of the higher percentage of oil contentrelative to other oilseeds (Doud 1999). Domestic processors have the addedincentive of crushing imported seed and then reexporting the meal and oil,after which they have the tariff refunded. Domestic production of canola oilhas increased in response to agricultural reforms that have resulted in a shiftout of grain production in favor of canola (US Department of Agriculture2000b).
Over the next decade vegetable oil consumption in China is expected tocontinue to rise as the population increases and incomes continue to grow.Domestic oilseeds production is expected to increase in response to higherdemand for oil. It is assumed that there will still be a deficit between thequantity of oilseeds demanded for crush consumption and the quantity ofoilseeds produced domestically. Thus imports of oilseeds are expected toincrease.
The current market situation is likely to change, however, if China’s progresstoward accession to the WTO gains pace. WTO membership is conditionalon agreed liberalisation of China’s oilseeds, vegetable oil and oil mealmarkets. This involves negotiations between China and other WTO membercountries. The timing of China’s accession to the WTO is currently uncer-tain, but is expected to be slow.
34 ABARE research report 01.6

Japan
• In 1999, Japan imported around 2.2 million tonnes of canola.
• Japan is Australia’s second largest export destination.
• The government of Japan introduced mandatory labeling require-ments for 24 foods containing genetically modified ingredients fromApril 2001.
Soybeans and peanuts are the two major oilseeds produced in Japan, andcanola is imported almost exclusively for crushing. Australia has become astable supplier of canola to Japan, securing about a 10 per cent share of thatmarket. Canada holds the largest market share (around 73 per cent in 1999).Demand for canola depends on its import price and the import price ofsoybeans, as these products are substitutes in the Japanese oil market.Therefore, the use and level of tariffs imposed on these two products havea significant impact on canola demand, and thus influence Australia’s accessto this market.
Japan follows a policy of maximising self-sufficiency, providing assistanceto the agricultural sector primarily through administered prices and tariffs.There are no tariffs on imports of canola and soybeans, or their respectivemeals. This encourages domestic crushing rather than importing vegetableoil products. The oil is used for human consumption and the canola andsoybean meal is the primary protein in animal feed production, and is alsoused as fertiliser. Japan maintains high tariffs on oil, with both canola crudeoil and soybean crude oil currently subject to an import duty of 10.90 yen akilogram, down from 11.92 yen a kilogram in 1999 (US Department ofAgriculture 2000c).
Prolonged weak economic growth may cause imports of canola to declineslightly in the short term. However, there is potential for Australia to lift itsmarket share as the government of Japan officially announced a mandatoryGM labeling policy on selected foods beginning April 2001 (US Departmentof Agriculture 2000c). Some manufacturers may start seeking non-GM canolaoil in reaction to this policy. This may result in a lift in imports of Australiannon-GM canola at the expense of GM canola from Canada, assuming thatAustralia either segregates GM canola through the production and exportchain, or opts not to adopt GM canola.
35Future of canola production

Over the longer term, pressure from the WTO process may reduce the tariffson vegetable oils. The government of Japan has repeatedly stated that anytariff reduction should be the subject of negotiation under WTO negotiations(US Department of Agriculture 2000c). Depending on this outcome, theremay be potential for Australia to export canola oil to Japan.
India
• Total vegetable oil consumption in India reached an estimated 10million tonnes in 1999-2000, with canola accounting for 17 per cent.Most of the canola oil consumed was sourced from domesticallyproduced canola.
• Canola and mustard oils are the dominant oils produced in India —around 1.6 million tonnes were produced in 1999 — with productiongreater than that of peanut and soybean oil.
• The potential for Australia to export to this large oil consumer willdepend on continued reductions in trade barriers negotiated inconjunction with the WTO.
Reflecting the low cost of palm oil, consumption of that oil has risen in India— to an estimated 3 million tonnes in 1999. Canola oil was the second largestedible oil consumed in India in the same year, with consumption estimatedat around 2 million tonnes. In contrast to palm oil, which is almost entirelyimported, around 85 per cent of canola oil was produced domestically. In1998-99 around 10 000 tonnes of Australian canola was exported to India.
Canola production in India increased rapidly in the late 1980s, reflecting theIndian government’s desire to attain self sufficiency and reduce large importsof edible oil (Chand and Jha 2000). Until 1994 the oilseeds sector wasprotected through volume restrictions on imports and exports, as well as highimport tariffs. Domestic prices of oilseeds were maintained at more thandouble the world price.
In 1995 import duties were increased following the removal of quantitativeimport restrictions in order to strengthen domestic oil prices and thus expanddomestic production. This was designed to provide better margins to localcrushers and refiners and to satisfy the considerable expansion in domesticvegetable oil demand.
36 ABARE research report 01.6

In July 1999, minimum support prices for oilseeds were raised. This wasaimed at boosting the production of oilseeds, which had remained stabledespite increasing vegetable oil demand, as relatively more attractive supportprices for other crops such as sugar and wheat discouraged oilseeds produc-tion (OECD 2000c).
Under WTO obligations, members are committed to phasing out many protec-tion measures, including trade restrictions on agricultural products, as theydistort world oilseeds markets. India, however, was allowed to maintainquantitative restrictions on some commodities to assist with the balance ofpayments. High tariff ceiling bindings for many agricultural products werealso negotiated. Quantity restrictions are scheduled to be abolished by 2003,although their tariff replacements will be relatively high (OECD 1999a). Forexample, from 1 January 2000, the import duty on refined edible oils wasraised from 16.5 per cent to 32.6 per cent.
Increased oilseeds production resulting from higher domestic support isexpected to increase production of canola in India to 2010. However, twostrong demand factors will have an impact on canola oil imports. First, India’spopulation is expected to continue to increase, with a resultant increase inthe demand for vegetable oils and, second, an income related trend towardhigher oil consumption levels per person is expected to continue.
The outlook for increasing exports of canola oil and seed to India is relianton two major factors. First, ongoing reductions in barriers to trade underWTO reforms are expected to influence the type and quantity of oilseeds andoil imported into India, as well as world oilseeds and oil prices. Reductionsin barriers to trade may be slow, reflecting opposing viewpoints on the bene-fits of trade policy reforms for canola and edible oils in India. Second, theworld price of canola oil relative to palm oil and other major edible oilsconsumed in India will help determine the relative import quantities ofoilseeds and edible oils.
Pakistan
• Since 1996-97, Australian exports of canola to Pakistan haveincreased from around 200 tonnes to 56 200 tonnes in 1999-2000.
In Pakistan, canola seed imports from Australia have increased in responseto higher tariffs on meal and oil and lower tariffs on oilseeds, which increased
37Future of canola production

crushing margins (US Department of Agriculture 2000e). This action wasundertaken to expand oilseeds production by developing a viable process-ing industry that uses both imported and domestic oilseeds. This was designedto reduce pressure on foreign exchange reserves — that are reduced whenpalm oil is imported — and to increase margins for local producers andprovide an incentive for local oilseeds production (US Department of Agricul-ture 2000e).
However, ongoing success in this market will depend on future changes tooilseeds and vegetable oil tariff rates by the Pakistan government. It isexpected that the import duty on oilseeds will be 25 per cent (plus a 15 percent sales tax) for the 2000-01 year (Australian Oilseeds Federation 2000).This is expected to curb oilseeds imports and result in higher demand forvegetable oil imports.
38 ABARE research report 01.6

Prospects for Australian canola
ABARE’s baseline projectionsThe market outlook for the Australian canola industry is positive, althoughit is unlikely that the Australian canola industry will expand at the rate it didduring the 1990s (figure P). After a decline from 1.8 million hectares in 1999to 1.2 million hectares in 2000, Australian canola area is estimated to risegradually to 1.6 million hectares by 2010. Productivity gains are expectedto enable Australian canola production to exceed the 1999 peak of 2.2 milliontonnes by 2010, rising to an estimated 2.4 million tonnes from a low of 1.6million tonnes in 2000.
The recovery in canola production is expected to follow rising world demandfor oilseeds to 2010 as populations and incomes grow in developing coun-tries, particularly in Asia. Growing awareness of the potential health bene-fits of unsaturated oils is expected to increase the consumption of canolarelative to other oil products, particularly as incomes grow in developingcountries. However, despite strong projected demand, world oilseeds pricesare likely to fall gradually in real terms after 2002 as production of low costsoybean and palm oil increases.
ABARE’s projections for the Australian canola industry assume increasingproductivity, with production increasing faster than area to 2010 (figure P).
39
4
Future of canola production
P
1995 201020052000
Australian canola area, production and oilseeds exports
0
500
1000
1500
2000
1990
Canola area (’000 ha)
Canola production (kt)
Oilseeds exports (kt)

However, expected productivity gains are conservative, because of emerg-ing agronomic limitations on the extent to which canola can be included inwinter cereal rotations (appendix A). Adoption of genetically modified vari-eties may overcome some of these agronomic constraints, but this may incuridentity preservation costs and influence the perception of the Australianindustry by GM averse consumers. Strong world prices for wheat and coarsegrains are projected to provide an incentive for Australian producers to reducethe representation of canola in winter cereal rotations (figure Q).
Most of Australia’s canola production will continue to be exported, withexports estimated to rise gradually to 1.9 million tonnes following a fall to1.1 million tonnes in 2000 (figure P). The destination of exports is expectedto shift toward developing countries with strong economic growth, influ-enced by the progress of WTO negotiations over market access.
These projections are referred to as a baseline because they are derived byassuming a continuation of current policies. The baseline assumes the outlookfor world oilseeds markets outlined in this report — including expectedprices, changes in consumer preferences, population growth, economicgrowth and exchange rates. The future of the Australian canola industry to2010 will be shaped by shocks to world markets that are difficult to predict,as well as policy changes in world markets currently under development.
Impact of potential developmentsSome indication of the potential impact of expected market changes andpolicy developments on ABARE’s baseline projections for the canola indus-
40 ABARE research report 01.6
Q
20102006200420022000
World price indexes for wheat, coarse grains and oilseeds
2000 = 10080
90
100
110
120
130
2008
Coarse grains
Wheat
Oilseeds

try can be obtained using the OECD’s Aglink model (OECD 1999b). Aglinkwas used to simulate four alternative scenarios for the Australian canolaindustry, which can be compared with the baseline projections. These scenar-ios cover the impacts of:
• adopting genetically modified canola in Australia;
• an increase in world wheat prices;
• the European Union’s Agenda 2000 suite of policies; and
• a reduction in China’s oilseeds tariffs.
AglinkAglink is a dynamic economic model of the world’s major temperate zoneagricultural commodity markets, focusing on those commodities most impor-tant to OECD member countries. Aglink encompasses demand, supply, tradeand price determination on an annual basis for as many as 27 commoditiesfor each of 22 countries or regions, such as the European Union.
Aglink contains detailed representations of the ten major agricultural produc-ing and trading countries or regions within the OECD (Australia, Canada,the European Union, Japan, the Republic of Korea, Mexico, New Zealand,the United States, Poland and Hungary), as well as China and Argentina. Italso has a representation of the beef sector for Mercosur countries (selectedSouth American nations), and countries in Asia that are important for theworld beef market.
Trade flows provide a link between countries and regions and are determinedby price movements as well as policies like tariff rate quotas, and produc-tion and export subsidies. Another feature of Aglink is that the dynamicbehavior of livestock inventories and animal production is modeled. Aglinkcontains individual price determination for beef, pork, poultry meat, cheese,butter, skim milk powder, wheat, coarse grains, oilseeds, oilseeds meal, andvegetable oil in each of the major agricultural producing countries and regionsof the world.
To provide a more detailed analysis, ABARE has enhanced Aglink’s repre-sentation of Australia’s livestock and cropping sectors, feed demand elas-ticities and crop area allocation models for the European Union, and worldstocks equations for most crops.
41Future of canola production

Scenario 1: Adoption of GM canola in Australia
BackgroundCanada is the major producer of GM canola in the world; small quantitiesare also produced in the United States. In Australia, herbicide tolerant GMcanola has been extensively field trialed and it is likely that two developers,Aventis Crop Science and Monsanto, will soon apply to the Office of theGene Technology Regulator for commercial release. It is thought that thesedevelopers are aiming for commercial release in 2003.
As discussed earlier, there are a number of issues that surround the commer-cial release of herbicide tolerant GM canola. First, there are questions aboutthe environmental safety of the variety, particularly the possibility that itcould pass on its herbicide tolerance to weeds. Second, the possibility ofpremiums for non-GM canola means that nonadopters are worried aboutpotential contamination from GM varieties, either through cross pollinationor co-mingling in the storage and handling system.
There are only limited signs at present of premiums for certified non-GMcanola in world markets. One explanation of this is that there are enoughnon-GM supplies from Australia and the European Union to meet require-ments simply through adjustments in the pattern of world trade. There is noneed for costly identity preservation arrangements to create additional quan-tities of certified non-GM canola.
However, if Australia were to adopt GM varieties, a shortage of certifiednon-GM canola could emerge on world markets. That is, premiums may benecessary to ration the supply of certified non-GM grain and to bring forthadditional supplies.
ApproachTwo simulations were run to assess the market implications of wide scaleadoption of GM canola in Australia.
• In the first, the agronomic benefits of adopting GM canola were assessedalone.
• In the second, the agronomic benefits and additional costs of separatingGM and non-GM in the handling and storage process were assessed.
42 ABARE research report 01.6

For the first simulation, the assumptions were:
• The agronomic benefits of the genetically modified variety are a yieldadvantage of 7 per cent over conventional varieties already in use and adecrease in weed control costs (including seed costs) equivalent to a 3 percent reduction in total production costs.
• An adoption rate of 50 per cent. This is roughly the same as the adoptionrate of herbicide tolerant canola in Canada.
The additional assumptions for the second simulation were:
• Australia segregates GM and non-GM canola at the point of export. It isassumed that identity preservation of non-GM canola adds 10 per cent tothe cost of delivering all Australian canola to the point of export. This isbroadly consistent with estimates in Buckwell, Brookes and Bradley (1998)and Economic Research Service (2000).
• Canola oil and meal are not subject to identity preservation requirements.(The meal is used as livestock feed and the oil does not contain DNA thatwould identify it as being genetically modified.)
Simulation of GM canola adoptionThe market implications of the two scenarios are summarised in table 7. Theeffects of each simulation on key market variables are illustrated in figure R.
Assuming agronomic benefits only — that is, yield improvements and costof production reductions — the adoption of the GM variety is estimated to
43Future of canola production
R Changes in key oilseeds market variables under two scenarios
–4 –2 % 2 4 6 8 10 12
Indicator price,canola
Oilseeds exports
Oilseeds exports
Canola production
Canola area harvested
Agronomic benefits and identity preservation costs
Agronomic benefits only
Aust
ralia
Wor
ld

44 ABARE research report 01.6
7 Simulated impacts of Australia adopting genetically modified canola
AgronomicBaseline benefits only Change
2005 2010 2005 2010 2005 2010
World % %Indicator priceSoybean US$/t 231.9 227.5 231.5 227.2 –0.2 –0.1Canola US$/t 293.9 295.3 293.5 294.9 –0.1 –0.1
ProductionOilseeds Mt 249.7 268.6 249.7 268.7 0.0 0.0
ConsumptionOilseeds Mt 249.9 270.1 250 270.2 0.0 0.0Vegetable oil Mt 79.9 86.9 79.9 86.9 0.0 0.0Oilmeal Mt 157.4 170.8 157.5 170.8 0.1 0.0
ExportsOilseeds a Mt 10.3 6.6 10.4 6.7 1.0 1.5
AustraliaMarket priceCanola $/t 301.2 291.6 300.9 291.3 –0.1 –0.1
Area harvestedCanola ‘000 ha 1 497 1 605 1 589.3 1 686 6.2 5.0Coarse grains ‘000 ha 4 509 4 620 4 507 4 618 0.0 0.0Other oilseeds ‘000 ha 186 132 186 132 0.0 0.0Wheat ‘000 ha 12 584 11 519 12 547 11 484 –0.3 –0.3
ProductionCanola kt 2 058 2 377 2 261 2 584 9.9 8.7Coarse grains kt 9 887 10 930 9 882 10 926 –0.1 0.0Other oilseeds kt 228 228 228 228 0.0 0.0Wheat kt 25 887 25 136 25 812 25 060 –0.3 –0.3
YieldCanola t/ha 1.37 1.48 1.42 1.53 3.6 3.4
ExportsOilseeds kt 1 638 2 162 1 870 2 162 14.2 0.0Coarse grains kt 4 621 4 492 4 615 4 492 –0.1 0.0Wheat kt 20 287 19 500 20 211 19 500 –0.4 0.0
Continued ➮
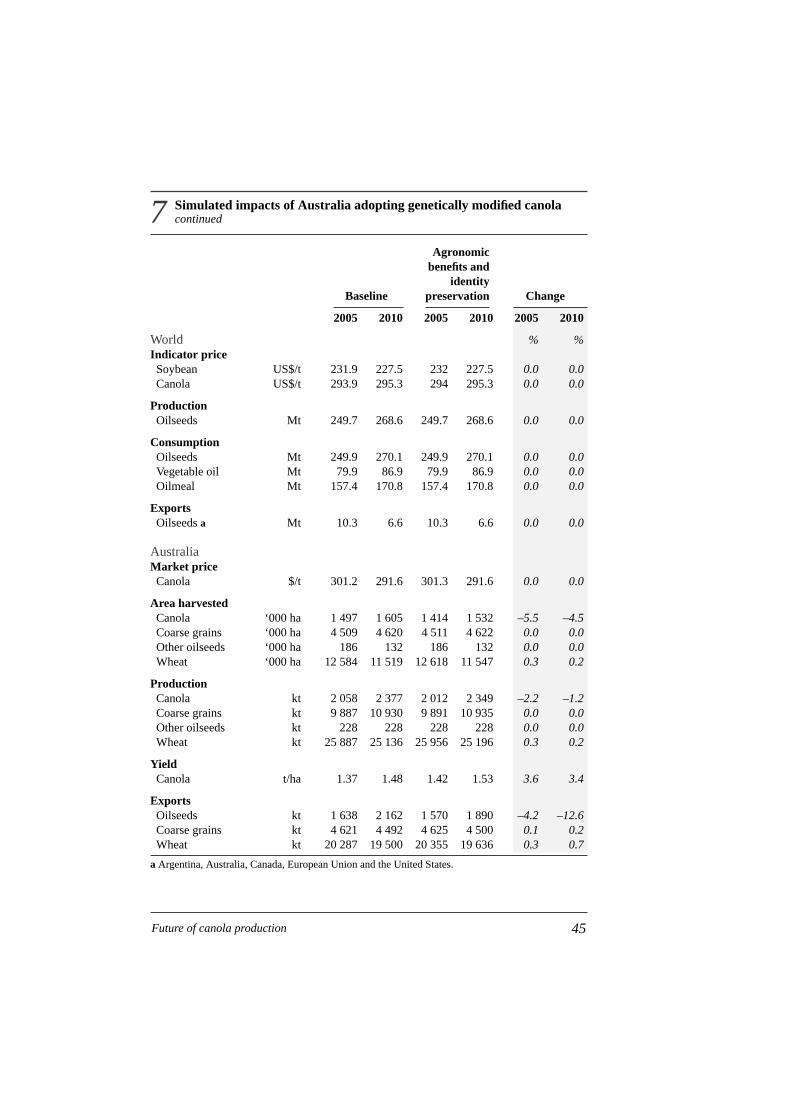
7 Simulated impacts of Australia adopting genetically modified canolacontinued
Agronomicbenefits and
identityBaseline preservation Change
2005 2010 2005 2010 2005 2010
World % %Indicator priceSoybean US$/t 231.9 227.5 232 227.5 0.0 0.0Canola US$/t 293.9 295.3 294 295.3 0.0 0.0
ProductionOilseeds Mt 249.7 268.6 249.7 268.6 0.0 0.0
ConsumptionOilseeds Mt 249.9 270.1 249.9 270.1 0.0 0.0Vegetable oil Mt 79.9 86.9 79.9 86.9 0.0 0.0Oilmeal Mt 157.4 170.8 157.4 170.8 0.0 0.0
ExportsOilseeds a Mt 10.3 6.6 10.3 6.6 0.0 0.0
AustraliaMarket priceCanola $/t 301.2 291.6 301.3 291.6 0.0 0.0
Area harvestedCanola ‘000 ha 1 497 1 605 1 414 1 532 –5.5 –4.5Coarse grains ‘000 ha 4 509 4 620 4 511 4 622 0.0 0.0Other oilseeds ‘000 ha 186 132 186 132 0.0 0.0Wheat ‘000 ha 12 584 11 519 12 618 11 547 0.3 0.2
ProductionCanola kt 2 058 2 377 2 012 2 349 –2.2 –1.2Coarse grains kt 9 887 10 930 9 891 10 935 0.0 0.0Other oilseeds kt 228 228 228 228 0.0 0.0Wheat kt 25 887 25 136 25 956 25 196 0.3 0.2
YieldCanola t/ha 1.37 1.48 1.42 1.53 3.6 3.4
ExportsOilseeds kt 1 638 2 162 1 570 1 890 –4.2 –12.6Coarse grains kt 4 621 4 492 4 625 4 500 0.1 0.2Wheat kt 20 287 19 500 20 355 19 636 0.3 0.7
a Argentina, Australia, Canada, European Union and the United States.
45Future of canola production

result in Australian canola production increasing by 8.7 per cent by 2010compared with the baseline and Australian oilseeds exports increasing by11.8 per cent. At the world level, the impact would be small, with worldoilseeds exports increasing by 1.4 per cent and the additional supplies reduc-ing the world indicator price for canola by 0.2 per cent. Australia would gainmarket share at the expense of Canada and the United States.
For Australia to produce the same amount of canola if it remained GM free,it is estimated that the premium for non-GM canola would have to be of theorder of 10.4 per cent. At this stage, premiums of this magnitude do not seemto be available on a wide scale in world canola markets.
However, it is estimated that the imposition of identity preservation costs —the second simulation — would reverse these Australian gains in the worldoilseeds market. Australian canola production would fall by an estimated1.2 per cent and Australian oilseeds exports by 2.3 per cent compared withthe baseline. At the world level, the only impact would be an estimated 0.2per cent decline in world oilseeds exports; the impact on world oilseeds priceswould be negligible.
In a mixed production system, GM free canola would have to attract apremium of 10 per cent to ensure that non-GM canola producers were notmade worse off by the introduction of GM canola. Australia adopting GMcanola could actually lead to more pronounced premiums in world marketsbecause it would substantially lower world supplies of non-GM canola.
Implications for AustraliaGiven the assumptions, the general conclusion to be drawn from the modelresults is that the introduction of herbicide tolerant canola to Australia is notjustified if consumer acceptance problems require identity preservationarrangements. Alternatively, a significant premium for nongenetically modi-fied over genetically modified canola would be necessary to offset the addi-tional costs.
These conclusions, however, are sensitive to the assumptions. Higher yieldsfor genetically modified canola, greater cost savings and lower identity preser-vation costs could change the profitability estimates.
Comparative advantage in producing genetically modified canola could varyon a region to region basis. For example, the problem of resistance of weeds
46 ABARE research report 01.6

to existing herbicide products may be so large in some regions that the agro-nomic benefits of the new technology may outweigh the additional costs ofoperating a mixed system or any premiums lost. It is possible that theAustralian canola industry would become segmented into regions that eitherhave a mix of genetically modified and conventional varieties or do not allowthe growing of genetically modified varieties. There are provisions underthe Gene Technology Act 2000 for declaring zones free from particular typesof genetically modified organisms.
A consideration with the introduction of genetically modified crops is thatonce genetically modified crops are introduced it is very difficult and costlyto remove them from production systems if any unforeseen problems withhuman and environmental health were to emerge. The STARLINK case illus-trates this, with the cost of product recalls and elimination from seed stocksbeing estimated at up to US$1 billion.
Scenario 2: An increase in world wheat prices
BackgroundThe potential for canola production to expand in Australia is expected to bestrongly influenced by changes in world wheat prices. Changing relativecrop prices affect the balance between canola and other crops in winter crop-ping rotations.
Canola has tended to be sown approximately once in four years in wintercrop rotations, but this balance is influenced by changes in prices and tech-nology. In particular, canola can be cropped more or less frequently inresponse to changes in the price of canola and other crops in the rotation,especially wheat. In the late 1990s, wheat prices were relatively low, andthis probably contributed to the expansion of canola areas. Wheat pricescould be higher than projected by ABARE for several reasons. A drought inwheat producing areas around the world can cause wheat prices to risedramatically in the short term. World wheat supplies would be reduced ifdomestic support paid to wheat producers in the European Union and theUnited States was reduced, leading to higher world prices.
ApproachTwo simulations were run to estimate the impact of higher wheat prices onthe Australian canola industry. In the first, world wheat production was
47Future of canola production

48 ABARE research report 01.6
8 Simulated impacts of a higher wheat price, 2001–03
Higher wheat priceBaseline in 2001–03 Change
2003 2005 2010 2003 2005 2010 2003 2005 2010
World % % %Indicator priceWheat US$/t 132 152 156 174 148 155 31.7 –3.0 –0.2Coarse grains US$/t 103 112 108 116 109 107 12.1 –2.3 –0.5Oilseeds US$/t 223 232 228 243 227 228 8.7 –2.3 0.1Oilseed meal US$/t 178 196 218 203 190 217 13.5 –3.0 –0.1Vegetable oil US$/t 407 376 387 407 378 388 –0.1 0.5 0.1
AustraliaPriceWheat A$/t 227 246 250 290 239 249 27.8 –2.6 –0.2Coarse grains A$/t 151 160 156 164 157 156 8.5 –1.5 –0.3Canola A$/t 318 301 292 333 298 292 4.6 –1.2 0.1Oilseeds A$/t 311 294 286 326 290 286 4.9 –1.2 0.1Oilseed meal A$/t 287 291 302 300 289 302 4.6 –0.7 –0.1Vegetable oil A$/t 1 131 1 116 1 123 1 130 1 122 1 124 –0.2 0.5 0.1
ProductionWheat kt 25 474 25 887 25 135 28 516 26 608 25 037 11.9 2.8 –0.4Coarse grains kt 9 403 9 887 10 930 8 955 9 937 10 945 –4.8 0.5 0.1Canola kt 1 793 2 058 2 377 1 686 2 144 2 369 –5.9 4.2 –0.3Oilseeds kt 2 030 2 285 2 604 1 924 2 371 2 597 –5.2 3.8 –0.3Oilseed meal kt 417 408 422 423 408 422 1.6 –0.1 –0.1Vegetable oil kt 264 259 267 268 258 267 1.6 –0.1 –0.1
ConsumptionWheat kt 4 846 4 840 5 060 4 639 4 866 5 065 –4.3 0.5 0.1Coarse grains kt 4 973 5 093 6 261 5 194 5 100 6 279 4.4 0.1 0.3Oilseeds kt 694 681 703 705 680 703 1.6 –0.1 –0.1Oilseed meal kt 874 935 1 287 854 938 1 290 –2.3 0.4 0.3Vegetable oil kt 304 354 545 303 355 546 –0.3 0.3 0.1
ExportsWheat kt 20 178 20 286 19 575 23 427 20 981 19 471 16.1 3.4 –0.5Coarse grains kt 4 257 4 621 4 496 3 588 4 664 4 493 –15.7 0.9 –0.1Oilseeds kt 1 371 1 638 1 934 1 254 1 724 1 927 –8.5 5.3 –0.4
ImportsOilseed meal kt 462 531 869 436 535 873 –5.7 0.8 0.4Vegetable oil kt 151 205 388 146 207 388 –3.3 0.6 0.1

assumed to drop by a temporary 7.5 per cent between 2001 and 2003, caus-ing the world price of wheat to rise significantly for a few years before return-ing toward baseline levels. The second simulation assumes a moderate, butpermanent, increase in world wheat price throughout the projection periodto 2010, induced by a permanent 2.5 per cent reduction in world wheatproduction.
Simulation 1: Increase in wheat price, 2001–03A 7.5 per cent reduction in world wheat production between 2001 and 2003was estimated to increase world wheat price in the short term by over 30 percent to US$174 a tonne in 2003 (table 8). Wheat prices of this level andhigher were reached in the mid-1990s, when the price reached US$209 atonne in 1995, and US$184 a tonne in 1996.
A short term 30 per cent increase in world wheat prices causes the worldprice of substitutes including coarse grains and oilseed meal to rise in theshort term, increasing the world price of oilseeds by 8.7 per cent in 2003(table 8).
Implications for AustraliaAustralian wheat prices are estimated to rise by nearly 28 per cent in 2003under this scenario, with oilseeds and canola prices increasing by around 5per cent (table 8). A higher wheat price causes farmers to substitute towardthe production of wheat away from other crops, including canola, with canolaproduction falling by a lower proportion than the increase in wheat produc-tion.
Wheat production is estimated to increase by 11.9 per cent in 2003, displac-ing production of 5.9 per cent for canola and 4.8 per cent for coarse grains.The reduction in canola production resulting from the higher wheat pricesis partially offset by higher crushing margins, which are estimated to increaseby 1.6 per cent. Higher wheat production is estimated to increase wheatexports in the short term (up 16.1 per cent in 2003), while lower oilseedsproduction reduces oilseeds exports (down 8.5 per cent in 2003).
As wheat prices return toward baseline levels beyond 2005, wheat and canolaareas also return toward baseline levels.
49Future of canola production

9 Simulated impacts of a higher wheat price, 2001–10
Higher wheat priceBaseline in 2001–10 Change
2003 2005 2010 2003 2005 2010 2003 2005 2010
World % % %Indicator priceWheat US$/t 132 152 156 143 168 166 7.9 10.3 6.8Coarse grains US$/t 103 112 108 105 115 111 1.7 2.6 2.5Oilseed US$/t 223 232 228 227 241 231 1.7 4.0 1.5Oilseed meal US$/t 178 196 218 184 206 222 2.9 5.3 2.1Vegetable oil US$/t 407 376 387 407 377 388 –0.1 0.3 0.1
AustraliaPriceWheat A$/t 227 246 250 243 268 264 6.9 9.0 5.9Coarse grains A$/t 151 160 156 153 163 159 1.2 1.9 1.9Canola A$/t 318 301 292 321 308 294 0.8 2.4 0.9Oilseed A$/t 311 294 286 314 301 289 0.9 2.5 0.9Oilseed meal A$/t 287 291 302 290 297 305 1.0 1.9 0.8Vegetable oil A$/t 1 131 1 116 1 123 1 131 1 117 1 124 0.0 0.1 0.1
ProductionWheat kt 25 474 25 887 25 135 26 076 27 149 26 123 2.4 4.9 3.9Coarse grains kt 9 403 9 887 10 930 9 348 9 734 10 764 –0.6 –1.5 –1.5Canola kt 1 793 2 058 2 377 1 781 2 010 2 348 –0.7 –2.3 –1.2Oilseed kt 2 030 2 285 2 604 2 018 2 238 2 576 –0.6 –2.1 –1.1Oilseed meal kt 417 408 422 418 411 423 0.4 0.6 0.3Vegetable oil kt 264 259 267 265 260 268 0.4 0.6 0.3
ConsumptionWheat kt 4 846 4 840 5 060 4 777 4 757 5 016 –1.4 –1.7 –0.9Coarse grains kt 4 973 5 093 6 261 5 050 5 192 6 345 1.5 1.9 1.3Oilseed kt 694 681 703 697 684 705 0.4 0.6 0.3Oilseed meal kt 874 935 1 287 868 930 1 282 –0.7 –0.5 –0.4Vegetable oil kt 304 354 545 304 354 547 0.0 –0.1 0.3
ExportsWheat kt 20 178 20 286 19 575 20 848 21 631 20 607 3.3 6.6 5.3Coarse grains kt 4 257 4 621 4 496 4 125 4 369 4 245 –3.1 –5.5 –5.6Oilseed kt 1 371 1 638 1 934 1 356 1 586 1 903 –1.1 –3.1 –1.6
ImportsOilseed meal kt 462 531 869 454 523 863 –1.7 –1.4 –0.7Vegetable oil kt 151 205 388 149 203 389 –0.7 –0.9 0.2
50 ABARE research report 01.6

Simulation 2: Moderate increase in wheat price, 2001–10A permanent 2.5 per cent reduction in world wheat production from 2001 isestimated to increase the world wheat price by 10.3 per cent in 2005 and by6.8 per cent in 2010 (table 9).
Implications for AustraliaHigher world prices are estimated to increase Australian wheat productionin the long term by 2.4–4.9 per cent, with an estimated decline in canolaproduction of 0.7–2.6 per cent.
Unlike the first simulation, the change in the balance between canola andwheat production is permanent, reflecting the permanent change in relativeprices. Similarly, wheat exports are estimated to increase by 5 per cent onaverage between 2002 and 2010, with oilseeds exports falling by an aver-age 1.9 per cent over the same period.
Scenario 3: Impact of Agenda 2000Lower direct payments under Agenda 2000 are estimated to reduce oilseedsproduction in the European Union to 2010. Despite higher oilseeds importsestimated for the European Union, the impact on world oilseeds prices andthe Australian oilseeds market is estimated to be relatively small.
BackgroundThe European Union is one of the world’s largest importers and consumersof oilseeds products and therefore has the potential to strongly influencedevelopments in world oilseeds markets. The reforms to the EuropeanUnion’s Common Agricultural Policy being implemented under the Agenda2000 agreement were described in chapter 3.
The components of the Agenda 2000 agreement expected to influence worldoilseeds markets, and simulated using Aglink, include:
• a reduction in direct payments for oilseeds of more than 30 per cent inthree equal steps to 63 euros a tonne by 2002-03;
• a reduction in the cereal intervention price of 15 per cent in two equalsteps from 1 July 1999; and
• direct payments for cereals increased in two annual steps from 54.34 eurosa tonne to 63 euros a tonne by 2001.
51Future of canola production

10 Simulated impacts of Agenda 2000 using Aglink
CAP 1992 Agenda 2000 Change
2001 2005 2010 2001 2005 2010 2001 2005 2010
% % %European UnionReturns per hectareOilseeds ECU/ha 945 999 1 010 852 881 872 –9.8 –11.8 –13.7Cereals ECU/ha 923 995 999 859 969 985 –7.0 –2.6 –1.5
ProductionOilseeds kt 13 370 16 710 16 426 11 976 14 746 14 161 –10.4 –11.8 –13.8Coarse grains kt 96 279 97 994 96 539 96 203 97 897 96 882 –0.1 –0.1 0.4Wheat kt 101 523 102 113 107 898 101 966 103 522 110 569 0.4 1.4 2.5
ConsumptionOilseeds kt 34 245 32 948 35 761 34 023 32 809 35 563 –0.6 –0.4 –0.6Oilseed meal kt 34 070 34 334 38 333 32 603 33 183 37 185 –4.3 –3.4 –3.0Coarse grains kt 93 204 92 945 88 844 94 698 94 767 90 261 1.6 2.0 1.6Wheat kt 85 521 92 318 94 855 86 611 91 582 93 617 1.3 –0.8 –1.3
Intervention stocksCoarse grains kt 12 844 1 546 6 184 11 678 0 0 –9.1 –100.0 –100.0Wheat kt 9 138 6 634 7 760 11 038 0 0 20.8 –100.0 –100.0
TradeOilseedsimports kt 21 504 16 790 19 880 22 674 18 619 21 950 5.4 10.9 10.4
Unsubsidised wheat exports kt 0 0 11 0 7 340 9 481 na na na
Continued ➮
As discussed in chapter 3, ABARE assumes that no change in crop set-asiderates will occur under Agenda 2000 because previously higher rates werenot enforced.
ApproachAgenda 2000 is already being implemented, and is included in ABARE’sbaseline. To analyse the impacts of Agenda 2000, a continuation of theCommon Agricultural Policy following the 1992 reforms was simulated(table 10).
This approach highlights changes in commodity markets that would bebrought about by the Agenda 2000 reforms.
52 ABARE research report 01.6

53Future of canola production
Simulation of Agenda 2000Agenda 2000 is estimated to reduce returns from oilseeds production in theEuropean Union compared with that from cereals, because the reduction indirect payments to oilseeds producers is not compensated (table 10). Whilethe support price of cereals is being reduced in the European Union, increaseddirect payments mean that returns per hectare from cereal production fallonly slightly in the medium term. Lower returns are estimated to reduce EUoilseeds production by 11.8 per cent in 2005 and 13.8 per cent in 2010, asgrowers shift production to cereals, with wheat production up 2.5 per centin 2010.
Lower domestic production raises the price of oilseeds within the EuropeanUnion and, combined with lower cereal prices, reduces domestic consump-
10 Simulated impacts of Agenda 2000 using Aglink continued
CAP 1992 Agenda 2000 Change
2001 2005 2010 2001 2005 2010 2001 2005 2010
% % %WorldIndicator pricesOilseeds US$/t 187 230 226 185 232 228 –0.9 1.0 0.9Oilseed meal US$/t 159 197 219 154 196 218 –3.5 –0.5 –0.8Vegetable oil US$/t 372 371 382 378 376 387 1.5 1.4 1.3Coarse grain US$/t 97 110 108 97 112 108 0.3 2.1 –0.3Wheat US$/t 111 153 158 111 152 156 –0.1 –0.5 –1.5
AustraliaPricesOilseeds A$/t 290 290 283 291 294 286 0.2 1.3 1.2Oilseed meal A$/t 296 292 303 293 291 302 –1.0 –0.3 –0.4Vegetable oil A$/t 1 042 1 108 1 115 1 053 1 116 1 123 1.0 0.8 0.7Coarse grains A$/t 151 158 157 152 160 156 0.2 1.3 –0.3Wheat A$/t 209 247 253 209 246 250 –0.1 –0.5 –1.3
ProductionOilseeds kt 1 770 2 244 2 560 1 809 2 285 2 604 2.2 1.8 1.7Coarse grains kt 8 640 9 839 10 850 8 641 9 887 10 930 0.0 0.5 0.7Wheat kt 25 232 26 170 25 513 25 198 25 887 25 135 –0.1 –1.1 –1.5
ExportsOilseeds kt 1 080 1 593 1 887 1 123 1 638 1 934 4.0 2.8 2.5Wheat kt 20 053 20 588 19 966 20 015 20 287 19 575 –0.2 –1.5 –2.0
na Not available.
tion of oilseed meal and the domestic crush of oilseeds (table 10). However,the supply of oilseeds falls more than demand, increasing oilseeds importsby 10 per cent in the medium term. A lower support price for cereals is esti-mated to increase domestic consumption of coarse grains, and increase unsub-sidised exports of wheat, clearing intervention stocks of wheat and coarsegrains in the medium term.
The estimated increase in EU oilseeds imports under Agenda 2000 is esti-mated to increase world oilseeds prices by around 1 per cent in the mediumterm (table 10). Lower demand for oilseed meal within the European Unionreduces the world indicator price of oilseed meal, while lower production ofvegetable oils by European Union leads to a slight price increase. Higherexports of wheat from the European Union tend to dampen world wheatprices, with a mixed effect on coarse grain prices from the shift in feeddemand toward cereals in the European Union.
Implications for Australia Agenda 2000 is estimated to have only a minor impact on the Australianoilseeds industry. While direct payments to EU oilseeds producers are to bereduced under Agenda 2000, they remain high at 290 euros per hectare.Nevertheless, the small reduction in direct payments results in slightly higherworld oilseeds prices and Australian canola production is estimated toincrease by just under 2 per cent in the long term. Lower world wheat pricesresulting from higher exports from the European Union reduce Australianwheat exports by 1.5 per cent in 2005, and 2.0 per cent in 2010.
Scenario 4: A reduction in China’s oilseeds tariffs Reduced Chinese tariffs for oilseeds products, following the proposed acces-sion of China to the World Trade Organisation, are estimated to slightlyincrease world and Australian canola prices, resulting in small increases inAustralian canola production and exports.
BackgroundChina is a significant market for Australian oilseeds and related productsbecause of its size, proximity and rate of economic growth. Ongoing nego-tiations are expected to result in China’s accession to the WTO, and thesenegotiations have already led to a number of bilateral agreements with thepotential to improve Australia’s export opportunities to China. For example,
54 ABARE research report 01.6
in November 1999, Canada and China reached an agreement on a wide rangeof market access issues related to China’s entry into the WTO (CanadianDepartment of Foreign Affairs and Trade, 1999 – www.dfat.maeci.gc.ca).Of particular interest were market access agreements for canola oil and canolaseed, including:
• elimination of a tariff rate quota within six years, starting at 600 000 tonneson accession to the WTO and rising to 1.13 million tonnes in five years;
• a 9 per cent tariff will apply to canola oil, reduced to the rate on soybeanoil, its main competitor; and
• no tariff rate quota will apply to canola seed.
In May 2000, Australia reached an agreement with China to liberalise accessto the Chinese market when China joins the WTO. This agreement was simi-lar to the agreement between Canada and China, but included an agreementthat the tariff on canola seed will be reduced to 9 per cent in 2000 (Vaile2000). Australia also has ‘most favored nation’ status with China, and willtherefore benefit from concessions negotiated between China and the UnitedStates, the European Union and other WTO members.
Of particular significance is the bilateral agreement negotiated between Chinaand the United States in November 1999. China’s commitments under thisagreement include:
• China will bind its tariff for soybeans at the current applied rate of 3 percent, foreclosing its ability to establish a quota in the future.
• China will bind its tariff for soybean meal at 5 per cent.
• China will phase out the tariff rate quota for soybean oil by 2006, increas-ing the quota from 1.7 million tonnes to 3.26 million tonnes during theimplementation period.
• The in-quota tariff to 2006 will be 9 per cent while the overquota tariffwill fall from 74 per cent in 2000 to 9 per cent in 2006.
• China will immediately eliminate quotas on cotton seed, sunflower,safflower, peanut and corn oil and replace them with a 10 per cent tariff.
The US Senate passed legislation in September 2000 that approved ‘perma-nent normal trade relations’ with China (US Department of State 2000). Thefinalisation of this agreement will help facilitate China’s accession to theWTO.
55Future of canola production

11 Simulated impacts of a reduction in China’s oilseeds tariffs, usingAglink
Baseline Reduced oilseeds tariff Change
2001 2005 2010 2001 2005 2010 2001 2005 2010
% % %ChinaDomestic priceOilseeds yuan/t 3 382 4 723 4 781 3 198 4 489 4 543 –5.4 –5.0 –5.0Oilseed meal yuan/t 2 072 2 697 3 303 2 072 2 698 3 302 0.0 0.0 0.0Vegetable oil yuan/t 5 561 6 972 7 177 5 555 6 967 7 171 –0.1 –0.1 –0.1
ProductionOilseeds kt 25 487 28 069 28 678 25 201 27 666 28 243 –1.1 –1.4 –1.5Oilseed meal kt 16 973 19 591 22 244 17 599 20 395 23 371 3.7 4.1 5.1Vegetable oil kt 5 613 6 331 7 189 5 820 6 591 7 553 3.7 4.1 5.1
ConsumptionOilseeds kt 31 929 35 212 39 499 32 922 36 434 41 177 3.1 3.5 4.2Oilseed meal kt 20 122 27 071 29 184 20 143 27 105 29 215 0.1 0.1 0.1Vegetable oil kt 10 037 11 513 7 743 10 029 11 499 7 731 –0.1 –0.1 –0.2
ImportsOilseeds kt 6 649 7 348 11 027 7 928 8 974 13 140 19.2 22.1 19.2Oilseed meal kt 3 205 7 527 6 986 2 599 6 756 5 891 –18.9 –10.2 –15.7Vegetable oil kt 4 580 5 324 684 4 365 5 051 308 –4.7 –5.1 –54.9
Continued ➮
ApproachThe Aglink model was used to simulate the effects on the Chinese, worldand Australian oilseeds industries to 2010 of reductions in tariffs on oilseed,oilseeds meal and vegetable oil imports into China.
Two simulations were run to show the estimated impact of, first, China reduc-ing tariffs on oilseeds alone and, second, the estimated impacts of reducingtariffs on oilseeds and oilseeds products. The simulations are based on thetariff reductions negotiated between China and its trading partners in 1999and 2000.
In the first simulation, Aglink was used to model a tariff reduction on canolaand sunflower seed imports from 45 per cent to 9 per cent, with the tariff onsoybean imports reduced from 16 per cent to 3 per cent over the same period.In addition to these tariff reductions on oilseeds, the second simulationmodeled the impact of reducing tariffs on oilseeds meal and vegetable oil
56 ABARE research report 01.6

57Future of canola production
imports into China. In the second simulation, oilseeds meal tariffs werereduced from 23 per cent to 5 per cent, the tariff on canola oil imports wasreduced from 41 per cent to 9 per cent, while the tariffs on soybean and palmoil imports were reduced from 28 per cent to 9 per cent.
Simulation 1: Reduced oilseeds tariffsReducing the tariff on canola and sunflower seed imports to 9 per cent andon soybean imports to 3 per cent reduces the domestic price of oilseeds inChina by around 5 per cent in 2010 (table 11). A lower domestic price isestimated to increase oilseeds consumption by 3–4 per cent over the period,and reduce production by 1–1.5 per cent. The lower cost of oilseeds is esti-mated to encourage domestic crush, with oilseed meal and oil productionincreasing by 3–5 per cent to 2010, replacing imports of these products.
11 Simulated impacts of a reduction in China’s oilseeds tariffs, usingAglink continued
Baseline Reduced oilseeds tariff Change
2001 2005 2010 2001 2005 2010 2001 2005 2010
% % %WorldIndicator priceOilseeds US$/t 185 232 228 187 234 229 0.6 0.7 0.8Oilseed meal US$/t 154 196 218 154 196 217 0.0 0.1 –0.1Vegetable oil US$/t 378 376 387 377 376 387 –0.2 –0.2 –0.2
AustraliaPriceCanola A$/t 299 301 292 301 303 294 0.5 0.6 0.7Oilseeds A$/t 291 294 286 293 295 288 0.5 0.6 0.7Oilseed meal A$/t 293 291 302 293 291 302 0.0 0.0 –0.1Vegetable oil A$/t 1 053 1 116 1 123 1 051 1 115 1 122 –0.1 –0.1 –0.1
ProductionCanola kt 1 582 2 058 2 377 1 599 2 071 2 391 1.1 0.6 0.6Oilseeds kt 1 809 2 285 2 604 1 826 2 298 2 618 0.9 0.6 0.5Oilseed meal kt 433 408 422 431 406 420 –0.4 –0.5 –0.5Vegetable oil kt 272 259 267 271 257 266 –0.4 –0.5 –0.5
ExportsOilseeds kt 1 123 1 638 1 934 1 143 1 654 1 952 1.8 1.0 0.9
ImportsOilseed meal kt 312 531 869 314 533 871 0.5 0.4 0.2Vegetable oil kt 115 205 388 117 207 389 1.1 0.7 0.4

58 ABARE research report 01.6
12 Simulated impacts of a reduction in China’s oilseeds, oilseed mealand vegetable oil tariffs, using Aglink
Reduced seed mealBaseline and oil tariffs Change
2001 2005 2010 2001 2005 2010 2001 2005 2010
China % % %Domestic priceOilseeds yuan/t 3 382 4 723 4 781 3 205 4 497 4 548 –5.2 –4.8 –4.9Oilseed meal yuan/t 2 072 2 697 3 303 1 985 2 597 3 195 –4.2 –3.7 –3.3Vegetable oil yuan/t 5 561 6 972 7 177 5 261 6 636 6 823 –5.4 –4.8 –4.9
ProductionOilseeds kt 25 487 28 069 28 678 25 225 27 689 28 265 –1.0 –1.4 –1.4Oilseed meal kt 16 973 19 591 22 244 16 815 19 377 21 934 –0.9 –1.1 –1.4Vegetable oil kt 5 613 6 331 7 189 5 561 6 262 7 088 –0.9 –1.1 –1.4
ConsumptionOilseeds kt 31 929 35 212 39 499 31 824 35 018 39 181 –0.3 –0.6 –0.8Oilseed meal kt 20 122 27 071 29 184 20 463 27 440 29 548 1.7 1.4 1.2Vegetable oil kt 10 037 11 513 7 743 10 741 12 287 8 638 7.0 6.7 11.6
ImportsOilseeds kt 6 649 7 348 11 027 6 806 7 534 11 122 2.4 2.5 0.9Oilseed meal kt 3 205 7 527 6 986 3 703 8 110 7 660 15.6 7.7 9.7Vegetable oil kt 4 580 5 324 684 5 336 6 167 1 678 16.5 15.8 145.4
WorldIndicator priceOilseeds US$/t 185 232 228 187 235 230 1.1 1.2 1.1Oilseed meal US$/t 154 196 218 154 196 218 0.0 0.2 0.1Vegetable oil US$/t 378 376 387 396 391 402 4.8 4.1 3.9
AustraliaPriceCanola A$/t 299 301 292 305 307 297 1.9 1.8 1.7Oilseeds A$/t 291 294 286 297 299 291 1.9 1.8 1.7Oilseed meal A$/t 293 291 302 294 291 302 0.0 0.1 0.0Vegetable oil A$/t 1 053 1 116 1 123 1 086 1 141 1 147 3.2 2.2 2.1
ProductionCanola kt 1 582 2 058 2 377 1 636 2 101 2 416 3.4 2.1 1.7Oilseeds kt 1 809 2 285 2 604 1 862 2 329 2 644 3.0 1.9 1.5Oilseed meal kt 433 408 422 438 412 425 1.1 0.9 0.7Vegetable oil kt 272 259 267 275 261 269 1.1 0.9 0.7
ExportsOilseeds kt 1 123 1 638 1 934 1 169 1 675 1 969 4.0 2.3 1.8
ImportsOilseed meal kt 312 531 869 306 527 867 –1.8 –0.7 –0.3Vegetable oil kt 115 205 388 111 203 386 –3.5 –1.2 –0.6
The higher domestic crush and lower domestic production of oilseeds areestimated to increase China’s imports of oilseeds by around 20 per cent to2010. However, China’s higher demand for imports of oilseeds is estimatedto have only a small impact on world oilseeds prices, which are estimatedto rise by less than 1 per cent to 2010. Lower imports of meal and oil intoChina are estimated to have little impact on the world price of these prod-ucts.
Implications for AustraliaA slight increase in world oilseeds prices resulting from lower oilseeds tariffsin China is estimated to have a small positive effect on Australian canolaexports. The Australian price of canola is estimated to rise by less than 1 percent, with production and exports rising by 1–2 per cent in the short term(table 11).
Simulation 2: Reduced oilseeds, oilseed meal andvegetable oil tariffsReducing the tariffs on oilseed meal and vegetable oil imports into China atthe same time as a reduction in the tariff on oilseeds is estimated to reducethe domestic prices of all three commodities in China by 3–5 per cent to2010 (table 12). Reducing the tariff on both oilseeds and derived productsmakes imports of oilseed meal and vegetable oil more attractive relative toimporting and crushing oilseeds in China. Consequently, the consumptionof oilseeds falls slightly to 2010, while oilseed meal consumption increasesby 1–2 per cent, and consumption of vegetable oil rises by 7–11 per cent.
Higher consumption of oilseed meal and oil and lower production broughtabout by lower domestic prices result in higher imports. In contrast to thesimulation in which only the tariffs on oilseeds were reduced, most of theincrease in China’s consumption is met through imports of oilseed meal andoil (table 12). Increased demand for seed and oil on world markets raises theworld indicator price of these two commodities, with world oilseeds and oilprices rising by 1 per cent and 4 per cent respectively in 2010.
Implications for AustraliaUnder this scenario, higher world prices of oilseeds and vegetable oil areestimated to increase the Australian price of canola and oilseeds by less than2 per cent, and increase the Australian price of vegetable oil by over 2 percent in 2010. This is estimated to discourage Australian imports of meal andoil, and encourage domestic crushing of oilseeds, with domestic production
59Future of canola production

60 ABARE research report 01.6
of oilseed meal and oil estimated to increase by around 1 per cent in 2010.Canola production in Australia is estimated to increase by 3.4 per cent in theshort term, and by 1.7 per cent in 2010 Australian oilseeds exports are esti-mated to increase by 4 per cent in the short term.
Agronomic performance of canola inAustralia
The ability of the Australian canola industry to continue responding to favor-able world market conditions will be influenced by its future agronomicperformance. Including canola in Australian winter crop rotations can assistthe management of pest, diseases and weeds. For example, canola can be auseful break crop in the management of soil pathogens such as take-all.Recent studies have suggested that canola can reduce disease outbreaks incereal crops through a biofumigation effect on soil. Angus, Van Herwaarden,and Howe (1991) found that wheat grown following an oilseeds crop washealthier owing to a reduction in soil borne diseases, and improved rootdevelopment.
Canola has been shown to improve soil structure and water infiltration throughits extensive root system. It is frequently noted that the soil following a canolarotation is very friable and easy to cultivate, thus improving conditions forthe direct drilling of subsequent crops (Norton et al. 1999).
Canola can improve water use efficiency and nitrogen utilisation, reducingthe risk of nitrogen leaching. Wheat grown following a canola phase hasbeen found to use 30–55 millimetres more water, and 30–40 kilograms morenitrogen per hectare compared with rotations where wheat follows wheat(Norton, Kirkegaard, Angus and Potter 1999). They also reported a 21 percent yield improvement in wheat following a canola crop, while the level ofprotein was 1.3 per cent higher than grain produced from a wheat/wheat rota-tion.
In some areas, canola has been found to reduce yields in cereal crops becauseof its high nutrient requirements. The extensive root system allows the cropto be very efficient at taking up soil nutrients, depleting the nutrients avail-able to subsequent crops (Brennan et al. 1999). It has been estimated thatcanola requires two and a half times more phosphorus, and five and a halftime more sulfur, than cereal crops to balance fertiliser inputs with nutrientremoval in the grain (Hi-Fert 2000). This level of nutrient replacementincreases production costs significantly. Furthermore, high levels of fertiliseruse can lead to soil acidity problems. However, this can be alleviated byadding lime, which increases production costs as well as adding to any soilcompaction problems (because of increased machinery use).
61
A
Future of canola production
Appendix

In other areas, canola may increase the buildup of pests that affect othercrops. In Western Australia, numerous cereal crops following canola havedisplayed waviness in growth. These crops were found to have been damagedby high nematode populations (I. Riley, University of Adelaide, personalcommunication, February 2000). In 1999, yield losses in wheat from rootlesion nematode were estimated at 5 per cent. Canola is less susceptible tonematodes than wheat, and if increased canola production leads to buildingnematode populations, wheat yields may suffer. Further research is neededto improve an understanding of root lesion nematodes in order to developresistant canola varieties and more effective control methods.
PestsPests of particular importance to the profitability of canola production inAustralia include redlegged earthmites, aphids and snails. The earthmite isthe most serious pest affecting canola crops (Michael and Carmody 1997).This pest prefers capeweed as a host plant but can also survive on a rangeof broadleaf weeds and field crops (Colton and Sykes 1992). They primar-ily affect seedlings, but can also injure older plants. Severe damage in canolatends to occur during establishment, particularly if growth during and follow-ing emergence is slow (Hertel and Woodland 1999). Damaged plants die orremain stunted and weak, and sometimes seedlings are killed before theyemerge.
Prevention is the recommended action, with a number of options for controlincluding a seed treatment, spraying the crop at different stages, and a bareearth spray (Michael and Carmody 1997). Although these methods are gener-ally effective, they contribute to high production costs.
Aphids are a significant pest affecting canola production during flowering,migrating to canola plants in spring from brassica weeds (Miles andMcDonald 1997). Turnip aphid, the most common species, prefers to feedon the growing tips, damaging flowers and buds, and reducing pod set(Berlandier 1999). In addition, aphids can transmit diseases (Berlandier1999), and the honeydew that they produce attracts heliothis (Hertel andWoodland 1999).
Management options for aphids include controlling weeds, sowing early andpesticide application (Berlandier 1999). Chemical control is generally effec-tive, although green peach aphids have been found to be resistant to some
62 ABARE research report 01.6

chemicals. Aphid sprays contribute to the cost of canola production, andcontrol of this pest will continue to influence profitability.
Snails are a major pest contaminating harvested crops, particularly in SouthAustralia. Concern among Japanese buyers over snail contamination exceed-ing an agreed level may cause a nil tolerance to be enforced. To overcomethis threat, research is being carried out to find a cost efficient means ofcontrolling snails (G. Masters, Ausbulk Ltd, personal communication, 2000).
DiseasesSclerotinia affects Australian canola crops in relatively wet, warm springseasons (Dovuro 2000). Warm spring conditions favor vigorous growth ofdense crop foliage that maintains moisture for a longer period and thuscompounds the problem. The incidence of sclerotinia is expected to increaseas broadleaf crops play a larger role in crop rotations in susceptible areas(G. Shepherd, Wellington agronomist, personal communication, August2000).
Crops with sclerotinia levels between 5 and 15 per cent generally experi-ence equivalent decreases in yield (Dovuro 2000). There is no known resis-tance to sclerotinia in any Australian canola variety. However, researchersin Australia are beginning to develop more effective prevention and controlmeasures. The future threat of this disease will depend on the success ofthese prevention and control strategies and developments in plant breedingfor less susceptible varieties.
The blackleg fungus can attack canola plants at all growth stages. A heavyinfection soon after germination will kill plants in the seedling and rosettestages (Colton and Sykes 1992). Blackleg infection of older plants occurson leaves, stems, inflorescences and developing pods. Affected plants becomeinfected at the base of the stem, leading to rotting at ground level. At best,affected plants may produce some shrivelled seeds and, at worst, the move-ment of sap is impeded and the stem breaks off at ground level (Colton andSykes 1992).
Blackleg is carried over from season to season by survival of the fungus oncanola stubble and trash, brassica weeds and volunteer (or self seeded) canolaplants (Colton and Sykes 1992). Even if canola is grown one year in four ina cereal rotation, spores can survive and affect subsequent crops.
63Future of canola production

Precautionary measures for blackleg fungus include avoiding or removingcanola stubble, early sowing and chemical sprays (Agriculture WesternAustralia 2000). Early sowing increases the risk of frost and is associatedwith higher levels of erucic acid in canola oil. Farmers can select varietiesof canola with higher levels of blackleg resistance, including an early matur-ing variety with excellent blackleg resistance that was recently released(Agriculture Western Australia 2000).
WeedsHerbicide resistant weeds are becoming an increasing problem in canolacrops, especially in Australia’s major cropping areas. A farm survey of herbi-cide resistance in Western Australian (1997) indicated that 28 per cent offarms had herbicide resistant ryegrass. Wild oats, wild radish, double geeand mustard weed, were found to be herbicide resistant on 7 per cent, 16 percent, 4 per cent and 1 per cent of farms respectively (Powles undated). Atraditional ley pasture system had been replaced by continuous croppingrotations by many of these producers, leading to greater dependence on herbi-cides for weed control. During the past decade, there has been a large increasein herbicide applications on grain farms in all states (Knopke, O’Donnelland Shepherd 2000), increasing the risk of herbicide resistant weeds.
Increased herbicide resistance increases the cost of controlling weeds, andreduces yields in subsequent crops through weed competition and contam-ination. Mechanical and/or chemical methods of controlling these weeds areusually available, but usually add to production costs.
The prevalence of triazine tolerant canola varieties potentially increases therisk of weeds resistance to this chemical. The use of triazine is becomingincreasingly widespread in areas of Australia where triazine tolerant canolais produced, and the development of atriazine resistance in wild radish andryegrass is becoming a major concern in some areas. According to Sutherland(1999) the widespread production of triazine tolerant canola and the use ofatriazine will lead to an escalation in resistant populations of weeds such asannual ryegrass.
Genetically modified canola
Canola developmentsCanola is the third most commonly trialed of the genetically modified cropsin the world after corn and potatoes. Based on OECD (2000d), genetically
64 ABARE research report 01.6

modified canola had been trialed extensively in Canada (48 per cent of totalworld field trials), the United States (28 per cent) and the European Union(23 per cent).
Genetic modification of canola has been directed largely toward increasedherbicide tolerance and product quality (figure S). With product quality, theaim has been mainly to alter the oil profile so that it is higher in two partic-ular acids — stearic and lauric acid — and lower in saturated fats. Canolaoil that is higher in stearic acid enables the manufacture of solid canola prod-ucts, such as margarine, without extensive hydrogenation. A high lauric acidcontent is suited to confectionery coatings, frostings and icing.
In some cases canola varieties are being sought that have ‘super high’ levelsof erucic acid, a key use of which is to produce erucamide, a slip agent inthe manufacture of plastic films. Canola was originally developed to havelower erucic acid levels than the traditional rapeseed from which it was bred.Other key forms of genetically modified canola under development are shownin table 13.
Farmcentral (2000) provides evidence of net returns for conventional andgenetically modified canola for side by side trials at nineteen different sitesin north America. One GM variety — roundup ready canola — offered a 13per cent yield advantage compared with conventional open pollinated canolabut at an extra cost of C$20 a hectare for weed control (including the seedcost). The equivalent figures for the other main GM variety — liberty linkhybrid — were a 29 per cent yield improvement but with a C$44 a hectareincrease in weed control costs. However, despite the rapid adoption rate, not
65Future of canola production
S OECD field trials of genetically modified canola, by category
Agronomic properties only6%
Herbicide tolerance only 43%
Product quality only 25%
Insect resistance only 2%
Mixed attributes c 17%
Disease resistance only b 5% Other single attribute a 2%
a Includes characteristics such as confidential, marker genes, male sterility and fertility restorers. b Bacterial, fungal, nematodal and viral resistance. c Marker gene insertions are not counted as an additional attribute in this category. Source: OECD (2001)

all assessments of genetically modified canola in Canada are positive. Forexample, Fulton and Keyowski (1999) found slightly lower returns for herbi-cide tolerant canola compared with conventional canola, once the substan-tial technology fee was taken into account.
GM canola in AustraliaIn terms of the progress of field trials of genetically modified crops inAustralia, canola is the second most extensively trialed crop behind cotton.A wide range of traits are being investigated, including herbicide tolerance,fungal resistance, oil and nutritional quality, and yield and pollination char-acteristics (table 14). The closest of these canola varieties to commercialrelease is a herbicide tolerant variety of canola that is expected to be submit-ted for approval for general release in 2001.
66 ABARE research report 01.6
13 Key forms of genetically modified canola in the development pipeline
Developing company/institution Trait(s)
University of Chicago Insect (lepidopteran) resistance
Cargill Fungus resistance (cylindrosporium phomasclerotinia)
Calgene Agronomic properties — yield increased
Calgene Monsanto Oil profile altered to be high in stearates. Does notrequire hydrogenation thus reducing processingcosts
Calgene Cargill Du Pont Oil profile altered to be very low in terms ofsaturated fatty acids
University of Calgary Anticoagulant gene inserted enabling Rhone Poulenc Canada pharmaceutical production
Calgene Altered oil profile with enhanced medium chainfatty acids and triglycerides aimed at providing lessexpensive sources of raw materials for nutritionalformulas and high energy foods
Limagrain Plant Biotechnology Altered nutritional qualitiesInstitute Pioneer Hi-Bred International University of Calgary
AgrEvo Male sterile fertility altered
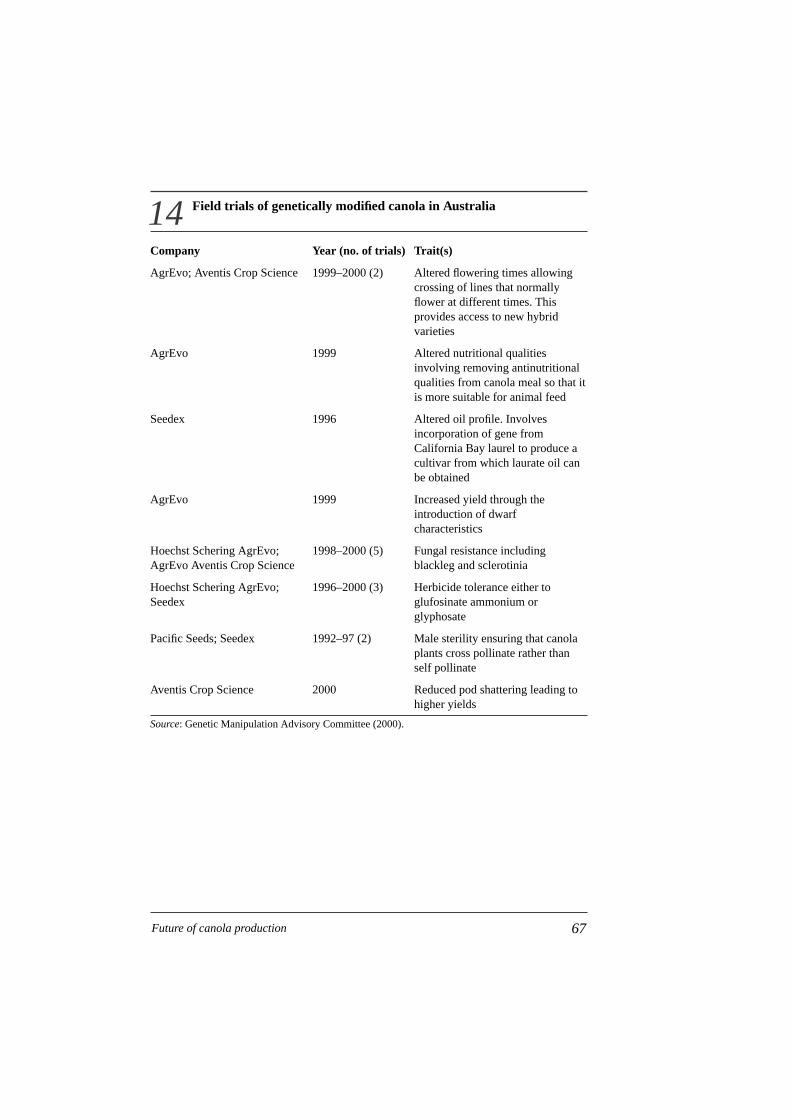
14 Field trials of genetically modified canola in Australia
Company Year (no. of trials) Trait(s)
AgrEvo; Aventis Crop Science 1999–2000 (2) Altered flowering times allowingcrossing of lines that normallyflower at different times. Thisprovides access to new hybridvarieties
AgrEvo 1999 Altered nutritional qualitiesinvolving removing antinutritionalqualities from canola meal so that itis more suitable for animal feed
Seedex 1996 Altered oil profile. Involvesincorporation of gene fromCalifornia Bay laurel to produce acultivar from which laurate oil canbe obtained
AgrEvo 1999 Increased yield through theintroduction of dwarfcharacteristics
Hoechst Schering AgrEvo; 1998–2000 (5) Fungal resistance including AgrEvo Aventis Crop Science blackleg and sclerotinia
Hoechst Schering AgrEvo; 1996–2000 (3) Herbicide tolerance either to Seedex glufosinate ammonium or
glyphosate
Pacific Seeds; Seedex 1992–97 (2) Male sterility ensuring that canolaplants cross pollinate rather thanself pollinate
Aventis Crop Science 2000 Reduced pod shattering leading tohigher yields
Source: Genetic Manipulation Advisory Committee (2000).
67Future of canola production
References
ABARE 1999, Australian Grains Industry: Performance by GRDC Agro-ecological Zones, ABARE Report Prepared for the Grains IndustryResearch and Development Corporation, Canberra, April.
Adolphe, D. 2000, ‘President’s perspective: yield and quality are keys tocompetitiveness’, Canola Council of Canada, pp. 34.
Agriculture Western Australia 2000, ‘Managing blackleg in 2000’, Bulletin4400, Perth (www.agric.wa.gov.au/progserv/Plants/PlantPathology/black-leg99/ManagingBlackleg.PDF).
Akhtar, M.R. 1998, ‘Market prospects for emerging commodities in Pakistan’,Palawija News, vol. 15, no. 2, p. 1 (ESCAP Regional Co-ordination Centrefor Research and Development of Coarse Grains, Pulses, Roots and TuberCrops in the Humid Tropics of Asia and the Pacific).
Angus, J.F., Van Herwaarden, A.F. and Howe, G.N. 1991, ‘Productivity andbreak crop effects of winter-growing oilseeds’, Australian Journal ofExperimental Agriculture, vol. 31, p. 676.
—— 2000, ‘World market outlook and trends: Pakistan’, Australian OilseedsNewsletter, vol. 67 (www.aof.asn.au/frames.htm).
Berlandier, F. 1999, ‘Managing aphids in canola’ Farmnote, AgricultureWestern Australia, Perth (www.agric.wa.gov.au/agency/Pubns/farmnote/1999/f04599.htm).
Brennan, R., Bowden, B., Bolland, M., Rengel, Z. and Isbester, D. 1999, Isnutrition the answer to wheat after canola problems? GRDC project DAW635, Agriculture Western Australia and University of Western Australia,Perth.
Buckwell, A., Brookes, G. and Bradley, D. 1998, Economics of IdentityPreservation for Genetically Modified Crops, Report to the Food Biotech-nology Communications Initiative, December.
68 ABARE research report 01.6

Canola Association of Australia 2000, ‘President’s report: rotational bene-fits quantified’, Canola News, Newsletter no. 67, Wagga Wagga, p. 2.
Chand, R. and Jha, D. 2000, Equity Driven Trade and Marketing Policiesand Strategies for Indian Agriculture: A Scoping Exercise, Sub Project 1:Trade Liberalisation, Agricultural Prices and Net Social Welfare, NationalCentre for Agricultural Economics and Policy Research, Indian Councilof Agricultural Research, New Delhi.
Colton, R.T. and Sykes, J.D. 1992, ‘Canola’, Agfact, P5.2.1. 4th edn, NSWAgriculture, Sydney.
Doud, G. 1999, ‘Global oilseeds and product outlook’, Ag Review, WorldPerspectives Inc, August, pp. 24–6.
Dovuro 2000, ‘Sclerotinia disease in canola’, Agronomic Update, DovuroPty Ltd, Tamworth, New South Wales.
Economic Research Service 2000, ‘Biotechnology: US grain handlers lookahead’, Agricultural Outlook, US Department of Agriculture, WashingtonDC, pp. 29–34.
Farmcentral 2000, Roundup Ready Canola: Net Results (www.farmcentral.com/s/rr/s4rcnzzzz.htm).
Fulton, M. and Keyowski, L. 1999, ‘The producer benefits of herbicide-resis-tant canola’, AgBioForum, vol. 2, no. 2 (www.agbioforum.missouri.edu/agbioforum/vol2no2/fulton.html).
Genetic Manipulation Advisory Committee 2001, ‘Public information sheets’(www.health.gov.au/tga/gene/gmac/piscont.htm).
Hertel, K. and Woodland, K. 1999, Insect and Mite Control in Field Crops,Agdex 102/620, NSW Agriculture, Sydney.
Hi-Fert, 2000, Fertilisers for cropping (www.wmcf.com.au/advice/cropping/crop-book/nutrient.html).
In, F. and Inder, B. 1997, ‘Long-run relationships between vegetable oilprices’, Australian Journal of Agricultural and Resource Economics, vol.41, no. 4, pp. 455–70.
69Future of canola production

Knopke, P., O’Donnell, V. and Shepherd, A. 2000, Productivity Growth inthe Australian Grains Industry, Report to the Grains Research and Develop-ment Corporation, ABARE, Canberra.
Michael, P. and Carmody, P. 1997, ‘Control of canola pests’, Farmnote,Agriculture Western Australia, Perth (www.agric.wa.gov.au/agency/Pubns/farmnote/1997/f00797.htm).
Miles, M. and McDonald, G. 1997, Guide to the Key Insect Pests of Canola,Agriculture Victoria, Melbourne.
Morris, D. 2000, ‘Canola is a good plant source of Omega3’, CanolaConnection (www.canola-council.org/pubs/om3.pdf).
Norton, R., Kirkegaard, J., Angus, J. and Potter, T. 1999, ‘Canola in rota-tions’, in Salisbury, P.A., Potter, T.D., McDonald, G. and Green, A.G. (eds),Canola in Australia: The First Thirty Years, Organising Committee of the10th International Rapeseed Congress, ...
New South Wales Agriculture 2001, ‘Winter crop gross margin budgets’,Farm business and trade online (www.agric.nsw.gov.au/reader/2207).
OECD (Organisation for Economic Cooperation and Development) 1999a,Agricultural Policies in Emerging and Transition Economies (with newsupplement), vol. 1, Paris.
—— 1999b, OECD Agricultural Outlook 1999–04, Paris.
—— 2000a, OECD Agricultural Outlook 2000-05, Paris.
—— 2000b, Agricultural Policies in Emerging and Transition Economies,vol. 2, Agriculture and Food, Paris.
—— 2000c, ‘Recent policy changes affecting the cereal and oilseeds marketsof OECD and observer countries’, Directorate for Food, Agriculture andFisheries, Committee for Agriculture, AGR/CA/APM/CFS(2000)1, Paris.
—— 2000d, Biotrack database of field trials, Paris (www.olis.oecd.org.biotrack.nsf).
70 ABARE research report 01.6

Oil World 2001, ‘World supply, demand and price forecasts for oilseeds, oilsand meals’, Oil World Weekly, vol. 44, no. 9.
Podbury, T. and Roberts, I. 1999, WTO Agricultural Negotiations: ImportantMarket Access Issues, ABARE Research Report 99.3, Canberra.
Powles, S. undated, ‘Herbicide resistant weeds in WA’, Western AustralianHerbicide Resistance Initiative, University of Western Australia, Perth(wahri.agric.uwa.edu.au/hr.html).
Roberts, I., Podbury, T., Freeman, F., Tielu, A., Vanzetti, D., Andrews, N.,Mélanie, J. and Hinchy, M. 1999, Reforming World Agricultural TradePolicies, ABARE Research Report 99.12, and RIRDC Publications No.99/96, ABARE, Canberra.
Roberts, I., Podbury, T. and Vanzetti, T. 2000, ‘WTO trade reform: main-taining the momentum for liberalisation’, in Outlook 2000, Proceedingsof the National Outlook Conference, Canberra, 29 February – 2 March,vol. 2, Agriculture and Regional Australia, ABARE, Canberra, pp. 83–92.
Serecon Management Consulting and Koch Paul Associates 2001, AnAgronomic and Economic Assessment of Transgenic Canola, ReportPrepared for the Canola Council of Canada, January.
Sutherland, S. 1999, ‘Weed management’, in Salisbury, P.A., Potter, T.D.,McDonald, G. and Green, A.G. (eds), Canola in Australia: The First ThirtyYears, Organising committee of the 10th International Rapeseed Congress.
Turner, S., Barrett, D., Bailey, G., Rodriguez, A. and Sheales, T. 2000,‘Grains: outlook to 2004-05’, in Outlook 2000, Proceedings of the NationalOutlook Conference, Canberra, 29 February – 2 March, vol. 2, Agricultureand Regional Australia, ABARE, Canberra, pp. 241–54.
US Department of Agriculture 1999a, Oil Crops: Situation and OutlookYearbook, Economic Research Service, Washington DC, October.
—— 1999b, ‘An analysis of agenda 2000’, The EU’s CAP: Pressures forChange, WRS-99-2, October.
—— 2000a, Production, supply and distribution database, Washington DC(www.usda.mannlib.cornell.edu/data-sets/international/93002/).
71Future of canola production

——2000b, People’s Republic of China: Oilseeds and Products AnnualReport (part 1), GAIN Report #CH0012, March, Washington DC(www.fas.usda.gov/gainfiles/200003/25637227.pdf).
—— 2000c, Japan: Oilseeds and Products Annual, GAIN Report #JA0050,Washington DC, April (www.fas.usda.gov/gainfiles/200005/25667571.pdf).
—— 2000d, European Union: Oilseeds and Products: The EU OilseedsMarket in 2000 , GAIN Report #E20087, Washington DC, July(www.fas.usda.gov/gainfiles/200007/25698298.pdf).
——20000e, Pakistan: Oilseeds and Products, Annual – Revised 2000, GAINReport #PK0010, Washington DC, March (www.fas.usda.gov/gain-files/200004/25647452.pdf).
US Department of State 2000, ‘Permanent normal trade relations with China:an historic moment for US-China relations’, 19 September, White HouseFact Sheet (www.usinfo.state.gov/regional/ea/uschina).
Vaile, M. 2000, ‘Australia signs big trade deal with China’, Media release,22 May, Department of Foreign Affairs and Trade, Canberra (www.dfat.gov.au/media/releases/trade).
Verheijen, J.A.G. and Jimmink, C.J. 1995, The Oilseeds Complex, RabobankNederland, Food and Agribusiness Research, the Netherlands.
Young, C.E. and Westcott, P.C. 2000, ‘How Decoupled is US AgriculturalSupport for Major Crops?’, American Journal of Agricultural Economics,vol. 82, August, pp. 762–7.
72 ABARE research report 01.6