july 2006 - data.daff.gov.au
TRANSCRIPT

australian fi sheries statistics
july 2006
2005
abare
abar
ew
ww
.aba
reco
nom
ics.
com
© ABARE and FRDC 2006
This work is copyright. The Copyright Act 1968 permits fair dealing for study, research, news reporting, critism or review. Selected passages, tables or diagrams may be repro-duced for such purposes provided acknowledgment of the source is included. Major extraxts or the entire document may not be reproduced by any process without the written permission of the Executive Director, ABARE.
ISSN 1037-6879
ABARE 2006, Australian Fisheries Statistics 2005, Canberra, July.
Australian Bureau of Agricultural and Resouce EconomicsGPO Box 1563 Canberra 2601
Telephone +61 2 6272 2000 Facsimile +61 2 6272 2001Internet www.abareconomics.com
ABARE is a professionally independent government economic research agency.
ABARE project 2983
Fisheries Research and Development CorporationPO Box 222 Deakin West ACT 2000
Telephone +61 2 6285 0400 Facsimile +61 2 6285 4421Internet www.frdc.com.au

i i iaustralian fi sheries statistics 2005
foreword
Australian Fisheries Statistics is designed to meet the needs of the fi shing industry and fi sheries managers, policy makers and researchers. ABARE has been publishing detailed production and trade data in this series since 1991. The estimates of the gross value of production provided in the report are used for a range of purposes — for example, to determine Commonwealth, state and territory fi sheries research funding arrangements each year.
This report contains data on the volume and value of production from state and Common-wealth fi sheries, and on the volume and value of Australian fi sheries trade, by destination, source and product, for the three years to 2004-05. The report also contains a profi le of Commonwealth and state fi sheries and state aquaculture for 2004-05, covering selected species, fi shing method and number of licence holders.
Australian Fisheries Statistics is part of a suite of ABARE publications that provide a comprehensive account of historical trends in, and the outlook for, Australian fi sheries. Australian Commodity Statistics provides a historical series of production and trade statis-tics for fi sheries and a range of other commodities. Australian Commodities includes fore-casts for major fi sheries commodities that are updated each quarter. Detailed analysis of the economic performance of selected fi sheries is proved in the annual Australian Fisheries Surveys Report.
BRIAN S. FISHER
Executive Director
July 2006

iv australian fi sheries statistics 2005
acknowledgments
Stephanie Szakiel, Leanna Tedesco, Peter Gooday, Alistair Peat and David Galeano prepared this report. Assistance from Patrick Hone, Crispian Ashby, Matt Barwick and John Wilson from the Fisheries Research and Development Corporation is also appreci-ated. The assistance of offi cers from state fi sheries departments and the Australian Fish-eries Management Authority, researchers and various industry representatives is gratefully acknowledged. The Australian Bureau of Statistics supplied trade data.
Funding for this report was provided by the Fisheries Research and Development Corpo-ration and the Australian Government Department of Agriculture, Fisheries and Forestry.
Inquiries on Commonwealth and state catch information should be directed to the respective coordinators of fi sheries statistics shown below.

vaustralian fi sheries statistics 2005
New South Wales
David Makin (wild sector)NSW FisheriesPh: +61 2 9527 8556Fax: +61 2 9527 0034
Janine Sakker (aquaculture)NSW FisheriesPh: +61 2 4916 3847Fax: +61 2 4982 1107
Queensland
Lew Williams (wild sector)Queensland Fisheries ServicePh: +61 7 3224 2237Fax: +61 7 3224 2805
Ross Lobegeiger (aquaculture)Bribie Island Aquaculture Research CentrePh: +61 7 3400 2040Fax: +61 7 3408 3535
Victoria
Mark TaylorVictorian Department of Primary IndustriesPh: +61 3 5561 9964
South Australia
Angelo Tsolos (wild sector)South Australian Research and Develop-ment Institute (SARDI)Ph: +61 8 8200 2414Fax: +61 8 8200 2415
Ian Nightingale and Clare Venturi (aquaculture)Primary Industries Resources South Australia (PIRSA)Ph: +61 8 8226 0266Fax: +61 8 8226 0330
Western Australia
Mark CliffWestern Australian Department of FisheriesPh: +61 8 9246 8444Fax: +61 8 9447 3062
Tasmania
Denise GarciaMarine Resources DivisionDepartment of Primary Industries, Water and EnvironmentPh: +61 3 6233 6462Fax: +61 3 6233 3198
Northern Territory
Steve WilmoreDepartment of Primary Industry, Fisheries and Mines (DPIFM)Ph: +61 8 8999 2370Fax: +61 8 899 2065
Commonwealth
Thim Skousen and John GarveyAustralian Fisheries Management Authority (AFMA)Ph: +61 2 6272 5653 and +61 2 6272 5188Fax: +61 2 6272 5036
enquiries

viiaustralian fi sheries statistics 2005
contents
production and trade: key featuresgross value of production – Australia 1
gross value of production – state and territory fi sheries 2
gross value of production – Commonwealth fi sheries 4
gross value of production – aquaculture 5
exports of fi sheries products 5
exports, by destination 6
exports, by state 7
imports of fi sheries products 8
imports, by source 8
employment 9
recreational fi shing 12
references 14
fi sheries in Australia2005 profi le 15

vii i australian fi sheries statistics 2005
statistical tablesproduction 1 gross value of fi sheries production – Australia 22 2 wild caught fi sheries production 23 3 fi sheries production in 2002-03, by state – Australia 24 4 fi sheries production in 2003-04, by state – Australia 25 5 fi sheries production in 2004-05, by state – Australia 26 6 fi sheries production in 2004-05, by location of catch – Australia 27 7 fi sheries production – New South Wales 28 8 fi sheries production – Victoria 29 9 fi sheries production – Queensland 3010 fi sheries production – Western Australia 3111 fi sheries production – South Australia 3212 fi sheries production – Tasmania 3313 fi sheries production – Northern Territory 3414 fi sheries production – Commonwealth 3515 aquaculture production in 2002-03, by state – Australia 3816 aquaculture production in 2003-04, by state – Australia 3917 aquaculture production in 2004-05, by state – Australia 40
exports18 exports of fi sheries products – Australia 4119 exports of fi sh – Australia 4220 exports of crustaceans and molluscs – Australia 4321 exports of edible fi sh, by destination – Australia 4422 exports of crustaceans, by destination – Australia 4623 exports of molluscs, by destination – Australia 4824 exports of fi sheries products, by destination – Australia 4925 exports of seafood to selected countries, by product – Australia 5026 seafood exports in 2002-03, by state – Australia 5227 seafood exports in 2003-04, by state – Australia 5328 seafood exports in 2004-05, by state – Australia 54
imports29 imports of fi sheries products – Australia 5530 imports of fi sh – Australia 5631 imports of crustaceans and molluscs – Australia 5732 imports of edible fi sh, by source – Australia 5833 imports of fresh, chilled or frozen fi sh, by source – Australia 6034 imports of dried, salted or smoked fi sh, by source – Australia 6235 imports of canned fi sh products, by source – Australia 6336 imports of crustaceans and molluscs, by source – Australia 6437 imports of fi sheries products, by source – Australia 6638 seafood imports from selected countries, by product – Australia 67

ixaustralian fi sheries statistics 2005
defi nitions and explanations
defi nitions
Aquaculture production is the liveweight quantity of product produced and marketed by aquaculturists.
Aquaculture value is the assessed value received by agriculturists on the basis of an at ‘farm gate’ equivalent, for product marketed.
Export quantity data are supplied by the Australian Bureau of Statistics on the basis of the net product weight exported.
Export value data are supplied by the Australian Bureau of Statistics on the basis of free on board value.
Import quantity data are supplied by the Australian Bureau of Statistics on the basis of the net product weight imported.
Import value data are supplied by the Australian Bureau of Statistics on the basis of product cost plus insurance and freight.
Production quantity is a measure of the quantity of fi sh product landed, by fi shery, usually on the basis of catch records.
Production value is the assessed value at the point of landing for the quantity produced and excludes transport and marketing costs.
Products consist of fi sheries products marketed for human consumption plus nonedible fi sh-eries products.
Seafood is any fi sh or other aquatic plant or animal intended for human consumption; it excludes nonedible fi sheries products.
southern bluefi n tunaSouthern bluefi n tuna sold from farms in South Australia are reported at their full market value. However, the input value of those tuna is also included as an output from the Commonwealth southern bluefi n tuna fi shery. To avoid double counting, the input value is netted out of Australian totals.
‘reals’ and rounding ‘Real’ 2004-05 dollars refers to the conversion of nominal dollar values to take account of inflation. Small discrepancies in totals are generally caused by the rounding components. A dash (–) is used to denote a nil or negligible amount.
abbreviations and symbolskg kilogramt tonnekt kilotonne$ dollar (Australian)$’000 thousand dollars (Australia)
$m million dollars (Australian)fob free on boardAFZ Australian Fishing Zonena not availablenei note elsewhere included

1australian fi sheries statistics 2005
production and trade
production and trade
key features
stephanie szakiel
> The volume of Australian fi sheries production increased by 5 per cent in 2004-05 to 287 000 tonnes, while the value fi sheries production fell by almost 6 per cent to $2.05 billion.
> The value of Australian exports of fi sheries products fell by 7 per cent in 2004-05 to $1.54 billion.
> The value of Australian imports of fi sheries products increased by 6 per cent in 2004-05 to $1.17 billion.
gross value of production – Australia [tables 1–6]
Although Australian fi sheries production rose by 5 per cent in 2004-05, with falling unit values for a number of major species, the gross value of production fell by 6 per cent (or $120 million) to $2.05 billion. The gross value of production from state and territory wild catch fi sheries rose by $4.1 million to $1.15 billion in 2004-05. The gross value of produc-tion in both state and territory aquaculture fi sh-eries and Commonwealth wild catch fi sheries fell in 2004-05. The value of production from state and territory aquaculture fi sheries fell from $713 million to $611 million in 2004-05, while in Commonwealth fi sheries it fell from $342 million to $323 million.
In 2004-05, rock lobster remained the highest value individual catch, while prawns and tuna experienced the largest fall in value of the major species (fi gure A). The value of scallop and abalone production increased in 2004-05.
Australian dollarAfter an initial depreciation against the US dollar in the fi rst quarter, the Australian dollar continued to appreciate over 2004-05 to end the year 1.5 per cent above the June 2004 quarter. Against the Japanese yen, the Australian dollar appreciated by 6 per cent.
Avalue of Australian fisheries products
21 3$m 4 5
2004-05
2004-05
2003-04
other fisheriesproducts
pearls
oysters
scallops
abalone
rock lobster
prawns
other fish
tuna

2 australian fi sheries statistics 2005
production and trade
Australia is a small producer and exporter of fi sh onto the world market so export prices received by Australian producers are set in world markets. Other things being equal, an appre-ciating Australian dollar results in lower export prices in Australian dollar terms. This explains a large part of the fall in the unit value of the fi sh-eries products in 2004-05.
aquaculture’s shareIn 2004-05, the value of aquaculture production fell by 14 per cent to $611 million, driven by a fall in the value of southern bluefi n tuna production. Aquaculture production is an important compo-nent of Australian fi sheries production. The value of aquaculture production as a percentage of fi sheries production increased steadily between
1993-94 and 2003-04 (fi gure B). In 2004-05, however, aquaculture’s share fell to 30 per cent of the value of Australian fi sheries production.
gross value of production – state and territory fi sheries [tables 7–13]
Western Australia had the largest gross value of production and accounted for 26 per cent of the total value of Australian fi sheries production in 2004-05 (fi gures C, D). South Australia has the second largest gross value of production, accounting for 18 per cent of the total value of fi sheries production in 2004-05.
New South Wales [table 7]
The gross value of fi sheries production in New South Wales fell by $8.2 million to $131 million in 2004-05. The gross value of production of the wild caught sector fell from $89.7 million in 2003-04 to $83.6 million in 2004-05, caused by a fall in the level of wild caught crustacean production and falling average crustacean prices. The value of wild
B aquaculture’s share of total fisheries production
30
25
20
15
%
2004-05
2001-02
1998-99
1995-96
C value of Australian fisheries products, by state, 2004-05
Common-wealth
NorthernTerritoty
TasmaniaSouthAustralia
WesternAustralia
Queens-land
VictoriaNew SouthWales
$m
100
200
300
400
500

3australian fi sheries statistics 2005
production and trade
caught crustacean production fell for the second year in a row, from $34.7 million (2465 tonnes) in 2003-04 to $25.6 million (1925 tonnes) in 2004-05.
The gross value of aquaculture production fell from $49.6 million to $47.6 million in 2004-05, driven predominantly by a 6 per cent fall in the value of oyster production from $37.9 million to $35.8 million.
Victoria [table 8]
The total value of fi sheries production in Victoria increased from $95.9 million in 2003-04 to $109 million in 2004-05. The increase in production value was mainly caused by an increase in the value of the wild caught sector from $72.1 million to $85.1 million in 2004-05. Abalone continued to be the most valuable wild caught species, with a total production value increasing from $46.5 million in 2003-04 to $60.2 million in 2004-05, driven predominantly by increasing prices.
The value of aquaculture production remained constant at just under $24 million in 2004-05.
Queensland [table 9]
The gross value of fi sheries production in Queensland fell from $297 million in 2003-04 to $252 million in 2004-05. This fall was driven by a reduction in the value of wild caught production from $229 million to $190 million in 2004-05. Wild caught prawn production fell by $18.9 million and wild fi sh production fell by $20.6 million. Compensating for the fall in prawn and fi nfi sh production, rising production and increasing prices in the wild caught scallop sector drove a 58 per cent increase in the value of scallop production to $15.7 million.
The gross value of aquaculture production fell by $6.0 million in 2004-05 to $61.7 million. The value of aquaculture prawn production fell by 7.9 million to $45.4 million.
Western Australia [table 10]
The gross value of fi sheries production in Western Australia increased from $530 million in 2003-04 to almost $540 million in 2004-05. This increase was driven predominantly by an increase in the value of scallop production from $8.3 million to $24.5 million in 2004-05. This increase returned the value of production to levels reported in 2002-03.
The total value of aquaculture production fell by $1.1 million to $128 million, driven by falling average fi sh prices and a fall in the quantity of mussels produced.
D value of Australian fisheries production, by location
2004-05$2.05 billion
$2.15billion1995-96
Commonwealth 19%
Commonwealth 15%
NorthernTerritory 4%
Northern Territory 3%
Tasmania 11%
Tasmania 14%
South Australia 11%
South Australia 18%
Western Australia 26%
WesternAustralia 29%
Queensland15%
Queensland12%
Victoria 5%
Victoria 5%
NSW 6%
NSW 6%
in 2004-05 dollars

4 australian fi sheries statistics 2005
production and trade
South Australia [table 11]
The gross value of fi sheries production in South Australia fell by $86.6 million to $375 million in 2004-05 caused mainly by a fall in the value of farmed southern bluefi n tuna. The value of wild caught production increased from $183 million in 2003-04 to $188 million in 2004-05, driven predominately by an increase in the value of Australian sardine production from $22.5 million to $28.5 million in 2004-05.
The value of aquaculture production fell by $92.3 million from $279 million in 2003-04 to $187 million in 2004-05, driven by a fall in the value and volume of southern bluefi n tuna production. As the majority of southern bluefi n tuna is exported to Japan with prices denominated in Japanese yen, a depreciation in the Japanese yen — as well as a fall in production volume — drove the dramatic fall in the value of production. The volume of southern bluefi n tuna production fell by 2100 tonnes to 7458 tonnes in 2004-05. Fluctua-tions in fi nancial year production quantities often refl ect a large amount of activity around the June–July transition period. That is, fi sh grown during the 2004-05 fi nancial year that are not harvested until July 2005 will be included in 2005-06 production fi gures.
Tasmania [table 12]
The gross value of Tasmanian fi sheries production rose by $18.9 million to $299 million in 2004-05. Wild caught production increased from $144 million in 2003-04 to $164 million in 2004-05. This increase was driven largely by a $16.7 million increase in the value of abalone production.
The value of aquaculture production fell by $1.0 million to $135 million in 2004-05, driven by a slight fall in production from 17 700 tonnes to 17 500 tonnes.
Northern Territory [table 13]
Fishery production fi gures for the Northern Territory were not available at the time of publi-cation. Figures from 2003-04 have been used as estimates for 2004-05.
gross value of production – Commonwealth fi sheries [table 14]
major trendsThe value of production from Commonwealth fi sheries fell from $342 million in 2003-04 to $323 million in 2004-05. This fall was partially driven by a fall in world prices and an appreci-ating Australian dollar, as well as an 8 per cent fall in the volume of production. The real value of production from Commonwealth fi sheries has been on a downward trend since 2000-01 (fi gure E).
Despite a fall in both the value and volume of production, the northern prawn fi shery continued to be Australia’s most valuable Commonwealth managed fi shery. The gross value of production was $65.0 million in 2004-05, down 12 per cent from $74.0 million in 2003-04. The total
volume of production fell by 18 per cent to 5124 tonnes in 2004-05.
E value of Commonwealth fisheries production
500
400
300
$m2004-05
2004-05
2001-02
1998-99
1995-96

5australian fi sheries statistics 2005
production and trade
The Commonwealth trawl sector (previously the south east trawl fi shery) was the next most valuable fi shery, earning $58.9 million. The gross value of production increased by 8 per cent over 2004-05.
The gross value of production in the eastern tuna and billfi sh fi shery fell from $46.8 million in 2003-04 to $42.5 million in 2004-05. The western tuna and billfi sh fi shery also experienced a fall in the gross value of production from $8.25 million in 2003-04 to $3.58 million in 2004-05. Production levels in the eastern tuna and billfi sh fi shery fell by 706 tonnes to 6261 tonnes in 2004-05. In the western tuna and billfi sh fi shery, the volume of production fell by 60 per cent to 495 tonnes, driven by falling production of most species including billfi sh, yellowfi n and bigeye.
gross value of production – aquaculture [tables 15–17]
After reaching a peak in 1999-2000 of $806 million (in 2004-05 dollars) the real value of Australian aquaculture production has been declining at an average annual rate of 2.6 per cent (fi gure F). In 2004-05, the gross value of Australian aquaculture was $611 million. Reduced levels of production, falling world prices and an appreciating Australian dollar were the main drivers of this fall in produc-tion value.
major trendsThe value of aquaculture production fell in all Australian states and territories, except Victoria, in 2004-05. As the smallest aquaculture pro-ducing state by value, Victorian aquaculture production rose by 1 per cent to $23.9 million in 2004-05. The gross value of production for farmed southern bluefi n tuna from South Australia fell by $103 million. This fall in production value was driven by a fall in production volume and a weakening Japanese yen.
exports of fi sheries products [tables 18–28]
The total value of Australian exports of fi sheries products declined each year from 2000-01 to 2004-05 (fi gure G).
In 2004-05, rock lobster continued to be the most valuable fi sheries product export, followed by pearls and abalone (fi gure H).
export value, by sector [table 18]
In 2004-05, Australia’s total exports of fi sheries products were valued at $1.54 billion. Around 80 per cent of total exports were comprised of edible fi sheries products such as rock lobster, tuna, abalone and prawns. The remaining 20 per cent of exports were non edible fi sheries
F value of Australian aquaculture production
600
800
400
200
$m2004-05
2004-05
2001-02
1998-99
1995-96
G value of Australian fisheries production and exports
$m
500
1000
1500
2000
2500
2004-05
1992-93
2004-05
2001-02
1998-99
1995-96
exportstotal fisheriesaquaculture

6 australian fi sheries statistics 2005
production and trade
products such as pearls, fi sh meal and marine fats and oils. By value, pearls are the dominant nonedible export product (table 18).
The value of total fi sheries exports fell by $110 million or 7 per cent in 2004-05. Exports of edible fi sh fell by 26 per cent, driven mainly by a $109 million fall in the value of tuna exports. The value of shellfi sh (crustacean and mollusc) exports rose by $22.3 million to $932 million in 2004-05. This increase came mainly from a $25.5 million increase in the value of abalone exports, a $12.7 million increase in the value of rock lobster exports and a compensating $17.3 million fall in the value of other, or unidentifi ed shellfi sh exports. Nonedible exports fell by $26.9 million, driven by a $19.4 million (6 per cent) fall in the value of pearl exports.
value of exports of edible fi sheries products [table 19]
The principal edible fi sheries exports in 2004-05 continued to be rock lobster ($440 million), abalone ($263 million), prawns ($163 million) and tuna ($166 million). Tuna exports dominate fi nfi sh products, constituting 54 per cent of the fi nfi sh export value.
In 2004-05, the value of tuna exports fell by $109 million or 40 per cent to $166 million. Southern bluefi n tuna exports fell from $243 million in 2003-04 to $140 million in 2004-05 (fresh and frozen exports fell by $51 million and $52 million respectively). This fall in value was the result of a combination of a continuing fall in export price and a 1700 tonne fall in the quantity of fresh product exported and a 390 tonne fall in frozen exports.
After declining by $7.9 million to $4.2 million in 2003-04, the value of salmon exports rose to $10.8 million in 2004-05. These fl uctuations were driven by changes in the volume of exports to Japan.
exports, by destination [tables 21–25]
main export markets for seafoodJapan and Hong Kong are the main export markets for Australian edible fi sheries exports. In 2004-05, 32 per cent of edible fi sheries prod-ucts were exported to Japan ($380 million) and 30 per cent were exported to Hong Kong ($359 million). Over the past three years, the value of exports to Japan have been decreasing signifi -cantly (table 24, fi gure I).
In 2004-05, the total value of seafood exports to Japan fell by 22 per cent or $109 million from $489 million in 2003-04. The majority of edible fi nfi sh exported to Japan was tuna products valued at $158 million, down 41 per cent from $267 million in 2003-04 (table 25). Exports of
I value of exported edible fisheries products, by destination
$m
200
400
600
2004-05
Rest of world
ChineseTaipei
ChinaUnitedStates
Hong Kong, China
Japan
2004-052003-042002-03
H value of Australian exports, by product, 2004-05
$m
100
200
300
400
pearlsscallops
abaloneprawnsrock
lobster tuna

7australian fi sheries statistics 2005
production and trade
southern bluefi n tuna fell by $103 million or 43 per cent from 2003-04 levels, accounting for most of the fall in Australian tuna exports to Japan (fi gure J). Increased competition from Mediterra-nean northern bluefi n tuna and a depreciating Japanese yen drove the fall in export value. Other major exports to Japan were rock lobster and prawns, each representing 19 per cent, by value, of Australian exports to Japan.
The main products exported to Hong Kong were rock lobster ($149 million) and abalone ($147 million) – together they account for over 80 per cent of edible fi sheries products exported to Hong Kong. Rock lobster was also the major fi sheries product exported to the United States, valued at almost $100 million, accounting for 78 per cent of Australian exports to the United States by value.
Primary export markets for Australian fi nfi sh products are Japan (tuna and salmon) and Thailand (whiting). Japan bought over 97 per cent of all tuna exports (excluding canned) in 2004-05 and over 76 per cent of salmon exports (excluding canned). Over 63 per cent of whiting exports were exported to Thailand. The majority of canned fi nfi sh exports went to New Zealand, which accounted for 92 per cent of all canned tuna exports in 2004-05 and 96 per cent of all canned salmon exports (table 21).
Hong Kong and Japan continued to be the primary markets for Australia’s exports of crustacean and mollusc products in 2004-05, valued at $337 million and $201 million respectively (table 25). Together they account for 58 per cent of all Australian shellfi sh (comprised of crustaceans and molluscs) exports (table 20). The majority of shellfi sh exports to Hong Kong were comprised of rock lobster (44 per cent) and abalone (44 per cent). The United States and Chinese Taipei bought a further 22 per cent or $170 million of total shellfi sh exports in 2004-05.
main markets for nonedible fi sheries productsThe principal markets for nonedible fi sheries products in 2004-05 were Hong Kong ($137 million), Japan ($60 million) and the United States ($28 million). Other markets for noned-ible products included New Zealand, Switzerland and the United Kingdom (table 24).
exports, by state [table 28]
By value, South Australia and Queensland are the main exporters of fi nfi sh, while South Australia and Western Australia are the main exporters of crustaceans. Of the value of total edible fi sheries products exported, Western Australia provided 29 per cent; South Australia provided 24 per cent and Queensland provided 19 per cent in 2004-05 (table 28).
J value of Australian southern bluefin tuna exports to Japan
$m
50
100
150
200
2004-05
200520042003
FrozenFresh
8 australian fi sheries statistics 2005
production and trade
imports of fi sheries products [tables 29–38]
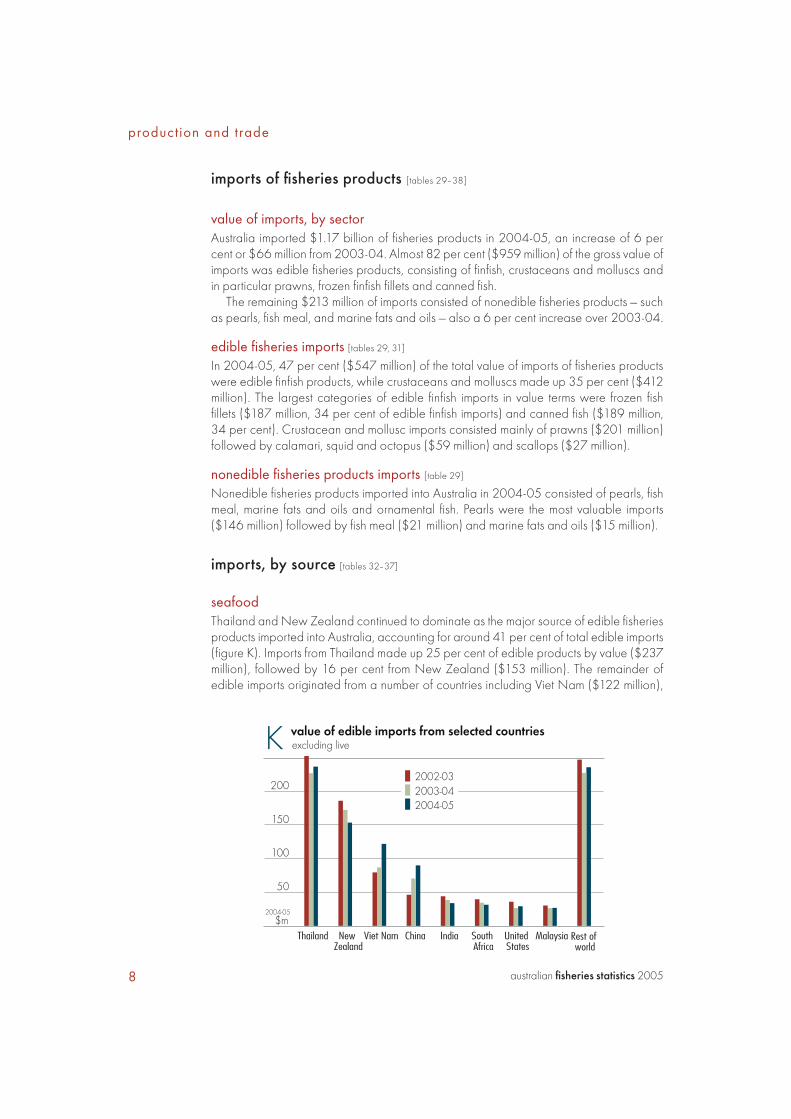
value of imports, by sectorAustralia imported $1.17 billion of fi sheries products in 2004-05, an increase of 6 per cent or $66 million from 2003-04. Almost 82 per cent ($959 million) of the gross value of imports was edible fi sheries products, consisting of fi nfi sh, crustaceans and molluscs and in particular prawns, frozen fi nfi sh fi llets and canned fi sh.
The remaining $213 million of imports consisted of nonedible fi sheries products — such as pearls, fi sh meal, and marine fats and oils — also a 6 per cent increase over 2003-04.
edible fi sheries imports [tables 29, 31]
In 2004-05, 47 per cent ($547 million) of the total value of imports of fi sheries products were edible fi nfi sh products, while crustaceans and molluscs made up 35 per cent ($412 million). The largest categories of edible fi nfi sh imports in value terms were frozen fi sh fi llets ($187 million, 34 per cent of edible fi nfi sh imports) and canned fi sh ($189 million, 34 per cent). Crustacean and mollusc imports consisted mainly of prawns ($201 million) followed by calamari, squid and octopus ($59 million) and scallops ($27 million).
nonedible fi sheries products imports [table 29]
Nonedible fi sheries products imported into Australia in 2004-05 consisted of pearls, fi sh meal, marine fats and oils and ornamental fi sh. Pearls were the most valuable imports ($146 million) followed by fi sh meal ($21 million) and marine fats and oils ($15 million).
imports, by source [tables 32–37]
seafoodThailand and New Zealand continued to dominate as the major source of edible fi sheries products imported into Australia, accounting for around 41 per cent of total edible imports (fi gure K). Imports from Thailand made up 25 per cent of edible products by value ($237 million), followed by 16 per cent from New Zealand ($153 million). The remainder of edible imports originated from a number of countries including Viet Nam ($122 million),
K value of edible imports from selected countries
$m
100
50
150
200
2004-05
Rest of world
2004-052003-042002-03
excluding live
MalaysiaUnitedStates
SouthAfrica
IndiaChinaViet NamNew Zealand
Thailand

9australian fi sheries statistics 2005
production and trade
China ($90 million), India ($34 million) and South Africa ($32 million) (table 37).
Over the three years 2002-03 to 2004-05, the value of edible fi sheries imports from Viet Nam and China has increased by approxi-mately $46 million each. This represents a 60 per cent increase from Viet Nam and a 103 per cent increase from China (table 37). The main imported products from Viet Nam are frozen prawns (predominantly vannamei prawns) valued at $70 million in 2004-05 and frozen fi sh fi llets (predominantly cat fi sh) valued at $38 million (fi gure L).
In 2004-05, the main products imported from China were frozen prawns ($24 million) — predominantly Vannamei prawns — squid ($23 million) and scallops ($15 million) (fi gure M). The real value of frozen prawn imports from China fell from $27 million in 2003-04 to $24 million in 2004-05 (measured in 2004-05 dollars). However, this fall in value occurred as the quantity of frozen prawn imports rose by 151 tonnes to 4024 tonnes.
In 2004-05, over 59 per cent ($112 million) of Australia’s imports of canned fi sh and 18 per cent ($6 million) of canned crustacean and mollusc imports were sourced from Thailand. New Zealand was the source of almost 37 per cent of Australian imports of fresh, chilled or frozen fi sh products ($89 million — table 33), 20 per cent of fresh, chilled and frozen molluscs ($19 million — table 36) and 31 per cent of canned crustacean and mollusc imports ($10 million — table 36). In addition, 24 per cent of dried and salted fi sh were imported from Norway ($2 million — table 34), while Denmark was the source of almost 64 per cent of Australia’s smoked fi sh imports ($17 million — table 34).
nonedible fi sheries productsAustralia’s imports of nonedible fi sheries products were sourced from a wide range of countries. In 2004-05, around 24 per cent of all nonedible fi sheries products were sourced from four countries — Peru ($19 million), New Zealand ($11 million), Indonesia ($11 million) and the United States ($10 million).
employment
Historically, employment data for the fi shing industry have been collected by the Austra-lian Bureau of Statistics (ABS). The data collected by the ABS are gathered from the population census survey and thus are collected every fi ve years. The next census will be collected in 2006 but the data will not be available until 2007. However, the Fisheries Research and Development Corporation has stated that ‘data collected by Australian
L value of imports of frozen prawns and frozen finfish fillets from Viet Nam
$m
20
40
60
2004-05
2004-052003-042002-032001-02
finfish filletsprawns
M value of frozen prawn, squid and scallop imports from China
$m
5
10
15
20
25
2004-05
2004-052003-042002-032001-02
scallops(frozen)
prawns(frozen)
squid (frozen, dried, salted, in brine)

10 australian fi sheries statistics 2005
production and trade
A estimated employment in the Australian fi shing industry – Australian Bureau of Statistics as at August 2001
North- Australian other New South Queens- South Western Tas- ern Capital terri- Aus- Wales Victoria land Australia Australia mania Territory Territory tories tralia
no. no. no. no. no. no. no. no. no. no.
Marine fi shing 331 125 390 237 245 224 59 0 0 1 611
Rock lobster fi shing 54 145 70 221 722 242 5 0 0 1 459
Prawn fi shing 223 6 472 109 150 0 80 0 0 1 040
Finfi sh trawling 93 26 90 40 27 9 3 0 0 288
Squid jigging 3 6 0 3 0 0 0 0 0 12
Line fi shing 12 6 31 26 10 3 3 0 0 91
Aquaculture 926 320 592 764 601 846 166 6 0 4 221
Fish wholesaling 1 333 856 1 473 583 742 455 79 19 0 5 540
Seafood processing 303 269 377 457 239 545 20 3 0 2 213
Commercial fi shing, undefi ned 724 311 816 459 493 249 94 6 0 3 152
B estimated employment in the Australian fi shing industry – ABARE as at January 2005
number of employees noteswild catchCommonwealth 1 984 Average number of crew multiplied by estimated number of
active vessels in Commonwealth fi sheries. This information does not include offshore employees. Vessels known to oper-ate in both Commonwealth and state waters are not included.
Source: ABARE
New South Wales 2 205 The number of commercially licensed fi shers. It is uncertain how many of these fi shers are full time versus part time employees.
Source: NSW fi sheries dept.
Victoria na Information not available.
Queensland 2 868 Full time labor equivalents. Source: QDPI.
South Australia na Information not available.
Western Australia 3 299 Estimated total number of crew including skipper. Source: WA Department of Fisheries.
Tasmania 3 892 It is uncertain how many of these fi shers are full time versus part time employees.
Source: Tasmanian DPIWE.
Northern Territory 481 It is uncertain how many of these fi shers are full time versus part time employees. Information available for the mud crab fi shery did not distinguish between fi shers and processing employees.
Source: NT DBIRD (2004).
continued …

11australian fi sheries statistics 2005
production and trade
Bureau of Statistics is not disaggregated in suffi cient detail to be very useful, and tends to underrecord employees by allocating them to other industries such as transport and gener-alized food processing’ (FRDC 2004). While information on the processing industry is collected annually by the ABS from the manufacturing census, the ABS has been unable to publish these data since 2001-02 because of methodological problems (ABS, personal communication, December 2004).
The most recently available ABS employment data for the Australian fi shing industry is shown in table A.
B estimated employment in the Australian fi shing industry – ABARE as at January 2005 continued
number of employees notes
aquacultureNew South Wales na Information not available.
Victoria 334 This includes 194 permanent and 150 casual employees. Source: Victorian Aquaculture Information Bulletin.
Queensland 612 Full time labor equivalents. Source: Queensland Report to Farmers 2002/03.
South Australia 1 614 Full time labor equivalents. Source: PIRSA.
Western Australia na Information not available.
Tasmania 676 This includes 472 permanent and 204 casual employees. Source: DPIWE.
Northern Territory 297 This includes 24 permanent and 8 casual employees working on barramundi farms; 16 permanent and 7 full time labor equivalent employees working on prawn farms; and 242 employees involved in spat collection, processing, marketing and trading of NT pearls.
Source: NT DBIRD (2004).
processing (FT – full time; PT – part time)*
New South Wales 125 FT ABARE carried out a survey of seafood processors across 176 PT Australia. Of the 197 businesses found in the yellow pages, Victoria 82 FT were contacted and found to be ineligible (that is, not or no 210 PT longer a seafood processor) and a further 36 businesses wereQueensland 113 FT unable to be contacted. 302 PT
South Australia 165 FT 174 PT
Western Australia 125 FT 627 PT
Tasmania 176 FT 419 PT
Northern Territory na There were no seafood processing businesses listed in the yellow pages for the Northern Territory.
* Full time labor equivalent — for example, two people employed half time is equivalent to one person employed full time.

12 australian fi sheries statistics 2005
production and trade
To provide additional information on employment, ABARE has collected available data from its fi shery survey data for the Commonwealth fi sheries and from the states and Northern Territory, where available (table B). To obtain information on employment in the seafood processing sector, ABARE carried out a survey of the sector in January 2005. This information is presented in table B.
The differences in defi nitions of employment between the states and sectors mean that the total number of employees cannot be estimated. However, it appears that estimates for employment in the Australian fi sheries industry gathered by ABARE are larger than those given by the ABS in August 2001. In part, this may refl ect an increase in activity over the four years since the last census.
recreational fi shing
AustraliaThe recreational fi shing sector of the fi shing industry is larger and more widely dispersed than in any other natural resource industry that supports a prominent commercial sector (FRDC 2004).
The large number of participants in this sport is increasingly leading to substantial catches being taken by the recreational fi shing sector. In 2000-01, the National Recre-ational and Indigenous Fishing Survey was commissioned. Commonwealth and state agencies carried out the survey in the twelve months prior to May 2001 (Henry and Lyle 2003). This survey used telephone and diary survey methods to estimate the number of recreational fi shers in each state and the extent of their activities. Data collected included catch levels, fi shing mode and location, and expenditure data at a state level.
From this survey, it was estimated that 3.36 million people across Australia participated in recreational fi shing over the twelve months to May 2000. Fishing participation was dominated by males, with a participation rate twice that of females. The greatest number of fi shers was in the 30–44 age group, though participation rates were highest among children in the 5–14 age group. The predominant method of fi shing across all states and territories was line fi shing, while the majority of fi shing events occurred in either estuarine or coastal waters.
Estimated attributable expenditure on recreational fi shing by state is shown in table C. This expenditure includes money spent during the survey period on both directly related fi shing items, such as bait and boat hire, as well as indirect expense items such as travel and accommodation.
Recently, debate has increased on the allo-cation of fi shery resources between various user groups, especially commercial and recreational fi shers. Economic valuations of each sector can assist this allocation process. However, two things should be noted about the estimates provided in this report. First, gross value of production is not a good proxy for an economic assessment of the economic value of commercial fi shing, nor is recreational fi shing expenditure a good proxy for an economic assessment of the economic value of recreational fi shing. Second, gross value of produc-tion is not comparable to estimates of recreational
C recreational fi shing, attributable expenditure, by state
total per fi sher
$m $
New South Wales 554 555Victoria 396 721Queensland 320 407South Australia 148 452Western Australia 338 706Tasmania 52 416Northern Territory 27 608
Source: Henry and Lyle (2003).

13australian fi sheries statistics 2005
production and trade
fi shing expenditure. For further information on economic valuation techniques and resource allocation, see Hundloe (2002) and Galeano et al. (2004). Expenditure data on recre-ational fi shing provide an indication of the level of recreational fi shing activity in Australia.
Major recreational catch species for each state are shown in fi gure N (Henry and Lyle 2003). While for New South Wales, Victoria, South Australia and the Northern Territory fi nfi sh species were of greatest importance to recreational fi shers, in Queensland, Western Australia and Tasmania, crustaceans and molluscs were a greater proportion of the recre-ational harvest.
N estimated recreational catches in Australia, 1999-2000
New South Wales
whiting 394t
bream 729t
tuna/bonito 844t european carp 877t
flathead 887t
Victoria
redfin 237t
australian salmon 844t
pink snapper 332t
european carp 246t
flathead 597t
Queensland
bream 394t
mud crab 729t
other emperors 785t
red emperor 908t
mackerals 1161t
South Australia
pink snapper 371t
blue swimmer crab 390t
squid/cuttlefish423t
australian salmon 372t
king george whiting607t
mulloway/jewfish 360t
mackerels 360t
blue swimmer crab 493t
australian herring 523t
dhufish 578t
TasmaniaWestern Australiaabalone 52t
australian salmon 111t
trout/salmon 157t
lobsters 73t flathead 361t
Northern Territory
mackerels 139t
mulloway/jewfish 157t
barramundi 368t
sea perch/snappers 145t
mud crab 66t

14 australian fi sheries statistics 2005
production and trade
A recreational fi shing licence is required for all recreational fi shing in New South Wales. Victoria introduced an all-water recreational fi shing licence in 1999; however, there are a number of categories entitling an exemption to holding a licence. In Western Australia, recreational fi shing licences are required for abalone, rock lobster, marron, net fi shing and freshwater angling. Size and bag limits also apply for the majority of fi sh species caught. A recreational fi shing licence is necessary in Tasmania for inland fi shing, and for the collection of abalone and rock lobster. Seasonal closures and area and gear restric-tions are used for many of the larger recreational fi sheries such as rock lobster, giant crab, abalone and scallops. Queensland, South Australia and the Northern Territory do not
require recreational fi shing licences. South Australia uses effort controls such as size limits, gear restrictions and area closures to regulate recreational catch, while the Northern Territory has fi sh possession limits for a number of species.
The Northern Territory and all states expect Tasmania undertake or have under-taken a number of recreational fi shing surveys, based either on species or on indi-vidual fi sheries. Details of these surveys and recreational fi shing in general can be found on the state/territory web sites listed in box 1. In particular Queensland has made available on their web site an interactive database (the Coastal Habitat Resources Information System or CHRIS) containing information on recreational species caught in Queensland.
references
DBIRD (Northern Territory Department of Business, Industry and Resource Development) 2004, Fishery Status Reports 2003, Fishery Report No. 78, Fisheries Group, Darwin, October.
Dominion 2003, Identifying the Recreational Fishing Expenditure of Sydney’s Recreational Fishers and its Economic and Social Importance in Regional Communities of New South Wales, A report to the Recreational Trust Fund, NSW Department of Fisheries, November.
FRDC (Fisheries Research and Development Corporation) 2004, Annual Report 2003-04, Canberra.
Galeano, D., Langenkamp, D., Levantis, C., Shafron, W. and Redmond, I. 2004, Economic Value of Charter and Recreational Fishing in Australia’s Eastern Tuna and Billfi sh Fishery, ABARE eReport 04.10 Prepared for the Fisheries Resources Research Fund, Canberra, July.
Henry, G. and Lyle, J. (eds) 2003, The National Recreational and Indigenous Fishing Survey, Australian Government Department of Agriculture, Fisheries and Forestry, Canberra.
Hall, K.G. 2002, Lake Mokoan Fisheries Assessments, Marine and Freshwater Institute Freshwater Fisheries Report no. 02/1, Marine and Freshwater Resources Institute, Snobs Creek.
Hundloe, T. 2002, Valuing Fisheries: An Economic Framework, University of Queensland Press, Brisbane.
box 1: surveys and recreational fi shing web sites
New South Wales www.nsw.fi sh.gov.au
Victoria www.dpi.vic.gov.au
Queensland www.dpi.qld.gov.au
South Australia www.pir.sa.gov.au
Western Australia www.fi sh.wa.gov.au
Tasmania www.dpiwe.tas.gov.au
Northern Territory www.fi sheries.nt.gov.au

15australian fi sheries statistics 2005
profi le
fi sheries in Australia
2005 profi le
Commonwealth main fi shing fi shery area species method number
Northern prawn Gulf of Carpentaria Banana, tiger, Otter trawling 83 vessels from Cape York to endeavour and Cape Londonderry king prawn
Torres Strait Torres Strait Prawn, rock Otter trawl, troll 415 rock lobster waters lobster, Spanish and dive 258 mackerel mackerel, pearl 125 pearl shell shell, trochus 77 prawn shell, and reef fi sh 179 sea cucumber 110 trochus 101 crab 239 line 151 net
South east trawl Commonwealth Mixed fi sh species Otter trawl and 118 vessels waters from particularly Danish seine Barrenjoey Point orange roughy, ling, NSW, around blue grenadier, Tasmania to fl athead, and Cape Jervis SA warehou
Gillnet, Hook and Commonwealth Mixed fi sh species Demersal gillnet, 116 vesselsTrap Fishery waters off south particularly pink demersal longline, Queensland, NSW, ling, blueeye dropline, trotline, Victoria, Tasmania trevalla and gummy shark trap and purse seine and SA
Great Australian Commonwealth waters Deepwater fl athead, Demersal otter, and 10 vesselsBight between Cape Leeuwin orange roughy limited midwater WA and Kangaroo and Bight redfi sh trawl Island SA
Southern bluefi n Commonwealth waters Southern bluefi n Purse seining, pole and 112 vesselstuna especially the southern tuna line, longline and and south eastern parts of trolling the AFZ
Eastern tuna Commonwealth Yellowfi n, bigeye, Pelagic longline, purse 283 permitsand billfi sh waters off Queensland skipjack and seine, pole, trolling, NSW, Victoria and albacore tuna, and rod and reel, and Tasmania from Cape billfi sh species handline York to the SA/Victoria border

16 australian fi sheries statistics 2005
profi le
Commonwealth continued
main fi shing fi shery area species method number
Southern and Commonwealth waters Yellowfi n, bigeye, Pole and line, purse 125 permitsWestern tuna and from Cape York around skipjack, and albacore seine, pelagic longline,billfi sh northern Australia to tuna, and some billfi sh troll, rod and reel and the SA/Victorian border species handline
Bass Strait scallop Commonwealth waters Scallop Dredge 152 boat SFRs off SA, Victoria and Tasmania
Small pelagics Commonwealth waters Greenback, Purse seine 78 permits purse seine, midwater yellowtail and and midwater from north of the NSW/ Peruvian trawl Queensland border jack mackerel along southern Australia to near Perth WA
Southern squid Commonwealth waters Arrow or Gould’s Jig 80 permits off SA, Victoria, NSW squid Tasmania and southern Queensland
Sub Antarctic Heard, McDonald Patagonian Otter trawl and 3 vessels Islands and Macquarie toothfi sh, and icefi sh midwater trawl Island waters
Western Commonwealth Mixed fi sh Otter trawl 11 permitsDeepwater trawl waters off WA species
North Commonwealth waters Scampi Otter trawl 7 permitsWest slope off the northern parts of WA
Coral Sea Commonwealth waters, Reef fi sh, trochus, Otter trawl, hand lines, 18 permits from Sandy Cape to Cape lobster, aquarium fi sh, diving, seine nets York sea cucumber
South Tasman Rise High seas adjacent to Orange roughy, Deepwater demersal 14 permits AFZ, south of Tasmania oreo dory trawling

17australian fi sheries statistics 2005
profi le
New South Walesfi shery species method number
Abalone Blacklip abalone Diving 48 licence holders
Rock lobster Eastern rock lobster Traps 151 licence holders
Ocean prawn trawl Eastern king, school Trawling 306 licence holders whiting and octopus
Ocean trap and line Spanner crabs, snapper Fish traps, dropline 504 licence holders and bonito longline, spanner crab nets
Ocean haul Sea mullet, blue Purse seine and haul 318 licence holders mackerel and yellowtail nets
Ocean fi sh trawl Tiger and sand fl athead, Trawling 98 fi shing licences silver trevally, and fi ddler ray
Estuary prawn trawl School prawns Trawling 216 licence holders* squid
Estuary general Sea mullet, luderick Mesh and haul, nets, 685 licence holders Prawns, and pippis hand gathering
Aquaculture Prawns Pond culturing 15 licence holders Yabbies Ponds and farm dams 122 licence holders Oysters Rack tray and stick 378 licence holders Silver Perch Pond 124 licence holders Trout Ponds and raceway 39 licence holders Snapper Ponds 14 licence holders
* In Australian Fisheries Statistics 2004, the fi gure published was 317 — it should have been 217.
Victoriafi shery species method number
Abalone Greenlip, blacklip Diving 71 licence holders
Scallops Scallops Dredging 94 licence holders
Bay and inlet Mixed fi sh species Various 113 licence holders
Rock lobster Southern rock lobster Pots 137 licence holders 7 235 pots
Giant crab Giant crab Pots 38 licence holders
Inshore trawl Mixed fi sh species Trawling 60 licence holders
Ocean (general) Mixed fi sh species Various 330 licence holders
Aquaculture Freshwater eels Recirculation units and cultured waters 19 licence holders Abalone Flow through systems 17 licence holders Ornamental fi sh Recirculation units and ponds 7 licence holders Mussels Longlines 34 licence holders Yabbies Recirculation units, ponds and farm dams 38 licence holders Salomoids (Trout) Recirculation units and raceways 28 licence holders Warmwater fi nfi sh Recirculation units, fl ow through systems and ponds 33 licence holders
18 australian fi sheries statistics 2005
profi le
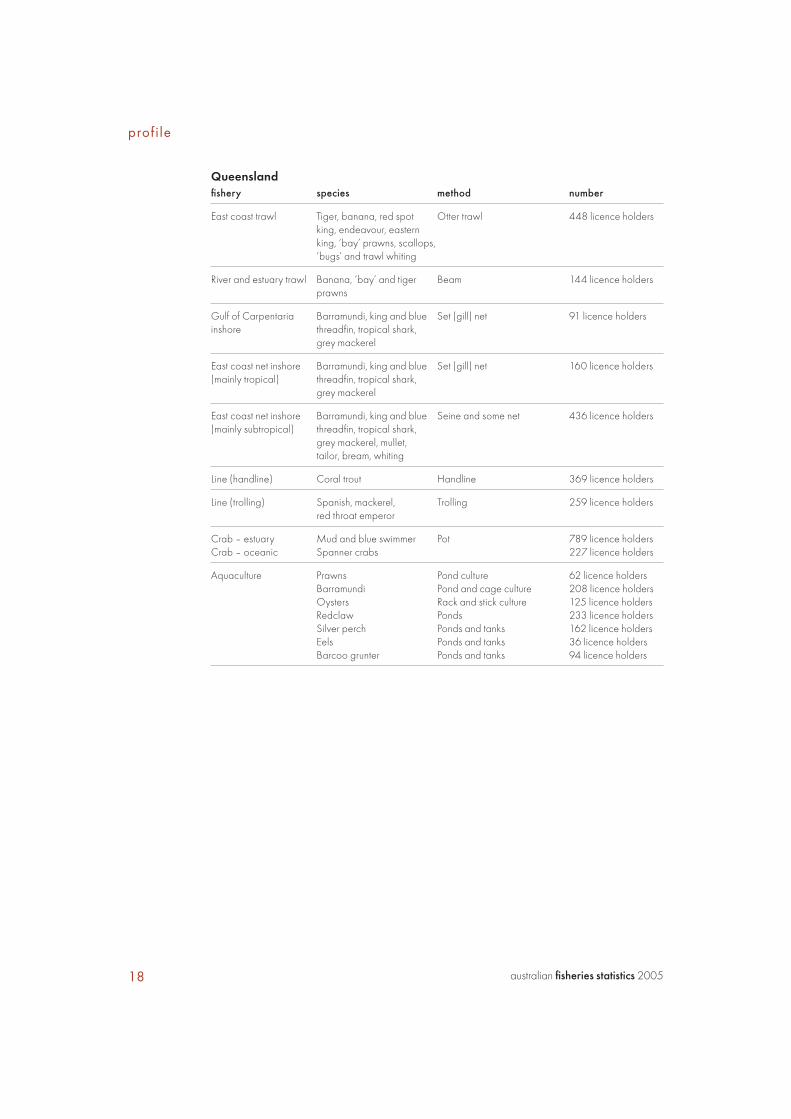
Queenslandfi shery species method number
East coast trawl Tiger, banana, red spot Otter trawl 448 licence holders king, endeavour, eastern king, ‘bay’ prawns, scallops, ‘bugs’ and trawl whiting
River and estuary trawl Banana, ‘bay’ and tiger Beam 144 licence holders prawns
Gulf of Carpentaria Barramundi, king and blue Set (gill) net 91 licence holdersinshore threadfi n, tropical shark, grey mackerel
East coast net inshore Barramundi, king and blue Set (gill) net 160 licence holders(mainly tropical) threadfi n, tropical shark, grey mackerel
East coast net inshore Barramundi, king and blue Seine and some net 436 licence holders(mainly subtropical) threadfi n, tropical shark, grey mackerel, mullet, tailor, bream, whiting
Line (handline) Coral trout Handline 369 licence holders
Line (trolling) Spanish, mackerel, Trolling 259 licence holders red throat emperor
Crab – estuary Mud and blue swimmer Pot 789 licence holdersCrab – oceanic Spanner crabs 227 licence holders
Aquaculture Prawns Pond culture 62 licence holders Barramundi Pond and cage culture 208 licence holders Oysters Rack and stick culture 125 licence holders Redclaw Ponds 233 licence holders Silver perch Ponds and tanks 162 licence holders Eels Ponds and tanks 36 licence holders Barcoo grunter Ponds and tanks 94 licence holders

19australian fi sheries statistics 2005
profi le
Western Australiafi shery species method number
West coast rock Western rock lobster Pots 536 boats andlobster 56 838 pots
Abalone Greenlip, brownlip and Diving 28 licence holders Roe’s abalone
Shark Bay prawn King, tiger and Trawling 27 licence holders endeavour prawns, scallops
Exmouth prawn King, tiger and Trawling 12 licence holders endeavour prawns
Nickol Bay prawn King and banana prawns Trawling 14 licence holders
Shark Bay scallops Scallops Trawling 41 licence holders
Aquaculture Pearls Longlines Yabbies Ponds and farm dams Marron Ponds and farm dams Mussels Longlines
South Australiafi shery species method number
Southern zone rock Southern rock lobster Pots 181 licence holderslobster
Northern zone rock Southern rock lobster Pots 68 licence holderslobster
Western zone Greenlip, blacklip Diving 23 licence holdersabalone abalone
Southern zone Greenlip, blacklip Diving 6 licence holdersabalone abalone
Central zone Greenlip, blacklip Diving 6 licence holdersabalone abalone
Blue crab Blue crab Pots 8 licence holders
West coast prawn Western king prawn Trawling 3 licence holders
Spencer Gulf prawn Western king prawn Trawling 39 licence holders
Gulf St Vincent Western king prawn Trawling 10 licence holdersprawn
Marine scalefi sh Various fi nfi sh, Netting, line fi shing, 351 licence holders crustaceans, molluscs handlines and traps
Restricted marine Various fi nfi sh, Netting, line fi shing, 17 licence holdersscalefi sh crustaceans, molluscs handlines and traps
Miscellaneous Various fi nfi sh, crustaceans, Traps, diving, etc 21 licence holders molluscs, worms

20 australian fi sheries statistics 2005
profi le
South Australia continued
fi shery species method number
Lakes and Coorong Freshwater fi nfi sh, marine Netting, line fi shing, 37 licence holders fi nfi sh, molluscs handlines
River Fishery Freshwater fi nfi sh, Netting, pots 6 licence holders crustaceans
Aquaculture Yabbies Ponds and farm dams 142 licence holders Marron Ponds and farm dams 101 licence holders Oysters Rack and stick culturing 346 licence holders Southern bluefi n tuna Cage culture 31 licence holders Barramundi Recirculating tanks 33 licence holders Murray cod 39 licence holders Abalone Raceways and ocean rafts 51 licence holders Gold and silver perch Pond culturing 51 licence holders Scallops 39 licence holders Yellowtail king fi sh 38 licence holders
Tasmaniafi shery species method number
Abalone Blacklip and greenlip Diving 123 diving abalone
Rock lobster Southern rock lobster Pots 312 licence holders
Giant Crab Giant crab Pots 92 licence holders
Scallop Commercial Dredging 83 licence holders Doughboy Queen
Scalefi sh Various Netting/ hooks 576 licence holders
Aquaculture Atlantic salmon Cage culture farming 44 licence holders Pacifi c oysters Rack and stick 116 licence holders Mussels Longlines 34 licence holders Rainbow trout Sea cages 19 licence holders Scallops 16 licence holders Abalone Sea cages and land based 41 licence holders tanks

21australian fi sheries statistics 2005
profi le
Northern Territoryfi shery species method number
Coastal Finfi sh and bait Line, net and trap 73 licence holders
Offshore Mackerel, shark and Trolling, hand and longline 108 licence holders reef net, trap and trawling
Barramundi Barramundi and Gillnet 24 licence holders threadfi n
Mud crab Mud crab Crab pots 49 licence hoders
Other Molluscs, oyster, Hand harvest, jigging 28 licence holders trepang, squid and a variety of other and aquarium methods
Aquaculture Pearls 7 licence holders Prawns 9 licence holders Barramundi 7 licence holders
Sources: Australian Fisheries Management Authority; New South Wales Department of Primary Industries; Northern Territory Department of Primary Industry and Fisheries; Queensland Department of Primary Industries; Victoria Marine and Freshwater Resources Institute; South Australian Research and Development Institute; Department of Primary Industries and Resources, South Australia; Western Australian Fisheries; ABARE.

22 australian fi sheries statistics 2005
production
1 gross value of fi sheries production – Australia
2002-03 2003-04 p 2004-05 s$’000 $’000 $’000
State wild catch fisheries New South Wales 104 435 89 712 83 553Victoria 88 974 72 137 85 078Queensland 225 102 229 193 190 441Western Australia 431 501 400 633 411 098South Australia 195 219 182 536 188 241 Tasmania 159 306 144 029 163 977Northern Territory 33 019 31 514 31 514
Total 1 237 555 1 149 754 1 153 903
Aquaculture aNew South Wales 48 586 49 647 47 605Victoria 20 699 23 746 23 946Queensland 62 912 67 740 61 720Western Australia 130 303 129 529 128 475South Australia 301 721 278 973 186 643Tasmania 122 744 135 920 134 914Northern Territory 21 900 27 800 27 800Total 708 865 713 355 611 103
Commonwealth fisheriesNorthern prawn 82 540 73 979 64 999Torres Strait 36 666 32 986 29 946Commonwealth trawl sector 65 734 54 547 58 926 Gillnet, hook and trap 21 587 23 500 24 591South Tasman Rise 455 367 220Great Australian Bight 8 576 14 305 16 654Eastern tuna and billfish – longline and minor line 67 913 46 832 42 471Eastern skipjack tuna 0 1 494 0Southern bluefin tuna 77 840 38 156 43 807Bass Strait scallop 694 1 475 387Western tuna and billfish fishery 19 998 8 252 3 584Other fisheries b 32 841 46 065 37 366
Total 414 844 341 955 322 950
Total value c 2 284 408 2 168 864 2 048 686
a Excludes the value of hatchery fishery production. b Includes North west slope, Western deepwater, Southern squid, Jack mackerel, Macquarie Island, Coral Sea, Cocos and Christmas Islands, Heard and McDonald Islands, East coast deepwater, and Norfolk Island fisheries. c Total value has been adjusted to allow for southern bluefin tuna caught in the Commonwealth southern bluefin tuna fishery, as an input to farms in South Australia. p Preliminary. s Estimates. Sources: ABARE; Australian Fisheries Management Authority; Fisheries Victoria, Department of Primary Industries; Melbourne Wholesale Fish Market; New South Wales Department of Primary Industries; New South Wales Fish Marketing Authority; Northern Territory Department of Primary Industry and Fisheries; Queensland Fisheries Service; Queensland Department of Primary Industries; South Australian Research and Development Institute; Tasmanian Department of Primary Industries, Water and Environment; Department ofFisheries, Western Australia.

23australian fi sheries statistics 2005
production
2 wild caught fi sheries production a
2002-03 2003-04 p 2004-05 s
t $’000 t $’000 t $’000
FishAustralian salmon 5 047 4 419 5 593 4 433 3 977 3 808Australian sardine 25 304 26 334 36 596 27 591 60 872 36 661Barramundi 1 526 9 578 1 624 10 034 1 444 8 777Bream 932 5 371 1 000 5 197 1 123 5 718Coral trout 2 172 32 581 1 740 25 951 1 139 17 070Dories 1 026 2 955 1 227 3 772 1 204 3 697Flathead 5 687 15 307 7 051 18 017 6 298 17 574Gemfish 355 1 098 587 1 683 513 1 695Ling 1 612 8 478 1 687 7 762 1 818 7 073Mullet 6 398 14 672 5 871 13 642 6 282 14 385Orange roughy 4 509 16 318 2 614 8 679 3 394 15 036Sharks b 10 406 44 107 11 299 46 289 10 980 47 104Spanish mackerel 1 708 11 038 1 770 11 233 1 392 8 903Tuna 11 001 126 540 10 130 72 511 9 064 71 794Whiting 4 796 19 878 4 139 17 269 4 108 15 709Other 62 246 203 145 62 796 197 427 57 990 176 976
Total 144 725 541 818 155 726 471 490 171 597 451 978
CrustaceansCrabs 7 003 50 956 7 297 53 734 6 532 46 571Prawns 23 076 307 936 23 731 300 068 20 336 254 609Rock lobster 16 609 455 483 19 338 402 186 17 550 408 848Other 979 11 368 820 10 233 967 12 771
Total 47 667 825 744 51 187 766 221 45 384 722 799
MolluscsAbalone 5 106 211 943 5 588 189 560 5 592 219 874Octopus 698 2 570 903 3 968 624 3 345Pipi 1 516 3 346 1 940 4 685 2 135 5 494Scallops 9 562 34 619 9 265 24 551 15 357 45 630Squid 3 427 9 654 4 561 13 520 3 762 9 879Other 1 546 19 036 970 15 995 858 15 595
Total 21 856 281 168 23 227 252 279 28 327 299 816
Other NEI 600 3 671 211 1 713 220 2 260
Total wild caught 214 849 1 652 401 230 351 1 491 703 245 529 1 476 853
a State and Commonwealth wildcaught production. b Shark converted to whole weight. p Preliminary. s Estimate.Sources: ABARE; Australian Fisheries Management Authority; Marine and Freshwater Resources Institute; Melbourne Wholesale Fish Market; New South Wales Department of Primary Industries; New South Wales Fish Marketing Authority; Northern Territory Departmentof Primary Industry and Fisheries; Queensland Fisheries Service; Queensland Department of Primary Industries; South Australian Researchand Development Institute; Tasmanian Department of Primary Industries, Water and Environment; Department of Fisheries, Western Australia.

24 australian fi sheries statistics 2005
production
3 fi sheries production in 2002-03, by state a – Australia
NSW Vic. Qld WA SA Tas. NT C'wlth Aust.
Value $’000 $’000 $’000 $’000 $’000 $’000 $’000 $’000 $’000FishTuna 136 0 0 249 267 342 1 20 126 135 317 025 bOther 48 032 28 825 101 477 44 139 40 178 109 901 24 816 163 604 c 560 972
Total 48 169 28 825 101 477 44 388 307 520 109 902 24 836 289 739 877 997
CrustaceansPrawns 37 320 1 140 141 226 49 821 32 459 0 0 102 039 364 004Rock lobster 5 432 17 648 7 412 281 023 82 666 52 137 0 14 342 460 660Crab 6 364 352 25 740 7 325 4 445 1 644 5 035 57 50 962Other 1 658 370 1 292 2 407 626 0 139 4 067 10 560
Total 50 774 19 510 175 671 340 576 120 196 53 781 5 174 120 504 886 186
MolluscsAbalone 10 964 54 866 0 13 177 39 369 97 855 0 0 216 231Scallops 0 1 357 7 538 22 821 0 2 122 3 778 34 619Oysters 34 700 0 693 0 15 116 11 561 0 0 62 070Squid 973 777 969 720 2 950 709 82 2 475 9 654Other 5 086 4 337 0 139 038 3 020 1 820 2 924 258 156 483
Total 51 723 61 337 9 200 175 756 60 455 114 066 3 009 3 511 479 057
Other NEI 2 354 0 1 667 1 084 8 769 4 302 21 900 1 093 41 169
Total value 153 019 109 672 288 014 561 804 496 940 282 052 54 919 414 844 d 2 284 408 b
Quantity t t t t t t t t t
FishTuna 38 0 0 38 7 763 0 6 10 920 13 390 bOther 14 259 5 366 15 617 16 586 25 936 14 697 5 107 54 163 c 151 731
Total 14 296 5 366 15 617 16 624 33 699 14 698 5 113 65 083 165 121
CrustaceansPrawns 2 410 89 10 576 4 125 1 740 0 0 7 501 26 441Rock lobster 122 488 632 11 477 2 361 1 422 0 579 17 081Crab 606 26 3 825 1 229 706 56 547 9 7 004Other 419 35 96 150 29 0 14 328 1 071
Total 3 556 638 15 129 16 981 4 836 1 478 561 8 418 51 597
MolluscsAbalone 276 1 308 0 270 949 2 389 0 0 5 192Scallops 0 632 1 538 6 792 0 164 1 435 9 562Oysters 5 603 0 0 0 2 706 2 228 0 0 10 537Squid 174 74 194 190 346 110 25 2 314 3 427Other 1 261 1 546 0 1 008 1 803 454 301 114 6 488
Total 7 315 3 560 1 732 8 260 5 804 5 346 327 2 862 35 206
Other NEI 17 0 78 124 1 077 153 0 285 1 734
Total quantity 25 185 9 564 32 556 41 989 45 416 21 675 6 001 76 646 d 253 658 b
a State totals include estimates of aquaculture production but exclude hatchery. b Total has been adjusted to allow for southern bluefin tuna caught in the Commonwealth southern bluefin tuna fishery, as an input to farms in South Australia. c Includes the fish component of Commonwealth fisheries, plus catch from Commonwealth fisheries that cannot be disaggregated due to confidentiality reasons. d Totalsinclude all fisheries under federal jurisdiction.Sources: ABARE; Australian Fisheries Management Authority; Fisheries Victoria, Department of Primary Industries; Melbourne Wholesale Fish Market; New South Wales Department of Primary Industries; New South Wales Fish Marketing Authority; Northern Territory Department of Primary Industry and Fisheries; Queensland Fisheries Service; Queensland Department of Primary Industries; South Australian Research and Development Institute; Tasmanian Department of Primary Industries, Water and Environment; Department ofFisheries, Western Australia.
25australian fi sheries statistics 2005
production
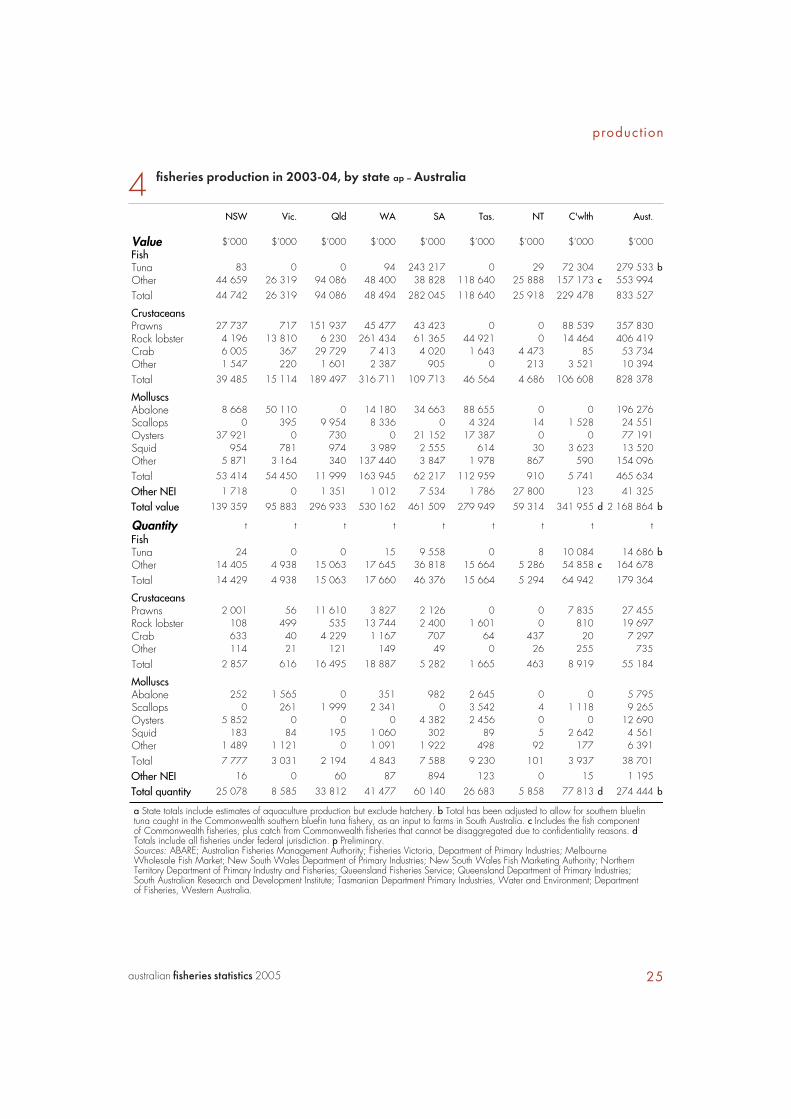
4 fi sheries production in 2003-04, by state ap – Australia
NSW Vic. Qld WA SA Tas. NT C'wlth Aust.
Value $’000 $’000 $’000 $’000 $’000 $’000 $’000 $’000 $’000FishTuna 83 0 0 94 243 217 0 29 72 304 279 533 bOther 44 659 26 319 94 086 48 400 38 828 118 640 25 888 157 173 c 553 994
Total 44 742 26 319 94 086 48 494 282 045 118 640 25 918 229 478 833 527
CrustaceansPrawns 27 737 717 151 937 45 477 43 423 0 0 88 539 357 830Rock lobster 4 196 13 810 6 230 261 434 61 365 44 921 0 14 464 406 419Crab 6 005 367 29 729 7 413 4 020 1 643 4 473 85 53 734Other 1 547 220 1 601 2 387 905 0 213 3 521 10 394
Total 39 485 15 114 189 497 316 711 109 713 46 564 4 686 106 608 828 378
MolluscsAbalone 8 668 50 110 0 14 180 34 663 88 655 0 0 196 276Scallops 0 395 9 954 8 336 0 4 324 14 1 528 24 551Oysters 37 921 0 730 0 21 152 17 387 0 0 77 191Squid 954 781 974 3 989 2 555 614 30 3 623 13 520Other 5 871 3 164 340 137 440 3 847 1 978 867 590 154 096
Total 53 414 54 450 11 999 163 945 62 217 112 959 910 5 741 465 634
Other NEI 1 718 0 1 351 1 012 7 534 1 786 27 800 123 41 325
Total value 139 359 95 883 296 933 530 162 461 509 279 949 59 314 341 955 d 2 168 864 b
Quantity t t t t t t t t tFishTuna 24 0 0 15 9 558 0 8 10 084 14 686 bOther 14 405 4 938 15 063 17 645 36 818 15 664 5 286 54 858 c 164 678
Total 14 429 4 938 15 063 17 660 46 376 15 664 5 294 64 942 179 364
CrustaceansPrawns 2 001 56 11 610 3 827 2 126 0 0 7 835 27 455Rock lobster 108 499 535 13 744 2 400 1 601 0 810 19 697Crab 633 40 4 229 1 167 707 64 437 20 7 297Other 114 21 121 149 49 0 26 255 735
Total 2 857 616 16 495 18 887 5 282 1 665 463 8 919 55 184
MolluscsAbalone 252 1 565 0 351 982 2 645 0 0 5 795Scallops 0 261 1 999 2 341 0 3 542 4 1 118 9 265Oysters 5 852 0 0 0 4 382 2 456 0 0 12 690Squid 183 84 195 1 060 302 89 5 2 642 4 561Other 1 489 1 121 0 1 091 1 922 498 92 177 6 391
Total 7 777 3 031 2 194 4 843 7 588 9 230 101 3 937 38 701
Other NEI 16 0 60 87 894 123 0 15 1 195
Total quantity 25 078 8 585 33 812 41 477 60 140 26 683 5 858 77 813 d 274 444 b
a State totals include estimates of aquaculture production but exclude hatchery. b Total has been adjusted to allow for southern bluefin tuna caught in the Commonwealth southern bluefin tuna fishery, as an input to farms in South Australia. c Includes the fish component of Commonwealth fisheries, plus catch from Commonwealth fisheries that cannot be disaggregated due to confidentiality reasons. dTotals include all fisheries under federal jurisdiction. p Preliminary.Sources: ABARE; Australian Fisheries Management Authority; Fisheries Victoria, Department of Primary Industries; Melbourne Wholesale Fish Market; New South Wales Department of Primary Industries; New South Wales Fish Marketing Authority; Northern Territory Department of Primary Industry and Fisheries; Queensland Fisheries Service; Queensland Department of Primary Industries;South Australian Research and Development Institute; Tasmanian Department Primary Industries, Water and Environment; Departmentof Fisheries, Western Australia.

26 australian fi sheries statistics 2005
production
5 fi sheries production in 2004-05, by state as – Australia
NSW Vic. Qld WA SA Tas. NT C'wlth Aust.
Value $’000 $’000 $’000 $’000 $’000 $’000 $’000 $’000 $’000FishTuna 119 0 0 81 139 955 0 29 71 564 172 479 bOther 48 773 25 270 74 452 46 996 44 948 115 680 25 888 150 275 c 532 283
Total 48 892 25 270 74 452 47 077 184 903 115 680 25 918 221 839 704 762
CrustaceansPrawns 20 989 303 125 077 42 557 35 805 0 0 79 741 304 473Rock lobster 3 767 13 697 6 957 264 659 66 041 47 630 0 12 297 415 048Crab 4 279 669 23 813 7 451 4 125 1 600 4 473 160 46 571Other 1 431 219 1 747 2 915 1 111 7 213 4 268 11 911
Total 30 466 14 888 157 594 317 582 107 082 49 237 4 686 96 466 778 002
MolluscsAbalone 7 825 64 635 0 12 650 39 139 105 397 0 0 229 645Scallops 0 400 15 703 24 460 0 4 593 14 460 45 630Oysters 35 788 0 700 0 19 995 16 804 0 0 73 287Squid 817 705 1 161 222 2 823 601 30 3 520 9 879Other 5 923 3 126 550 136 843 3 927 3 055 867 265 154 555
Total 50 352 68 865 18 114 174 175 65 884 130 450 910 4 245 512 996
Other NEI 1 448 0 2 000 739 17 015 3 525 27 800 399 52 926
Total value 131 158 109 024 252 161 539 573 374 884 298 892 59 314 322 950 d 2 048 686 b
Quantity t t t t t t t t t
FishTuna 23 0 0 12 7 458 0 8 9 021 11 306 bOther 14 992 4 691 12 488 15 944 60 714 15 359 5 286 52 084 c 181 558
Total 15 015 4 691 12 488 15 956 68 172 15 359 5 294 61 104 192 864
CrustaceansPrawns 1 627 23 9 512 3 585 2 173 0 0 6 650 23 570Rock lobster 99 467 600 12 303 2 343 1 602 0 686 18 099Crab 411 33 3 574 1 224 780 57 437 15 6 532Other 105 19 129 158 62 1 26 215 715
Total 2 243 542 13 814 17 270 5 358 1 660 463 7 566 48 916
MolluscsAbalone 186 1 615 0 304 1 079 2 709 0 0 5 893Scallops 0 196 3 148 6 870 0 4 796 4 343 15 357Oysters 4 727 0 0 0 4 650 2 373 0 0 11 751Squid 151 96 232 59 504 116 5 2 598 3 762Other 1 327 1 305 0 836 1 973 809 92 120 6 462
Total 6 391 3 212 3 380 8 069 8 206 10 804 101 3 061 43 225
Other NEI 20 0 70 91 2 019 179 0 19 2 398
Total quantity 23 670 8 445 29 752 41 386 83 755 28 002 5 858 71 750 d 287 403 b
a State totals include estimates of aquaculture production but exclude hatchery. b Total has been adjusted to allow for southern bluefin tuna caught in the Commonwealth southern bluefin tuna fishery, as an input to farms in South Australia. c Includes the fish component of Commonwealth fisheries, plus catch from Commonwealth fisheries that cannot be disaggregated due to confidentiality reasons. d Totals include all fisheries under federal jurisdiction. s Estimates.Sources: ABARE; Australian Fisheries Management Authority; Fisheries Victoria, Department of Primary Industries; Melbourne Wholesale Fish Market; New South Wales Department of Primary Industries; New South Wales Fish Marketing Authority; Northern Territory Department of Primary Industry and Fisheries; Queensland Fisheries Service; Queensland Department of Primary Industries; South Australian Research and Development Institute; Tasmanian Department of Primary Industries, Water and Environment; Department ofFisheries, Western Australia.

27australian fi sheries statistics 2005
production
6 fi sheries production in 2004-05, by location of catch as – Australia
NSW Vic. Qld WA SA Tas. NT Other b Aust.
Value $’000 $’000 $’000 $’000 $’000 $’000 $’000 $’000 $’000FishTuna 17 165 54 13 963 1 289 173 488 23 35 0 172 479 cOther 69 235 57 646 83 789 51 826 67 499 145 485 28 020 31 512 532 283
Total 86 400 57 700 97 752 53 115 240 987 145 507 28 055 31 512 704 762
CrustaceansPrawns 21 317 303 160 275 46 386 35 805 0 40 377 4 304 473Rock lobster 3 779 13 697 6 957 264 659 66 041 47 630 1 757 415 048Crab 4 350 697 23 559 7 451 4 128 1 647 4 760 0 46 571Other 1 615 901 2 215 2 924 976 7 453 1 706 11 911
Total 31 061 15 597 193 006 321 420 106 950 49 284 45 591 2 467 778 002
MolluscsAbalone 7 825 64 635 0 12 650 37 846 105 397 0 0 229 645Scallops 0 745 15 708 24 460 0 4 634 69 0 45 630Oysters 35 788 0 700 0 22 638 16 804 0 0 73 287Squid 1 489 1 479 1 174 247 3 083 697 87 1 911 9 879Other 7 355 3 056 550 136 843 3 777 3 061 1 207 2 154 555
Total 52 457 69 915 18 132 174 200 67 343 130 594 1 362 1 913 512 996
Other NEI 1 448 0 2 000 739 17 015 3 525 27 800 399 52 926
Total value 171 366 143 213 310 889 549 475 432 296 328 910 102 809 36 291 2 048 686 cd
Quantity t t t t t t t t t
FishTuna 1 919 8 1 750 160 12 470 4 9 0 11 306 cOther 21 504 16 781 14 131 17 172 67 972 26 001 5 700 12 743 181 558
Total 23 422 16 789 15 881 17 332 80 443 26 006 5 709 12 743 192 864
CrustaceansPrawns 1 799 23 12 729 3 947 2 173 0 2 896 1 23 570Rock lobster 99 467 600 12 303 2 343 1 602 0 50 18 099Crab 417 32 3 523 1 224 780 59 451 0 6 532Other 113 54 165 159 55 1 31 62 715
Total 2 429 576 17 016 17 633 5 352 1 662 3 378 113 48 916
MolluscsAbalone 186 1 615 0 304 1 017 2 709 0 0 5 893Scallops 0 499 3 148 6 870 0 4 832 3 0 15 357Oysters 4 727 0 0 0 4 620 3 391 0 0 11 751Squid 558 550 237 64 619 174 27 1 659 3 762Other 1 348 1 290 0 836 1 894 812 125 0 6 462
Total 6 820 3 954 3 385 8 074 8 150 11 917 156 1 659 43 225
Other NEI 20 0 70 91 2 019 179 0 19 2 398
Total quantity 32 692 21 319 36 351 43 129 95 963 39 765 9 243 14 534 287 403 cd
a Commonwealth, state and territory production is allocated according to the state or territory waters in which the catch was taken. The totals include aquaculture production but exclude hatchery production. b Includes Commonwealth fisheries that have been aggregated for reasons of confidentiality – they are, North west slope, Western deep water, Southern squid, Jack mackerel, Macquarie Island,Heard and McDonald Islands, Coral Sea, Cocos and Christmas Islands fisheries. c Total has been adjusted to allow for southern bluefintuna caught in the Commonwealth southern bluefin tuna fishery, as an input to farms in South Australia. d Totals include confidential Commonwealth landings and only sum across. s Estimates.Sources: ABARE; Australian Fisheries Management Authority; Fisheries Victoria, Department of Primary Industries; Melbourne Wholesale Fish Market; New South Wales Department of Primary Industries; New South Wales Fish Marketing Authority; Northern Territory Department of Primary Industry and Fisheries; Queensland Department of Primary Industries; Queensland Fisheries Service; South Australian Research and Development Institute; Tasmanian Department of Primary Industries, Water and Environment; Department ofFisheries, Western Australia.

28 australian fi sheries statistics 2005
production
7 fi sheries production – New South Wales
2002-03 2003-04 2004-05 p
t $’000 t $’000 t $’000
CrustaceansRock lobster 122 5 432 108 4 196 99 3 767King prawns 1 180 24 109 849 17 795 629 13 092School prawns 563 5 801 635 4 973 547 2 892Other prawns 258 1 231 155 538 157 541Crabs 605 6 359 633 6 005 411 4 279Other 87 1 221 86 1 190 82 1 067
Total a 2 815 44 153 2 465 34 696 1 925 25 639
MolluscsAbalone 276 10 964 252 8 668 186 7 825Scallops 0 0 0 0 0 0Cuttlefish 280 688 335 850 273 696Pipi 301 1 878 571 2 367 656 2 832Octopus 562 1 973 487 2 103 301 1 971Squid 174 973 183 954 151 817Other 52 213 54 289 62 209
Total a 1 645 16 689 1 881 15 232 1 628 14 349
FishSea mullet 3 236 6 535 2 872 5 598 3 798 7 621Silver trevally 347 909 550 1 139 363 863Yellowtail kingfish 250 1 744 145 1 009 100 713Jack mackerel 419 2 088 127 293 58 51Black and yellowfin bream 388 3 566 333 3 102 360 3 408Australian salmon 1 346 1 688 2 131 2 508 1 511 1 940Snapper 206 1 813 241 2 250 249 2 271Rubberlip morwong 54 197 67 234 76 229Mulloway 74 500 101 697 58 446Sand whiting 170 1 817 179 1 894 141 1 486Luderick 484 797 390 626 298 437School whiting 1 835 4 708 1 583 3 707 1 375 3 009Dusky flathead 157 847 133 748 111 655Golden perch 6 98 1 19 0 0Other 4 676 15 080 5 024 14 840 5 854 18 990
Total a 13 646 42 389 13 879 38 666 14 352 42 122
Other NEI 17 1 204 16 1 118 24 1 444
Total wild caught 18 124 104 435 18 240 89 712 17 928 83 553
Aquaculture bPrawns 409 6 178 363 4 432 294 4 464Yabbies 32 431 28 354 23 362Oysters 5 603 34 700 5 852 37 921 4 727 35 788Silver perch 302 2 812 239 2 322 269 2 431Trout 200 1 440 170 1 552 218 1 784Mussels 67 334 44 261 36 215Barramundi 85 905 101 1 128 121 1 360Snapper 15 135 0 0 0 2Ornamentals 0 620 0 554 0 547Other 348 1 030 40 1 124 52 654
Total 7 061 48 586 6 838 49 647 5 742 47 605
Total production 25 185 153 019 25 078 139 359 23 670 131 158
a Excludes catches in the Commonwealth south east and eastern tuna and billfish fisheries. b Excludes hatchery production. p Preliminary.Sources: ABARE; New South Wales Department of Primary Industries; New South Wales Fish Marketing Authority.

29australian fi sheries statistics 2005
production
8 fi sheries production – Victoria
2002-03 2003-04 p 2004-05 s
t $’000 t $’000 t $’000
CrustaceansRock lobster 488 17 648 499 13 810 467 13 697Prawns 89 1 140 56 717 23 303Crabs 26 352 40 367 33 669Other 28 236 16 156 15 141
Total 631 19 376 611 15 050 538 14 810
MolluscsAbalone 1 281 53 658 1 463 46 549 1 491 60 181Scallops 632 1 357 261 395 196 400Squid a 74 777 84 781 96 705Octopus 29 122 41 116 18 77Other 73 174 67 211 63 233
Total 2 089 56 088 1 916 48 052 1 864 61 596
FishAustralian sardine b 1 196 4 865 1 013 1 175 644 708Bream 57 500 42 438 41 383Sea garfish 85 590 84 615 101 620Shark c 69 339 49 245 66 380Snapper 76 571 96 707 114 779Eels 106 1 174 105 1 115 86 910Australian salmon 327 468 385 280 530 552King george whiting 113 1 312 140 1 611 138 1 754Other 1 604 3 691 1 228 2 849 1 116 2 586
Total 3 633 13 510 3 142 9 035 2 836 8 672
Other NEI 0 0 0 0 0 0
Total wild caught 6 353 88 974 5 669 72 137 5 238 85 078
Aquaculture dMussels 1 444 4 042 1 013 2 837 1 224 2 816Yabbies 7 134 5 64 4 78Trout e 1 605 10 404 1 648 12 316 1 629 10 533Eels f 18 181 43 450 116 1 462Ornamental fish 0 3 003 0 2 752 0 2 741Warmwater finfish g 110 1 727 105 1 766 110 1 863Abalone 27 1 208 102 3 561 124 4 454
Total 3 211 20 699 2 916 23 746 3 207 23 946
Total production 9 564 109 672 8 585 95 883 8 445 109 024
a Arrow squid taken by machine jig are now being reported to the Commonwealth. b From 2003-04 based on processor price, prior to that based on market price. c Shark data only includes Victorian bays and inlets and small quantities taken in ocean waters by non shark fishers operating in state proclaimed waters. d Excludes hatchery production. e Includes salmon production. f Eel production data are obtained from Victorian catch and effort monthly record, and may not be complete. g Includes Australian bass, barramundi, catfish, golden perch, murray cod and sliver perch. p Preliminary. s Estimates. Sources: ABARE; Fisheries Victoria, Department of Primary Industries; Melbourne Wholesale Fish Market.
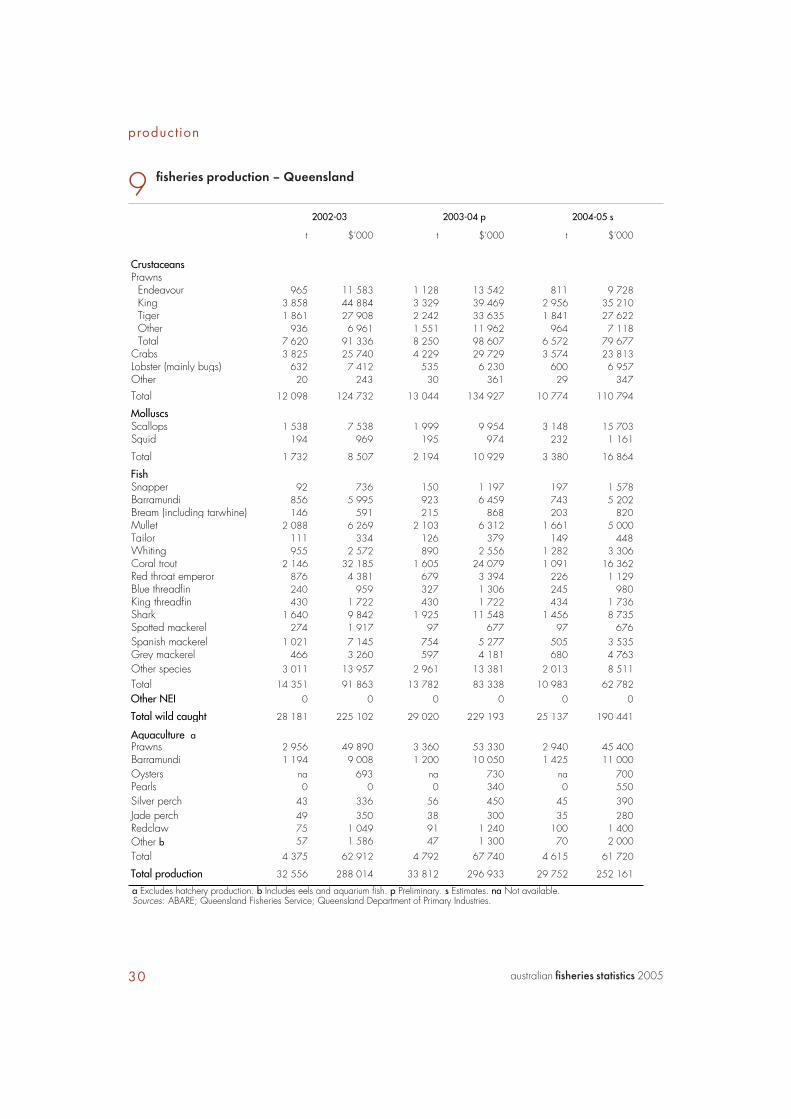
30 australian fi sheries statistics 2005
production
9 fi sheries production – Queensland
2002-03 2003-04 p 2004-05 s
t $’000 t $’000 t $’000
CrustaceansPrawns
Endeavour 965 11 583 1 128 13 542 811 9 728King 3 858 44 884 3 329 39 469 2 956 35 210Tiger 1 861 27 908 2 242 33 635 1 841 27 622Other 936 6 961 1 551 11 962 964 7 118Total 7 620 91 336 8 250 98 607 6 572 79 677
Crabs 3 825 25 740 4 229 29 729 3 574 23 813Lobster (mainly bugs) 632 7 412 535 6 230 600 6 957Other 20 243 30 361 29 347
Total 12 098 124 732 13 044 134 927 10 774 110 794
MolluscsScallops 1 538 7 538 1 999 9 954 3 148 15 703Squid 194 969 195 974 232 1 161
Total 1 732 8 507 2 194 10 929 3 380 16 864
FishSnapper 92 736 150 1 197 197 1 578Barramundi 856 5 995 923 6 459 743 5 202Bream (including tarwhine) 146 591 215 868 203 820Mullet 2 088 6 269 2 103 6 312 1 661 5 000Tailor 111 334 126 379 149 448Whiting 955 2 572 890 2 556 1 282 3 306Coral trout 2 146 32 185 1 605 24 079 1 091 16 362Red throat emperor 876 4 381 679 3 394 226 1 129Blue threadfin 240 959 327 1 306 245 980King threadfin 430 1 722 430 1 722 434 1 736Shark 1 640 9 842 1 925 11 548 1 456 8 735Spotted mackerel 274 1 917 97 677 97 676Spanish mackerel 1 021 7 145 754 5 277 505 3 535Grey mackerel 466 3 260 597 4 181 680 4 763Other species 3 011 13 957 2 961 13 381 2 013 8 511
Total 14 351 91 863 13 782 83 338 10 983 62 782Other NEI 0 0 0 0 0 0
Total wild caught 28 181 225 102 29 020 229 193 25 137 190 441
Aquaculture aPrawns 2 956 49 890 3 360 53 330 2 940 45 400Barramundi 1 194 9 008 1 200 10 050 1 425 11 000Oysters na 693 na 730 na 700Pearls 0 0 0 340 0 550Silver perch 43 336 56 450 45 390Jade perch 49 350 38 300 35 280Redclaw 75 1 049 91 1 240 100 1 400Other b 57 1 586 47 1 300 70 2 000
Total 4 375 62 912 4 792 67 740 4 615 61 720
Total production 32 556 288 014 33 812 296 933 29 752 252 161
a Excludes hatchery production. b Includes eels and aquarium fish. p Preliminary. s Estimates. na Not available.Sources: ABARE; Queensland Fisheries Service; Queensland Department of Primary Industries.

31australian fi sheries statistics 2005
production
10 fi sheries production – Western Australia
2002-03 2003-04 p 2004-05 s
t $’000 t $’000 t $’000
CrustaceansRock lobster 11 477 281 023 13 744 261 434 12 303 264 659Prawns 4 125 49 821 3 827 45 477 3 585 42 557Crabs 1 229 7 325 1 167 7 413 1 224 7 451Other 29 285 28 286 30 310
Total 16 860 338 454 18 766 314 610 17 142 314 977
MolluscsAbalone 270 13 177 351 14 180 304 12 650Scallops 6 792 22 821 2 341 8 336 6 870 24 460Squid 190 720 1 060 3 989 59 222Other a 355 13 431 328 13 377 305 13 328
Total 7 607 50 149 4 080 39 882 7 538 50 660
FishTuna 38 249 15 94 12 81Shark 2 039 4 803 2 228 5 631 2 635 6 418Sharkfin 0 1 367 0 1 521 0 1 966Australian salmon 1 858 798 2 373 1 020 1 245 535Cobbler 278 915 210 676 180 547WA dhufish 258 2 301 239 2 133 224 1 996Spanish mackerel 478 2 560 488 3 174 336 2 177Sea mullet 326 519 305 671 249 548Yelloweye mullet 54 47 52 46 46 41Australian sardine 2 064 1 858 1 813 1 632 1 828 1 645Australian herring 530 212 375 149 219 87Whiting 171 824 163 744 188 879Breams 121 467 128 504 170 732Emperors 986 3 337 1 325 4 053 1 135 3 555Pink snapper 843 4 169 817 4 044 676 3 348Rockcods 294 1 370 414 1 847 448 1 963Tropical snappers 1 700 8 490 1 954 10 018 2 191 11 549Other 4 340 8 241 4 402 7 925 3 858 7 122
Total 16 378 42 527 17 301 45 882 15 640 45 189
Other NEI b 124 371 87 259 91 272
Total wild caught 40 969 431 501 40 234 400 633 40 411 411 098
Aquaculture cPearls na 124 000 na 122 000 na 122 000Yabbies 75 1 040 71 1 010 73 1 120Marron 46 1 082 50 1 091 55 1 485Mussels 653 1 607 763 2 063 531 1 515Fish 246 1 776 359 2 494 316 1 699Gold fish / koi carp na 85 na 118 na 189Ornamental na 206 na 208 na 147Other d na 507 na 545 na 320
Total 1 020 130 303 1 243 129 529 975 128 475
Total production 41 989 561 804 41 477 530 162 41 386 539 573
a Value includes pearl oyster taken, including those taken for 'mother of pearl', and mussels. b Includes beche de mer, sea urchins etc. Previously reported under molluscs other. c Aquaculture excludes algae production for betacarotene and hatchery production. Some quantity data not available due to confidentiality restrictions. d Includes other molluscs and crustaceans. p Preliminary. s Estimates. naNot available.Sources: ABARE; Department of Fisheries, Western Australia.

32 australian fi sheries statistics 2005
production
11 fi sheries production – South Australia
2002-03 2003-04 2004-05 p
t $’000 t $’000 t $’000
CrustaceansPrawns 1 740 32 459 2 126 43 423 2 173 35 805Rock lobster 2 361 82 666 2 400 61 365 2 343 66 041Crab 706 4 445 707 4 020 780 4 125Other 0 0 21 272 20 218
Total 4 807 119 570 5 254 109 080 5 316 106 189
MolluscsAbalone 890 36 289 877 31 508 902 33 821Pipi 1 187 1 373 1 073 1 441 1 103 1 352Squid 346 2 950 302 2 555 504 2 823Other 362 1 181 449 1 709 493 1 918
Total 2 785 41 793 2 701 37 213 3 002 39 914
Fish aAustralian salmon 577 694 159 269 137 227Mullet 214 511 155 367 160 361Australian herring 197 289 150 300 183 353Snapper 533 3 174 413 2 801 504 3 301King george whiting 398 5 476 352 4 298 347 3 585Garfish 332 1 940 319 1 822 364 1 929Leather jackets 202 411 501 626 349 519Australian sardine 21 741 17 827 33 160 22 549 56 952 28 476Yellowfin whiting 181 1 067 163 910 138 764Snook 112 263 81 206 83 188Callop (golden perch) 64 706 80 812 102 1 034Other species 896 1 498 1 029 1 283 1 112 1 401
Total 25 447 33 856 36 562 36 243 60 431 42 138
Other NEI 0 0 0 0 0 0
Total wild caught 33 039 195 219 44 517 182 536 68 749 188 241
Aquaculture bYabbies 7 93 10 153 20 306Marron 22 533 18 480 22 587Oysters 2 706 15 116 4 382 21 152 4 650 19 995Southern bluefin tuna c 7 763 267 342 9 558 243 217 7 458 139 955Barramundi 471 6 166 216 2 255 217 2 265Trout 18 156 40 330 66 545Abalone 59 3 080 105 3 155 177 5 318Mussels 254 466 400 697 377 657Other d 1 077 8 769 894 7 534 2 019 17 015
Total 12 377 301 721 15 623 278 973 15 006 186 643
Total production 45 416 496 940 60 140 461 509 83 755 374 884
a Excludes shark from the southern shark fishery. b Excludes hatchery production. Data from 2004-05 from Primary Industries and Resources South Australia. c Processed weight. Input of wildcaught southern bluefin tuna from Commonwealth southern bluefin tuna fishery was 5216 tonnes in 2004-05, 5002 tonnes in 2003-04 and 5375 tonnes in 2002-03. d Includes snapper, microalgae, murray cod, yellowtail kingfish, golden perch and aquarium fish. p Preliminary.Sources: ABARE; South Australian Research and Development Institute; Primary Industries and Resources South Australia.

33australian fi sheries statistics 2005
production
12 fi sheries production – Tasmania
2002-03 2003-04 p 2004-05 s
t $’000 t $’000 t $’000
CrustaceansRock lobster 1 422 52 137 1 601 44 921 1 602 47 630Giant crab 56 1 644 64 1 643 57 1 600Other 0 0 0 0 1 7
Total 1 478 53 781 1 665 46 564 1 660 49 237
MolluscsAbalone 2 389 97 855 2 645 88 655 2 709 105 397Octopus 68 394 71 404 79 429Scallop 164 2 122 3 542 4 324 4 796 4 593Other 188 1 052 159 937 170 858
Total 2 809 101 423 6 417 94 320 7 754 111 277
Fish aAustralian salmon 407 557 167 204 334 466Cod 2 5 2 4 1 3Garfish 92 461 66 334 75 384Banded morwong 56 693 46 318 42 274Jackass morwong 15 20 17 20 17 29Elephant shark 16 28 10 18 7 14Bastard trumpter 21 83 23 110 17 85Striped trumpter 38 279 37 299 24 219School whiting 40 63 55 90 38 138Wrasse 72 635 75 633 101 855Shark 68 241 60 220 34 138Other 267 736 276 734 263 716
Total 1 094 3 800 837 2 983 954 3 323
Other NEI 153 302 80 161 90 140
Total wild caught 5 535 159 306 8 999 144 029 10 458 163 977
Aquaculture bSalmonids c 13 603 106 101 14 828 115 656 14 405 112 357Oysters 2 228 11 561 2 456 17 387 2 373 16 804Mussels 309 1 082 357 1 251 677 2 369Other d na 4 000 43 1 625 89 3 384
Total 16 140 122 744 17 684 135 920 17 544 134 914
Total production 21 675 282 052 26 683 279 949 28 002 298 892
a Excludes shark from the Commonwealth southern shark fishery; includes jack mackerel. b Excludes hatchery production. c Includes Atlantic salmon and ocean trout, weight in HOGG (head on, gilled and gutted). d Includes scallops, native oysters, seahorses and abalone. p Preliminary. s Estimates. na Not available.Sources: ABARE; Tasmanian Department of Primary Industries, Water and Environment.

34 australian fi sheries statistics 2005
production
13 fi sheries production – Northern Territory
2002-03 2003-04 p 2004-05 s
t $’000 t $’000 t $’000
CrustaceansCrab 547 5 035 437 4 473 437 4 473Other 14 139 26 213 26 213
Total 561 5 174 463 4 686 463 4 686
MolluscsScallops 1 3 4 14 4 14Squid 25 82 5 30 5 30Other 300 2 924 92 867 92 867
Total 327 3 009 101 910 101 910
FishTuna 6 20 8 29 8 29Shark 969 6 191 1 102 7 053 1 102 7 053Snapper 265 1 613 240 1 446 240 1 446Barramundi 670 3 583 701 3 575 701 3 575Threadfin salmon 261 573 375 699 375 699Jewfish (mulloway) 180 469 232 580 232 580Emperor 97 537 106 593 106 593Cod 33 165 44 217 44 217Mackerel 1 273 5 066 908 4 027 908 4 027Gold band snapper 404 2 403 540 3 211 540 3 211Sea perch 763 3 540 818 3 797 818 3 797Other 192 676 220 691 220 691
Total 5 113 24 836 5 294 25 918 5 294 25 918
Total wild caught 6 001 33 019 5 858 31 514 5 858 31 514
Aquaculture a na 21 900 na 27 800 na 27 800
Total production 6 001 54 919 5 858 59 314 5 858 59 314
a Includes pearls and aquarium production. These values are based on derived estimates from a limited number of operators. Excludeshatchery production. Quantities not available due to confidentiality restrictions. p Preliminary. s Estimates. 2004-05 production data were not available at time of publication, so 2003-04 data has been used as estimates. na Not available.Sources: ABARE; Northern Territory Department of Primary Industry and Fisheries.

35australian fi sheries statistics 2005
production
14 fi sheries production – Commonwealth
2002-03 2003-04 p 2004-05 s
t $’000 t $’000 t $’000
Northern prawnPrawn
Tiger 1 969 34 640 2 186 32 072 1 785 29 152Banana 3 325 42 797 3 516 36 043 2 764 30 634Endeavour 395 4 543 418 4 388 412 3 948King 3 47 1 12 2 30Other prawns 6 21 71 610 73 499Total prawns 5 699 82 048 6 192 73 126 5 035 64 263
Other species 62 492 85 854 89 736
Total 5 761 82 540 6 277 73 979 5 124 64 999
Torres StraitPrawn
Tiger 665 10 700 653 8 819 706 9 525Endeavour 750 6 902 705 5 290 663 4 908King 122 1 586 85 974 59 587Other prawns 5 17 4 9 12 123Other a 52 582 38 390 35 439
Total 1 594 19 787 1 485 15 482 1 474 15 582
Tropical rock lobster 578 14 311 807 14 399 685 12 281Spanish mackerel
Spanish mackerel 198 1 240 152 914 169 1 268Other species 0 0 2 5 2 5Total 199 1 241 154 919 171 1 272
Reef Line b 107 1 327 190 2 186 71 810
Pearls 0 0 0 0 0 0
Total 2 477 36 666 2 636 32 986 2 401 29 946
Commonwealth trawl sector cOrange roughy 4 162 15 066 2 373 7 880 3 166 14 027Blue grenadier 8 865 14 184 8 678 11 021 6 310 11 295Tiger flathead 3 366 8 180 3 726 8 047 3 338 6 843Redfish 778 1 159 638 918 510 716Blue warehou 281 488 279 605 267 573Silver warehou 4 179 4 347 3 392 4 324 2 787 3 646School whiting 607 1 239 450 951 290 387Jackass morwong 851 1 361 719 1 264 783 1 628Ling 1 053 5 531 1 092 4 967 872 3 621Gemfish 267 828 177 494 221 729Silver trevally 147 312 159 274 86 137Mirror dory 623 1 090 617 1 219 574 1 004Royal red prawn 232 655 192 317 173 328Ocean perch 327 835 325 720 327 876John dory 157 950 178 1 030 142 890Blue eye trevalley 59 372 56 408 47 322Gummy shark 100 388 99 437 98 571School shark 39 148 29 91 23 102Saw shark 123 366 135 288 140 407Elephant fish 32 50 52 49 48 87Other 4 310 8 187 4 723 9 243 4 854 10 736
Total 30 558 65 734 28 089 54 547 25 055 58 926
Continued

36 australian fi sheries statistics 2005
production
2002-03 2003-04 p 2004-05 s
t $’000 t $’000 t $’000
Gillnet, hook and trap fishery dBlue eye trevalley 526 2 067 651 4 931 453 3 406Blue warehou 5 8 2 4 1 3Ling 544 2 854 554 2 592 892 3 228Gummy shark 2 384 12 707 2 429 12 189 2 453 14 302School shark 288 1 533 318 1 400 261 1 144Saw shark 271 887 319 668 307 596Elephant fish 90 141 46 24 57 103Other shark 204 377 200 273 196 395Other species 354 1 013 407 1 419 421 1 413
Total 4 665 21 587 4 926 23 500 5 041 24 591
South Tasman Rise 150 455 199 367 73 220
Great Australian Bight cOrange roughy 237 857 215 715 185 820Rock flathead 1 657 4 608 2 482 6 429 2 281 7 708Bight redfish 375 903 946 2 130 1 006 1 820Leather jacket 213 415 351 530 535 711Angel shark 184 302 246 579 319 475Boarfish 80 175 158 369 159 358Jackass morwong 79 126 129 226 125 260Squid 166 170 172 227 88 104Knifejaw 41 36 67 134 92 61Gemfish 67 182 336 940 257 845Blue grenadier 1 4 169 214 342 612Queen snapper 25 104 65 368 74 350Spotted trevalla 2 2 5 7 20 26School shark 1 4 2 6 3 13Gummy shark 37 142 80 393 94 547Saw shark 65 213 65 139 64 187Elephant fish 3 4 4 4 2 4Other 150 330 365 895 619 1 752
Total 3 383 8 576 5 858 14 305 6 263 16 654
Continued
14 fi sheries production – Commonwealth continued

37australian fi sheries statistics 2005
production
2002-03 2003-04 p 2004-05 s
t $’000 t $’000 t $’000
Eastern tuna and billfish – longline and minor lineYellowfin 3 394 29 661 2 422 20 393 1 960 16 795Skipjack 18 47 2 3 1 2Albacore 494 989 557 957 632 1 074Bigeye 936 11 397 795 8 448 858 8 675Billfish 2 837 23 746 2 267 14 622 2 068 13 678Other 844 2 074 925 2 408 742 2 246
Total 8 523 67 913 6 967 46 832 6 261 42 471
Eastern skipjack tuna
Yellowfin 0 0 21 177 0 0Skipjack 0 0 779 1 316 0 0Other 0 0 0 1 0 0
Total 0 0 800 1 494 0 0
Southern bluefin tuna 5 409 77 840 5 080 38 156 5 421 43 807
Western tuna and billfishAlbacore 74 148 54 91 18 31Skipjack 0 0 30 51 0 0Yellowfin 266 2 375 162 951 48 424Bigeye 281 3 417 159 1 699 64 651Other tuna 41 103 10 24 17 101Billfish 1 586 13 672 767 5 271 316 2 312Other species 157 282 82 164 31 63
Total 2 404 19 998 1 262 8 252 495 3 584
Bass Strait scallop 421 694 1 113 1 475 339 387
Other fisheries e 12 895 32 841 14 606 46 065 15 275 37 366
Total production 76 646 414 844 77 813 341 955 71 750 322 950
a Mainly Morten Bay bugs, scallops and squid. b Includes non-spanish mackerel fish caught by long line. c Shark converted to whole weight. d An amalgamation of South east nontrawl and Southern shark fisheries in 2002-03. e Includes north west slope, western deepwater, southern squid, jack mackerel, Macquarie Island, Coral Sea, Cocos and Christmas Islands, Commonwealth Victorian coastal waters sector, Heard and MacDonald Islands, east coast deepwater, and Norfolk Island fisheries. p Preliminary. s Estimates.Sources: Australian Fisheries Management Authority; ABARE.
14 fi sheries production – Commonwealth continued

38 australian fi sheries statistics 2005
production
15 aquaculture production in 2002-03, by state a – Australia
NSW Vic. Qld WA SA Tas. NT Aust.
Value $’000 $’000 $’000 $’000 $’000 $’000 $’000 $’000FishSalmon 0 0 0 0 0 106 101 na 106 101Trout 1 440 10 404 b 0 0 156 0 na 12 000Tuna 0 0 0 0 267 342 0 na 267 342Silver perch 2 812 0 336 0 0 0 na 3 148Barramundi 905 0 9 008 0 6 166 0 na 16 079Other c 1 244 4 911 350 1 861 0 0 na 8 366
Total 6 401 15 315 9 694 1 861 273 664 106 101 na 413 036
CrustaceansPrawn 6 178 0 49 890 0 0 0 na 56 068Yabbies 431 134 0 1 040 93 0 na 1 698Marron 0 0 0 1 082 533 0 na 1 615Redclaw 6 0 1 049 0 0 0 na 1 055
Total 6 621 134 50 939 2 122 626 0 na 60 442
MolluscsEdible oysters 34 700 0 693 0 15 116 11 561 na 62 070Pearl oysters d 0 0 0 124 000 0 0 na 124 000Mussels 334 4 042 0 1 607 466 1 082 na 7 531Other e 0 1 208 0 0 3 080 0 na 4 288
Total 35 034 5 250 693 125 607 18 662 12 643 na 197 889
Other NEI f 530 0 1 586 713 8 769 4 000 21 900 37 498
Total value 48 586 20 699 62 912 130 303 301 721 122 744 21 900 708 865
Quantity t t t t t t t tFishSalmon 0 0 0 0 0 13 603 na 13 603Trout 200 1 605 b 0 0 18 0 na 1 823Tuna 0 0 0 0 7 763 0 na 7 763Silver perch 302 0 43 0 0 0 na 345Barramundi 85 0 1 194 0 471 0 na 1 750Other c 63 128 49 246 0 0 na 486
Total 650 1 733 1 286 246 8 252 13 603 na 25 770
CrustaceansPrawn 409 0 2 956 0 0 0 na 3 365Yabbies 32 7 0 75 7 0 na 121Marron 0 0 0 46 22 0 na 68Redclaw 300 0 75 0 0 0 na 375
Total 741 7 3 032 121 29 0 na 3 930
MolluscsEdible oysters 5 603 0 0 0 2 706 2 228 na 10 537Pearl oysters 0 0 0 0 0 0 na 0Mussels 67 1 444 0 653 254 309 na 2 727Other e 0 27 0 0 59 0 na 86
Total 5 669 1 471 0 653 3 019 2 537 na 13 349
Other NEI f 0 0 57 0 1 077 0 na 1 134
Total quantity 7 061 3 211 4 375 1 020 12 377 16 140 na 44 183
a Excludes hatchery production, crocodiles, microalgae and aquarium worms. b Includes salmon production. c Includes eels, other native fish and aquarium fish. d Total value of peral production will be an underestimate as it excludes the value of production in NT which remains confidential. e Includes scallops, giant clams and abalone. f Includes aquaculture production not elsewhere specified due to confidentiality restrictions. In Victoria, this includes abalone, warmwater finfish, ornamental fish, other shellfish, shrimps and aquatic worms. In Western Australia, this includes some other crustaceans and molluscs not specified above. In South Australia, this includes snapper, microalgae, aquarium species, murray cod and callop. Total only sums across. na Not available.Sources: ABARE; Queensland Bribie Island Aquaculture Research Centre; Fisheries Victoria, Department of Primary Industries; New South Wales Department of Primary Industries; Northern Territory Department of Primary Industries and Fisheries; South AustralianResearch and Development Institute; Tasmanian Department of Primary Industries, Water and Environment; Department of Fisheries,Western Australia.

39australian fi sheries statistics 2005
production
16 aquaculture production in 2003-04, by state a – Australia
NSW Vic. Qld WA SA Tas. NT Aust.
Value $’000 $’000 $’000 $’000 $’000 $’000 $’000 $’000FishSalmon 5 0 0 0 0 115 656 na 115 662Trout 1 552 12 316 b 0 0 330 0 na 14 198Tuna 0 0 0 0 243 217 0 na 243 217Silver perch 2 322 0 450 0 0 0 na 2 772Barramundi 1 128 0 10 050 0 2 255 0 na 13 433Other c 1 070 4 968 300 2 612 0 0 na 8 950
Total 6 077 17 284 10 800 2 612 245 802 115 656 na 398 232
CrustaceansPrawn 4 432 0 53 330 0 0 0 na 57 762Yabbies 354 64 0 1 010 153 0 na 1 581Marron 0 0 0 1 091 480 0 na 1 571Redclaw 3 0 1 240 0 0 0 na 1 243
Total 4 788 64 54 570 2 101 633 0 na 62 156
MolluscsEdible oysters 37 921 0 730 0 21 152 17 387 na 77 191Pearl oysters d 0 0 340 122 000 0 0 na 122 340Mussels 261 2 837 0 2 063 697 1 251 na 7 109Other e 0 3 561 0 0 3 155 0 na 6 716
Total 38 182 6 398 1 070 124 063 25 004 18 638 na 213 356
Other NEI f 600 0 1 300 753 7 534 1 625 27 800 39 612
Total value 49 647 23 746 67 740 129 529 278 973 135 920 27 800 713 355
Quantity t t t t t t t tFishSalmon 1 0 0 0 0 14 828 na 14 828Trout 170 1 648 b 0 0 40 0 na 1 858Tuna 0 0 0 0 9 558 0 na 9 558Silver perch 239 0 56 0 0 0 na 295Barramundi 101 0 1 200 0 216 0 na 1 517Other c 39 148 38 359 0 0 na 584
Total 550 1 796 1 294 359 9 814 14 828 na 28 640
CrustaceansPrawn 363 0 3 360 0 0 0 na 3 723Yabbies 28 5 0 71 10 0 na 114Marron 0 0 0 50 18 0 na 68Redclaw 0 0 91 0 0 0 na 91
Total 392 5 3 451 121 28 0 na 3 997
MolluscsEdible oysters 5 852 0 0 0 4 382 2 456 na 12 690Pearl oysters 0 0 0 0 0 0 na 0Mussels 44 1 013 0 763 400 357 na 2 577Other e 0 102 0 0 105 0 na 207
Total 5 896 1 115 0 763 4 887 2 813 na 15 474
Other NEI f 0 0 47 0 894 43 na 984
Total quantity 6 838 2 916 4 792 1 243 15 623 17 684 na 49 096
a Excludes hatchery production, crocodiles, microalgae and aquarium worms. b Includes salmon production. c Includes eels, other native fish and aquarium fish. d Total value of pearl production will be an underestimate as it excludes the value of production in NT which remains confidential. e Includes scallops, giant clams and abalone. f Includes aquaculture production not elsewhere specified due to confidentiality restrictions. In Victoria, this includes abalone, warmwater finfish, ornamental fish, other shellfish, shrimps and aquatic worms. In Western Australia, this includes some other crustaceans and molluscs not specified above. In South Australia, this includes snapper, microalgae, aquarium species, murray cod and callop. Total only sums across. na Not available.Sources: ABARE; Queensland Bribie Island Aquaculture Research Centre; Fisheries Victoira, Department of Primary Industries; New South Wales Department of Primary Industries; Northern Territory Department of Primary Industries and Fisheries; South AustralianResearch and Development Institute; Tasmanian Department of Primary Industries, Water and Environment; Department of Fisheries,Western Australia.

40 australian fi sheries statistics 2005
production
17 aquaculture production in 2004-05, by state a – Australia
NSW Vic. Qld WA SA Tas. NT Aust.
Value $’000 $’000 $’000 $’000 $’000 $’000 $’000 $’000FishSalmon 0 0 0 0 0 112 357 na 112 357Trout 1 784 10 533 b 0 0 545 0 na 12 862Tuna 0 0 0 0 139 955 0 na 139 955Silver perch 2 431 0 390 0 0 0 na 2 821Barramundi 1 360 0 11 000 0 2 265 0 na 14 625Other c 1 201 6 065 280 1 888 0 0 na 9 434Total 6 775 16 598 11 670 1 888 142 765 112 357 na 292 053
CrustaceansPrawn 4 464 0 45 400 0 0 0 na 49 864Yabbies 362 78 0 1 120 306 0 na 1 866Marron 0 0 0 1 485 587 0 na 2 072Redclaw 2 0 1 400 0 0 0 na 1 402
Total 4 827 78 46 800 2 605 893 0 na 55 203
MolluscsEdible oysters 35 788 0 700 0 19 995 16 804 na 73 287Pearl oysters d 0 0 550 122 000 0 0 na 122 550Mussels 215 2 816 0 1 515 657 2 369 na 7 571Other e 0 4 454 0 0 5 318 0 na 9 772Total 36 003 7 269 1 250 123 515 25 970 19 173 na 213 180
Other NEI f 0 0 2 000 467 17 015 3 384 27 800 50 666
Total value 47 605 23 946 61 720 128 475 186 643 134 914 27 800 611 103
Quantity t t t t t t t tFishSalmon 0 0 0 0 0 14 405 na 14 405Trout 218 1 629 b 0 0 66 0 na 1 913Tuna 0 0 0 0 7 458 0 na 7 458Silver perch 269 0 45 0 0 0 na 314Barramundi 121 0 1 425 0 217 0 na 1 763Other c 52 226 35 316 0 0 na 629Total 660 1 855 1 505 316 7 741 14 405 na 26 482
CrustaceansPrawn 294 0 2 940 0 0 0 na 3 234Yabbies 23 4 0 73 20 0 na 120Marron 0 0 0 55 22 0 na 77Redclaw 0 0 100 0 0 0 na 100
Total 317 4 3 040 128 42 0 na 3 532
MolluscsEdible oysters 4 727 0 0 0 4 650 2 373 na 11 751Pearl oysters 0 0 0 0 0 0 na 0Mussels 36 1 224 0 531 377 677 na 2 845Other e 0 124 0 0 177 0 na 301Total 4 764 1 348 0 531 5 204 3 050 na 14 897
Other NEI f 0 0 70 0 2 019 89 na 2 178
Total quantity 5 742 3 207 4 615 975 15 006 17 544 na 47 089
a Excludes hatchery production, crocodiles, microalgae and aquarium worms. b Includes salmon production. c Includes eels, other native fish and aquarium fish. d Total value of peral production will be an underestimate as it excludes the value of production in NT which remains confidential. e Includes scallops, giant clams and abalone. f Includes aquaculture production not elsewhere specified due to confidentiality restrictions. In Victoria, this includes abalone, warmwater finfish, ornamental fish, other shellfish, shrimps and aquatic worms. In Western Australia, this includes some other crustaceans and molluscs not specified above. In South Australia, this includes snapper, microalgae, aquarium species, murray cod and callop. Total only sums across. na Not available.Sources: ABARE; Queensland Bribie Island Aquaculture Research Centre; Fisheries Victoria, Department of Primary Industries; New South Wales Department of Primary Industries; Northern Territory Department of Primary Industries and Fisheries; South AustralianResearch and Development Institute; Tasmanian Department of Primary Industries, Water and Environment; Department of Fisheries,Western Australia.

41australian fi sheries statistics 2005
expor ts
18 exports of fi sheries products – Australia
2002-03 2003-04 2004-05
t $’000 t $’000 t $’000
EdibleFishLive na 46 991 na 39 316 na 34 946Fresh, chilled or frozen
Whole Tuna a 12 424 319 604 12 560 271 724 10 277 162 450 Other 11 672 57 073 7 874 39 361 10 129 47 105Fillets 3 237 24 455 2 779 17 007 2 537 18 612
Canned 714 5 031 834 6 354 1 234 6 587Dried, salted and smoked 222 18 608 187 19 471 164 20 047Other fish products 1 783 13 439 1 736 16 748 1 591 14 627
Total fish b 30 052 485 201 25 970 409 980 25 931 304 375
Crustaceans and molluscsRock lobster 11 535 463 106 13 453 426 833 12 636 439 575Prawns 9 532 208 245 9 396 160 603 10 302 163 104Abalone 4 193 216 115 4 910 237 680 4 004 263 150Scallops 1 165 28 686 1 464 34 916 1 209 32 566Oysters 163 1 742 119 1 182 174 1 746Crabs 1 714 21 087 1 616 17 491 1 638 18 180Other 1 807 60 672 1 592 30 648 1 427 13 324
Total 30 109 999 654 32 548 909 353 31 389 931 644
Total edible b 60 161 1 484 854 58 518 1 319 333 57 320 1 236 019
NonedibleMarine fats and oils na 1 721 na 2 305 na 2 234Fish meal na 20 103 na 15 212 na 8 239Pearls c na 331 957 na 310 365 na 291 004Ornamental fish na 1 726 na 1 858 na 1 473Other nonedible na 4 079 na 2 816 na 2 747
Total nonedible na 359 586 na 332 556 na 305 698
Total fisheries products na 1 844 440 na 1 651 889 na 1 541 717
a Exports of tuna landed in Australia. b Excludes live tonnage but includes live value. c Includes items temporarily exported. na Not available.Note: All tonnages are net product weight exported, all values are "free on board".Source: ABS, International Trade, Australia, cat. no. 5465.0, Canberra.

42 australian fi sheries statistics 2005
expor ts
19 exports of fi sh – Australia
2002-03 2003-04 2004-05
t $’000 t $’000 t $’000
Tuna aWhole
Fresh or chilled 6 132 106 525 6 675 125 405 4 315 67 468Frozen 6 292 213 079 5 885 146 319 5 962 94 982
Canned 183 1 298 238 1 612 646 2 723Other 15 54 15 120 26 533
Total 12 622 320 956 12 813 273 456 10 949 165 706
SalmonWhole
Fresh or chilled 705 6 923 206 1 678 1 109 7 653Frozen 254 3 457 25 497 66 777
Smoked 68 1 248 25 504 18 461Canned 44 434 196 1 480 318 1 912
Total 1 071 12 063 453 4 158 1 511 10 804
Other fishLive na 46 991 na 39 316 na 34 946Whole
Fresh or chilled 2 552 24 974 2 026 20 638 1 768 17 761Frozen Whiting 1 175 3 052 1 005 2 217 1 908 4 006 Other 6 985 18 665 4 611 14 333 5 277 16 908
FilletsFresh or chilled 343 4 238 119 1 394 167 2 064Frozen 2 894 20 217 2 661 15 612 2 370 16 548
Other (fresh, chilled or frozen) 1 701 11 985 1 656 14 977 1 467 12 689Canned 488 3 300 400 3 262 270 1 952Dried, salted and smoked 155 17 360 162 18 967 145 19 586Other 67 1 400 65 1 651 98 1 405
Total b 16 359 152 182 12 704 132 366 13 472 127 865
Total fish b 30 052 485 201 25 970 409 980 25 931 304 375
a Exports of tuna landed in Australia. b Excludes live tonnage but includes live value. na Not available.Note: All tonnages are net product weight exported, all values are "free on board".Source: ABS, International Trade, Australia, cat. no. 5465.0, Canberra.

43australian fi sheries statistics 2005
expor ts
20 exports of crustaceans and molluscs – Australia
2002-03 2003-04 2004-05
t $’000 t $’000 t $’000
Rock lobsterWhole
Live, fresh or chilled 5 873 228 064 7 202 227 898 6 899 239 128Frozen 775 25 184 836 20 820 741 20 818Cooked 2 821 90 548 2 852 69 782 2 545 69 666
Tails (fresh, chilled or frozen) 1 698 112 922 2 062 102 506 1 849 100 572Other 368 6 388 501 5 829 603 9 391
Total 11 535 463 106 13 453 426 833 12 636 439 575
PrawnsHeadless 580 12 002 307 5 353 437 6 639Whole 8 739 192 567 8 852 151 488 9 623 153 239Other 213 3 676 237 3 762 242 3 225
Total 9 532 208 245 9 396 160 603 10 302 163 104
CrabsFresh, frozen or cooked 1 711 21 064 1 611 17 451 1 632 18 110Other 2 23 5 40 6 70
Total 1 714 21 087 1 616 17 491 1 638 18 180
AbaloneFresh, chilled or frozen 1 701 109 277 2 119 117 482 2 032 123 856Canned 2 493 106 838 2 791 120 198 1 972 139 294
Total 4 193 216 115 4 910 237 680 4 004 263 150
ScallopsFresh, chilled or frozen 1 130 26 639 1 460 34 789 1 208 32 560Other 35 2 048 4 126 0 6
Total 1 165 28 686 1 464 34 916 1 209 32 566
Other 1 970 62 415 1 711 31 830 1 601 15 069
Total crustaceans and molluscs 30 109 999 654 32 548 909 353 31 389 931 644
Note: All tonnages are net product weight exported, all values are "free on board".Source: ABS, International Trade, Australia, cat. no. 5465.0, Canberra.

44 australian fi sheries statistics 2005
expor ts
21 exports of edible fi sh, by destination – Australia
2002-03 2003-04 2004-05
t $’000 t $’000 t $’000
Tuna aFresh or chilled (whole)Chinese Taipei 0 0 0 0 3 28Japan 5 544 99 183 6 396 121 807 4 079 64 951Singapore 19 196 0 0 0 0Thailand 50 156 0 2 2 34United States 488 6 665 227 3 247 130 2 088Other 30 325 53 349 101 366
Total 6 132 106 525 6 675 125 405 4 315 67 468
Frozen (whole)Japan 6 097 212 082 5 595 145 434 5 188 93 225Samoa 109 289 135 321 430 1 214Thailand 50 138 92 289 320 359United States 34 553 23 174 10 143Other 1 17 40 100 14 41
Total 6 292 213 079 5 885 146 319 5 962 94 982
SalmonFresh or chilled (whole)Chinese Taipei 1 69 0 0 0 0Hong Kong, China 7 160 4 69 11 216Indonesia 18 153 22 230 47 414Japan 639 5 888 172 1 280 938 6 248Korea, Rep. of 0 0 0 0 0 0Singapore 5 55 1 19 52 329United States 28 505 0 3 27 139Other 8 94 6 76 34 308
Total 705 6 923 206 1 678 1 109 7 653
Frozen (whole)Chinese Taipei 0 2 0 1 0 0Hong Kong, China 12 230 5 128 9 216Japan 177 2 242 4 69 24 160Korea, Rep. of 0 8 0 0 0 0Thailand 12 122 5 102 5 107United States 21 361 0 2 0 0Other 31 492 10 193 28 294
Total 254 3 457 25 497 66 777
WhitingFrozen (whole)Chinese Taipei 0 0 0 0 0 0Egypt 0 0 0 0 0 0Hong Kong, China 0 4 0 0 13 28Japan 16 78 139 307 0 0Thailand 908 2 348 469 1 032 1 245 2 534United States 0 0 0 1 0 0Viet Nam 0 0 0 0 0 0Other 251 623 397 877 650 1 444
Total 1 175 3 052 1 005 2 217 1 908 4 006
Continued
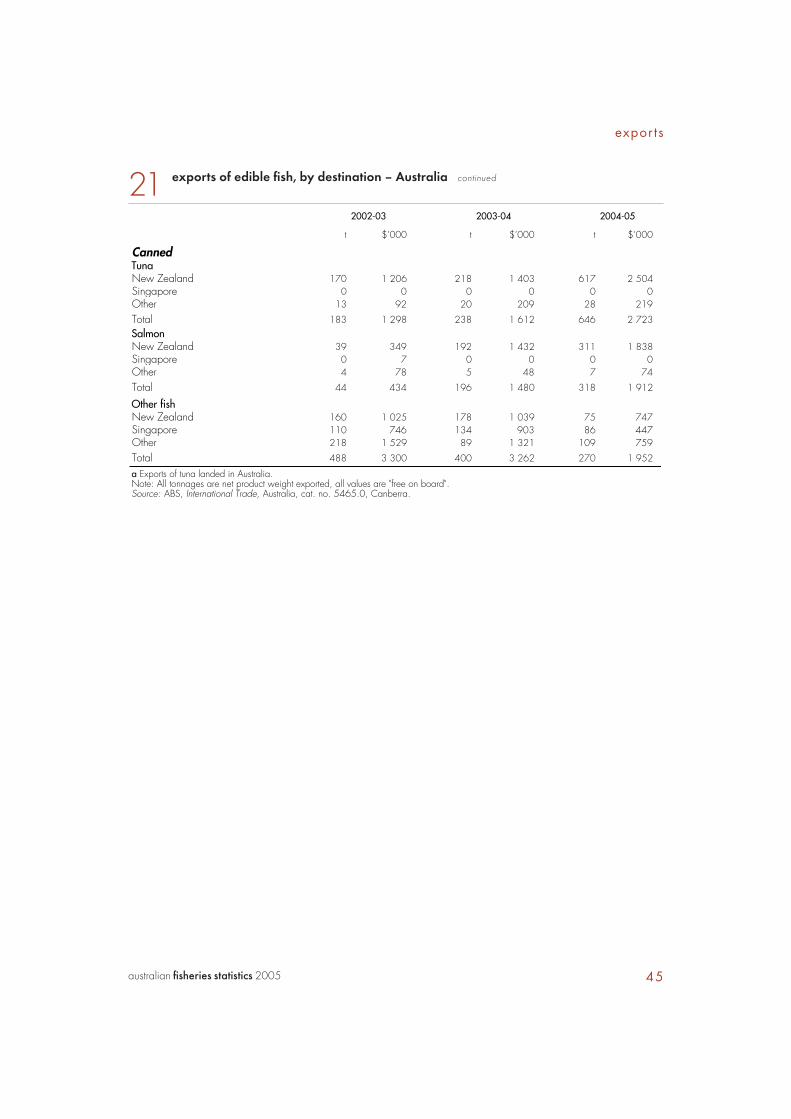
45australian fi sheries statistics 2005
expor ts
21 exports of edible fi sh, by destination – Australia continued
2002-03 2003-04 2004-05
t $’000 t $’000 t $’000
CannedTunaNew Zealand 170 1 206 218 1 403 617 2 504Singapore 0 0 0 0 0 0Other 13 92 20 209 28 219
Total 183 1 298 238 1 612 646 2 723SalmonNew Zealand 39 349 192 1 432 311 1 838Singapore 0 7 0 0 0 0Other 4 78 5 48 7 74
Total 44 434 196 1 480 318 1 912
Other fishNew Zealand 160 1 025 178 1 039 75 747Singapore 110 746 134 903 86 447Other 218 1 529 89 1 321 109 759
Total 488 3 300 400 3 262 270 1 952
a Exports of tuna landed in Australia.Note: All tonnages are net product weight exported, all values are "free on board".Source: ABS, International Trade, Australia, cat. no. 5465.0, Canberra.
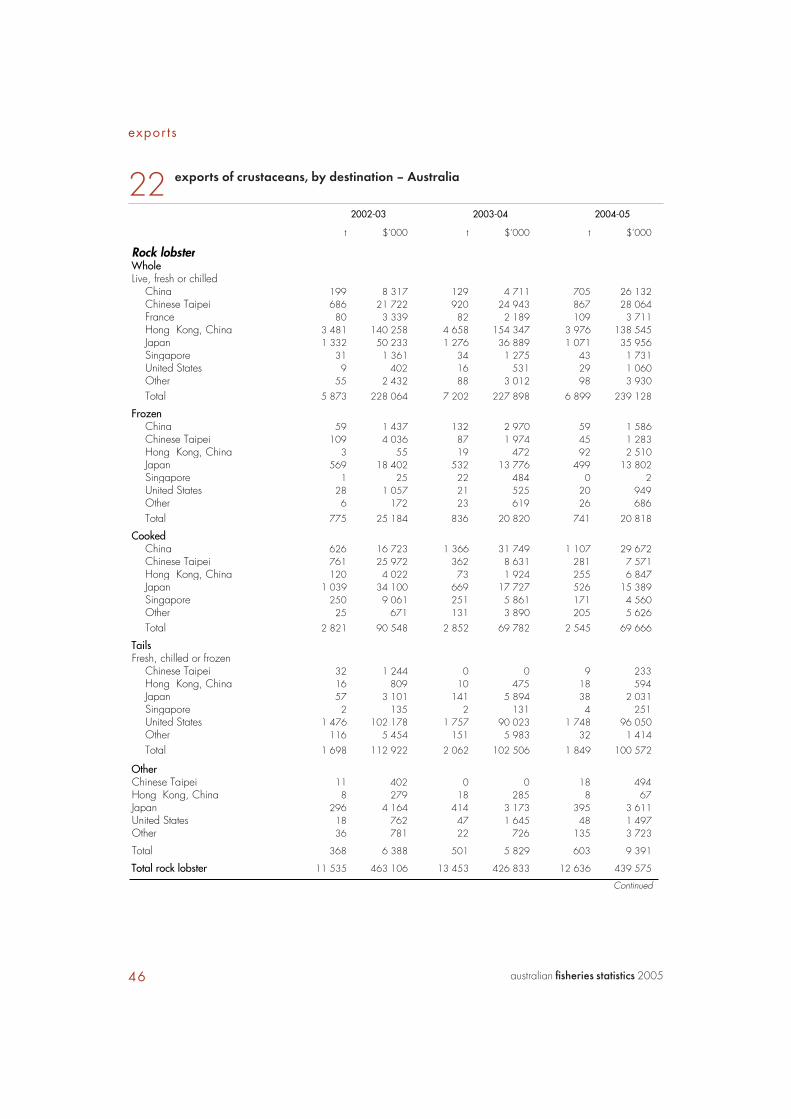
46 australian fi sheries statistics 2005
expor ts
22 exports of crustaceans, by destination – Australia
2002-03 2003-04 2004-05
t $’000 t $’000 t $’000
Rock lobsterWholeLive, fresh or chilled
China 199 8 317 129 4 711 705 26 132Chinese Taipei 686 21 722 920 24 943 867 28 064France 80 3 339 82 2 189 109 3 711Hong Kong, China 3 481 140 258 4 658 154 347 3 976 138 545Japan 1 332 50 233 1 276 36 889 1 071 35 956Singapore 31 1 361 34 1 275 43 1 731United States 9 402 16 531 29 1 060Other 55 2 432 88 3 012 98 3 930
Total 5 873 228 064 7 202 227 898 6 899 239 128
FrozenChina 59 1 437 132 2 970 59 1 586Chinese Taipei 109 4 036 87 1 974 45 1 283Hong Kong, China 3 55 19 472 92 2 510Japan 569 18 402 532 13 776 499 13 802Singapore 1 25 22 484 0 2United States 28 1 057 21 525 20 949Other 6 172 23 619 26 686
Total 775 25 184 836 20 820 741 20 818
CookedChina 626 16 723 1 366 31 749 1 107 29 672Chinese Taipei 761 25 972 362 8 631 281 7 571Hong Kong, China 120 4 022 73 1 924 255 6 847Japan 1 039 34 100 669 17 727 526 15 389Singapore 250 9 061 251 5 861 171 4 560Other 25 671 131 3 890 205 5 626
Total 2 821 90 548 2 852 69 782 2 545 69 666
TailsFresh, chilled or frozen
Chinese Taipei 32 1 244 0 0 9 233Hong Kong, China 16 809 10 475 18 594Japan 57 3 101 141 5 894 38 2 031Singapore 2 135 2 131 4 251United States 1 476 102 178 1 757 90 023 1 748 96 050Other 116 5 454 151 5 983 32 1 414
Total 1 698 112 922 2 062 102 506 1 849 100 572
OtherChinese Taipei 11 402 0 0 18 494Hong Kong, China 8 279 18 285 8 67Japan 296 4 164 414 3 173 395 3 611United States 18 762 47 1 645 48 1 497Other 36 781 22 726 135 3 723
Total 368 6 388 501 5 829 603 9 391
Total rock lobster 11 535 463 106 13 453 426 833 12 636 439 575
Continued

47australian fi sheries statistics 2005
expor ts
22 exports of crustaceans, by destination – Australia continued
2002-03 2003-04 2004-05
t $’000 t $’000 t $’000
PrawnsHeadlessChina 0 0 0 0 44 513Chinese Taipei 0 0 1 24 0 0Hong Kong, China 14 318 3 34 14 387Japan 428 9 613 179 3 917 150 3 599Spain 0 0 0 0 0 0United States 10 298 1 33 3 69Other 127 1 773 123 1 345 225 2 071
Total 580 12 002 307 5 353 437 6 639
WholeChina 780 14 914 1 151 15 777 1 540 19 601Chinese Taipei 219 5 153 184 3 997 74 1 483Hong Kong, China 1 388 26 874 925 15 985 659 9 593Japan 3 815 105 331 3 063 62 751 3 466 68 784Malaysia 214 3 890 274 3 723 75 567New Zealand 237 3 365 175 2 313 189 2 305Spain 1 223 17 214 1 697 23 069 1 972 26 524Thailand 90 1 102 124 1 442 198 2 290Other 773 14 724 1 259 22 431 1 451 22 092
Total 8 739 192 567 8 852 151 488 9 623 153 239
OtherChina 0 0 0 0 26 152Chinese Taipei 8 169 20 372 21 453Japan 15 345 9 181 12 241Singapore 30 556 25 523 13 169United States 0 0 1 27 1 16Other 161 2 606 182 2 660 169 2 195
Total 213 3 676 237 3 762 242 3 225
Total prawns 9 532 208 245 9 396 160 603 10 302 163 104
CrabsFresh, frozen or cookedChina 157 4 165 119 2 009 159 3 444Chinese Taipei 752 6 954 582 5 045 728 6 256Hong Kong, China 182 2 186 212 2 852 122 1 618Japan 418 3 948 552 5 126 478 4 752Singapore 36 799 19 461 24 504United States 103 2 005 52 1 054 39 692Other 64 1 007 75 902 81 846
Total 1 711 21 064 1 611 17 451 1 632 18 110
Other crabs 2 23 5 40 6 70
Total crabs 1 714 21 087 1 616 17 491 1 638 18 180
Other crustaceansChina 169 2 256 1 26 67 732Hong Kong, China 706 30 031 249 8 533 31 1 043Japan 92 2 171 122 1 800 26 534Switzerland 9 178 9 160 6 148Other 157 4 798 95 2 556 44 1 213Total 1 134 39 433 475 13 076 174 3 670
Total crustaceans 23 914 731 871 24 939 618 003 24 750 624 529
Note: All tonnages are net product weight exported, all values are "free on board".Source: ABS, International Trade, Australia, cat. no. 5465.0, Canberra.

48 australian fi sheries statistics 2005
expor ts
23 exports of molluscs, by destination – Australia
2002-03 2003-04 2004-05
t $’000 t $’000 t $’000
AbaloneFresh, chilled or frozenChina 30 3 141 20 1 532 296 16 033Chinese Taipei 159 8 536 137 6 088 85 4 096Hong Kong, China 1 129 71 567 1 551 87 086 1 229 76 529Japan 351 22 574 377 19 985 394 24 250Singapore 7 441 14 781 8 599United States 7 708 8 746 5 502Other 17 2 310 12 1 264 15 1 848
Total 1 701 109 277 2 119 117 482 2 032 123 856
CannedChinese Taipei 207 8 403 428 16 366 227 12 806Hong Kong, China 901 29 309 1 222 53 210 949 70 010Japan 584 29 629 596 25 309 402 27 462Singapore 326 20 088 344 16 744 311 22 475United States 118 3 231 91 3 391 31 2 381Other 356 16 177 110 5 178 52 4 160
Total 2 493 106 838 2 791 120 198 1 972 139 294
Total abalone 4 193 216 115 4 910 237 680 4 004 263 150
ScallopsFresh, chilled or frozenChina 0 5 0 0 0 0France 0 0 0 0 156 2 704Hong Kong, China 769 18 732 1 096 26 109 727 21 971Malaysia 72 1 611 54 1 287 33 949Singapore 246 5 392 249 5 715 181 5 232Other 44 899 60 1 678 112 1 704
Total 1 130 26 639 1 460 34 789 1 208 32 560
Other scallops 35 2 048 4 126 0 6
Total scallops 1 165 28 686 1 464 34 916 1 209 32 566
Other molluscsChinese Taipei 54 2 243 38 1 500 79 625Hong Kong, China 349 10 083 499 8 997 330 6 801Japan 152 7 178 110 4 837 71 891Singapore 95 2 416 41 1 452 19 368Malaysia 3 13 0 2 5 21Other 183 1 049 547 1 966 923 2 694
Total 836 22 981 1 235 18 754 1 426 11 399
Total molluscs 6 194 267 783 7 608 291 350 6 639 307 114
Note: All tonnages are net product weight exported, all values are "free on board".Source: ABS, International Trade, Australia, cat. no. 5465.0, Canberra.

49australian fi sheries statistics 2005
expor ts
24 exports of fi sheries products, by destination – Australia
2002-03 2003-04 2004-05
t $’000 t $’000 t $’000
Edible (excluding live)China 5 111 72 266 4 735 68 543 6 361 107 462Chinese Taipei 3 255 90 043 3 019 73 658 2 621 68 051France 373 8 370 638 13 130 1 073 16 476Germany 346 1 300 933 4 018 712 2 264Greece 537 10 215 861 16 013 578 9 478Hong Kong, China 9 769 355 503 11 265 381 414 9 220 358 647Indonesia 502 2 220 626 2 712 512 2 529Italy 209 3 113 162 1 949 187 2 413Japan 23 826 627 772 22 482 489 157 19 274 379 741Korea, Rep. of 100 1 618 13 354 85 488Malaysia 523 10 242 500 8 167 245 5 748New Zealand 1 208 8 694 1 132 8 535 1 540 9 919Singapore 1 478 46 393 1 409 38 046 1 285 39 963South Africa 30 610 92 546 9 121Spain 1 271 17 825 1 793 23 795 2 028 26 710Thailand 1 927 7 882 1 135 4 585 2 606 8 700United States 4 889 152 076 4 268 125 706 3 841 127 263Viet Nam 71 596 242 2 672 784 10 054Other 4 737 21 126 3 213 17 016 4 360 25 045
Total 60 161 1 437 863 58 518 1 280 017 57 320 1 201 073
NonedibleChina na 2 216 na 1 084 na 374Chinese Taipei na 2 639 na 2 140 na 1 986France na 9 276 na 3 465 na 1 017Germany na 5 117 na 6 413 na 5 989Hong Kong, China na 77 656 na 170 763 na 136 518Italy na 1 195 na 1 893 na 340Japan na 28 154 na 37 153 na 59 538Korea, Rep. of na 2 655 na 3 041 na 2 030New Zealand na 19 338 na 14 557 na 8 427Philippines na 7 na 456 na 0Singapore na 3 195 na 2 941 na 5 460Switzerland na 2 724 na 2 092 na 8 307Spain na 1 749 na 1 603 na 1 855Thailand na 59 na 1 306 na 618United Kingdom na 7 435 na 11 774 na 8 131United States na 46 543 na 28 890 na 28 014Other na 149 627 na 42 984 na 37 094
Total na 359 586 na 332 556 na 305 698
Total exports na 1 797 449 na 1 612 573 na 1 506 771
na Not available.Note: All tonnages are net product weight exported, all values are "free on board".Source: ABS, International Trade, Australia, cat. no. 5465.0, Canberra.

50 australian fi sheries statistics 2005
expor ts
25 exports of seafood to selected countries, by product a – Australia
2002-03 2003-04 2004-05
t $’000 t $’000 t $’000
Hong Kong, ChinaDried, salted or smoked fish 106 14 792 124 17 187 119 17 926Other fish 553 3 956 603 3 786 671 3 897Rock lobster 3 627 145 422 4 778 157 502 4 348 148 562Prawns 1 413 27 389 929 16 058 695 10 285Crabs 182 2 186 212 2 852 122 1 618Abalone 2 029 100 876 2 773 140 296 2 178 146 539Scallops 803 20 768 1 099 26 202 727 21 976Other 1 055 40 114 747 17 531 360 7 844
Total 9 769 355 503 11 265 381 414 9 220 358 647
JapanTuna (whole) 11 641 311 265 11 990 267 242 9 267 158 176Fillets 266 1 689 219 1 222 194 1 318Dried, salted or smoked fish 26 432 14 305 1 46Other fish 2 727 23 407 2 200 18 011 2 282 18 900Rock lobster 3 293 110 001 3 032 77 459 2 530 70 789Prawns 4 258 115 288 3 252 66 849 3 629 72 624Crabs 418 3 948 552 5 126 478 4 752Abalone 936 52 203 974 45 295 797 51 712Scallops 17 190 17 1 011 0 0Other 244 9 349 232 6 637 97 1 425
Total 23 826 627 772 22 482 489 157 19 274 379 741
SingaporeTuna (whole) 19 197 0 0 0 3Fillets 85 574 27 190 69 604Dried, salted or smoked fish 10 1 991 11 1 323 6 885Canned fish 110 753 134 903 86 447Other fish 180 1 585 197 1 540 316 1 681Rock lobster 284 10 584 309 7 751 218 6 544Prawns 64 1 137 56 932 40 491Crabs 36 799 19 461 24 504Abalone 333 20 530 357 17 525 319 23 074Scallops 246 5 394 249 5 715 181 5 232Other 110 2 851 49 1 707 23 499
Total 1 478 46 393 1 409 38 046 1 285 39 963
Continued
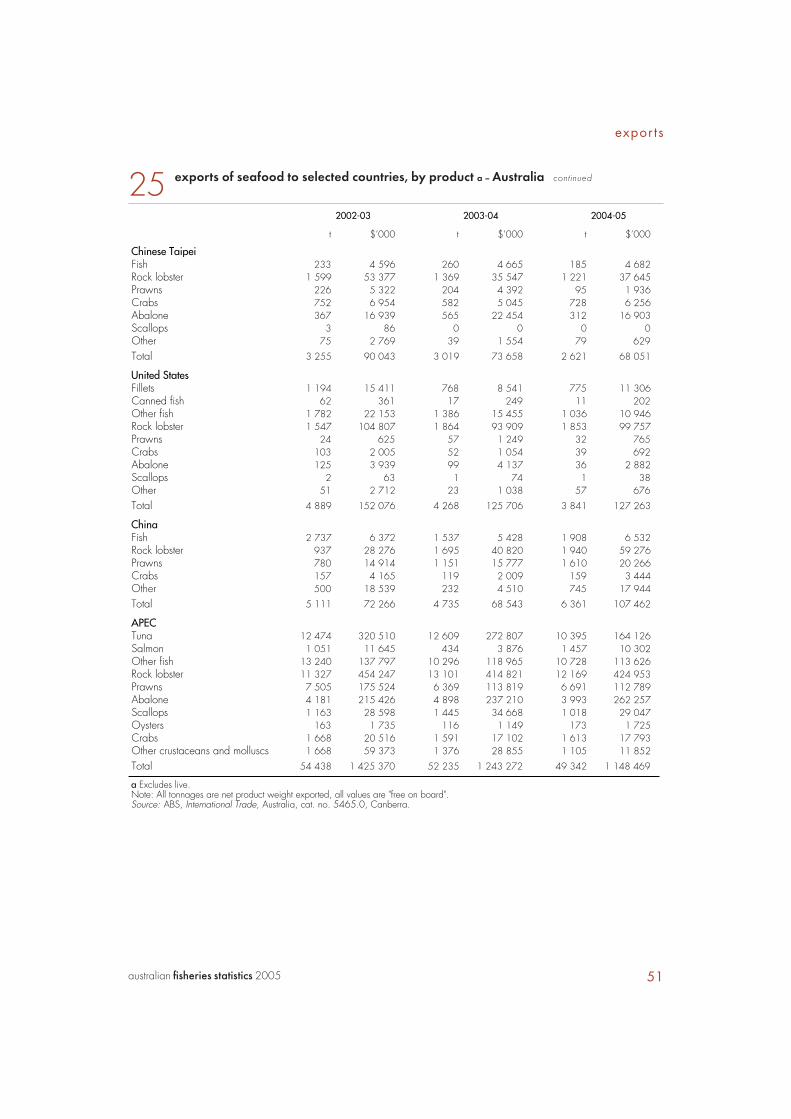
51australian fi sheries statistics 2005
expor ts
2002-03 2003-04 2004-05
t $’000 t $’000 t $’000
Chinese TaipeiFish 233 4 596 260 4 665 185 4 682Rock lobster 1 599 53 377 1 369 35 547 1 221 37 645Prawns 226 5 322 204 4 392 95 1 936Crabs 752 6 954 582 5 045 728 6 256Abalone 367 16 939 565 22 454 312 16 903Scallops 3 86 0 0 0 0Other 75 2 769 39 1 554 79 629
Total 3 255 90 043 3 019 73 658 2 621 68 051
United StatesFillets 1 194 15 411 768 8 541 775 11 306Canned fish 62 361 17 249 11 202Other fish 1 782 22 153 1 386 15 455 1 036 10 946Rock lobster 1 547 104 807 1 864 93 909 1 853 99 757Prawns 24 625 57 1 249 32 765Crabs 103 2 005 52 1 054 39 692Abalone 125 3 939 99 4 137 36 2 882Scallops 2 63 1 74 1 38Other 51 2 712 23 1 038 57 676
Total 4 889 152 076 4 268 125 706 3 841 127 263
ChinaFish 2 737 6 372 1 537 5 428 1 908 6 532Rock lobster 937 28 276 1 695 40 820 1 940 59 276Prawns 780 14 914 1 151 15 777 1 610 20 266Crabs 157 4 165 119 2 009 159 3 444Other 500 18 539 232 4 510 745 17 944
Total 5 111 72 266 4 735 68 543 6 361 107 462
APECTuna 12 474 320 510 12 609 272 807 10 395 164 126Salmon 1 051 11 645 434 3 876 1 457 10 302Other fish 13 240 137 797 10 296 118 965 10 728 113 626Rock lobster 11 327 454 247 13 101 414 821 12 169 424 953Prawns 7 505 175 524 6 369 113 819 6 691 112 789Abalone 4 181 215 426 4 898 237 210 3 993 262 257Scallops 1 163 28 598 1 445 34 668 1 018 29 047Oysters 163 1 735 116 1 149 173 1 725Crabs 1 668 20 516 1 591 17 102 1 613 17 793Other crustaceans and molluscs 1 668 59 373 1 376 28 855 1 105 11 852
Total 54 438 1 425 370 52 235 1 243 272 49 342 1 148 469
a Excludes live.Note: All tonnages are net product weight exported, all values are "free on board".Source: ABS, International Trade, Australia, cat. no. 5465.0, Canberra.
25 exports of seafood to selected countries, by product a – Australia continued

52 australian fi sheries statistics 2005
expor ts
26 seafood exports in 2002-03, by state a – Australia
NSW Vic. Qld WA SA Tas. NT Aust. b
Value $’000 $’000 $’000 $’000 $’000 $’000 $’000 $’000FishLive 1 684 1 555 43 446 0 4 302 0 46 991Fresh, chilled or frozen
Whole 17 491 2 853 49 967 26 150 267 067 12 207 777 376 677Fillets 211 1 187 1 119 1 442 4 238 15 909 41 24 455
Other 1 532 4 060 23 070 3 417 346 2 090 266 37 078
Total fish 20 918 9 656 117 602 31 009 271 655 30 509 1 083 485 201
Crustaceans and molluscsRock lobster 3 005 8 395 21 591 324 717 77 058 27 880 0 463 106Prawns 11 796 468 108 480 35 827 34 509 29 32 208 245Abalone 15 750 55 870 266 6 741 48 376 89 113 0 216 115Scallops 38 2 037 11 882 14 484 190 3 0 28 686Oysters 116 8 6 9 593 999 0 1 742Crabs 26 307 13 813 4 169 1 530 955 259 21 087Other 524 18 451 7 847 4 408 14 763 13 966 1 60 672
Total 31 254 85 535 163 885 390 355 177 019 132 945 293 999 654
Total value 52 172 95 190 281 487 421 365 448 674 163 454 1 376 1 484 854
Quantity t t t t t t t tFishLive na na na na na na na naFresh, chilled or frozen
Whole 1 805 411 5 545 6 552 7 865 1 745 136 24 096Fillets 20 117 112 181 241 2 507 13 3 237
Other 189 474 1 074 278 20 403 3 2 719
Total fish 2 014 1 003 6 731 7 011 8 126 4 655 152 30 052
Crustaceans and molluscsRock lobster 48 168 408 8 470 1 805 627 0 11 535Prawns 568 46 5 145 1 494 1 422 0 1 9 532Abalone 298 1 543 13 72 784 1 484 0 4 193Scallops 1 35 416 694 17 0 0 1 165Oysters 10 1 1 1 73 77 0 163Crabs 3 16 1 402 214 38 22 15 1 714Other 69 447 203 290 423 319 0 1 807
Total 997 2 256 7 588 11 235 4 562 2 528 17 30 109
Total quantity 3 011 3 259 14 319 18 247 12 688 7 183 169 60 161
a State totals include Commonwealth fisheries exports. Exports are identified according to source state or territory, not state or territory in which the product was caught or farmed. b Includes Australian Capital Territory. na Not available.Note: All tonnages are net product weight exported, all values are "free on board".Source: ABS, International Trade, Australia, cat. no. 5465.0, Canberra.

53australian fi sheries statistics 2005
expor ts
27 seafood exports in 2003-04, by state a – Australia
NSW Vic. Qld WA SA Tas. NT Aust. b
Value $’000 $’000 $’000 $’000 $’000 $’000 $’000 $’000FishLive 1 397 685 37 120 0 13 100 0 39 316Fresh, chilled or frozen
Whole 10 169 1 531 32 398 13 682 244 286 7 527 613 311 085Fillets 202 818 971 2 932 2 255 8 446 1 17 007
Other 2 910 7 862 23 758 3 442 844 660 423 42 573
Total fish 14 678 10 896 94 248 20 057 247 398 16 733 1 037 409 980
Crustaceans and molluscsRock lobster 1 942 16 698 25 642 293 158 67 273 21 974 0 426 833Prawns 17 122 609 80 771 20 592 28 808 1 0 160 603Abalone 11 180 65 616 998 11 252 53 374 95 217 42 237 680Scallops 4 1 045 14 432 19 171 44 2 0 34 916Oysters 40 18 67 3 360 658 0 1 182Crabs 181 1 338 11 831 3 679 46 364 0 17 491Other 343 19 048 3 780 2 263 2 553 1 697 37 30 648
Total 30 812 104 373 137 520 350 119 152 458 119 913 79 909 353
Total value 45 490 115 269 231 768 370 176 399 857 136 647 1 116 1 319 333
Quantity t t t t t t t tFishLive na na na na na na na naFresh, chilled or frozen
Whole 1 282 286 4 350 2 497 9 825 1 975 67 20 434Fillets 8 90 250 263 168 1 479 0 2 779
Other 293 993 357 544 48 174 6 2 757
Total fish 1 583 1 368 4 957 3 304 10 041 3 628 73 25 970
Crustaceans and molluscsRock lobster 57 461 623 9 826 1 893 589 0 13 453Prawns 1 082 53 4 552 1 238 1 576 0 0 9 396Abalone 262 1 625 30 123 1 032 1 838 0 4 910Scallops 0 25 550 868 2 0 0 1 464Oysters 4 1 4 0 43 63 0 119Crabs 35 37 1 264 266 1 9 0 1 616Other 35 861 154 108 295 42 1 1 592
Total 1 475 3 063 7 177 12 428 4 842 2 542 1 32 548
Total quantity 3 058 4 431 12 134 15 732 14 883 6 170 74 58 518
a State totals include Commonwealth fisheries exports. Exports are identified according to source state or territory, not state or territory in which the product was caught or farmed. b Includes Australian Capital Territory. na Not available.Note: All tonnages are net product weight exported, all values are "free on board".Source: ABS, International Trade, Australia, cat. no. 5465.0, Canberra.

54 australian fi sheries statistics 2005
expor ts
28 seafood exports in 2004-05, by state a – Australia
NSW Vic. Qld WA SA Tas. NT Aust. b
Value $’000 $’000 $’000 $’000 $’000 $’000 $’000 $’000FishLive 1 151 1 086 32 520 0 121 68 0 34 946Fresh, chilled or frozen
Whole 9 247 1 226 30 010 15 407 141 751 11 166 602 209 555Fillets 242 1 967 1 533 989 2 830 10 331 0 18 612
Other 3 477 3 472 25 641 3 392 829 257 294 41 261
Total fish 14 117 7 751 89 703 19 788 145 531 21 823 896 304 375
Crustaceans and molluscsRock lobster 4 904 21 141 25 977 295 657 68 267 22 873 0 439 575Prawns 12 095 116 82 563 24 292 27 796 0 228 163 104Abalone 8 051 93 170 1 425 8 480 59 266 92 757 0 263 150Scallops 4 2 764 20 482 8 476 61 176 0 32 566Oysters 67 30 8 19 612 930 0 1 746Crabs 20 2 013 12 366 3 532 96 80 12 18 180Other 651 5 410 3 563 1 335 453 544 35 13 324
Total 25 792 124 643 146 383 341 791 156 551 117 361 275 931 644
Total value 39 910 132 395 236 087 361 579 302 083 139 184 1 171 1 236 019
Quantity t t t t t t t tFishLive na na na na na na na naFresh, chilled or frozen
Whole 1 373 377 4 679 3 266 8 304 2 270 84 20 406Fillets 21 129 225 105 267 1 688 0 2 537
Other 421 550 512 622 39 44 31 2 988
Total fish 1 814 1 056 5 416 3 993 8 609 4 003 115 25 931
Crustaceans and molluscsRock lobster 127 574 615 8 879 1 843 581 0 12 636Prawns 843 10 5 205 1 529 1 469 0 23 10 302Abalone 163 1 418 12 78 678 1 655 0 4 004Scallops 0 165 660 304 2 28 0 1 209Oysters 7 4 0 1 71 85 0 174Crabs 1 51 1 314 260 2 2 1 1 638Other 172 623 143 133 91 60 7 1 427
Total 1 313 2 845 7 950 11 183 4 157 2 411 30 31 389
Total quantity 3 127 3 901 13 366 15 176 12 767 6 414 145 57 320
a State totals include Commonwealth fisheries exports. Exports are identified according to source state or territory, not state or territory in which the product was caught or farmed. b Includes Australian Capital Territory. na Not available.Note: All tonnages are net product weight exported, all values are "free on board".Source: ABS, International Trade, Australia, cat. no. 5465.0, Canberra.

55australian fi sheries statistics 2005
impor ts
29 imports of fi sheries products – Australia
2002-03 2003-04 2004-05
t $’000 t $’000 t $’000
EdibleFishLive fish na 6 na 19 na 5Fresh, chilled or frozen
Fresh or chilled whole 4 834 28 610 5 925 34 269 5 336 33 934Frozen whole 11 492 23 993 11 281 20 992 9 245 19 768Fresh or chilled fillets 376 2 430 307 1 898 346 2 543Frozen fillets 36 305 203 624 39 323 193 650 38 133 187 017Other 7 082 24 514 7 639 22 861 6 788 19 041
Canned fish 47 398 218 762 58 804 186 148 53 443 188 745Smoked, dried or salted fish 2 801 26 263 2 811 30 459 2 957 34 053Other fish preparations 13 453 62 352 12 474 54 510 14 508 62 181
Total a 123 742 590 553 138 564 544 806 130 756 547 285
Crustaceans and molluscsFresh, chilled or frozen b
Prawns 13 114 174 850 18 865 183 575 22 608 201 303Lobster 484 11 060 444 7 088 469 8 132Scallops 2 024 24 241 2 104 22 027 2 297 27 458Oysters 792 6 926 749 6 797 910 6 975Mussels 1 972 9 170 2 188 8 095 2 117 9 139Other 13 273 59 637 14 745 60 555 14 815 71 705
Canned 4 446 29 662 4 798 28 071 5 188 31 144Extracts and pastes 0 0 0 0 0 0Other 4 826 44 092 5 557 43 904 7 173 56 195
Total 40 931 359 638 49 449 360 112 55 576 412 051
Total edible a 164 673 950 192 188 014 904 918 186 332 959 336
NonediblePearls na 162 902 na 145 107 na 145 851Fish meal na 27 078 na 19 332 na 20 923Ornamental fish na 3 870 na 4 087 na 4 749Marine fats and oils na 13 719 na 9 446 na 15 268Other marine products na 44 063 na 23 488 na 25 833
Total nonedible na 251 631 na 201 459 na 212 625
Total fisheries products na 1 201 823 na 1 106 377 na 1 171 961
a Excludes live tonnage, but includes live value. b Includes dried and salted. na Not available.Note: All tonnages are net product imported, all values are "value for duty".Source: ABS, International Trade, Australia, cat. no. 5465.0, Canberra.

56 australian fi sheries statistics 2005
impor ts
30 imports of fi sh – Australia
2002-03 2003-04 2004-05
t $’000 t $’000 t $’000
SalmonSmoked 623 10 810 988 16 108 1 158 19 522Whole
Frozen 310 819 144 1 092 135 918Fresh or chilled 359 2 518 557 4 443 476 3 834
Canned 9 101 53 740 9 376 46 587 9 249 44 239
Total 10 392 67 888 11 066 68 230 11 018 68 513
HakeFrozen
Fillets 7 862 39 762 7 541 36 194 7 938 37 152Whole 4 26 2 9 5 29Mince 1 323 4 353 734 1 352 1 360 2 769
Total 9 190 44 141 8 277 37 555 9 303 39 950
TunaWhole
Fresh or chilled 146 665 1 350 3 621 315 1 103Frozen 4 068 4 366 3 088 3 067 18 122
Canned 29 700 118 506 42 970 103 062 37 155 106 443
Total 33 914 123 537 47 408 109 750 37 488 107 669
Other fishLive na 6 na 19 na 5Fresh or chilled whole 4 330 25 427 4 018 26 204 4 545 28 997Frozen whole 7 110 18 781 8 048 16 824 9 086 18 698Fresh or chilled fillets 376 2 430 307 1 898 346 2 543Frozen fillets 28 443 163 861 31 782 157 456 30 195 149 864Other fresh, chilled or frozen products 5 760 20 161 6 905 21 509 5 428 16 272Other canned fish
Herrings 855 4 529 761 3 668 772 3 554Sardines 5 170 25 942 3 495 19 243 4 183 20 339Anchovy 755 9 044 859 9 233 927 10 210Mackerel 1 061 3 450 1 037 2 911 953 3 004Other 756 3 550 306 1 445 204 956
Total 8 597 46 515 6 458 36 500 7 039 38 062
SmokedHerrings 65 410 66 386 47 296Liver and roes 4 96 36 165 11 228Other 1 192 5 696 800 4 673 968 5 764
Total 1 261 6 202 902 5 224 1 025 6 288
Dried 563 7 406 629 7 664 567 6 835Salted 354 1 845 292 1 462 208 1 408Other fish preparations
Fish meal 10 99 12 65 13 64Fishballs, fishcake, sausages 1 881 7 730 1 884 7 163 2 236 8 284Caviar and pastes 83 1 603 94 1 576 105 1 934Other 11 479 52 920 10 484 45 706 12 155 51 899
Total 13 453 62 352 12 474 54 510 14 508 62 181
Total other fish a 70 246 354 987 71 814 329 271 72 947 331 154
Total fish a 123 742 590 553 138 564 544 806 130 756 547 285
a Excludes live tonnage but includes live value. na Not available.Note: All tonnages are net product imported, all values are "value for duty".Source: ABS, International Trade, Australia, cat. no. 5465.0, Canberra.

57australian fi sheries statistics 2005
impor ts
31 imports of crustaceans and molluscs – Australia
2002-03 2003-04 2004-05
t $’000 t $’000 t $’000
Canned and preservedCrabs 385 3 054 321 2 233 343 2 267Prawns 5 032 45 386 5 584 44 020 7 247 56 491Smoked molluscs 655 7 457 954 7 052 844 6 184Other molluscs 3 137 17 505 3 464 18 502 3 883 22 195Extracts and pastes 0 0 0 0 0 0Other preserved 62 353 32 167 43 201
Total 9 271 73 754 10 355 71 975 12 360 87 339
OtherPrawns
Fresh, chilled or frozen 13 086 174 484 18 860 183 537 22 590 201 187Other 29 365 5 38 18 116
Lobster 484 11 060 444 7 088 469 8 132Scallops 2 024 24 241 2 104 22 027 2 297 27 458Oysters 792 6 926 749 6 797 910 6 975Mussels 1 972 9 170 2 188 8 095 2 117 9 139Crabs 177 1 582 223 1 632 343 3 216Calamari, squid and octopus 11 845 46 076 13 248 48 456 13 516 58 510Other 1 251 11 979 1 275 10 468 956 9 979
Total 31 659 285 885 39 095 288 137 43 216 324 712
Total crustaceans and molluscs 40 931 359 638 49 449 360 112 55 576 412 051
Note: All tonnages are net product imported, all values are "value for duty".Source: ABS, International Trade, Australia, cat. no. 5465.0, Canberra.

58 australian fi sheries statistics 2005
impor ts
32 imports of edible fi sh, by source – Australia
2002-03 2003-04 2004-05
t $’000 t $’000 t $’000
Fish (excluding canned)TunaIndonesia 2 4 2 23 8 70Japan 1 850 1 938 62 140 0 1New Zealand 2 211 2 416 3 889 3 694 99 132Papua New Guinea 120 570 86 346 79 298Singapore 0 0 0 0 0 0Thailand 3 18 50 83 0 0Other 27 85 349 2 403 147 723
Total 4 214 5 031 4 438 6 689 333 1 225
SalmonCanada 48 113 0 1 24 51Denmark 557 9 707 829 13 779 860 15 612New Zealand 392 3 168 548 4 857 447 3 971Other 295 1 159 313 3 008 437 4 639
Total 1 291 14 148 1 689 21 644 1 769 24 274
HakeArgentina 173 720 413 1 205 2 084 6 325Chile 1 989 6 475 1 184 2 600 552 1 146Chinese Taipei 0 0 20 75 18 61Namibia 1 548 7 797 1 201 6 132 1 818 8 332New Zealand 1 325 7 061 1 131 6 170 1 035 5 833South Africa 3 976 21 355 3 916 19 912 3 004 15 115Thailand 47 189 19 68 2 7Uganda 0 0 0 0 0 0Other 132 545 394 1 394 789 3 130
Total 9 190 44 141 8 277 37 555 9 303 39 950
OtherChile 3 265 10 561 3 798 10 600 2 528 7 619New Zealand 25 038 129 213 22 349 113 119 20 079 103 352South Africa 2 961 16 407 2 461 13 700 3 441 16 134Thailand 6 830 28 673 7 698 27 459 8 432 28 556Viet Nam 4 488 23 768 6 487 28 888 9 381 40 639Other 21 572 110 796 24 562 106 537 22 792 99 541
Total 64 154 319 417 67 354 300 303 66 653 295 841
Continued

59australian fi sheries statistics 2005
impor ts
2002-03 2003-04 2004-05
t $’000 t $’000 t $’000
Canned fishCanada 3 534 23 358 3 833 19 911 3 784 19 135Chile 465 1 158 447 1 447 440 1 630China 114 445 110 326 257 743Denmark 135 944 162 729 107 721Germany 422 2 494 380 2 135 364 2 150Greece 152 1 184 102 744 123 971Indonesia 170 938 111 368 128 379Italy 483 5 280 689 6 423 559 5 439Japan 247 954 475 1 712 131 540Korea, Rep. of 899 4 444 691 2 734 390 1 557Malaysia 140 547 139 430 126 444Norway 664 7 313 461 6 487 255 3 568Philippines 214 510 158 406 427 1 150Portugal 148 678 172 883 426 1 255Spain 87 1 509 101 1 518 69 1 482Thailand 30 142 118 569 44 266 108 463 38 872 111 617United Kingdom 514 5 156 342 3 262 502 4 656United States 5 385 27 755 5 055 22 146 5 037 21 322Other 3 485 15 527 1 109 6 026 1 447 9 987
Total 47 398 218 762 58 804 186 148 53 443 188 745
Note: All tonnages are net product imported, all values are "value for duty".Source: ABS, International Trade, Australia, cat. no. 5465.0, Canberra.
32 imports of edible fi sh, by source – Australia continued

60 australian fi sheries statistics 2005
impor ts
33 imports of fresh, chilled or frozen fi sh, by source – Australia
2002-03 2003-04 2004-05
t $’000 t $’000 t $’000
Fresh or chilled fishWholeIndonesia 179 226 0 1 35 149New Zealand 4 434 27 349 5 347 30 322 4 945 31 742Papua New Guinea 120 570 86 347 79 298Solomon Islands 0 0 306 2 199 3 28Viet Nam 35 168 17 71 3 15Other 66 297 169 1 329 270 1 701
Total 4 834 28 610 5 925 34 269 5 336 33 934
FilletsIndonesia 24 181 18 192 119 1 060New Zealand 267 1 897 198 1 308 151 1 096South Africa 0 0 17 90 27 145Other 85 352 73 308 49 242
Total 376 2 430 307 1 898 346 2 543
Frozen fishWholeTuna
Indonesia 2 4 2 23 8 70Japan 1 850 1 938 62 140 0 1New Zealand 2 208 2 397 2 956 2 746 0 0Singapore 0 0 0 0 0 0Thailand 3 18 50 83 0 0Other 5 10 17 75 10 51
Total 4 068 4 366 3 088 3 067 18 122
SalmonDenmark 0 0 2 8 0 0New Zealand 4 27 28 180 26 145Norway 10 70 72 502 20 116Other 295 722 44 402 89 657
Total 310 819 144 1 092 135 918
OtherChina 518 2 443 464 2 144 429 2 069Indonesia 1 696 1 649 888 889 423 639Japan 20 167 18 71 15 64Netherlands 61 140 0 0 0 0New Zealand 2 627 7 615 2 133 5 885 2 028 6 036Singapore 19 74 42 89 0 2South Africa 115 168 250 118 822 255Thailand 369 1 088 477 1 047 553 1 204United Kingdom 28 64 30 61 17 48United States 261 235 1 333 440 2 538 2 143Other 1 400 5 164 2 414 6 090 2 266 6 268
Total 7 114 18 808 8 049 16 833 9 091 18 727
Continued

61australian fi sheries statistics 2005
impor ts
33 imports of fresh, chilled or frozen fi sh, by source – Australia continued
2002-03 2003-04 2004-05
t $’000 t $’000 t $’000
Frozen fish (continued)FilletsHake
Argentina 172 718 363 1 089 1 337 4 634Chile 735 2 395 703 1 812 230 561Kenya 52 246 0 0 0 0Namibia 1 548 7 797 1 201 6 132 1 818 8 332New Zealand 1 292 6 949 993 5 906 742 5 328South Africa 3 970 21 305 3 916 19 912 3 004 15 115Thailand 26 117 19 68 2 7Uganda 0 0 0 0 0 0Other 68 236 348 1 276 805 3 176
Total 7 862 39 762 7 541 36 194 7 938 37 152
OtherArgentina 1 804 6 160 1 818 5 873 1 607 4 557Chile 1 249 4 159 1 177 3 113 962 2 769China 1 380 5 283 1 388 5 357 1 590 5 128Chinese Taipei 1 065 5 598 1 259 7 664 1 852 10 820India 81 344 25 57 41 220Indonesia 926 6 337 788 4 711 684 4 316Kenya 2 050 13 339 2 724 12 125 2 077 8 977Myanmar 719 5 390 1 044 6 705 1 130 7 337Namibia 232 1 335 105 512 188 836Netherlands 11 153 36 305 32 262New Zealand 10 766 65 124 9 628 53 803 7 551 44 594Singapore 114 937 240 1 073 155 909South Africa 1 286 7 768 1 211 7 459 958 5 723Tanzania 442 2 822 375 1 511 335 1 425Thailand 755 5 438 1 066 6 319 1 136 7 177Uganda 1 674 10 931 1 691 7 337 803 3 488United Kingdom 146 829 92 363 117 548Viet Nam 2 814 16 399 5 679 26 127 8 154 35 869Other 930 5 514 1 436 7 045 825 4 907
Total 28 443 163 861 31 782 157 456 30 195 149 864
Note: All tonnages are net product imported, all values are "value for duty".Source: ABS, International Trade, Australia, cat. no. 5465.0, Canberra.

62 australian fi sheries statistics 2005
impor ts
34 imports of dried, salted or smoked fi sh, by source – Australia
2002-03 2003-04 2004-05
t $’000 t $’000 t $’000
Dried or saltedChina 63 707 70 639 49 600Greece 28 178 36 241 35 227Italy 25 179 19 146 3 22Iceland 50 531 49 370 56 438New Zealand 4 463 2 143 1 39Norway 137 1 818 138 1 769 172 1 985Spain 35 190 13 67 0 2Thailand 58 403 62 499 29 194Viet Nam 80 572 102 651 87 483Other 437 4 210 431 4 601 344 4 253
Total 917 9 251 921 9 126 775 8 243
SmokedArgentina 98 368 28 79 15 47Canada 0 0 0 1 0 5Denmark 559 9 750 881 14 698 926 16 725Germany 19 245 1 2 0 1Greece 8 18 11 71 8 53Latvia 20 66 11 33 0 0Netherlands 6 98 0 0 0 1New Zealand 50 790 85 1 286 55 939Philippines 31 177 33 168 31 140South Africa 999 4 646 618 2 978 821 4 132United Kingdom 74 557 55 336 52 364Other 21 296 167 1 681 275 3 402
Total 1 884 17 012 1 890 21 333 2 183 25 810
Total dried, salted or smoked fish 2 801 26 263 2 811 30 459 2 957 34 053
Note: All tonnages are net product imported, all values are "value for duty".Source: ABS, International Trade, Australia, cat. no. 5465.0, Canberra.
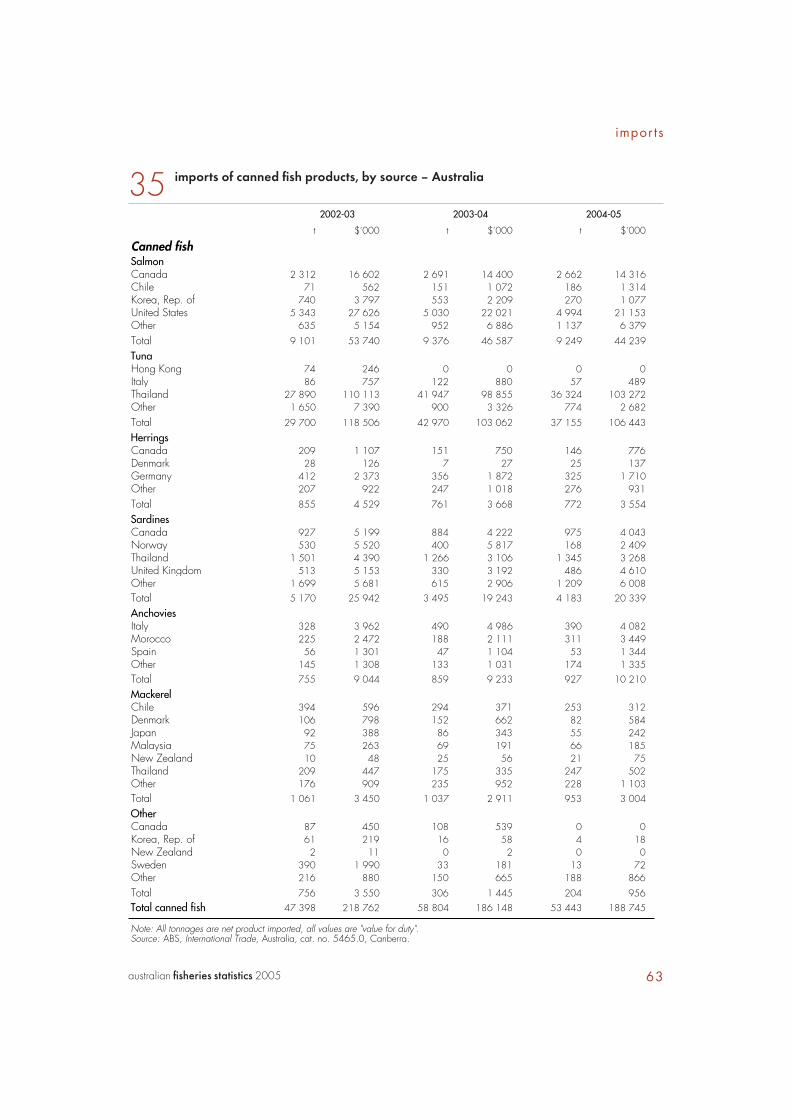
63australian fi sheries statistics 2005
impor ts
35 imports of canned fi sh products, by source – Australia
2002-03 2003-04 2004-05
t $’000 t $’000 t $’000
Canned fishSalmonCanada 2 312 16 602 2 691 14 400 2 662 14 316Chile 71 562 151 1 072 186 1 314Korea, Rep. of 740 3 797 553 2 209 270 1 077United States 5 343 27 626 5 030 22 021 4 994 21 153Other 635 5 154 952 6 886 1 137 6 379
Total 9 101 53 740 9 376 46 587 9 249 44 239
TunaHong Kong 74 246 0 0 0 0Italy 86 757 122 880 57 489Thailand 27 890 110 113 41 947 98 855 36 324 103 272Other 1 650 7 390 900 3 326 774 2 682
Total 29 700 118 506 42 970 103 062 37 155 106 443
HerringsCanada 209 1 107 151 750 146 776Denmark 28 126 7 27 25 137Germany 412 2 373 356 1 872 325 1 710Other 207 922 247 1 018 276 931
Total 855 4 529 761 3 668 772 3 554
SardinesCanada 927 5 199 884 4 222 975 4 043Norway 530 5 520 400 5 817 168 2 409Thailand 1 501 4 390 1 266 3 106 1 345 3 268United Kingdom 513 5 153 330 3 192 486 4 610Other 1 699 5 681 615 2 906 1 209 6 008Total 5 170 25 942 3 495 19 243 4 183 20 339
AnchoviesItaly 328 3 962 490 4 986 390 4 082Morocco 225 2 472 188 2 111 311 3 449Spain 56 1 301 47 1 104 53 1 344Other 145 1 308 133 1 031 174 1 335Total 755 9 044 859 9 233 927 10 210
MackerelChile 394 596 294 371 253 312Denmark 106 798 152 662 82 584Japan 92 388 86 343 55 242Malaysia 75 263 69 191 66 185New Zealand 10 48 25 56 21 75Thailand 209 447 175 335 247 502Other 176 909 235 952 228 1 103Total 1 061 3 450 1 037 2 911 953 3 004
OtherCanada 87 450 108 539 0 0Korea, Rep. of 61 219 16 58 4 18New Zealand 2 11 0 2 0 0Sweden 390 1 990 33 181 13 72Other 216 880 150 665 188 866
Total 756 3 550 306 1 445 204 956Total canned fish 47 398 218 762 58 804 186 148 53 443 188 745
Note: All tonnages are net product imported, all values are "value for duty".Source: ABS, International Trade, Australia, cat. no. 5465.0, Canberra.

64 australian fi sheries statistics 2005
impor ts
36 imports of crustaceans and molluscs, by source – Australia
2002-03 2003-04 2004-05
t $’000 t $’000 t $’000
CrustaceansLobsterFresh, chilled or frozen
Cuba 27 723 0 0 31 576New Zealand 6 192 6 199 1 32Papua New Guinea 73 3 373 89 2 151 79 2 816Thailand 194 2 826 151 2 043 118 1 514United States 82 2 364 0 0 17 359Viet Nam 19 327 3 58 3 35Other 82 1 256 196 2 638 221 2 800
Total lobster 484 11 060 444 7 088 469 8 132
PrawnsFresh, chilled or frozen
China 544 5 704 3 894 28 476 4 034 26 497Chinese Taipei 41 714 102 1 297 92 1 054India 2 763 39 759 2 920 34 872 3 096 32 149Indonesia 1 629 17 501 1 617 13 423 1 669 10 820Malaysia 395 3 889 190 1 783 183 1 826Myanmar 644 6 451 564 4 867 528 4 599New Caledonia 123 2 044 104 1 571 189 2 370Papua New Guinea 161 1 357 196 1 307 59 406Singapore 141 1 608 211 2 083 101 1 063Thailand 3 597 47 027 4 911 44 250 5 741 45 556Viet Nam 2 802 45 441 3 898 47 333 6 260 69 650Other 245 2 990 253 2 275 637 5 196
Total 13 086 174 484 18 860 183 537 22 590 201 187
CannedMalaysia 1 202 10 082 1 089 8 072 1 244 8 215Thailand 3 064 29 341 3 328 27 035 4 035 34 433Viet Nam 167 1 558 319 2 726 437 3 854Other 599 4 404 848 6 187 1 530 9 989
Total 5 032 45 386 5 584 44 020 7 247 56 491
OtherChina 0 1 0 4 16 92Malaysia 0 3 2 12 0 1Thailand 26 334 1 12 0 0Viet Nam 0 0 0 6 0 0Other 2 28 1 4 2 24
Total 29 365 5 38 18 116
Total prawns 18 147 220 236 24 448 227 595 29 855 257 794
CrabsFresh, chilled or frozen
India 0 0 0 1 0 0Malaysia 6 17 15 130 49 359Thailand 5 66 62 294 67 772Viet Nam 126 1 131 94 798 110 966Other 40 369 53 408 117 1 119
Total 177 1 582 223 1 632 343 3 216
CannedThailand 321 2 241 1 225 1Other 64 3 051 79 2 231 118 2 266
Total 385 3 054 321 2 233 343 2 267
Total crabs 563 4 636 543 3 864 687 5 483
Continued

65australian fi sheries statistics 2005
impor ts
36 imports of crustaceans and molluscs, by source – Australia continued
2002-03 2003-04 2004-05
t $’000 t $’000 t $’000
Molluscs (fresh, chilled or frozen)ScallopsChina 654 6 618 928 8 823 1 398 15 250Indonesia 18 144 14 100 8 41Japan 937 12 033 664 7 557 391 6 027New Zealand 13 267 1 20 1 7Peru 12 140 37 316 0 1Thailand 338 4 114 408 4 547 310 3 490Viet Nam 7 64 7 49 20 144Other 46 860 44 614 169 2 497
Total 2 024 24 241 2 104 22 027 2 297 27 458
MusselsChina 13 81 21 123 117 471Denmark 0 0 0 0 0 0New Zealand 1 954 9 065 2 137 7 892 1 925 7 710Other 5 25 30 80 75 958
Total 1 972 9 170 2 188 8 095 2 117 9 139
Calamari, squid and octopusChina 2 996 12 898 3 157 11 676 4 903 23 621Chinese Taipei 2 280 10 042 2 357 8 804 1 608 8 308Hong Kong, China 4 139 9 184 2 51India 88 232 185 435 176 547Indonesia 83 369 138 488 194 795Japan 8 119 27 145 23 174Korea, Rep. of 730 1 585 159 489 143 810Malaysia 569 1 903 665 1 991 654 2 041New Zealand 2 077 9 108 2 915 12 997 2 337 11 272Peru 20 67 68 172 0 0Singapore 56 180 36 134 53 154Thailand 1 723 6 521 1 874 6 872 1 637 6 144United States 207 323 380 850 214 462Viet Nam 746 2 076 1 148 2 814 1 098 2 803Other 258 513 129 402 474 1 329
Total 11 845 46 076 13 248 48 456 13 516 58 510
Crustaceans and molluscs (canned)China 670 4 761 674 3 834 739 4 388Denmark 19 111 4 24 0 0Korea, Rep. of 297 4 164 378 3 564 286 2 549Malaysia 685 4 080 773 4 440 930 5 834New Zealand 1 118 6 051 1 689 9 155 1 655 9 677Singapore 93 680 100 695 86 649Thailand 1 304 7 531 955 4 449 1 190 5 603Other 259 2 284 226 1 909 302 2 443
Total 4 446 29 662 4 798 28 071 5 188 31 144
Note: All tonnages are net product imported, all values are "value for duty".Source: ABS, International Trade, Australia, cat. no. 5465.0, Canberra.

66 australian fi sheries statistics 2005
impor ts
37 imports of fi sheries products, by source – Australia
2002-03 2003-04 2004-05
t $’000 t $’000 t $’000
Edible (excluding live)Argentina 2 249 7 679 2 430 7 713 3 904 11 499Canada 3 677 24 041 3 885 20 171 4 118 20 457Chile 5 743 18 237 5 471 15 050 3 590 10 910China 8 173 44 260 12 442 68 756 15 883 89 946Chinese Taipei 3 856 18 633 4 407 19 928 4 337 23 143Denmark 761 11 422 1 098 15 947 1 058 17 750Germany 466 3 227 425 2 663 392 2 570Hong Kong, China 159 2 103 128 2 153 122 1 926India 3 502 42 068 3 831 37 605 3 566 33 935Indonesia 5 265 31 151 4 271 25 279 4 289 26 165Italy 514 5 506 725 6 700 580 5 676Japan 3 538 20 429 1 821 14 910 1 088 11 708Korea, Rep. of 2 286 12 196 1 678 8 814 1 210 6 886Malaysia 4 423 29 019 4 903 25 777 5 025 26 757Norway 955 10 779 994 12 263 889 10 589New Zealand 34 899 177 332 35 472 168 327 28 541 153 478Philippines 430 1 686 354 1 453 666 2 529Singapore 1 108 6 607 1 342 7 338 1 111 6 039South Africa 6 969 37 874 6 404 33 691 6 517 31 507Spain 228 4 229 212 3 098 129 1 578Thailand 46 402 240 782 62 808 221 649 60 159 236 641United Kingdom 775 6 691 611 4 983 853 7 167United States 6 709 34 193 7 327 26 059 8 623 29 293Viet Nam 8 598 75 913 12 391 84 859 18 171 121 974Other 12 988 84 130 12 585 69 714 11 512 69 209
Total 164 673 950 185 188 014 904 899 186 332 959 331
NonedibleChile na 428 na 574 na 81Chinese Taipei na 3 436 na 2 277 na 927French Polynesia na 2 248 na 2 858 na 1 839Hong Kong, China na 5 265 na 5 193 na 5 462Indonesia na 18 939 na 6 204 na 11 433Japan na 3 146 na 2 510 na 3 307Malaysia na 1 141 na 1 279 na 679Netherlands na 5 539 na 2 741 na 4 344New Zealand na 16 869 na 11 795 na 10 893Peru na 18 817 na 16 198 na 19 460Philippines na 5 078 na 4 921 na 2 733Samoa na 2 478 na 2 862 na 3 313Singapore na 1 693 na 1 616 na 1 609Thailand na 1 537 na 833 na 1 317United States na 17 582 na 8 267 na 10 029Other na 147 436 na 131 330 na 135 199
Total na 251 631 na 201 459 na 212 625
Total imports na 1 201 817 na 1 106 358 na 1 171 956
na Not available.Note: All tonnages are net product imported, all values are "value for duty".Source: ABS, International Trade, Australia, cat. no. 5465.0, Canberra.

67australian fi sheries statistics 2005
impor ts
38 seafood imports from selected countries, by product a– Australia
2002-03 2003-04 2004-05
t $’000 t $’000 t $’000
ChinaFrozen whole fish 518 2 443 465 2 147 429 2 069Canned fish 114 445 110 326 257 743Smoked, dried or salted fish 63 708 70 639 49 611Other fish 663 2 819 949 3 735 964 3 668Prawns 544 5 704 3 894 28 480 4 050 26 589Scallops 654 6 618 928 8 823 1 398 15 250Oysters 47 295 4 105 8 72Mussels 13 81 21 123 117 471Canned crustaceans and molluscs 670 4 761 674 3 834 739 4 388Other crustaceans and molluscs 3 134 13 616 3 361 12 514 5 052 24 201Other 1 753 6 770 1 965 8 029 2 820 11 885
Total 8 173 44 260 12 442 68 756 15 883 89 946
VietnamFrozen whole fish 242 861 328 1 012 506 1 716Canned fish 1 079 5 173 106 672 209 1 071Smoked, dried or salted fish 80 578 102 651 87 483Other fish 162 708 194 593 226 1 012Prawns 2 802 45 441 3 898 47 339 6 260 69 650Scallops 7 64 7 49 20 144Oysters 0 0 0 0 0 0Mussels 0 1 1 5 1 4Canned crustaceans and molluscs 80 568 39 354 41 244Other crustaceans and molluscs 937 3 560 1 290 3 808 1 263 3 969Other 3 209 18 959 6 428 30 376 9 559 43 682
Total 8 598 75 913 12 391 84 859 18 171 121 974
New ZealandFresh and chilled whole fish 4 434 27 349 5 347 30 322 4 945 31 742Frozen whole fish 4 839 10 039 5 117 8 812 2 053 6 181Fresh and chilled fillets 267 1 897 198 1 308 151 1 096Frozen fillets 12 057 72 073 10 621 59 709 8 293 49 922Canned fish 18 112 32 97 25 101Smoked, dried or salted fish 54 1 254 86 1 429 55 978Other fish 5 001 22 555 3 583 17 690 3 598 17 345Lobster 6 192 6 199 1 32Scallops 13 267 1 20 1 7Squid 2 077 9 108 2 915 12 997 2 337 11 272Oysters 685 5 933 674 5 981 872 6 631Mussels 1 954 9 065 2 137 7 892 1 925 7 710Canned crustaceans and molluscs 1 118 6 051 1 689 9 155 1 655 9 677Other crustaceans and molluscs 61 4 708 100 4 097 63 4 754Extracts and pastes 0 0 0 0 0 0Other 2 315 6 729 2 967 8 618 2 565 6 029
Total 34 899 177 332 35 472 168 327 28 541 153 478
Continued

68 australian fi sheries statistics 2005
impor ts
38 seafood imports from selected countries, by product a – Australia continued
2002-03 2003-04 2004-05
t $’000 t $’000 t $’000
ThailandFrozen whole fish 372 1 106 527 1 130 553 1 204Fillets 26 117 19 68 4 17Canned fish 30 142 118 569 44 266 108 463 38 872 111 617Smoked, dried or salted fish 59 404 62 501 29 196Other fish 3 915 14 689 3 746 11 957 5 462 15 814Prawns 3 623 47 361 4 913 44 262 5 741 45 556Lobster 194 2 826 151 2 043 118 1 514Scallops 338 4 114 408 4 547 310 3 490Mussels 1 2 16 30 18 36Canned crustaceans and molluscs 1 304 7 531 955 4 449 1 190 5 603Other crustaceans and molluscs 2 382 9 400 2 667 9 827 2 169 8 696Extracts and pastes 0 0 0 0 0 0Other 4 045 34 663 5 077 34 371 5 694 42 898
Total 46 402 240 782 62 808 221 649 60 159 236 641
United StatesFrozen whole fish 509 844 1 333 440 2 538 2 143Frozen fillets 128 707 253 1 256 255 1 228Canned fish 5 385 27 755 5 055 22 146 5 037 21 322Smoked, dried or salted fish 0 0 12 48 0 0Other fish 117 853 66 454 59 438Scallops 22 333 18 264 102 1 717Canned crustaceans and molluscs 1 11 0 0 0 0Other crustaceans and molluscs 208 344 389 992 215 486Other 340 3 344 200 459 418 1 960
Total 6 709 34 193 7 327 26 059 8 623 29 293
APEC regionFresh and chilled whole fish 4 733 28 146 5 440 30 686 5 083 32 259Frozen whole fish 10 336 20 093 9 770 16 134 7 181 14 719Fresh and chilled fillets 355 2 338 258 1 613 280 2 208Frozen fillets 16 595 97 361 15 900 87 526 14 453 81 707Canned fish 40 956 178 057 54 904 156 758 49 206 157 103Smoked, dried or salted fish 496 5 486 573 6 368 412 5 267Other fish 12 106 54 848 10 998 47 837 12 954 52 846Prawns 4 26 2 9 3 16Lobster 425 9 838 409 6 676 372 6 880Scallops 2 005 24 037 2 037 21 438 2 226 26 805Oysters 792 6 926 749 6 797 910 6 975Mussels 1 971 9 166 2 175 8 051 2 107 9 084Canned crustaceans and molluscs 4 305 28 567 4 701 27 107 5 088 30 310Other crustaceans and molluscs 11 863 54 210 13 000 54 576 12 771 64 189Extracts and pastes 0 0 0 0 0 0Other 14 601 132 416 20 761 146 808 22 744 152 315Total 121 544 651 514 141 677 618 383 135 789 642 686
a Excludes live imports.Note: All tonnages are net product imported, all values are "value for duty".Source: ABS, International Trade, Australia, cat. no. 5465.0, Canberra.