tourism snapshot - destination canada · · 2017-10-30tourism snapshot august 2017 | 1 august...
TRANSCRIPT

Tourism Snapshot August 2017 | 1
August 2017Volume 13, Issue 8
www.destinationcanada.com
Tourism SnapshotA Monthly Monitor of the Performance of Canada’s Tourism Industry
2 | Tourism Snapshot August 2017
• In August 2017, overnight arrivals from the United States rebounded +6.0%, year-over-year. This performance was supported by robust increases in arrivals by air (+8.7%), automobile (+3.4%), and other modes of transport (+13.2%), across all provinces and territories except British Columbia and Nova Scotia.
• Year-to-date, overnight arrivals from Destination Canada’s core international markets were up 4.3%. A strong US performance in August provided momentum to improve growth over the first 8 months of 2017 to +2.7% year-over-year. Among Destination Canada’s core overseas markets (+10.4%), Latin-America (+41.8%) and Asia-Pacific (+12.0%) led the way year-to-date with double digit-gains, which were followed by more subdued gains from Europe (+2.3%).
• Destination Canada’s Latin American markets (+32.1%) continued to show robust gains in overnight arrivals in August 2017, contributing the largest net increase in overnight visitors among Destination Canada’s three overseas regions. With the eTA replacing the visa requirement in December 2016 and a 92% increase in direct airlift from Mexico City, arrivals from Mexico jumped 43.4% in August 2017. Changes in visa requirements for Brazilian citizens also supported a 6.8% gains in visitors from Brazil. Over the first eight months of 2017, tourist arrivals from Mexico and Brazil were up 53.1% and 17.0%, respectively.
• Strong performances from France (+11.7%) and Germany (+7.1%) were largely offset by a contraction in overnight arrivals from the UK (-9.2%) in August 2017, despite the UK achieving its second highest level ever in overnight arrivals for the month of August. Extraordinary gains in August 2016 (+29%) relative to August 2015 masked favorable gains in August 2017 relative to 2015 (+17%). Year-to-date, overnight arrivals from the UK are down (-1.6%), but up from France (+5.7%) and from Germany (+6.0%) are in line with expectations.
• Arrivals from Destination Canada’s Asia-Pacific region (+4.3%) showed mixed results in August 2017. A key driver of this subdued performance was a net decline in overnight arrivals to Canada via the United States by air, land or sea (-5.3%), which offset improvements in arrivals by air direct from overseas (+10.9%). This contrast in arrivals was most noteworthy with respect to Japan (+3.1% direct air, -19.0% via US), China (+16.7% direct air, -6.0% via the US) and Australia (+24.1% direct air, -2.0% via the US).
KEY HIGHLIGHTS
QUICK LINKS
1. Note the following caveat from Statistics Canada associated to the August 2017 data: “The most recent data for the following airports are preliminary estimates that will be revised in a future release: Macdonald-Cartier, Ottawa (since March 2017), Vancouver (since April 2017) and Toronto International Airport T3 (since June 2017). Since these estimates contribute to provincial and national totals, these totals will also be revised.”

Tourism Snapshot August 2017 | 3
Industry Performance Dashboard
August 2017 YTD
Overnight Arrivals1
Total International 4.9% 4.3%
11 DC Markets** 5.6% 4.3%
United States 6.7% 2.7%
10 Overseas Markets 4.3% 10.4%
Non-DC Markets -0.4% 4.5%
Air Seat Capacity2
Total International 3.9% 3.3%
11 DC Markets** 6.3% 6.4%
Non-DC Markets 2.1% 0.9%
National Hotel Indicators3
Occupancy Rate* 2.8 1.6
Revenue Per Available Room (Revpar) 7.4% 5.0%
Average Daily Rate (ADR) 11.2% 7.6%
Notes:The Industry Performance Dashboard figures are year-on-year variations. * Percentage point variations.** The 11 DC markets are US, France, Germany, UK, Australia, China, India, Japan, South Korea, Brazil and Mexico.
Sources:1. Statistics Canada, Frontier counts, custom tabulations2. IATA-Diio SRS Analyser3. CBRE Hotels with reproduction and use of information subject to CBRE Disclaimer / Terms of Use as detailed at www.cbre.ca.

4 | Tourism Snapshot August 2017
Overnight Arrivalsi Arrival YOY
Variations (%)Air Seat
capacityii Local currency
vs. CADiii
Market August 2017 YTD 2017 August 2017 YTD 2017 August
2017 YTD 2017August 2017
Average
YTD Average
United States
United States 2,066,968 10,107,491 6.0% 2.7% 5.8% 3.3% -3.0% -0.6%
DC Europe
France 100,266 396,364 11.7% 5.7% -3.1% 2.5% 2.3% -1.6%
Germany 63,390 262,831 7.1% 6.0% 11.3% 10.9% 2.3% -1.6%
United Kingdom 126,263 564,657 -9.2% -1.6% -1.9% 3.5% -4.0% -10.1%
DC Asia-Pacific
Australia 46,899 254,722 6.5% 15.0% -11.4% 45.0% 0.6% 2.5%
China 99,104 478,021 10.0% 11.5% 20.1% 31.3% -3.2% -4.5%
India 27,023 183,019 0.8% 19.0% 75.2% 55.0% 1.5% 2.2%
Japan 43,646 199,628 -4.3% 3.2% 6.1% 9.8% -10.6% -3.1%
South Korea 29,637 187,126 0.1% 13.2% -1.8% 24.6% -4.7% 2.0%
DC Latin America
Brazil 12,342 90,565 6.8% 17.0% -32.0% -29.1% -1.3% 12.0%
Mexico 36,842 259,569 43.4% 53.1% 92.3% 59.7% 0.5% -4.8%
Total 11 DC Markets 2,652,380 12,983,993 5.6% 4.3%
Rest of the World 313,922 1,661,170 -0.4% 4.5%
Total International 2,966,302 14,645,163 4.9% 4.3%
Sources:i. Statistics Canada, Frontier counts, custom tabulationsii. IATA-Diio SRS Analyseriii. Bank of Canada
Notes: i. Arrival figures are preliminary estimates and are subject to change.ii. Air seat capacity is the variation in the total number of seats on direct commercial scheduled flights during the current month and YTD relative to the same periods
in the previous year.iii. The exchange rate variation is calculated on the average value of the Canadian dollar during during the current month and YTD relative to the same periods in the
previous year.
MARKET MONITOR SUMMARY

Tourism Snapshot August 2017 | 5
UNITED STATES
JAN FEB MAR APR MAY JUN JUL AUG SEP OCT NOV DEC
OVER
NIG
HT A
RRIV
ALS
(000
s)
20172016
PEAK: AUGUST 2002
0
500
1,000
1,500
2,000
2,500
3,000
United States: Key Indicators
Air Seat CapacityiAugust 2017 5.8%
YTD 3.3%
Exchange RateiiAugust 2017 -3.0%
YTD -0.6%
Consumer Confidence Index (1985=100)iii
August 2017 120.0
Previous Month 117.3
YTD Arrival Peakiv
Previous Peak Year 2002
Current % of Previous Peak
84.6%
Source:i. IATA-Diio SRS Analyser, Year-on-year % variance.ii. Bank of Canada, Year on year % variance.iii. Consumer Confidence Index, the Conference Board (USA).iv. Statistics Canada, Frontier counts, custom tabulations.
Trend Plot: Total United States Arrivals
Overnight Arrivals
August 2017 YTD 2017
Arrivals % YOY Variance Arrivals % YOY
Variance
Automobile 1,234,447 3.4 5,754,198 0.1
Air 578,961 8.7 3,289,960 5.9
Other 253,560 13.2 1,063,333 7.7
US Total 2,066,968 6.0 10,107,491 2.7
Source: Statistics Canada, Frontier counts, custom tabulations.Note: The figures are preliminary estimates and are subject to change.
US Arrivals to Canada
CURRENT MONTH:
+6.0% YOY
YTD:
+2.7% YOY

6 | Tourism Snapshot August 2017
• Following a slight downward shift in July 2017, US overnight arrivals rebounded +6.0% year-over-year in August 2017, driven by increased arrivals by all modes of entry – auto (+3.4%), air (+8.7%), and other (+13.2%).
• Year-to-date US arrivals were also up (+2.7%), with all modes of arrival on par or above 2016 levels over the same period. With just over 10 million visitors from January to August 2017, arrivals over this period were the highest recorded since 2005.
• This growth was supported by the ongoing expansion of air capacity between Canada and the US (+5.8% in August, +3.3% YTD), persisting despite the downward trend in the strength of the US dollar relative to the Canadian dollar in August 2017 (-3.0% relative to August 2016).
1 States of origin information is based on Integrated Primary Inspection Lane data collected from US residents entering Canada in automobiles with license plate registered in the United States.
• In August 2017, the largest proportion of US overnight arrivals by vehicle1 originated from New York (19.0% of August US auto arrivals), Washington (11.7%), and Michigan (10.2%), with the same states leading cross-border traffic year-to-date.
• Following a jump in July 2017, the consumer confidence index published by the US Conference Board remained that strength in August 2017 (120.4, up 0.4 points).
UNITED STATES

Tourism Snapshot August 2017 | 7
EUROPE
JAN FEB MAR APR MAY JUN JUL AUG SEP OCT NOV DEC
OVER
NIG
HT A
RRIV
ALS
(000
s)
20172016
0
50
100
150
200
250
300PEAK: AUGUST 2017
Trend Plot: Total DC Europe Arrivals
DC Europe: Key Indicators
France GermanyUnited
Kingdom
Air Seat Capacityi
August 2017
-3.1% 11.3% -1.9%
YTD 2.5% 10.9% 3.5%
Exchange Rateii
August 2017
2.3% 2.3% -4.0%
YTD -1.6% -1.6% -10.1%
YTD Arrival Peakiii
Previous Peak Year
2016 1996 2005
Current % of Previous Peak
105.7% 80.7% 89.5%
Sources:i. IATA-Diio SRS Analyser, Year-on-year % variance.ii. Bank of Canada, Year on year % variance.iii. Statistics Canada, Frontier counts, custom tabulations.
Overnight Arrivals
August 2017 YTD 2017
Arrivals % YOY Variance Arrivals % YOY
Variance
DC Europe 289,919 0.7 1,223,852 2.3
United Kingdom 126,263 -9.2 564,657 -1.6
France 100,266 11.7 396,364 5.7
Germany 63,390 7.1 262,831 6.0
Other Europe 165,740 15.9 776,945 19.6
Italy 34,820 16.1 96,585 4.2
Netherlands 18,617 -11.3 100,420 1.5
Spain 20,685 11.1 68,211 11.1
Switzerland 18,561 -2.0 91,781 -3.4
Rest of Europe 73,057 2.0 419,948 6.2
Total Europe 455,659 1.7 2,000,797 3.1
Source: Statistics Canada, Frontier counts, custom tabulations.Note: The figures are preliminary estimates and are subject to change.
UK
FRANCE
GERMANY
DC Markets
ASIA-PACIFIC
DC EUROPEUS
DC LATIN-AMERICA
Other Europe
Europe Arrivals to Canada
CURRENT MONTH:
+0.7% YOY
YTD:
+2.3% YOY

8 | Tourism Snapshot August 2017
• August 2017 arrivals from Destination Canada’s Europe region (+0.7%) were up only marginally over the same month last year but still achieved a new peak for the month of August. The continued decline in arrivals from the UK (-9.2%) nearly outweighed the strong growth observed from France (+11.7%) and Germany (+7.1%).
• The region also reached a new record peak in arrivals for the January to August period, up 2.3% over the same period in 2016. Arrivals from Germany (+6.0%) and France (+5.7%) were both up year-over-year, but the UK (-1.6%) fell slightly behind.
• France achieved new arrivals records for both the month of August (+11.7%) and year-to-date (+7.1%), driven mainly by increasing air arrivals despite a second consecutive month of retracted air capacity to Canada in August 2017 (-3.1%).
• The growth in arrivals from Germany in August 2017 (+7.1%) was also driven mainly by increased air arrivals, supported by the ongoing expansion of air capacity to Canada (+11.3% in August 2017). Year-to-date arrivals were also up year-over-year (+6.0%).
• Though August 2017 arrivals from the UK (-9.2%) were down for a fourth consecutive month compared to the elevated levels observed in 2016, they were still at the second highest level ever recorded for the month of August and up significantly compared to previous years (+17% relative to August 2015). The continued decline in the strength of the British pound in Canada (-4.0% in August, -10.1% YTD) and retraction of direct air capacity from the UK to Canada for a fourth consecutive month may have contributed to the current trend.
DC Europe Arrivals by Port of Entry
• Most visitors from Destination Canada’s three European markets arrived by air directly from overseas year-to-date in 2017, primarily flying into YYZ and YUL.
• Year-to-date in 2017, France and Germany recorded a decline in arrivals via the US by land compared to the same period in 2016, whereas UK arrivals by air and sea were down.
France Germany UK
Air Arrivals
from Overseas
YYZ
Arrivals 47,167 72,855 192,774
YOY% 14.7% 6.9% -2.2%
% of Total 11.9% 27.7% 34.1%
YVR
Arrivals 14,352 50,608 105,756
YOY% 4.4% 17.3% 7.5%
% of Total 3.6% 19.3% 18.7%
YUL
Arrivals 203,081 25,960 35,559
YOY% 9.5% -1.1% -3.8%
% of Total 51.2% 9.9% 6.3%
YYC
Arrivals 2,588 18,414 52,620
YOY% -35.0% -10.7% 1.6%
% of Total 0.7% 7.0% 9.3%
All other airports
Arrivals 4,057 15,872 30,128
YOY% 1.7% 10.0% 7.8%
% of Total 1.0% 6.0% 5.3%
Subtotal
Arrivals 271,245 183,709 416,837
YOY% 7.4% 5.9% -0.4%
% of Total 68.4% 69.9% 73.8%
Air Arrivals via the
US
All airports
Arrivals 101,483 40,335 79,543
YOY% 6.2% 4.8% -13.0%
% of Total 25.6% 15.3% 14.1%
Sea Arrivals
All sea borders
Arrivals 1,392 9,968 24,019
YOY% -18.5% 47.7% -52.9%
% of Total 0.4% 3.8% 4.3%
Land Arrivals via US
All land borders
Arrivals 22,057 28,645 44,182
YOY% -11.6% -1.3% 12.5%
% of Total 5.6% 10.9% 7.8%
Total Overnight Arrivals 396,364 262,831 564,657
Source: International Travel Survey, Table C, Statistics Canada.Note: The figures are preliminary estimates and are subject to change.
EUROPE
Tourism Snapshot August 2017 | 9
ASIA-PACIFIC
JAN FEB MAR APR MAY JUN JUL AUG SEP OCT NOV DEC
OVER
NIG
HT A
RRIV
ALS
(000
s)
20172016
0
50
100
150
200
250
PEAK: AUGUST2017
Trend Plot: Total DC Asia-Pacific Arrivals
CHINA
INDIA
AUSTRALIA
JAPAN
SOUTHKOREA
Asia-Pacific: Key Indicators
Australia China India JapanSouth Korea
Air Seat Capacityi
August 2017
-11.4% 20.1% 75.2% 6.1% -1.8%
YTD 45.0% 31.3% 55.0% 9.8% 24.6%
Exchange Rateii
August 2017
0.6% -3.2% 1.5% -10.6% -4.7%
YTD 2.5% -4.5% 2.2% -3.1% 2.0%
YTD Arrival Peakiii
Previous Peak Year
2016 2016 2016 1996 2016
Current % of Previous Peak
115.0% 111.5% 119.0% 45.0% 113.2%
Sources:i. IATA-Diio SRS Analyser, Year-on-year % variance.ii. Bank of Canada, Year on year % variance.iii. Statistics Canada, Frontier counts, custom tabulations.
Overnight Arrivals
August 2017 YTD 2017
Arrivals % YOY Variance Arrivals % YOY
Variance
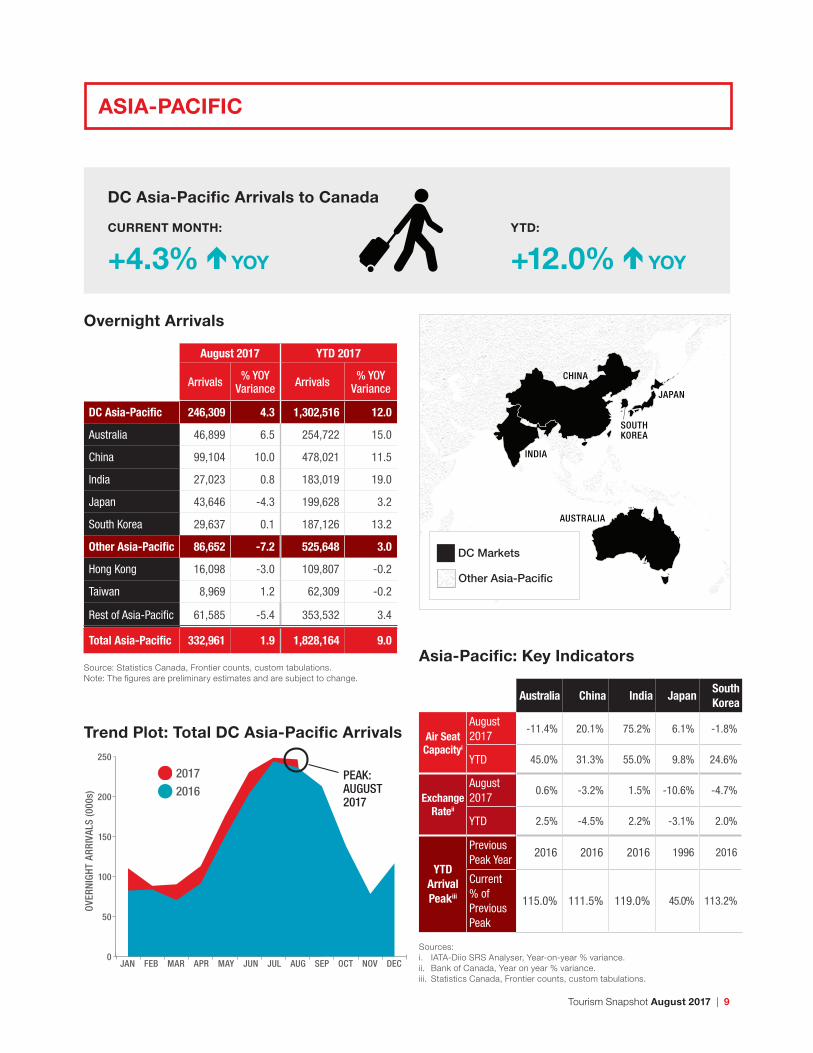
DC Asia-Pacific 246,309 4.3 1,302,516 12.0
Australia 46,899 6.5 254,722 15.0
China 99,104 10.0 478,021 11.5
India 27,023 0.8 183,019 19.0
Japan 43,646 -4.3 199,628 3.2
South Korea 29,637 0.1 187,126 13.2
Other Asia-Pacific 86,652 -7.2 525,648 3.0
Hong Kong 16,098 -3.0 109,807 -0.2
Taiwan 8,969 1.2 62,309 -0.2
Rest of Asia-Pacific 61,585 -5.4 353,532 3.4
Total Asia-Pacific 332,961 1.9 1,828,164 9.0
Source: Statistics Canada, Frontier counts, custom tabulations.Note: The figures are preliminary estimates and are subject to change.
DC Markets
ASIA-PACIFIC
DC EUROPEUS
DC LATIN-AMERICA
Other Asia-Pacific
DC Asia-Pacific Arrivals to Canada
CURRENT MONTH:
+4.3% YOY
YTD:
+12.0% YOY

10 | Tourism Snapshot August 2017
• Arrivals from Destination Canada’s Asia-Pacific region continued to increase year-over-year and achieved new records for August 2017 (+4.3%) and year-to-date (+12.0%). This growth in August was primarily driven by China (+10.0%) and Australia (+6.5%), with marginal increases from India (+0.8%) and South Korea (+0.1%). All four of these markets also reached new August and YTD arrivals peaks. The exception in this region was Japan, which observed a fourth consecutive month of declining arrivals (-4.3%).
• Year-to-date, all five Asia-Pacific markets observed positive year-over-year growth, with exceptional double-digit growth and YTD arrivals records from India (+19.0%), Australia (+15.0%), South Korea (+13.2%), and China (+11.5%). Japan observed somewhat slower but continued to make progress compared to the same period in 2016 (+3.2%) YTD.
• While direct air capacity continued to expand rapidly for most Asia-Pacific markets in August 2017, both Australia (-11.4%) and South Korea (-1.8%) retracted for a second consecutive month. Falling currency strength relative to the Canadian dollar may also account for the subdued results from some markets in August 2017.
ASIA-PACIFIC
DC Asia-Pacific Arrivals by Port of Entry
• A net decline in overnight arrivals to Canada via the United States offset increased arrivals by air direct from overseas from Destination Canada’s Asia-Pacific markets in August 2017.Year-to-date, arrivals via the US by air fell slightly from China and Japan, while arrivals via the US by land decreased from Japan, China, India, and Australia,
• Japan and China also continued to record subdued arrivals by sea, while South Korea and Australia saw increases by this mode of entry year-to-date in August 2017.
• Consistent with recent trends, the majority of arrivals from Destination Canada’s Asia-Pacific markets were direct air arrivals from overseas, with the exception of Australia which saw similar numbers arriving by air direct and via the US.
Australia China India Japan South Korea
Air Arrivals
from Overseas
YYZ
Arrivals 11,493 146,551 89,226 47,934 41,843
YOY% 10.0% 12.8% 43.9% 14.0% 33.6%
% of Total 4.5% 30.7% 48.8% 24.0% 22.4%
YVR
Arrivals 84,199 185,908 20,928 83,311 54,668
YOY% 40.5% 14.4% 13.3% 13.4% 1.2%
% of Total 33.1% 38.9% 11.4% 41.7% 29.2%
YUL
Arrivals 1,738 24,494 6,658 908 656
YOY% 11.5% 94.8% 2.0% 46.2% 58.1%
% of Total 0.7% 5.1% 3.6% 0.5% 0.4%
YYC
Arrivals 1,043 9,100 6,320 9,906 1,175
YOY% -4.2% 130.7% 0.7% -20.1% -32.8%
% of Total 0.4% 1.9% 3.5% 5.0% 0.6%
All other airports
Arrivals 727 525 2,670 176 132
YOY% 1.0% 0.2% 2.9% 0.1% 0.2%
% of Total 0.3% 0.1% 1.5% 0.1% 0.1%
Subtotal
Arrivals 99,200 366,578 125,802 142,235 98,474
YOY% 34.6% 18.4% 31.7% 10.5% 12.4%
% of Total 38.9% 76.7% 68.7% 71.3% 52.6%
Air Arrivals via the
US
All airports
Arrivals 95,246 66,896 25,411 41,907 26,725
YOY% 6.5% -1.5% 10.6% -4.5% 9.0%
% of Total 37.4% 14.0% 13.9% 21.0% 14.3%
Sea Arrivals
All sea borders
Arrivals 33,355 12,165 8,489 3,171 4,528
YOY% 15.2% -0.1% 1.4% -6.8% 24.1%
% of Total 13.1% 2.5% 4.6% 1.6% 2.4%
Land Arrivals via US
All land borders
Arrivals 26,880 32,380 23,317 12,303 57,399
YOY% -8.7% -16.2% -13.5% -26.3% 17.2%
% of Total 10.6% 6.8% 12.7% 6.2% 30.7%
Total Overnight Arrivals 254,722 478,021 183,019 199,628 187,126
Source: International Travel Survey, Table C, Statistics Canada.Note: The figures are preliminary estimates and are subject to change.

Tourism Snapshot August 2017 | 11
LATIN AMERICA
JAN FEB MAR APR MAY JUN JUL AUG SEP OCT NOV DEC
OVER
NIG
HT A
RRIV
ALS
(000
s)
20172016
0
10
20
30
40
50
70
60
PEAK: AUGUST 2017
Arrival Trend Plot – Total DC Latin America
BRAZIL
MEXICO
DC Latin America: Key Indicators
Brazil Mexico
Air Seat Capacityi
August 2017 -32.0% 92.3%
YTD -29.1% 59.7%
Exchange RateiiAugust 2017 -1.3% 0.5%
YTD 12.0% -4.8%
YTD Arrival Peakiii
Previous Peak Year
2015 2008
Current % of Previous Peak
112.2% 130.4%
Sources:i. IATA-Diio SRS Analyser, Year-on-year % variance.ii. Bank of Canada, Year on year % variance.iii. Statistics Canada, Frontier counts, custom tabulations.
Overnight Arrivals
August 2017 YTD 2017
Arrivals % YOY Variance Arrivals % YOY
Variance
DC Latin America 49,184 32.1 350,134 41.8
Brazil 12,342 6.8 90,565 17.0
Mexico 36,842 43.4 259,569 53.1
Other Latin America
43,363 -2.8 258,102 9.5
Total Latin America
92,547 13.0 608,236 26.0
Source: Statistics Canada, Frontier counts, custom tabulations.Note: The figures are preliminary estimates and are subject to change.
DC Markets
ASIA-PACIFIC
DC EUROPEUS
DC LATIN-AMERICA
Rest of Latin America
DC Latin America Arrivals to Canada
CURRENT MONTH:
+32.1% YOY
YTD:
+41.8% YOY

12 | Tourism Snapshot August 2017
• Supported by changes in eTA/visa requirements, Destination Canada’s Latin America region continued to lead international arrivals growth in August 2017. The region set new arrivals records both for the month of August (+32.1%) and year-to-date (+41.8%).
• As observed since the Electronic Travel Authority (eTA) replaced the visa requirement in December 2016, Mexico continued to record rapid arrivals growth and new peaks in August 2017 (+43.4%) and year-to-date (+53.1%). For a second consecutive month, Mexico saw the largest expansion of direct air capacity to Canada (+92.3%) of all Destination Canada’s international markets in August 2017, which supported particularly strong growth in direct air arrivals (+67.3%). The strength of the Mexican Peso relative to the Canadian dollar was stable in August 2017 (+0.5%), though still weaker year-to-date (-4.8%).
• Brazil also continued to benefit from visa requirement changes, with August 2017 arrivals up +6.8% over August 2016, and year-to-date arrivals up +17.0% to reach a new record for January to August visitors. The ongoing contraction of air capacity to Canada (-32.0% in August 2017, -29.1% YTD) and negative shift in the strength of the Real vs. the Canadian dollar (-1.3% in August) did not appear to slow this positive performance.
DC Latin America Arrivals by Port of Entry
• Mexico recorded increased arrivals via all modes of entry in August 2017, while Brazil’s growth came primarily from air arrivals via the United States.
• Year-to-date, the majority of visitors from both markets arrived by air directly from overseas, with YYZ being the most popular point of entry, though Mexico recorded some of its strongest growth at YYC and YUL.
• YTD declines were only observed from Brazil by land via the US, and from Mexico by sea.
Brazil Mexico
Air Arrivals from Overseas
YYZ
Arrivals 42,869 74,305
YOY% 19.6% 72.2%
% of Total 47.3% 28.6%
YVR
Arrivals 1,378 43,441
YOY% 44.0% 40.5%
% of Total 1.5% 16.7%
YUL
Arrivals 1,884 38,990
YOY% 42.1% 129.4%
% of Total 2.1% 15.0%
YYC
Arrivals 104 5,964
YOY% 5.1% 138.3%
% of Total 0.1% 2.3%
All other airports
Arrivals 160 1,218
YOY% 0.4% 1.3%
% of Total 0.2% 0.5%
Subtotal
Arrivals 46,395 163,918
YOY% 21.0% 72.6%
% of Total 51.2% 63.2%
Air Arrivals via the US All airports
Arrivals 39,376 47,652
YOY% 15.3% 46.4%
% of Total 43.5% 18.4%
Sea ArrivalsAll sea borders
Arrivals 1,853 10,165
YOY% 4.7% -74.6%
% of Total 2.0% 3.9%
Land Arrivals via US
All land borders
Arrivals 2,939 37,831
YOY% -91.4% 16.3%
% of Total 3.2% 14.6%
Total Overnight Arrivals 90,565 259,569
Source: Statistics Canada, Frontier counts, custom tabulations, Table C.Note: The figures are preliminary estimates and are subject to change.
LATIN AMERICA
Tourism Snapshot August 2017 | 13
January to August 2017 Trips To:
Canada Australia
Trips From: YOY Change YOY Change
Total International 14,645,163 4.3% 5,617,800 7.4%
United States 10,107,491 2.7% 500,700 10.3%
Canada … … 105,300 12.7%
Europe
United Kingdom 564,657 -1.6% 433,700 1.5%
France 396,364 5.7% 80,600 0.0%
Germany 262,831 6.0% 124,900 6.6%
Asia-Pacific
Australia 254,722 15.0% … …
Japan 199,628 3.2% 282,700 5.6%
South Korea 187,126 13.2% 187,800 4.4%
China 478,021 11.5% 945,400 12.1%
India 183,019 19.0% 192,700 14.2%
Latin AmericaMexico 259,569 53.1% 6,900 21.1%
Brazil 90,565 17.0% 33,500 19.2%
Total DC Key Markets 12,983,993 4.3% 2,894,200 8.6%
Sources: Statistics Canada, Frontier counts, custom tabulations.Australian Bureau of Statistics, Overseas Arrivals and Departures, cat. no. 3401.0.
COMPETITIVE REVIEW
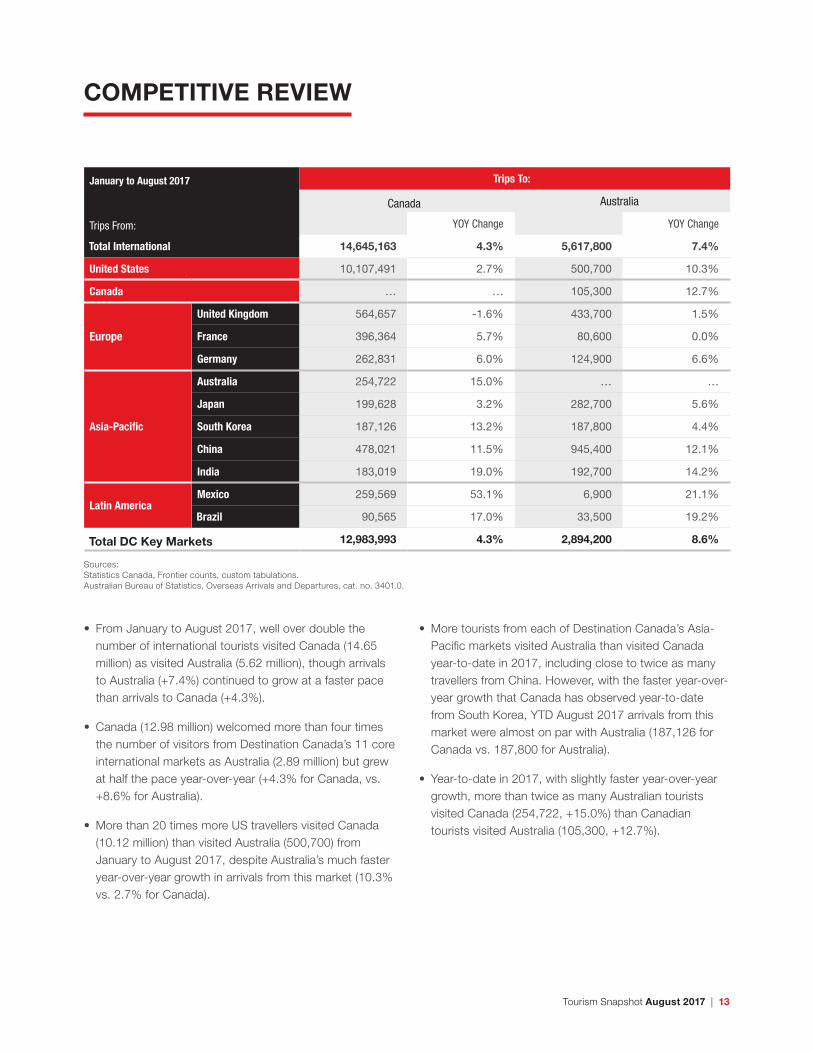
• From January to August 2017, well over double the number of international tourists visited Canada (14.65 million) as visited Australia (5.62 million), though arrivals to Australia (+7.4%) continued to grow at a faster pace than arrivals to Canada (+4.3%).
• Canada (12.98 million) welcomed more than four times the number of visitors from Destination Canada’s 11 core international markets as Australia (2.89 million) but grew at half the pace year-over-year (+4.3% for Canada, vs. +8.6% for Australia).
• More than 20 times more US travellers visited Canada (10.12 million) than visited Australia (500,700) from January to August 2017, despite Australia’s much faster year-over-year growth in arrivals from this market (10.3% vs. 2.7% for Canada).
• More tourists from each of Destination Canada’s Asia-Pacific markets visited Australia than visited Canada year-to-date in 2017, including close to twice as many travellers from China. However, with the faster year-over-year growth that Canada has observed year-to-date from South Korea, YTD August 2017 arrivals from this market were almost on par with Australia (187,126 for Canada vs. 187,800 for Australia).
• Year-to-date in 2017, with slightly faster year-over-year growth, more than twice as many Australian tourists visited Canada (254,722, +15.0%) than Canadian tourists visited Australia (105,300, +12.7%).

14 | Tourism Snapshot August 2017
Overnight Arrivals by Province of Entry January to Agust 2017
Newfo
undl
and
and
Labr
ador
Prin
ce E
dwad
Isla
nd
Nova
Sco
tia
New B
runs
wick
Québ
ec
Onta
rio
Tota
l One
or
mor
e ni
ghts
2017 35,916 276 127,544 213,435 2,149,486 6,884,176
Variance YOY% -3.8% -76.1% 7.9% -4.0% 6.7% 4.8%
Change YOY (1,429) (880) 9,362 (8,904) 135,036 313,253
US R
esid
ents
by
Auto
mob
ile
2017 0 0 11,566 183,436 767,267 3,106,308
Variance YOY% 0.0% 0.0% 20.2% -0.2% 0.6% 0.7%
Change YOY - - 1,946 (458) 4,725 22,282
US R
esid
ents
by
No
n-Au
tom
obile 2017 5,223 254 68,192 25,840 579,287 1,843,592
Variance YOY% -22.3% 23.9% 6.6% -20.3% 10.4% 6.9%
Change YOY (1,495) 49 4,233 (6,599) 54,359 119,352
Resi
dent
s fr
om
Othe
r Cou
ntrie
s 2017 30,693 22 47,786 4,159 802,932 1,934,276
Variance YOY% 0.2% -97.7% 7.1% -30.8% 10.4% 9.7%
Change YOY 66 (929) 3,183 (1,847) 75,952 171,619
Source: Statistics Canada, Frontier counts, custom tabulations. Preliminary estimates subject to change.
INTERNATIONAL ARRIVALS BY PROVINCE OF ENTRY

Tourism Snapshot August 2017 | 15
Overnight Arrivals by Province of Entry January to Agust 2017
Man
itoba
Sask
atch
ewan
Albe
rta
Briti
sh C
olum
bia
Yuko
n
CANA
DA
Tota
l One
or
mor
e ni
ghts
2017 157,108 52,161 771,695 4,118,865 134,501 14,645,163
Variance YOY% 3.9% -10.9% 6.0% 2.8% 2.2% 4.3%
Change YOY 5,877 (6,384) 43,946 113,473 2,907 606,257
US R
esid
ents
by
Auto
mob
ile
2017 104,297 40,018 127,302 1,347,091 66,913 5,754,198
Variance YOY% 7.3% 8.3% 3.8% -3.1% 8.0% 0.1%
Change YOY 7,131 3,054 4,620 (43,463) 4,985 4,822
US R
esid
ents
by
No
n-Au
tom
obile 2017 45,973 10,426 407,870 1,316,944 49,692 4,353,293
Variance YOY% -3.3% -46.5% 10.3% 5.2% -4.6% 6.4%
Change YOY (1,559) (9,060) 38,187 65,424 (2,396) 260,495
Resi
dent
s fr
om
Othe
r Cou
ntrie
s 2017 6,838 1,717 236,523 1,454,830 17,896 4,537,672
Variance YOY% 4.7% -18.0% 0.5% 6.7% 1.8% 8.1%
Change YOY 305 (378) 1,139 91,512 318 340,940
• YTD August 2017, the largest proportion of international visitors to Canada entered the country through Ontario, with approximately 47% of arrivals (6.88 million visitors) crossing the border there, up 4.8% over the same period in 2016. British Columbia (4.12 million visitors, +2.8%) and Quebec (2.15 million visitors, +6.7%) were also popular entry provinces.
• British Columbia, which was impacted by severe wildfires over the summer of 2017, continued to struggle with decreased US auto arrivals year-to-date, with 43,463 fewer arrivals compared to the same period in 2016.

16 | Tourism Snapshot August 2017
Overnight Trips by Canadians
August 2017 YOY % Variance Jan.- Aug. 2017 YOY % Variance
United States 2,431,706 3.9 14,020,697 4.5
Other Countries 1,148,995 6.4 9,075,987 6.7
Total Trips from Canada 3,580,701 4.7 23,096,684 5.3
Source: Statistics Canada, International Travel Survey.Note: The figures are preliminary estimates and are subject to change.
• For a third consecutive month, overnight trips by Canadians to international destinations expanded to reach 3,580,701 in August 2017, up 4.7% over August 2016. More Canadians travelled overseas (+6.4%) and to the US (+3.9%) in August 2017.
• Year-to-date 2017, overnight trips by Canadians to international destinations, including the US, were up 5.3%, including +4.5% to the US and +6.7% to overseas destinations.
• Canadian Consumer Confidence Index (published by the Conference Board of Canada) increased by another 8.0 points to reach 121.6 in August 2017, the highest observed since November 2007.
CANADIAN OUTBOUND TRAVEL

Tourism Snapshot August 2017 | 17
Hotel Performance Indicators by Province
Occupancy Rates Average Daily Rate (ADR) Revenue Per Available Room (RevPAR)
Aug. 2017 YOY^ Variance
Jan.- Aug.
YOY^ Variance Aug. 2017 YOY %
VarianceJan.- Aug.
YOY % Variance Aug. 2017 YOY %
VarianceJan.- Aug.
YOY % Variance
Alberta1 63.4% 3.7 54.2% 0.9 $128.77 0.7% $130.70 -1.1% $81.68 6.8% $70.78 0.6%
British Columbia 87.9% 3.1 72.2% 2.1 $209.95 9.8% $176.04 6.5% $184.47 13.8% $127.12 9.7%
Saskatchewan 58.9% 2.7 53.4% -0.9 $115.26 -3.8% $119.87 -4.7% $67.88 0.9% $63.96 -6.3%
Manitoba 79.7% 13.8 68.9% 6.0 $126.47 6.3% $123.29 2.0% $100.84 28.6% $84.97 11.8%
Ontario 81.6% 2.0 68.9% 1.3 $165.82 7.8% $153.52 6.5% $135.36 10.5% $105.75 8.6%
Quebec 86.5% 0.8 70.8% 2.6 $190.34 9.9% $167.93 6.6% $164.64 11.0% $118.96 10.7%
New Brunswick 88.7% 4.7 62.1% 2.8 $136.15 6.7% $122.26 4.3% $120.82 12.6% $75.95 9.3%
Nova Scotia 91.6% 4.3 68.1% 2.9 $161.44 13.6% $140.92 7.8% $147.94 19.3% $96.00 12.7%
Newfoundland 82.4% 1.8 64.6% 1.9 $153.93 -1.7% $145.23 -1.6% $126.80 0.5% $93.85 1.4%
Prince Edward Island 95.9% 3.8 58.9% 0.5 $189.93 11.8% $148.11 6.2% $182.19 16.4% $87.21 7.1%
Northwest Territories 78.7% 11.1 67.8% 0.0 $135.13 -8.8% $142.60 -5.6% $106.30 6.1% $96.64 -5.6%
Yukon 88.4% -0.3 70.1% -0.4 $144.25 8.8% $134.22 7.3% $127.45 8.4% $94.10 6.8%
Canada 79.8% 2.8 66.1% 1.6 $173.83 7.4% $155.80 5.0% $138.66 11.2% $102.93 7.6%
Note: Based on the operating results of 237,545 rooms (unweighted data).^ Percentage points. 1 Excluding Alberta resorts.
Source: CBRE Hotels with reproduction and use of information subject to CBRE Disclaimer / Terms of Use as detailed at www.cbre.ca.Users of this information are advised that CBRE Hotels does not represent the information contained herein to be definitive or all-inclusive. CBRE Hotels believes the information to be reliable, but is not responsible for errors or omissions.
ACCOMMODATION
• The National Occupancy Rate grew by 2.8 points in August 2017, reaching 79.8%. Atlantic Canada recorded the highest occupancy, with Prince Edward Island (95.9%), Nova Scotia (91.6%), and New Brunswick (88.7%) on top. Strong year-over-year growth in occupancy for the month of August was observed in Manitoba (+13.8 points), Northwest Territories (+11.1 points), and New Brunswick (+4.7 points).
• Year-to-date, the National Occupancy Rate reached 66.1%, up 1.6 points over the same period in 2016, led by British Columbia (72.2%), Quebec (70.8%), and Yukon (70.1%). Manitoba, Nova Scotia, and Quebec continued to lead year-over-year growth.
• British Columbia, Quebec, and Prince Edward Island recorded the highest average daily rates (ADR) and revenue per available room (RevPar), for the month of August. Year-to-date both measures were led by British Columbia, Quebec, and Ontario.

18 | Tourism Snapshot August 2017
ACCOMMODATION
Hotel Performance Indicators by Property Type
Occupancy Rates Average Daily Rate (ADR)
August 2017 YOY^ Change Jan.- Aug. YOY^ Variance August 2017 YOY Variance Jan.- Aug. YOY Variance
Property Size Under 50 rooms 71.7% 3.1 53.3% 2.8 $129.42 5.2% $114.23 4.2%
50-75 rooms 78.9% 5.6 60.4% 2.3 $137.53 5.2% $119.41 2.6%
76-125 rooms 78.5% 3.7 64.2% 2.1 $146.43 4.6% $132.12 2.8%
126-200 rooms 80.1% 2.1 67.0% 1.5 $158.48 8.5% $142.74 5.6%
201-500 rooms 80.1% 2.1 69.0% 0.8 $203.73 8.9% $183.51 6.4%
Over 500 rooms 87.0% -0.8 74.8% 0.6 $269.84 9.4% $231.95 8.3%
Total 79.8% 2.8 66.1% 1.6 $173.83 7.4% $155.80 5.0%
Property Type Limited Service 75.8% 3.9 61.1% 2.3 $130.76 5.8% $119.03 3.5%
Full Service 81.1% 2.6 68.4% 1.1 $187.22 9.2% $167.89 6.0%
Suite Hotel 85.9% -0.3 74.8% 0.9 $177.38 3.9% $160.65 3.3%
Resort 86.1% 0.3 66.5% 1.7 $294.37 7.4% $246.87 7.0%
Total 79.8% 2.8 66.1% 1.6 $173.83 7.4% $155.80 5.0%
Price Level Budget 75.5% 3.5 60.1% 2.7 $118.88 10.5% $103.92 7.3%
Mid-Price 80.2% 2.7 66.7% 1.2 $163.48 5.8% $147.58 4.0%
Upscale 84.2% 1.3 71.8% 1.4 $292.48 8.1% $255.54 6.1%
Total 79.8% 2.8 66.1% 1.6 $173.83 7.4% $155.80 5.0%
Note: Based on the operating results of 237,545 rooms (unweighted data).^ Percentage points.
• In line with recent trends, larger properties tended to record higher occupancy rates and ADR, both for the month of August and year-to-date. The largest properties (500+ rooms) recorded occupancy rates of 87.0% in August and 74.8% YTD, with an ADR of $269.84 in August and $231.95 YTD. These large properties also observed the strongest year-over-year growth in ADR; however, growth in occupancy rates was slower than some smaller properties observed.
• Suite hotels continued to record the highest occupancy rates year-to-date (74.8%); however, in August (85.9%) they were marginally outpaced by Resort hotels (86.1%). Resorts also continued to report the highest ADR ($294.37 in August, $246.87 YTD). Limited Service and Full Service properties observed positive year-over-year growth in both measures.
• Upscale properties continued to report the highest occupancy rates (84.2% in August, 71.8% YTD) and ADR ($292.48 in August, $255.54 YTD), while lower priced budget properties recorded faster year-over-year growth in both measures.
DC CONSUMER AND MARKET INTELLIGENCE