this is shell - nioclibrary.ir annual report/rd_1997.pdf · royal dutch/shell group of companies...
TRANSCRIPT
1
Operating Companies in more than 130 countries
(other than Shell Oil Companyand its subsidiaries)
The Shell Petroleum Company Limited
UKShell Oil Company
USA
Shell Petroleum N.V.†
Netherlands
Shell Petroleum Inc.†
USA
Service CompaniesRoyal Dutch Petroleum Company
Netherlands 60%
The “Shell” Transport and Trading Company, p.l.c.
UK 40%
Individuals and Institutions
Advice and services
Shareholding relationship
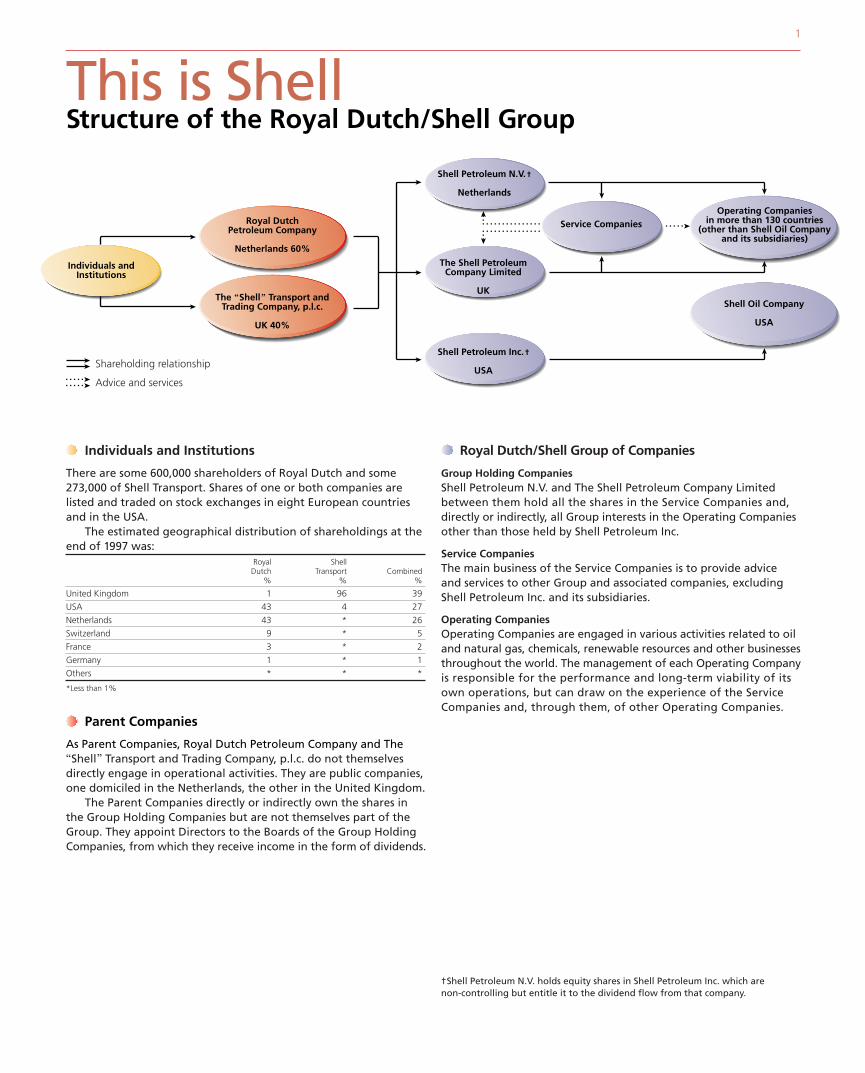
This is ShellStructure of the Royal Dutch/Shell Group
Parent Companies
As Parent Companies, Royal Dutch Petroleum Company and The2 Transport and Trading Company, p.l.c. do not themselvesdirectly engage in operational activities. They are public companies,one domiciled in the Netherlands, the other in the United Kingdom.
The Parent Companies directly or indirectly own the shares inthe Group Holding Companies but are not themselves part of theGroup. They appoint Directors to the Boards of the Group HoldingCompanies, from which they receive income in the form of dividends.
Individuals and Institutions
There are some 600,000 shareholders of Royal Dutch and some273,000 of Shell Transport. Shares of one or both companies arelisted and traded on stock exchanges in eight European countriesand in the USA.
The estimated geographical distribution of shareholdings at theend of 1997 was:
Royal ShellDutch Transport Combined
% % %
United Kingdom 1 96 39
USA 43 4 27
Netherlands 43 * 26
Switzerland 9 * 5
France 3 * 2
Germany 1 * 1
Others * * *
*Less than 1%
Royal Dutch/Shell Group of Companies
Group Holding CompaniesShell Petroleum N.V. and The Shell Petroleum Company Limitedbetween them hold all the shares in the Service Companies and,directly or indirectly, all Group interests in the Operating Companiesother than those held by Shell Petroleum Inc.
Service CompaniesThe main business of the Service Companies is to provide advice and services to other Group and associated companies, excluding Shell Petroleum Inc. and its subsidiaries.
Operating CompaniesOperating Companies are engaged in various activities related to oiland natural gas, chemicals, renewable resources and other businessesthroughout the world. The management of each Operating Companyis responsible for the performance and long-term viability of itsown operations, but can draw on the experience of the ServiceCompanies and, through them, of other Operating Companies.
†Shell Petroleum N.V. holds equity shares in Shell Petroleum Inc. which are non-controlling but entitle it to the dividend flow from that company.

Shell companies continued to contribute to global economic development last year – by delivering the improvedbusiness performance which is the essential foundation of this contribution, by pursuing the business transformationon which future success depends, and by responding openly to public concerns and expectations.
2
President’s Foreword
Delivering profitable growthOur objective is to deliver the profitablegrowth which will provide the basis forcontinuing improvement in the return toour shareholders – in a manner consistentwith our business principles.
Our goal is to achieve strong growth in production and sales volumes, and inrevenues – with a 15% return on capitalemployed by early next century.
A substantial increase in capitalexpenditure over the next few years willconfirm the Group’s position as one of theworld’s largest private investors. To supportsuch investment, existing operations must be run as effectively and profitably as possible. Growth will be greatest in Exploration and Production, which will employ an increasing share of theGroup’s capital.
Adverse business conditions affected the 1997 results, particularly in the fourthquarter. However, the underlying businessperformance gives us confidence in ourability to meet these long-term objectives.
The fall in oil prices hit upstream earnings,the impact being somewhat softened bylower operating costs. Although oilproduction rose slightly, warmer weatherreduced gas sales. Oil product salescontinued to grow strongly. Sales volumesof chemicals also increased.
Overall net income of £4.7 billion in 1997 was 17% down on the previous year.Excluding inventory holding effects, earningswere 6% lower. Results were affected by the Asian economic turmoil, as well as thestrength of both sterling and the US dollar.
From 1998, Group financial statementswill be reported in US dollars, making iteasier to compare our performance withthat of other energy companies.
Reserve levels increased: net additionsexceeded the year’s production by 29% in the case of oil and 110% in the case of gas.
Shell staff everywhere have respondedto the need to adapt continuously to newbusiness and societal challenges. The extentof these ceaseless changes – to a ‘learningorganisation’ – truly merits the term‘transformation’. These changes build onlong-standing technical and financialstrengths: focusing on meeting customerneeds; improving performance; andrealising opportunities.
A major theme is ‘openness’ – to new ideas, about what we do, and to the ideas of others. The basis of this is our confidencein the strength of our own core values.
Preparing for the futureIn the increasingly competitive and fast-moving global economy, businesses must beable to learn and adjust quickly to changingconditions. Shell staff have shown themselveseager to grasp new ideas which help driveforward their businesses.
In discussing these changes, I can pointto many accomplishments – not justaspirations. These are some:• increasing cost competitiveness in all
business sectors;• the creation of a global chemicals
business and a European oil productsorganisation;
• the formation of Shell InternationalDeepwater to capitalise on the Group’sleadership in deep-water technology,and Shell Services International to offercommercial business services world-wide;
• the alliances with Gazprom to developbusiness in Russia and elsewhere, withSaudi Aramco to pursue opportunities in Asia, and with Texaco and SaudiRefining to meet commercial challengesin the USA;
• the purchase of Tejas Gas and theremaining 50% of Montell;
• the expansion of convenience retailing,the entry into power generation, andthe commitment to the commercialfuture of renewable energy.
Each of these offers potential for the future.The creativity and drive which brought themabout offer much more.
In adverse conditions, ourunderlying business performancegives us confidence in our abilityto meet long-term goals. Shellstaff are responding to the needfor continuous learning to graspnew business and societalchallenges. We value openness –to new ideas, about what we do,and to the views of others.
C A J Herkströter, PresidentMarch 12, 1998
Royal Dutch Petroleum Company 3
Telling it like it isWe are responding to increasing publicinterest in Shell companies’ activities bydeveloping our reporting.
Shell companies have long been openabout the values and principles which guidethem. The Group’s Statement of GeneralBusiness Principles – our contract withsociety – has been publicly available for over 20 years. Last year’s revision followedextensive internal and external consultation.It included commitments to supportfundamental human rights and tocontribute to sustainable development.
The first Group health, safety andenvironment (HSE) report was issued lastyear – as well as separate reports for themain businesses. The HSE reports publishedthis year will be externally verified. Shellcompanies are committed to continuouslyimproving their performance in these areas.This year’s Group report will includeimprovement targets against which futureprogress can be measured.
In addition we will be presenting thecontribution Shell companies make toeconomic, social and environmentalprogress in the new Shell Report. We areplanning, as soon as practicable, to expandthe scope to present a measured andverified annual report on the performanceof Shell companies in fulfilling theresponsibilities they committed themselvesto in our business principles.
Engaging with the worldIt is not enough just to tell people whatShell companies are doing. We must alsotake account of the views of others.
This must, of course, include ourshareholders, whose views on any aspect ofthe Group’s affairs I am always very happyto receive.
It must include Shell customers. Far moreattention is being paid to finding out whatthey want – and to delivering it. And also totelling them more about what we offer.
It must include staff. Shell companieshave become much more open, with farwider discussion about the directions theyare taking. However, greater openness goestogether with the ability to take decisiveaction at all levels.
And it must include others in society. We have devoted much effort tounderstanding how public expectations of international business are changing. This has involved widespread discussion with different strands of opinion around the world. And we have not been afraid toenter public debate where we believe wehave something to say. Shell companies areincreasingly working with community andenvironmental groups.
Contributing to human progressModern business life involves inevitablepressures, as well as opportunities forpersonal fulfilment. In thanking all Shellstaff – and all who work with us – for theircontribution to business success and thepursuit of necessary change, let me say thatI recognise our responsibilities to help themmanage these pressures.
We in Shell can look back on a history ofmany worthwhile accomplishments. But it ismore important to consider how we areplaced to contribute to progress in thefuture. We can look forward with realconfidence, in the knowledge that we aredoing what it takes to meet the challengeswe foresee.
I believe that our shareholders, ourcustomers, and the millions of people allover the world who have a stake in Shelloperations can be equally confident.
Energy for the 21st centuryThe world’s economic and social transformation, which has enhancedhuman life over the past 150 years, has depended on the availability ofincreasing supplies of affordable energy from fossil fuels. Energy needs will continue to increase as population grows and living standards rise. But they will also change, and markets will evolve in response – as theyhave in the past. Last century wood gave way to coal. This century’stransport revolution depended on oil. Natural gas is becoming increasingly important.
Competition between fuels will continue to drive this evolution.Although oil is likely to remain the most convenient transport fuel,supplies may peak within two or three decades. Consumption of gascould double in the first half of the next century, because of its efficiencyand cleanliness. Renewable energy sources – wind, biomass and solar –could be supplying a tenth of the world’s energy by 2020, and half by 2050.
Energy efficiency has continuously improved. However, there are goodreasons for expecting technological advance, better communications,market reform and social change to bring faster improvement in future.
This is the context in which the world must respond to the possibilitythat human activities are causing damaging climate change. Because woodand coal emit more carbon dioxide than oil or gas, the carbon intensity ofenergy supplies is steadily declining. Shell planning scenarios suggest thatcontinuing changes in fuel supplies and increasing efficiency could meanthat carbon emissions start falling in the first half of next century.
Nevertheless, we support prudent precautionary measures – which areflexible, economically realistic and long term – to encourage this process.Emissions trading between nations will help flexibility. Shell companies arecontributing by reducing emissions from their own operations, playing aleading role in developing gas markets and investing in commercialrenewable energy.
4
Financial Highlights
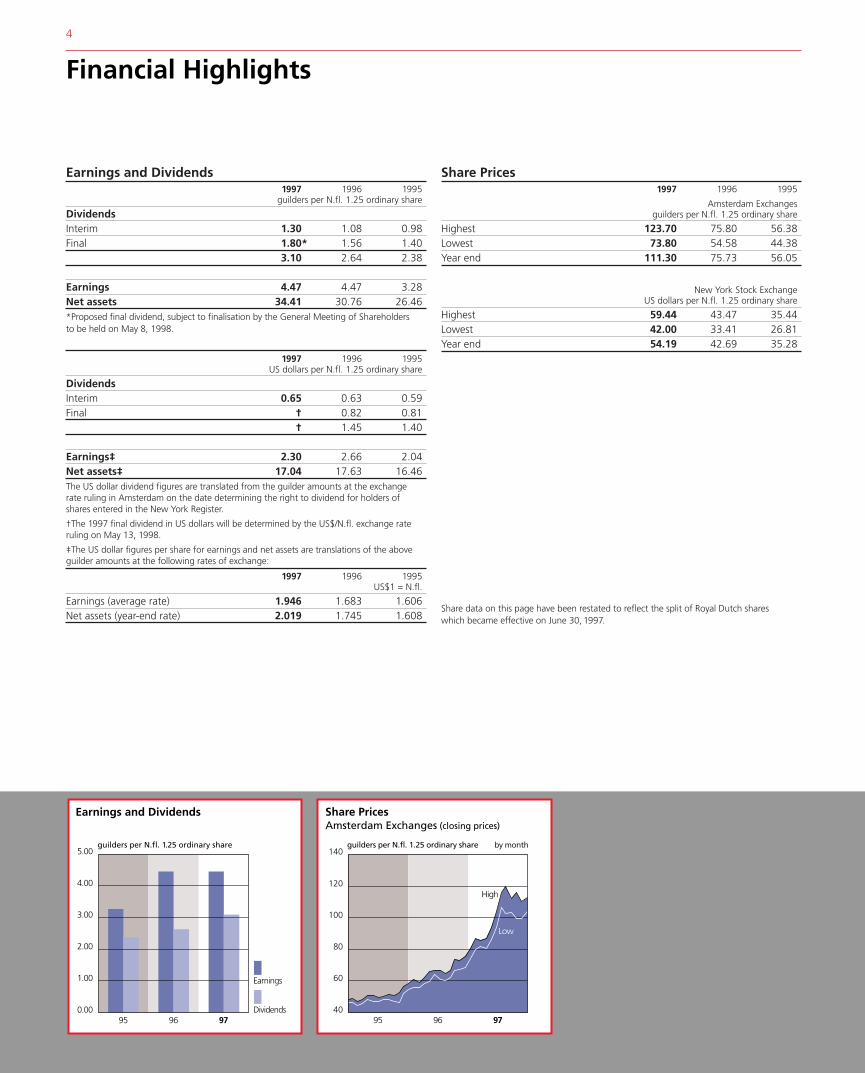
Earnings and Dividends1997 1996 1995
guilders per N.fl. 1.25 ordinary share
DividendsInterim 1.30 1.08 0.98Final 1.80* 1.56 1.40
3.10 2.64 2.38
Earnings 4.47 4.47 3.28Net assets 34.41 30.76 26.46*Proposed final dividend, subject to finalisation by the General Meeting of Shareholdersto be held on May 8, 1998.
1997 1996 1995US dollars per N.fl. 1.25 ordinary share
DividendsInterim 0.65 0.63 0.59Final † 0.82 0.81
† 1.45 1.40
Earnings‡ 2.30 2.66 2.04Net assets‡ 17.04 17.63 16.46The US dollar dividend figures are translated from the guilder amounts at the exchangerate ruling in Amsterdam on the date determining the right to dividend for holders ofshares entered in the New York Register.
†The 1997 final dividend in US dollars will be determined by the US$/N.fl. exchange rateruling on May 13, 1998.
‡The US dollar figures per share for earnings and net assets are translations of the aboveguilder amounts at the following rates of exchange:
1997 1996 1995US$1 = N.fl.
Earnings (average rate) 1.946 1.683 1.606Net assets (year-end rate) 2.019 1.745 1.608
Share Prices1997 1996 1995
Amsterdam Exchangesguilders per N.fl. 1.25 ordinary share
Highest 123.70 75.80 56.38Lowest 73.80 54.58 44.38Year end 111.30 75.73 56.05
New York Stock ExchangeUS dollars per N.fl. 1.25 ordinary share
Highest 59.44 43.47 35.44Lowest 42.00 33.41 26.81Year end 54.19 42.69 35.28
Share data on this page have been restated to reflect the split of Royal Dutch shareswhich became effective on June 30, 1997.
5.00
4.00
3.00
2.00
1.00
0.0095 96 97
Earnings and Dividends
Dividends
Earnings
guilders per N.fl. 1.25 ordinary share
95 96 97
Share PricesAmsterdam Exchanges (closing prices)
High
by month
40
60
80
100
120
140
Low
guilders per N.fl. 1.25 ordinary share

Board of Management
General Attorney
1 5
2 6
3
4
7
1
2
3
4
Royal Dutch Petroleum Company 5
Supervisory Board
1 L C van Wachem – Chairman(1931, Dutch) Chairman of the SupervisoryBoard since 1992. A Managing Director ofthe Company 1977–92 and President 1982–92. A Group Managing Director 1977–92. Amember of the Supervisory Board of AkzoNobel, Philips Electronics, BMW and Bayer.A member of the Board of Directors ofIBM, Atco (Canada), ‘Zürich’ Versicherungs-Gesellschaft and ABB Asea Brown Boveri.
2 K V Cassani(1928, Swiss) A member of the SupervisoryBoard since 1989. Formerly Vice-Chairmanof the Board of Directors of IBM. A memberof the Board of Directors of Novartis and‘Zürich’ Versicherungs-Gesellschaft.
3 J M H van Engelshoven(1930, Dutch) A member of theSupervisory Board since 1991. A ManagingDirector of the Company 1982–91. A GroupManaging Director 1982–91. Chairman of the Supervisory Board of KoninklijkeSchelde Groep, Internatio-Müller and Smit Internationale. A member of theSupervisory Board of ABN AMRO, DeltaLloyd Verzekeringsgroep, IHC Caland and SEP (Association of Power GeneratingCompanies). President of the RoyalNetherlands Institute of Engineers.Chairman of the Board of Directors of the Royal Netherlands Tropical Institute. A member of the General Advisory Council for Energy and the EuropeanAdvisory Council Air Products.
4 A G Jacobs(1936, Dutch) A member of the SupervisoryBoard since January 1998. Chairman of theExecutive Board of ING Group. Vice-
Chairman of the Supervisory Board ofNederlandse Participatie Maatschappij. A member of the Supervisory Board of Nationale Investeringsbank, StruktonGroep and Verenigde NederlandseUitgeversbedrijven.
5 Jonkheer A A Loudon(1936, Dutch) A member of theSupervisory Board since July 1997.Formerly Chairman of the Board ofManagement of Akzo Nobel. Chairman of the Supervisory Board of Akzo Nobeland ABN AMRO. Vice-Chairman of theSupervisory Board of KoninklijkeHoogovens. A member of the SupervisoryBoard of Arcadis and Hollandsche BetonGroep. A member of the First Chamber of the Dutch Parliament.
6 H de Ruiter(1934, Dutch) A member of theSupervisory Board since 1994. A ManagingDirector of the Company 1983–94. A GroupManaging Director 1983–94. Chairman of the Supervisory Board of KoninklijkeHoogovens, Koninklijke Ahold, Beers andKoninklijke Pakhoed. Vice-Chairman ofthe Supervisory Board of Wolters Kluwer. A member of the Supervisory Board of Aegon and Heineken.
7 J D Timmer(1933, Dutch) A member of the SupervisoryBoard since 1996. Formerly President andChairman of the Board of Management of Philips Electronics. Chairman of theSupervisory Board of NederlandseSpoorwegen. A member of the SupervisoryBoard of ING Group. A member of theAdvisory Board of KPMG.
1 C A J Herkströter – President(1937, Dutch) A Managing Director of the Company since 1989 and Presidentsince 1992. A Group Managing Directorsince 1989.
2 M A van den Bergh(1942, Dutch) A Managing Director of theCompany since 1992. A Group ManagingDirector since 1992.
3 S L Miller(1945, American) A Managing Director of the Company since 1996. A GroupManaging Director since 1996.
4 J van der Veer(1947, Dutch) A Managing Director of the Company since July 1997. A GroupManaging Director since July 1997.
R van der Vlist(1944, Dutch) General Attorney of theCompany since 1987.
6
To the ShareholdersReport of the Supervisory Board
Members of the Supervisory Board and Managing DirectorsMr T C Braakman and Mr K O Pöhl retired from the SupervisoryBoard with effect from July 1, 1997. Mr Braakman was appointed to the Supervisory Board in 1989. Mr Pöhl was appointed to theSupervisory Board in 1992. At the General Meeting of Shareholdersheld on May 14, 1997, gratitude was expressed for the manyvaluable services rendered to the Company by Mr Braakman and Mr Pöhl.
At the same General Meeting, Jonkheer A A Loudon, formerlyChairman of the Board of Management of Akzo Nobel, wasappointed to the Supervisory Board with effect from July 1, 1997, Mr A G Jacobs, Chairman of the Executive Board of ING Group, wasappointed to the Supervisory Board with effect from January 1,1998, and Mr K V Cassani, retiring in accordance with the scheduleof rotation, was reappointed to the Supervisory Board.
At the same General Meeting, Mr J van der Veer was appointedas a Managing Director with effect from July 1, 1997.
Supervisory BoardDuring the year under review the Supervisory Board met nine times to discuss and, where appropriate, adopt resolutions on issues relating to the Company. These meetings were attended by the Board of Management, except when the Managing Directors’performance, remuneration and succession were discussed. Aspecial meeting was held with the Board of Management to discussthe recommendations of the Committee on Corporate Governancein the Netherlands, which, in general, are endorsed.
In addition, the members of the Supervisory Board met monthlyin ‘Conference’ (except in August) with the Managing Directors ofthe Company and the Directors of The 2 Transport andTrading Company, p.l.c. The purpose of these Conferences is toreceive information from the Group Managing Directors and other senior executives of Group companies about the majordevelopments within the Royal Dutch/Shell Group of Companiesand to exchange views on such matters. Topics of discussion atConference include, inter alia, the strategic direction of thebusinesses of Group companies, the business risks and the internalgovernance and business controls of Group companies.
Group Audit Committee The Group Audit Committee advises the Supervisory Board and theBoard of Directors of Shell Transport. The Committee reviews thefinancial reports of the Royal Dutch/Shell Group of Companies andconsiders the Group internal control procedures as well as theresults of the independent auditors’ examination of the Groupfinancial statements. The Committee comprises three members ofthe Supervisory Board (Mr J M H van Engelshoven, Mr A G Jacobsand Mr J D Timmer) and three members of the Board of Directors of Shell Transport (Sir Peter Holmes, Professor R J O’Neill and Sir William Purves (Chairman)).
Remuneration and Succession Review CommitteeThe Remuneration and Succession Review Committee advises theSupervisory Board and the Board of Directors of Shell Transport. TheCommittee makes recommendations on all forms of remunerationwith respect to Group Managing Directors and reviews mattersrelating to the succession to the positions of Group Managing
Directors. The Committee comprises three members of theSupervisory Board (Mr K V Cassani, Jonkheer A A Loudon and Mr L C van Wachem (Chairman)) and three members of the Boardof Directors of Shell Transport (Sir Antony Acland, Sir John Jenningsand Sir Ronald Oxburgh).
The philosophy for remuneration of Group Managing Directorsis consistent with that for senior management throughout theGroup: to attract and retain high-quality staff at all levels andmotivate them towards exceptional performance. It seeks to alignall senior staff with the goals of the Group and of its variousbusinesses, and with shareholders’ interests.
The total remuneration of Managing Directors is reviewedannually. Particular attention is given to the relationship betweenManaging Directors’ salaries and those of senior managers in theGroup. The level and structure of remuneration in each countryreflects the competitive environment within that country. The levelof remuneration is based on scales which are adjusted in the lightof both external and internal comparisons. Within these scalesindividual salaries of Managing Directors are usually progressedover a period of three years from appointment. In 1997 salary scales of the Dutch Managing Directors were increased by 2.5%.The salaries of non-Dutch Managing Directors are related to thosein their home country.
Pensions for Managing Directors are reviewed and maintainedat a level comparable in relative terms to retirement benefitsgranted to other senior managers in the Group.
Performance-related remuneration is provided in the form of an annual non-pensionable bonus with a maximum level of 50% of salary. Bonuses from this plan also flow to certain senior managers. The bonus granted is based on assessment of Group financial andoperational performance.
Longer-term incentives for Managing Directors are providedthrough Group Stock Option Plans which have been in operationsince 1967, and which are believed to create an effective method of aligning the interests of Managing Directors and other Groupsenior managers with those of shareholders.
Consideration is given on an individual basis to the granting of options each year.
Details of the total remuneration and benefits of each memberof the Supervisory Board and Managing Director are set out in Note 9 on pages 12 and 13.
Social Responsibility CommitteeThis new Committee advises the Supervisory Board and the Board of Directors of Shell Transport. The Committee reviews the policiesand conduct of the Royal Dutch/Shell Group of Companies withrespect to the Statement of General Business Principles and theGroup Policy and Commitment concerning Health, Safety and the Environment. The Committee comprises three members of the Supervisory Board (Jonkheer A A Loudon, Mr H de Ruiter and Mr J D Timmer) and three members of the Board of Directors of Shell Transport (Mr T A Alireza, Sir Peter Holmes and Sir Ronald Oxburgh (Chairman)).

Royal Dutch Petroleum Company 7
Annual AccountsWe herewith submit the Annual Accounts as drawn up today by the Board of Management and approved by the Supervisory Board,which are accompanied by the other information to be attachedthereto by virtue of the law and the Annual Report drawn up bythe Board of Management. The Annual Accounts comprise thefollowing documents as signed by each of the Managing Directorsand the members of the Supervisory Board:
1 the Balance Sheet as at December 31, 1997;2 the Profit and Loss Account for the year 1997;3 the Notes to the Balance Sheet and the Profit and Loss Account,including the financial statements of the Royal Dutch/Shell Group of Companies and the Notes thereto as shown on pages 38 to 57 of this Report.
On the basis of these Annual Accounts we propose:
A that the Balance Sheet as at December 31, 1997, the Profit andLoss Account for the year 1997 and the Notes to the Balance Sheetand the Profit and Loss Account, including the financial statementsof the Royal Dutch/Shell Group of Companies and the Notes theretoas shown on pages 38 to 57, be finalised in accordance with theattached Accounts;
B that, after the payment of N.fl. 40 on each of the 1,500 priorityshares with a par value of N.fl. 1,000, the final dividend for 1997 bedeclared at N.fl. 1.80 on each of the 2,144,296,352 ordinary shareswith a par value of N.fl. 1.25 outstanding at December 31, 1997, sothat the total dividend for 1997, including the interim dividend ofN.fl. 1.30 already made payable in 1997, will amount to N.fl. 3.10 on each of the said shares, and further that it be resolved to carryforward to the next year the amount of undistributed profit,amounting to N.fl. 950.3 million;
C that the Managing Directors be discharged of responsibility inrespect of their management and the members of the SupervisoryBoard for their supervision for the year 1997.
The Hague, March 12, 1998The Supervisory Board
L C van Wachem, Chairman
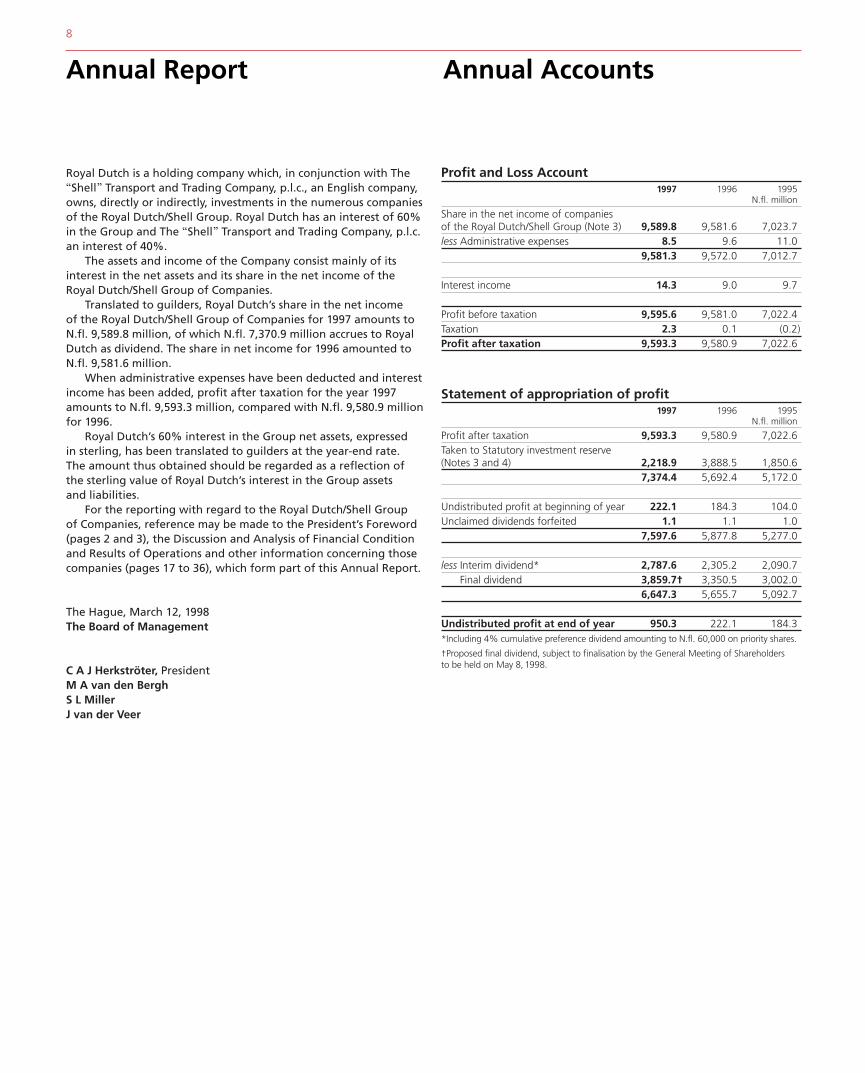
Profit and Loss Account1997 1996 1995
N.fl. million
Share in the net income of companiesof the Royal Dutch/Shell Group (Note 3) 9,589.8 9,581.6 7,023.7less Administrative expenses 8.5 9.6 11.0
9,581.3 9,572.0 7,012.7
Interest income 14.3 9.0 9.7
Profit before taxation 9,595.6 9,581.0 7,022.4Taxation 2.3 0.1 (0.2)Profit after taxation 9,593.3 9,580.9 7,022.6
Statement of appropriation of profit1997 1996 1995
N.fl. million
Profit after taxation 9,593.3 9,580.9 7,022.6Taken to Statutory investment reserve(Notes 3 and 4) 2,218.9 3,888.5 1,850.6
7,374.4 5,692.4 5,172.0
Undistributed profit at beginning of year 222.1 184.3 104.0Unclaimed dividends forfeited 1.1 1.1 1.0
7,597.6 5,877.8 5,277.0
less Interim dividend* 2,787.6 2,305.2 2,090.7Final dividend 3,859.7† 3,350.5 3,002.0
6,647.3 5,655.7 5,092.7
Undistributed profit at end of year 950.3 222.1 184.3*Including 4% cumulative preference dividend amounting to N.fl. 60,000 on priority shares.
†Proposed final dividend, subject to finalisation by the General Meeting of Shareholdersto be held on May 8, 1998.
8
Annual Report Annual Accounts
Royal Dutch is a holding company which, in conjunction with The2 Transport and Trading Company, p.l.c., an English company,owns, directly or indirectly, investments in the numerous companiesof the Royal Dutch/Shell Group. Royal Dutch has an interest of 60%in the Group and The 2 Transport and Trading Company, p.l.c.an interest of 40%.
The assets and income of the Company consist mainly of itsinterest in the net assets and its share in the net income of theRoyal Dutch/Shell Group of Companies.
Translated to guilders, Royal Dutch’s share in the net income of the Royal Dutch/Shell Group of Companies for 1997 amounts to N.fl. 9,589.8 million, of which N.fl. 7,370.9 million accrues to RoyalDutch as dividend. The share in net income for 1996 amounted toN.fl. 9,581.6 million.
When administrative expenses have been deducted and interestincome has been added, profit after taxation for the year 1997amounts to N.fl. 9,593.3 million, compared with N.fl. 9,580.9 millionfor 1996.
Royal Dutch’s 60% interest in the Group net assets, expressed in sterling, has been translated to guilders at the year-end rate. The amount thus obtained should be regarded as a reflection of the sterling value of Royal Dutch’s interest in the Group assets and liabilities.
For the reporting with regard to the Royal Dutch/Shell Group of Companies, reference may be made to the President’s Foreword(pages 2 and 3), the Discussion and Analysis of Financial Conditionand Results of Operations and other information concerning thosecompanies (pages 17 to 36), which form part of this Annual Report.
The Hague, March 12, 1998The Board of Management
C A J Herkströter, PresidentM A van den BerghS L MillerJ van der Veer
Royal Dutch Petroleum Company 9
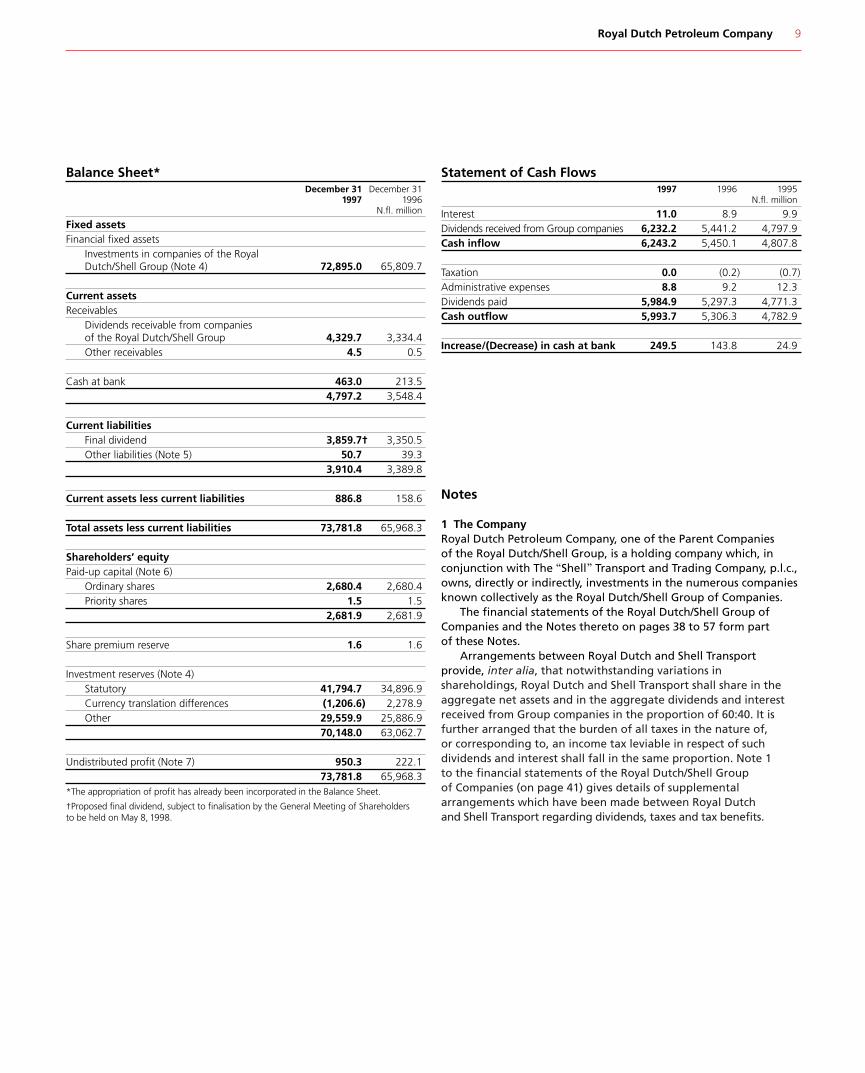
Balance Sheet*December 31 December 31
1997 1996N.fl. million
Fixed assetsFinancial fixed assets
Investments in companies of the Royal Dutch/Shell Group (Note 4) 72,895.0 65,809.7
Current assetsReceivables
Dividends receivable from companies of the Royal Dutch/Shell Group 4,329.7 3,334.4Other receivables 4.5 0.5
Cash at bank 463.0 213.54,797.2 3,548.4
Current liabilitiesFinal dividend 3,859.7† 3,350.5Other liabilities (Note 5) 50.7 39.3
3,910.4 3,389.8
Current assets less current liabilities 886.8 158.6
Total assets less current liabilities 73,781.8 65,968.3
Shareholders’ equityPaid-up capital (Note 6)
Ordinary shares 2,680.4 2,680.4Priority shares 1.5 1.5
2,681.9 2,681.9
Share premium reserve 1.6 1.6
Investment reserves (Note 4)Statutory 41,794.7 34,896.9Currency translation differences (1,206.6) 2,278.9Other 29,559.9 25,886.9
70,148.0 63,062.7
Undistributed profit (Note 7) 950.3 222.173,781.8 65,968.3
*The appropriation of profit has already been incorporated in the Balance Sheet.
†Proposed final dividend, subject to finalisation by the General Meeting of Shareholdersto be held on May 8, 1998.
Statement of Cash Flows1997 1996 1995
N.fl. million
Interest 11.0 8.9 9.9Dividends received from Group companies 6,232.2 5,441.2 4,797.9Cash inflow 6,243.2 5,450.1 4,807.8
Taxation 0.0 (0.2) (0.7)Administrative expenses 8.8 9.2 12.3Dividends paid 5,984.9 5,297.3 4,771.3Cash outflow 5,993.7 5,306.3 4,782.9
Increase/(Decrease) in cash at bank 249.5 143.8 24.9
Notes
1 The CompanyRoyal Dutch Petroleum Company, one of the Parent Companies of the Royal Dutch/Shell Group, is a holding company which, inconjunction with The 2 Transport and Trading Company, p.l.c.,owns, directly or indirectly, investments in the numerous companiesknown collectively as the Royal Dutch/Shell Group of Companies.
The financial statements of the Royal Dutch/Shell Group ofCompanies and the Notes thereto on pages 38 to 57 form part of these Notes.
Arrangements between Royal Dutch and Shell Transportprovide, inter alia, that notwithstanding variations inshareholdings, Royal Dutch and Shell Transport shall share in theaggregate net assets and in the aggregate dividends and interestreceived from Group companies in the proportion of 60:40. It isfurther arranged that the burden of all taxes in the nature of, or corresponding to, an income tax leviable in respect of suchdividends and interest shall fall in the same proportion. Note 1 to the financial statements of the Royal Dutch/Shell Group of Companies (on page 41) gives details of supplementalarrangements which have been made between Royal Dutch and Shell Transport regarding dividends, taxes and tax benefits.
10
Annual Accounts
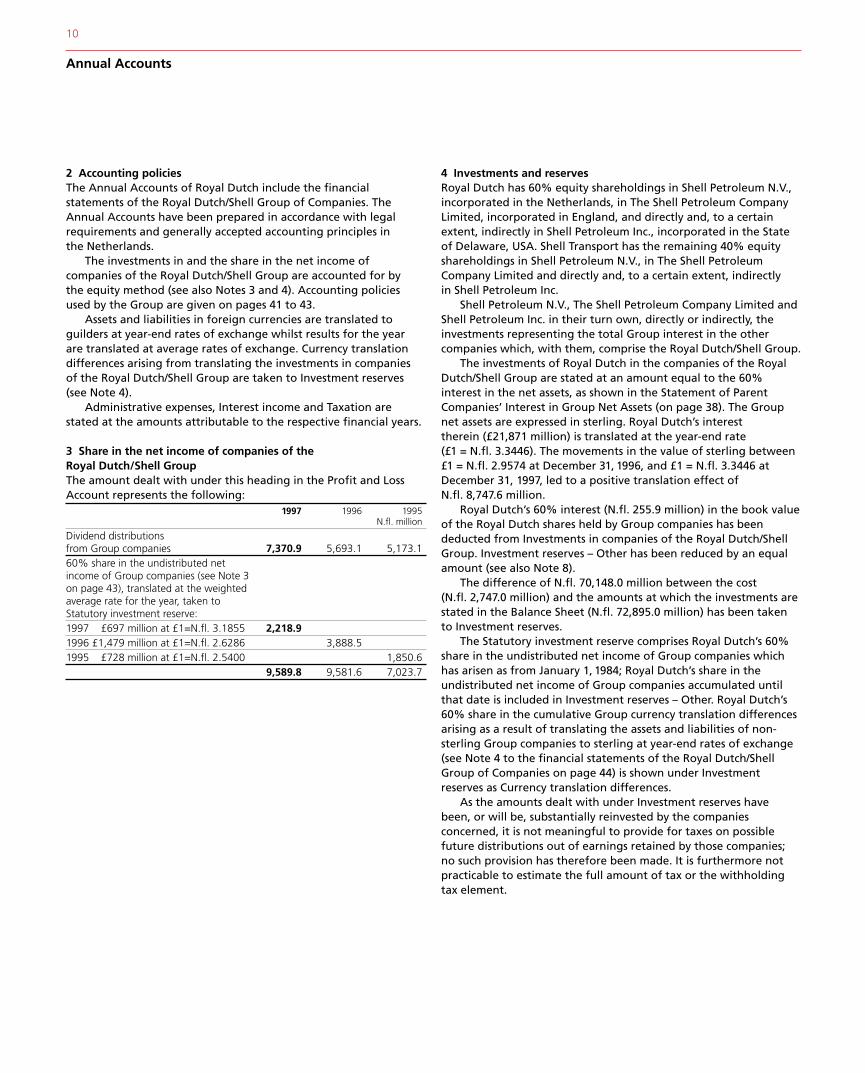
2 Accounting policiesThe Annual Accounts of Royal Dutch include the financialstatements of the Royal Dutch/Shell Group of Companies. TheAnnual Accounts have been prepared in accordance with legalrequirements and generally accepted accounting principles in the Netherlands.
The investments in and the share in the net income ofcompanies of the Royal Dutch/Shell Group are accounted for by the equity method (see also Notes 3 and 4). Accounting policies
used by the Group are given on pages 41 to 43.Assets and liabilities in foreign currencies are translated toguilders at year-end rates of exchange whilst results for the year are translated at average rates of exchange. Currency translationdifferences arising from translating the investments in companies of the Royal Dutch/Shell Group are taken to Investment reserves(see Note 4).
Administrative expenses, Interest income and Taxation arestated at the amounts attributable to the respective financial years.
3 Share in the net income of companies of the Royal Dutch/Shell GroupThe amount dealt with under this heading in the Profit and LossAccount represents the following:
1997 1996 1995N.fl. million
Dividend distributions from Group companies 7,370.9 5,693.1 5,173.160% share in the undistributed net income of Group companies (see Note 3 on page 43), translated at the weighted average rate for the year, taken to Statutory investment reserve:1997 £697 million at £1=N.fl. 3.1855 2,218.91996 £1,479 million at £1=N.fl. 2.6286 3,888.51995 £728 million at £1=N.fl. 2.5400 1,850.6
9,589.8 9,581.6 7,023.7
4 Investments and reservesRoyal Dutch has 60% equity shareholdings in Shell Petroleum N.V.,incorporated in the Netherlands, in The Shell Petroleum CompanyLimited, incorporated in England, and directly and, to a certainextent, indirectly in Shell Petroleum Inc., incorporated in the Stateof Delaware, USA. Shell Transport has the remaining 40% equityshareholdings in Shell Petroleum N.V., in The Shell PetroleumCompany Limited and directly and, to a certain extent, indirectly in Shell Petroleum Inc.
Shell Petroleum N.V., The Shell Petroleum Company Limited andShell Petroleum Inc. in their turn own, directly or indirectly, theinvestments representing the total Group interest in the othercompanies which, with them, comprise the Royal Dutch/Shell Group.
The investments of Royal Dutch in the companies of the RoyalDutch/Shell Group are stated at an amount equal to the 60%interest in the net assets, as shown in the Statement of ParentCompanies’ Interest in Group Net Assets (on page 38). The Groupnet assets are expressed in sterling. Royal Dutch’s interest therein (£21,871 million) is translated at the year-end rate (£1 = N.fl. 3.3446). The movements in the value of sterling between£1 = N.fl. 2.9574 at December 31, 1996, and £1 = N.fl. 3.3446 atDecember 31, 1997, led to a positive translation effect of N.fl. 8,747.6 million.
Royal Dutch’s 60% interest (N.fl. 255.9 million) in the book valueof the Royal Dutch shares held by Group companies has beendeducted from Investments in companies of the Royal Dutch/ShellGroup. Investment reserves – Other has been reduced by an equalamount (see also Note 8).
The difference of N.fl. 70,148.0 million between the cost (N.fl. 2,747.0 million) and the amounts at which the investments arestated in the Balance Sheet (N.fl. 72,895.0 million) has been takento Investment reserves.
The Statutory investment reserve comprises Royal Dutch’s 60%share in the undistributed net income of Group companies whichhas arisen as from January 1, 1984; Royal Dutch’s share in theundistributed net income of Group companies accumulated untilthat date is included in Investment reserves – Other. Royal Dutch’s60% share in the cumulative Group currency translation differencesarising as a result of translating the assets and liabilities of non-sterling Group companies to sterling at year-end rates of exchange(see Note 4 to the financial statements of the Royal Dutch/ShellGroup of Companies on page 44) is shown under Investmentreserves as Currency translation differences.
As the amounts dealt with under Investment reserves havebeen, or will be, substantially reinvested by the companiesconcerned, it is not meaningful to provide for taxes on possiblefuture distributions out of earnings retained by those companies;no such provision has therefore been made. It is furthermore notpracticable to estimate the full amount of tax or the withholdingtax element.
Royal Dutch Petroleum Company 11
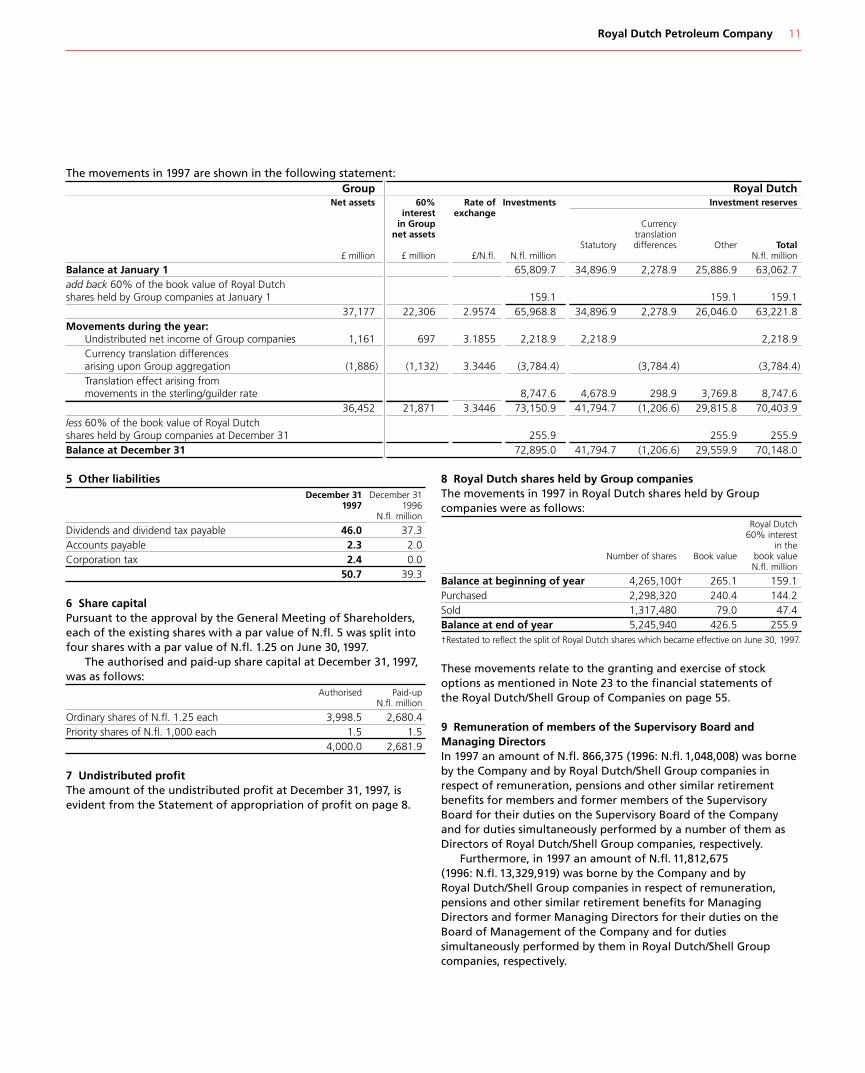
5 Other liabilitiesDecember 31 December 31
1997 1996N.fl. million
Dividends and dividend tax payable 46.0 37.3Accounts payable 2.3 2.0Corporation tax 2.4 0.0
50.7 39.3
6 Share capitalPursuant to the approval by the General Meeting of Shareholders,each of the existing shares with a par value of N.fl. 5 was split intofour shares with a par value of N.fl. 1.25 on June 30, 1997.
The authorised and paid-up share capital at December 31, 1997,was as follows:
Authorised Paid-upN.fl. million
Ordinary shares of N.fl. 1.25 each 3,998.5 2,680.4Priority shares of N.fl. 1,000 each 1.5 1.5
4,000.0 2,681.9
7 Undistributed profitThe amount of the undistributed profit at December 31, 1997, isevident from the Statement of appropriation of profit on page 8.
The movements in 1997 are shown in the following statement:Group
Net assets 60%interest
in Groupnet assets
£ million £ million
Balance at January 1add back 60% of the book value of Royal Dutch shares held by Group companies at January 1
37,177 22,306Movements during the year:
Undistributed net income of Group companies 1,161 697Currency translation differences arising upon Group aggregation (1,886) (1,132Translation effect arising frommovements in the sterling/guilder rate
36,452 21,871less 60% of the book value of Royal Dutch shares held by Group companies at December 31Balance at December 31
8 Royal Dutch shares held by Group companiesThe movements in 1997 in Royal Dutch shares held by Groupcompanies were as follows:
Royal Dutch60% interest
in theNumber of shares Book value book value
N.fl. million
Balance at beginning of year 4,265,100† 265.1 159.1Purchased 2,298,320 240.4 144.2Sold 1,317,480 79.0 47.4Balance at end of year 5,245,940 426.5 255.9†Restated to reflect the split of Royal Dutch shares which became effective on June 30, 1997.
These movements relate to the granting and exercise of stockoptions as mentioned in Note 23 to the financial statements of the Royal Dutch/Shell Group of Companies on page 55.
9 Remuneration of members of the Supervisory Board andManaging DirectorsIn 1997 an amount of N.fl. 866,375 (1996: N.fl. 1,048,008) was borneby the Company and by Royal Dutch/Shell Group companies inrespect of remuneration, pensions and other similar retirementbenefits for members and former members of the SupervisoryBoard for their duties on the Supervisory Board of the Companyand for duties simultaneously performed by a number of them asDirectors of Royal Dutch/Shell Group companies, respectively.
Furthermore, in 1997 an amount of N.fl. 11,812,675 (1996: N.fl. 13,329,919) was borne by the Company and by Royal Dutch/Shell Group companies in respect of remuneration,pensions and other similar retirement benefits for ManagingDirectors and former Managing Directors for their duties on theBoard of Management of the Company and for dutiessimultaneously performed by them in Royal Dutch/Shell Groupcompanies, respectively.
Royal DutchRate of Investments Investment reserves
exchangeCurrency
translationStatutory differences Other Total
£/N.fl. N.fl. million N.fl. million
65,809.7 34,896.9 2,278.9 25,886.9 63,062.7
159.1 159.1 159.12.9574 65,968.8 34,896.9 2,278.9 26,046.0 63,221.8
3.1855 2,218.9 2,218.9 2,218.9
) 3.3446 (3,784.4) (3,784.4) (3,784.4)
8,747.6 4,678.9 298.9 3,769.8 8,747.63.3446 73,150.9 41,794.7 (1,206.6) 29,815.8 70,403.9
255.9 255.9 255.972,895.0 41,794.7 (1,206.6) 29,559.9 70,148.0

12
Annual Accounts
Additional informationThe emoluments of the members of the Supervisory Board of Royal Dutch Petroleum Company whilst in office during 1997 were:
1997 1996 1995N.fl.
L C van WachemSupervisory Board fees 110,000 110,000 110,000Committee fees* 10,000 10,000 10,000Holding company fees 61,234 56,161 55,091
181,234 176,161 175,091
T C BraakmanSupervisory Board fees 45,000 90,000 90,000Committee fees* 5,000 10,000 10,000
50,000 100,000 100,000
K V CassaniSupervisory Board fees 90,000 90,000 90,000Committee fees* 10,000 10,000 10,000
100,000 100,000 100,000
J M H van EngelshovenSupervisory Board fees 90,000 90,000 90,000Committee fees* 10,000 5,000 –Holding company fees 61,234 56,161 55,091
161,234 151,161 145,091
Jonkheer A A LoudonSupervisory Board fees 45,000 – –Committee fees* 5,000 – –
50,000 – –
K O PöhlSupervisory Board fees 45,000 90,000 90,000Committee fees* 5,000 10,000 10,000
50,000 100,000 100,000
H de RuiterSupervisory Board fees 90,000 90,000 90,000Holding company fees 61,234 56,161 55,091
151,234 146,161 145,091
J D TimmerSupervisory Board fees 90,000 45,000 –Committee fees* 10,000 5,000 –
100,000 50,000 –*See page 6.
The emoluments of the Managing Directors of Royal DutchPetroleum Company whilst in office during 1997 were:
1997 1996 1995N.fl.
C A J HerkströterSalaries 2,517,671 2,151,550 2,017,941Performance-related element 742,350 519,750 402,000
3,260,021 2,671,300 2,419,941
M A van den BerghSalaries 1,196,507 1,105,546 1,520,797Performance-related element 519,750 363,750 291,000
1,716,257 1,469,296 1,811,797
S L MillerSalaries 1,811,370 1,401,169 –Performance-related element 724,283 – –
2,535,653 1,401,169 –
J van der VeerSalaries 694,422 – –Performance-related element – – –
694,422 – –
Share optionsCertain Group companies have option plans, the operation of whichduring 1997 is summarised in Note 23 to the financial statements of the Royal Dutch/Shell Group of Companies on page 55. No issueof new shares is involved under any of these plans. Shell PetroleumN.V. and The Shell Petroleum Company Limited are two of thecompanies with such plans for executives, the shares involved beingthose of the Company and The 2 Transport and TradingCompany, p.l.c.
On recommendation of the Remuneration and SuccessionReview Committee, options are granted to the Managing Directorsunder one of the latter plans once a year, except that no option is granted to a Managing Director within one year before hisretirement. All options granted to the Managing Directors relate toRoyal Dutch shares and can, subject to certain restrictions, generallybe exercised during a period of five years from the date of grant.The exercise price of each option is the market value of the sharesat the date of granting the option.
J M H van Engelshoven, A G Jacobs (as of January 1, 1998), Jonkheer A A Loudon, H de Ruiter, J D Timmer, C A J Herkströter, M A van den Bergh, S L Miller and J van der Veer) is the holder ofsix priority shares. The other 1,434 (as of January 1, 1998) priorityshares are held by the Royal Dutch Priority Shares Foundation. The Board of the Foundation consists of all the members of theSupervisory Board and the Managing Directors of the Company.
Royal Dutch Petroleum Company 13
Other Information
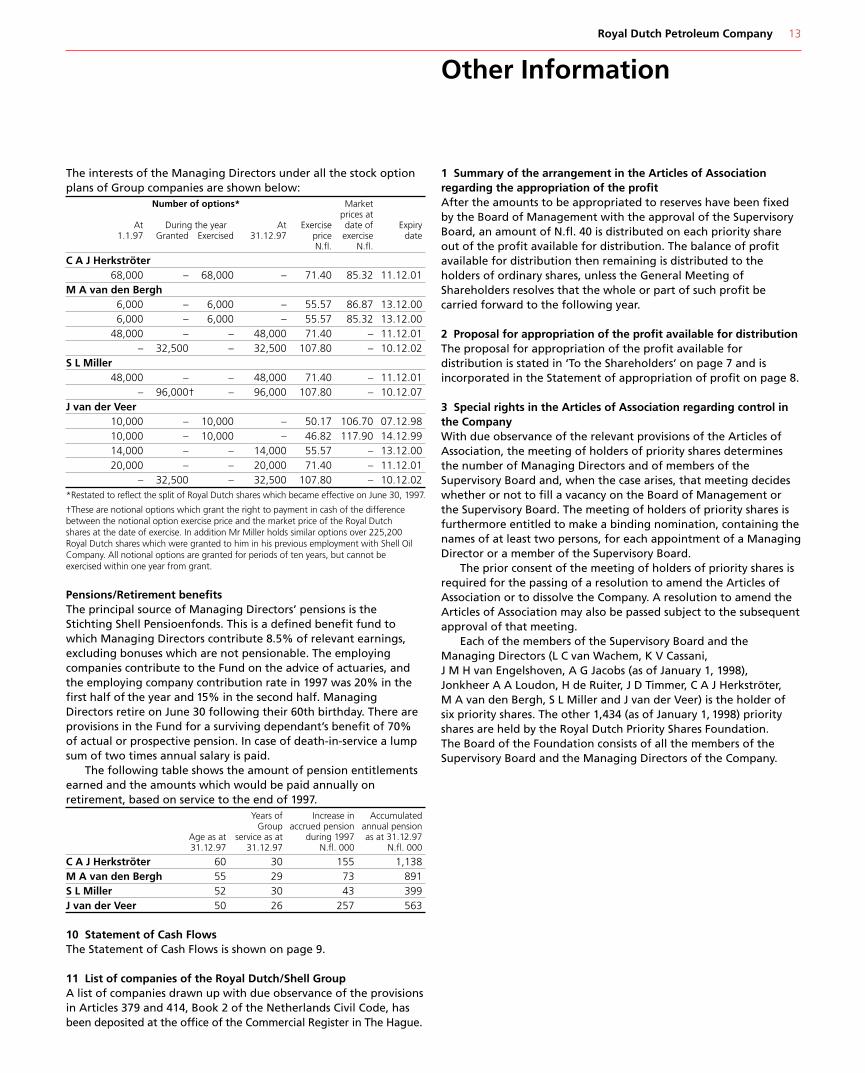
The interests of the Managing Directors under all the stock optionplans of Group companies are shown below:
Number of options* Marketprices at
At During the year At Exercise date of Expiry1.1.97 Granted Exercised 31.12.97 price exercise date
N.fl. N.fl.
C A J Herkströter68,000 – 68,000 – 71.40 85.32 11.12.01
M A van den Bergh6,000 – 6,000 – 55.57 86.87 13.12.006,000 – 6,000 – 55.57 85.32 13.12.00
48,000 – – 48,000 71.40 – 11.12.01– 32,500 – 32,500 107.80 – 10.12.02
S L Miller48,000 – – 48,000 71.40 – 11.12.01
– 96,000† – 96,000 107.80 – 10.12.07J van der Veer
10,000 – 10,000 – 50.17 106.70 07.12.9810,000 – 10,000 – 46.82 117.90 14.12.9914,000 – – 14,000 55.57 – 13.12.0020,000 – – 20,000 71.40 – 11.12.01
– 32,500 – 32,500 107.80 – 10.12.02*Restated to reflect the split of Royal Dutch shares which became effective on June 30, 1997.
†These are notional options which grant the right to payment in cash of the differencebetween the notional option exercise price and the market price of the Royal Dutchshares at the date of exercise. In addition Mr Miller holds similar options over 225,200Royal Dutch shares which were granted to him in his previous employment with Shell OilCompany. All notional options are granted for periods of ten years, but cannot beexercised within one year from grant.
Pensions/Retirement benefitsThe principal source of Managing Directors’ pensions is theStichting Shell Pensioenfonds. This is a defined benefit fund towhich Managing Directors contribute 8.5% of relevant earnings,excluding bonuses which are not pensionable. The employingcompanies contribute to the Fund on the advice of actuaries, andthe employing company contribution rate in 1997 was 20% in thefirst half of the year and 15% in the second half. ManagingDirectors retire on June 30 following their 60th birthday. There areprovisions in the Fund for a surviving dependant’s benefit of 70% of actual or prospective pension. In case of death-in-service a lumpsum of two times annual salary is paid.
The following table shows the amount of pension entitlementsearned and the amounts which would be paid annually onretirement, based on service to the end of 1997.
Years of Increase in AccumulatedGroup accrued pension annual pension
Age as at service as at during 1997 as at 31.12.9731.12.97 31.12.97 N.fl. 000 N.fl. 000
C A J Herkströter 60 30 155 1,138M A van den Bergh 55 29 73 891S L Miller 52 30 43 399J van der Veer 50 26 257 563
10 Statement of Cash FlowsThe Statement of Cash Flows is shown on page 9.
11 List of companies of the Royal Dutch/Shell Group
A list of companies drawn up with due observance of the provisionsin Articles 379 and 414, Book 2 of the Netherlands Civil Code, hasbeen deposited at the office of the Commercial Register in The Hague.1 Summary of the arrangement in the Articles of Associationregarding the appropriation of the profitAfter the amounts to be appropriated to reserves have been fixedby the Board of Management with the approval of the SupervisoryBoard, an amount of N.fl. 40 is distributed on each priority shareout of the profit available for distribution. The balance of profitavailable for distribution then remaining is distributed to theholders of ordinary shares, unless the General Meeting ofShareholders resolves that the whole or part of such profit becarried forward to the following year.
2 Proposal for appropriation of the profit available for distributionThe proposal for appropriation of the profit available fordistribution is stated in ‘To the Shareholders’ on page 7 and isincorporated in the Statement of appropriation of profit on page 8.
3 Special rights in the Articles of Association regarding control inthe CompanyWith due observance of the relevant provisions of the Articles ofAssociation, the meeting of holders of priority shares determinesthe number of Managing Directors and of members of theSupervisory Board and, when the case arises, that meeting decideswhether or not to fill a vacancy on the Board of Management orthe Supervisory Board. The meeting of holders of priority shares isfurthermore entitled to make a binding nomination, containing thenames of at least two persons, for each appointment of a ManagingDirector or a member of the Supervisory Board.
The prior consent of the meeting of holders of priority shares isrequired for the passing of a resolution to amend the Articles ofAssociation or to dissolve the Company. A resolution to amend theArticles of Association may also be passed subject to the subsequentapproval of that meeting.
Each of the members of the Supervisory Board and theManaging Directors (L C van Wachem, K V Cassani,
Report of the Auditors
14 Royal Dutch Petroleum Company
Other Information
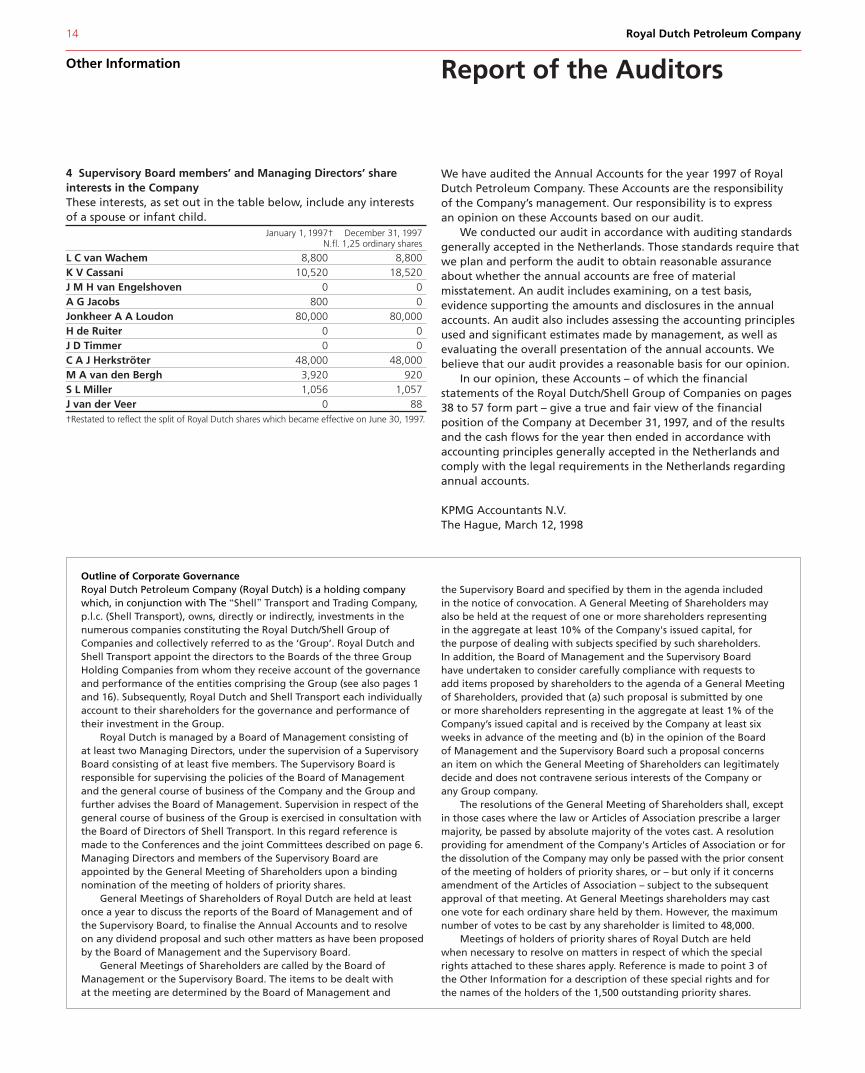
4 Supervisory Board members’ and Managing Directors’ shareinterests in the CompanyThese interests, as set out in the table below, include any interestsof a spouse or infant child.
January 1, 1997† December 31, 1997N.fl. 1,25 ordinary shares
L C van Wachem 8,800 8,800K V Cassani 10,520 18,520J M H van Engelshoven 0 0A G Jacobs 800 0Jonkheer A A Loudon 80,000 80,000H de Ruiter 0 0J D Timmer 0 0
C A J Herkströter 48,000 48,000M A van den Bergh 3,920 920We have audited the Annual Accounts for the year 1997 of RoyalDutch Petroleum Company. These Accounts are the responsibility of the Company’s management. Our responsibility is to express an opinion on these Accounts based on our audit.
We conducted our audit in accordance with auditing standardsgenerally accepted in the Netherlands. Those standards require thatwe plan and perform the audit to obtain reasonable assuranceabout whether the annual accounts are free of materialmisstatement. An audit includes examining, on a test basis,evidence supporting the amounts and disclosures in the annualaccounts. An audit also includes assessing the accounting principlesused and significant estimates made by management, as well asevaluating the overall presentation of the annual accounts. We
believe that our audit provides a reasonable basis for our opinion.number of votes to be cast by any shareholder is limited to 48,000.Meetings of holders of priority shares of Royal Dutch are held
when necessary to resolve on matters in respect of which the specialrights attached to these shares apply. Reference is made to point 3 of the Other Information for a description of these special rights and forthe names of the holders of the 1,500 outstanding priority shares.
S L Miller 1,056 1,057J van der Veer 0 88†Restated to reflect the split of Royal Dutch shares which became effective on June 30, 1997.
Outline of Corporate GovernanceRoyal Dutch Petroleum Company (Royal Dutch) is a holding companywhich, in conjunction with The 2 Transport and Trading Company,p.l.c. (Shell Transport), owns, directly or indirectly, investments in thenumerous companies constituting the Royal Dutch/Shell Group ofCompanies and collectively referred to as the ‘Group’. Royal Dutch andShell Transport appoint the directors to the Boards of the three GroupHolding Companies from whom they receive account of the governanceand performance of the entities comprising the Group (see also pages 1and 16). Subsequently, Royal Dutch and Shell Transport each individuallyaccount to their shareholders for the governance and performance oftheir investment in the Group.
Royal Dutch is managed by a Board of Management consisting of at least two Managing Directors, under the supervision of a SupervisoryBoard consisting of at least five members. The Supervisory Board isresponsible for supervising the policies of the Board of Management and the general course of business of the Company and the Group andfurther advises the Board of Management. Supervision in respect of thegeneral course of business of the Group is exercised in consultation withthe Board of Directors of Shell Transport. In this regard reference ismade to the Conferences and the joint Committees described on page 6.Managing Directors and members of the Supervisory Board areappointed by the General Meeting of Shareholders upon a bindingnomination of the meeting of holders of priority shares.
General Meetings of Shareholders of Royal Dutch are held at leastonce a year to discuss the reports of the Board of Management and ofthe Supervisory Board, to finalise the Annual Accounts and to resolve on any dividend proposal and such other matters as have been proposedby the Board of Management and the Supervisory Board.
General Meetings of Shareholders are called by the Board ofManagement or the Supervisory Board. The items to be dealt with at the meeting are determined by the Board of Management and
In our opinion, these Accounts – of which the financialstatements of the Royal Dutch/Shell Group of Companies on pages38 to 57 form part – give a true and fair view of the financialposition of the Company at December 31, 1997, and of the resultsand the cash flows for the year then ended in accordance withaccounting principles generally accepted in the Netherlands andcomply with the legal requirements in the Netherlands regardingannual accounts.
KPMG Accountants N.V.The Hague, March 12, 1998
the Supervisory Board and specified by them in the agenda included in the notice of convocation. A General Meeting of Shareholders mayalso be held at the request of one or more shareholders representing in the aggregate at least 10% of the Company's issued capital, for the purpose of dealing with subjects specified by such shareholders. In addition, the Board of Management and the Supervisory Board have undertaken to consider carefully compliance with requests to add items proposed by shareholders to the agenda of a General Meetingof Shareholders, provided that (a) such proposal is submitted by one or more shareholders representing in the aggregate at least 1% of theCompany’s issued capital and is received by the Company at least sixweeks in advance of the meeting and (b) in the opinion of the Board of Management and the Supervisory Board such a proposal concerns an item on which the General Meeting of Shareholders can legitimatelydecide and does not contravene serious interests of the Company or any Group company.
The resolutions of the General Meeting of Shareholders shall, exceptin those cases where the law or Articles of Association prescribe a largermajority, be passed by absolute majority of the votes cast. A resolutionproviding for amendment of the Company's Articles of Association or forthe dissolution of the Company may only be passed with the prior consentof the meeting of holders of priority shares, or – but only if it concernsamendment of the Articles of Association – subject to the subsequentapproval of that meeting. At General Meetings shareholders may castone vote for each ordinary share held by them. However, the maximum

Royal Dutch/Shell Group of Companies 15
The Boards of the Parent Companies
1
2
36 7
8
9
10
11
12
13
14
15
16
17
1819
54
The members of the Supervisory Board and the Board of Management of Royal Dutch Petroleum Company (Royal Dutch) and the Directors andManaging Directors of The 3 Transport and Trading Company, p.l.c.(Shell Transport) meet monthly to receive information and discuss themajor developments within the Royal Dutch/Shell Group.
Supervisory Board – Royal Dutch
1 L C van WachemChairman
2 K V Cassani
3 J M H van Engelshoven
– A G Jacobs (not pictured)
4 Jonkheer A A Loudon
5 H de Ruiter
6 J D Timmer
Board of Management – Royal Dutch
7 C A J HerkströterPresident and Managing Director
8 M A van den BerghManaging Director
9 S L MillerManaging Director
10 J van der VeerManaging Director
Board of Directors – Shell Transport
11 M Moody-StuartChairman and Managing Director
12 P B WattsManaging Director
13 Sir Antony Acland
14 T A Alireza
15 Sir Peter Holmes
16 Sir John Jennings
17 Professor R J O’Neill
18 Sir Ronald Oxburgh
19 Sir William Purves
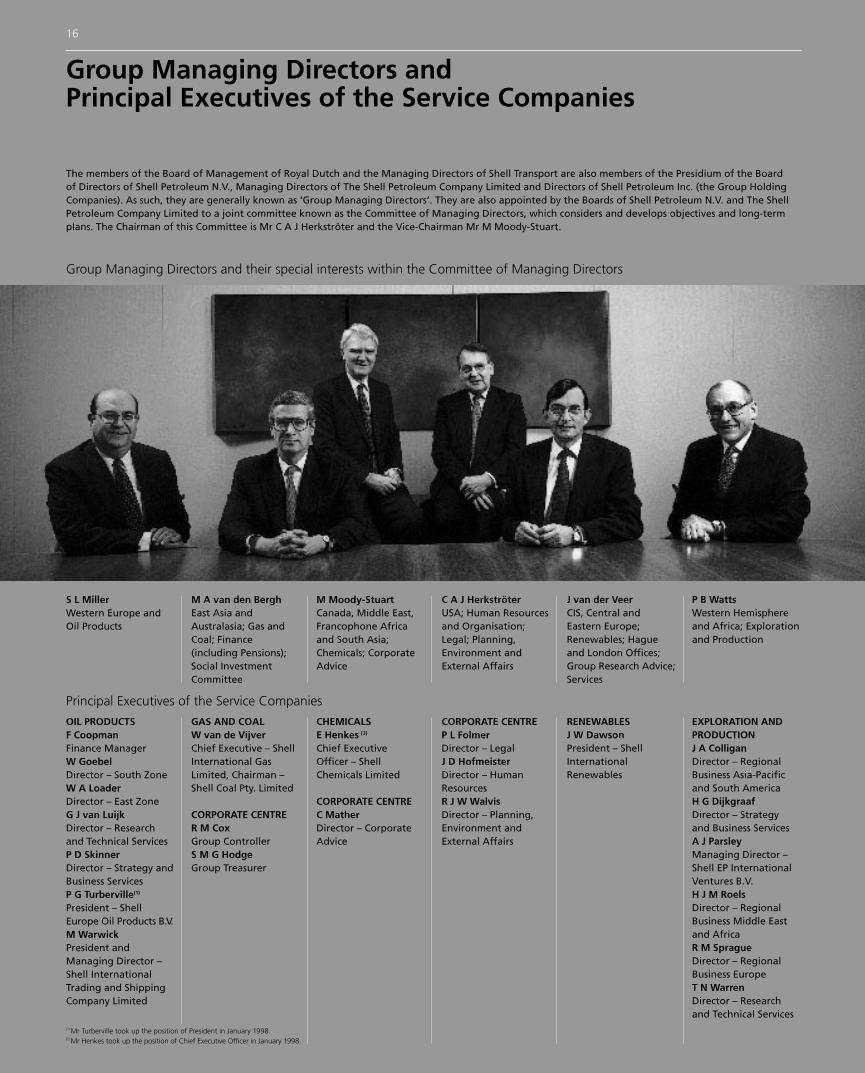
The members of the Board of Management of Royal Dutch and the Managing Directors of Shell Transport are also members of the Presidium of the Board of Directors of Shell Petroleum N.V., Managing Directors of The Shell Petroleum Company Limited and Directors of Shell Petroleum Inc. (the Group HoldingCompanies). As such, they are generally known as ‘Group Managing Directors’. They are also appointed by the Boards of Shell Petroleum N.V. and The ShellPetroleum Company Limited to a joint committee known as the Committee of Managing Directors, which considers and develops objectives and long-termplans. The Chairman of this Committee is Mr C A J Herkströter and the Vice-Chairman Mr M Moody-Stuart.
Group Managing Directors and their special interests within the Committee of Managing Directors
16
Group Managing Directors and Principal Executives of the Service Companies
S L MillerWestern Europe andOil Products
M A van den BerghEast Asia andAustralasia; Gas andCoal; Finance(including Pensions);Social InvestmentCommittee
M Moody-StuartCanada, Middle East,Francophone Africaand South Asia;Chemicals; CorporateAdvice
Principal Executives of the Service Companies
(1)Mr Turberville took up the position of President in January 1998.(2)Mr Henkes took up the position of Chief Executive Officer in January 1998.
OIL PRODUCTSF CoopmanFinance ManagerW GoebelDirector – South ZoneW A LoaderDirector – East ZoneG J van LuijkDirector – Researchand Technical ServicesP D SkinnerDirector – Strategy andBusiness ServicesP G Turberville(1)
President – ShellEurope Oil Products B.V.M WarwickPresident andManaging Director –Shell InternationalTrading and ShippingCompany Limited
GAS AND COALW van de VijverChief Executive – ShellInternational GasLimited, Chairman –Shell Coal Pty. Limited
CORPORATE CENTRER M CoxGroup ControllerS M G HodgeGroup Treasurer
CHEMICALSE Henkes (2)
Chief Executive Officer – ShellChemicals Limited
CORPORATE CENTREC MatherDirector – CorporateAdvice
C A J HerkströterUSA; Human Resourcesand Organisation;Legal; Planning,Environment andExternal Affairs
J van der VeerCIS, Central andEastern Europe;Renewables; Hagueand London Offices;Group Research Advice;Services
P B Watts Western Hemisphereand Africa; Explorationand Production
CORPORATE CENTREP L FolmerDirector – LegalJ D HofmeisterDirector – HumanResourcesR J W WalvisDirector – Planning,Environment andExternal Affairs
RENEWABLESJ W DawsonPresident – ShellInternationalRenewables
EXPLORATION ANDPRODUCTIONJ A ColliganDirector – RegionalBusiness Asia-Pacificand South AmericaH G DijkgraafDirector – Strategy and Business ServicesA J ParsleyManaging Director –Shell EP InternationalVentures B.V.H J M RoelsDirector – RegionalBusiness Middle Eastand AfricaR M SpragueDirector – RegionalBusiness EuropeT N WarrenDirector – Researchand Technical Services
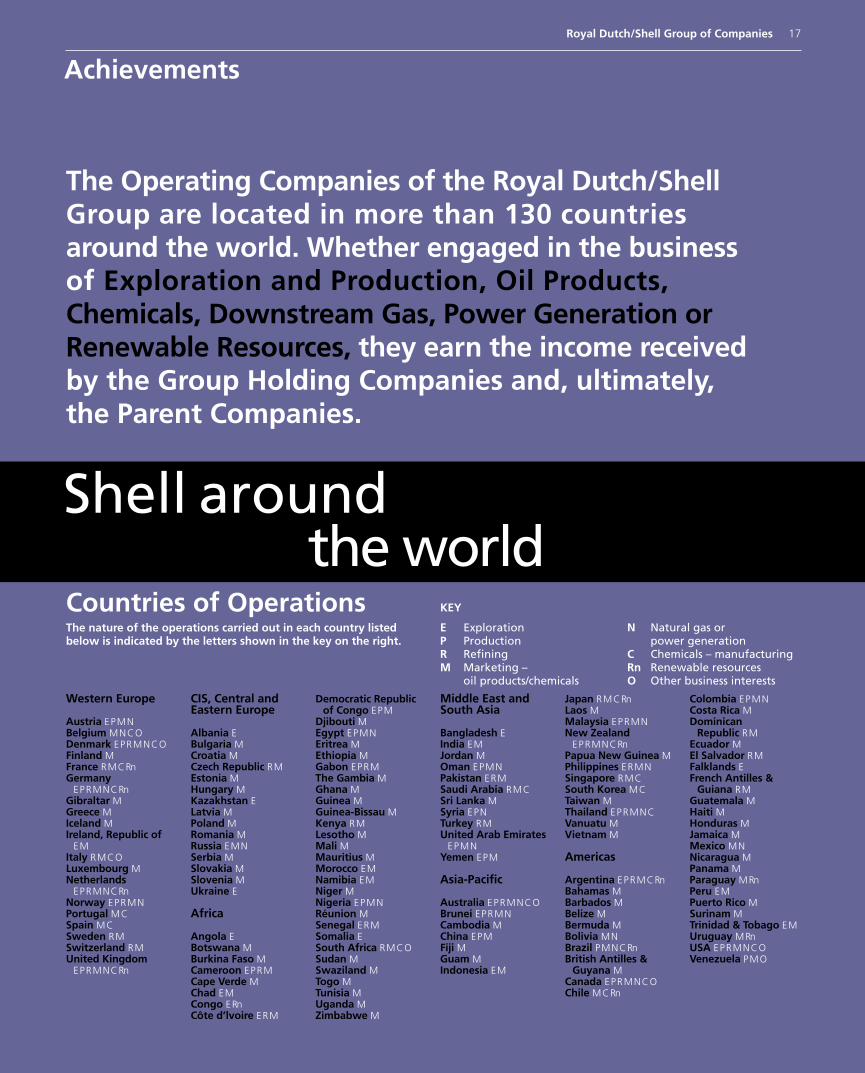
The Operating Companies of the Royal Dutch/ShellGroup are located in more than 130 countries around the world. Whether engaged in the business of Exploration and Production, Oil Products, Chemicals, Downstream Gas, Power Generation orRenewable Resources, they earn the income received by the Group Holding Companies and, ultimately, the Parent Companies.
Royal Dutch/Shell Group of Companies 17
Achievements
Countries of OperationsThe nature of the operations carried out in each country listedbelow is indicated by the letters shown in the key on the right.
KEY
E ExplorationP ProductionR RefiningM Marketing –
oil products/chemicals
N Natural gas or power generation
C Chemicals – manufacturingRn Renewable resourcesO Other business interests
Shell aroundthe world
Western Europe
Austria E P M NBelgium M N C ODenmark E P R M N C OFinland MFrance R M C Rn Germany
E P R M N C Rn Gibraltar MGreece MIceland MIreland, Republic of
E MItaly R M C OLuxembourg MNetherlands
E P R M N C Rn Norway E P R M NPortugal M CSpain M CSweden R MSwitzerland R MUnited Kingdom
E P R M N C Rn
CIS, Central and Eastern Europe
Albania EBulgaria MCroatia MCzech Republic R MEstonia MHungary MKazakhstan ELatvia MPoland MRomania MRussia E M NSerbia MSlovakia MSlovenia MUkraine E
Africa
Angola EBotswana MBurkina Faso MCameroon E P R MCape Verde MChad E MCongo E Rn Côte d’lvoire E R M
Democratic Republic of Congo E P M
Djibouti MEgypt E P M NEritrea MEthiopia MGabon E P R MThe Gambia MGhana MGuinea MGuinea-Bissau MKenya R MLesotho MMali MMauritius MMorocco E MNamibia E MNiger MNigeria E P M NRéunion MSenegal E R MSomalia ESouth Africa R M C OSudan MSwaziland MTogo MTunisia MUganda MZimbabwe M
Middle East and South Asia
Bangladesh EIndia E MJordan MOman E P M NPakistan E R MSaudi Arabia R M CSri Lanka MSyria E P NTurkey R MUnited Arab Emirates
E P M NYemen E P M
Asia-Pacific
Australia E P R M N C OBrunei E P R M NCambodia MChina E P MFiji MGuam MIndonesia E M
Japan R M C RnLaos MMalaysia E P R M NNew Zealand
E P R M N C Rn Papua New Guinea MPhilippines E R M NSingapore R M CSouth Korea M CTaiwan MThailand E P R M N CVanuatu MVietnam M
Americas
Argentina E P R M C RnBahamas MBarbados MBelize MBermuda MBolivia M NBrazil P M N C RnBritish Antilles &
Guyana MCanada E P R M N C OChile M C Rn
Colombia E P M NCosta Rica MDominican
Republic R MEcuador MEl Salvador R MFalklands EFrench Antilles &
Guiana R MGuatemala MHaiti MHonduras MJamaica MMexico M NNicaragua MPanama MParaguay M Rn Peru E MPuerto Rico MSurinam MTrinidad & Tobago E MUruguay M Rn USA E P R M N C OVenezuela P M O
Ensu
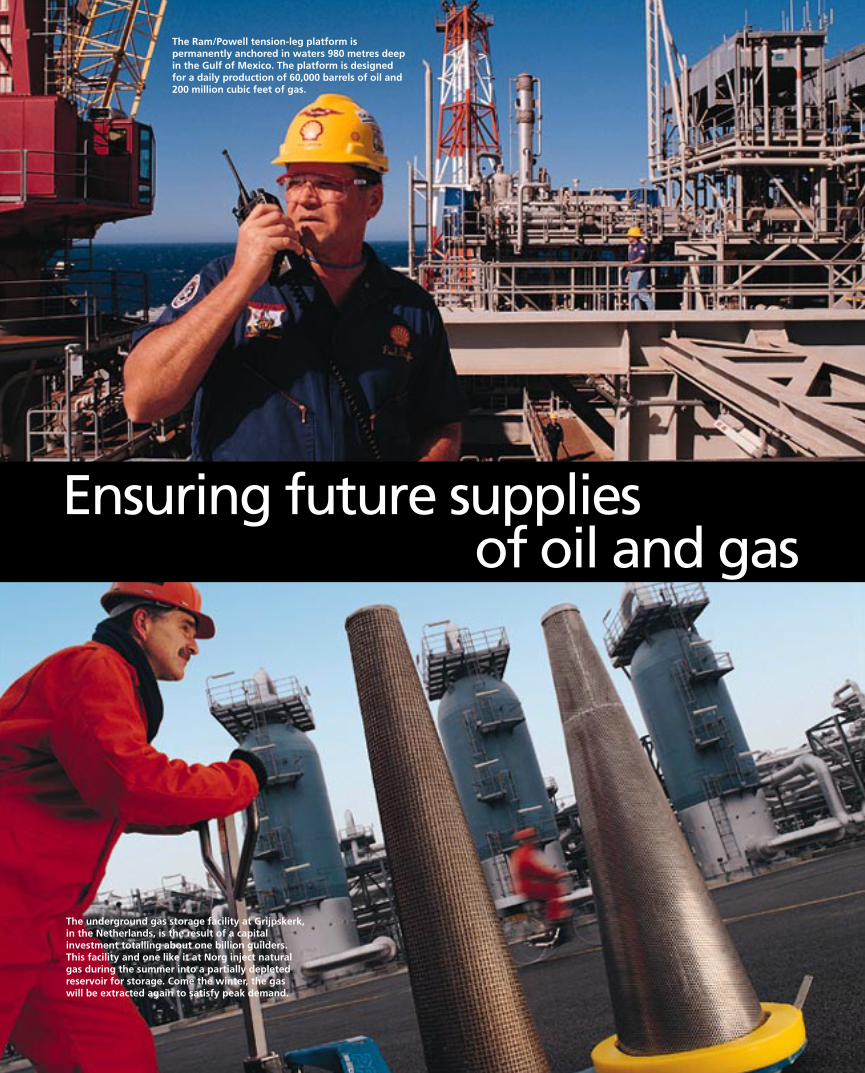
The Ram/Powell tension-leg platform ispermanently anchored in waters 980 metres deepin the Gulf of Mexico. The platform is designedfor a daily production of 60,000 barrels of oil and200 million cubic feet of gas.
ring future suppliesof oil and gas
The underground gas storage facility at Grijpskerk,in the Netherlands, is the result of a capitalinvestment totalling about one billion guilders.This facility and one like it at Norg inject naturalgas during the summer into a partially depletedreservoir for storage. Come the winter, the gaswill be extracted again to satisfy peak demand.
Wherever Group exploration and production companies operate – in the forests of Peru, on the tundra of Siberia or in the South China Sea – they strive to do so as a partner in sustainable development: providing cost-effective and reliable energy to society, whilst seeking to protect people and safeguard the environment.
Royal Dutch/Shell Group of Companies 19
Achievements
Exploration and Production
Camisea field development projectWhile appraisal drilling continued at theCamisea fields in Peru, engineering studiesbegan for the design of the infrastructurenecessary to produce natural gas andcondensate from the fields’ reservoirs and totransport them by pipeline over the Andesto Lima. If the project proceeds as planned,it could represent the biggest ever private-sector investment in the country.
The fields are located in a rain-forestenvironment inhabited by indigenous peoples.The Operating Company, Shell Prospectingand Development Peru, has striven tounderstand and address the concerns andsensitivities of local communities, regionalauthorities and the national government, as well as many national and internationalnon-governmental organisations.
Gazprom/Shell allianceGazprom, the world’s largest gas productioncompany, has agreed to co-operate with theRoyal Dutch/Shell Group on a wide range ofprojects covering the development of oiland natural gas reserves and other energyprojects, both in Russia (Gazprom’s basecountry) and internationally. As the firstembodiment of their alliance, the partnershave agreed to create – under equalownership – a joint development companywith the ambition to produce around500,000 barrels per day of crude oil andnatural gas liquids by 2003.
Deep-water expertiseDuring 1997 companies of the RoyalDutch/Shell Group continued theirexploration and production activities in thewaters of the Gulf of Mexico, West Africa,South-east Asia, North-west Europe andSouth America. In fact, two Shell projects inthe Gulf of Mexico set world-record waterdepths that year: the Ram/Powell tension-leg production platform was installed in 980 metres of water, and the Mensa subseafield began producing gas from a wellheadlocated 1,615 metres underwater.Capitalising on this wealth of experience,Group companies are pursuing deep-wateracreage with the aim of finding fields anddeveloping them quickly. As part of thisstrategy, Shell International DeepwaterServices B.V. was established.
Malampaya gas-to-power projectAs part of a set of initiatives that will move the Philippines towards energy self-sufficiency, the Malampaya gas fields inwaters off Palawan island will be developedby Shell Philippines Exploration B.V. Callingfor a total initial investment of over $4.5 billion, the overall project includes notonly the development of the offshore fieldsbut also the laying of a 510-kilometrepipeline to shore and the construction ofseveral power plants. Group companies’investment in the gas productioninfrastructure will be over $2 billion.
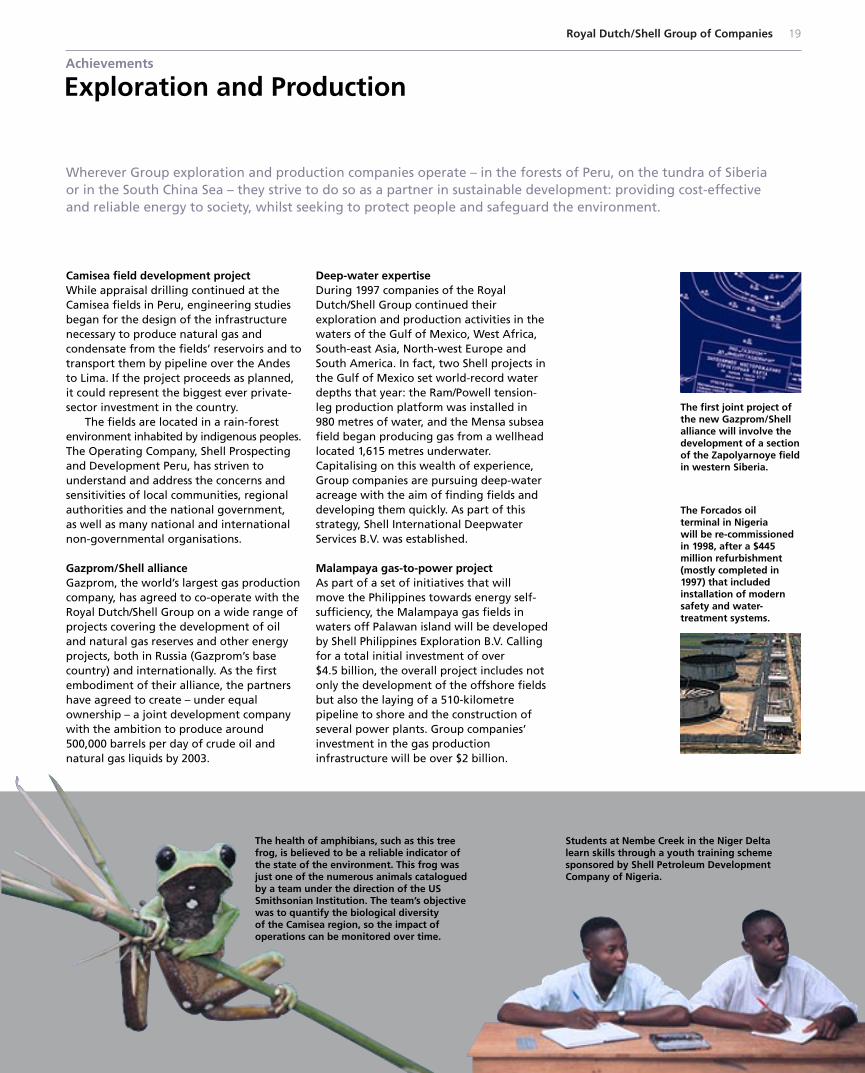
The first joint project ofthe new Gazprom/Shellalliance will involve thedevelopment of a sectionof the Zapolyarnoye field in western Siberia.
The Forcados oil terminal in Nigeria will be re-commissionedin 1998, after a $445million refurbishment(mostly completed in1997) that includedinstallation of modernsafety and water-treatment systems.
The health of amphibians, such as this treefrog, is believed to be a reliable indicator ofthe state of the environment. This frog wasjust one of the numerous animals cataloguedby a team under the direction of the USSmithsonian Institution. The team’s objectivewas to quantify the biological diversity of the Camisea region, so the impact ofoperations can be monitored over time.
Students at Nembe Creek in the Niger Delta learn skills through a youth training schemesponsored by Shell Petroleum DevelopmentCompany of Nigeria.
Companies of the Royal Dutch/Shell Group continue to find new ways of developing, manufacturing and marketing their products and services. At the same time, they endeavour to uphold the highest health, safety and environmental standards.
20 Royal Dutch/Shell Group of Companies
Achievements
Oil Products
Global tracking study of brandThe annual global tracking study, coveringalmost 100 countries, revealed the Shellbrand to be by far the most preferred of all oil company brands. Still, there is noroom for complacency: the study alsoshowed areas in which Shell companiescould do better.
Liquefied petroleum gasThe year 1997 saw Shell companiesthroughout the world take variousinitiatives related to liquefied petroleum gas(LPG): the acquisition of assets in Argentina,Brazil and the UK; the construction of newterminals in India, China and Vietnam; the launch of the international LPGAcademy training programme; and theintroduction of the easy-to-handle LPG ‘cube’ container. All these initiatives aim tofoster safety and customer satisfaction inthis fast-growing sector.
Development of retail portfolioShell retail sites continue to be developedthroughout the world, progressivelyacquiring the new look and addingconvenience stores. Indeed, some 5,000stores – principally ‘Select’ stores – are nowopen in more than 50 countries, most ofthem for 24 hours a day. Acquisitions in theUK, Germany and France helped to extendthe Shell network.
Reorganisation to increase customer focusThe Group’s Aviation and Marine businesseswere restructured in 1997. Further, a neworganisation was introduced in Europe,effective January 1, 1998. These changes willhelp Shell companies to meet the market’scompetitive challenges with increasedcustomer focus.
Start-up of Per+The Per+ complex in Pernis, the Netherlands, began commercial operations in 1997. The$2 billion investment enables the Group’slargest refinery in Europe to manufactureonly high-quality ‘light’ products, such asgasoline and kerosine, with near-zerowaste. An excellent health, safety andenvironmental performance was achievedduring the construction, commissioning andstart-up phases of the complex.
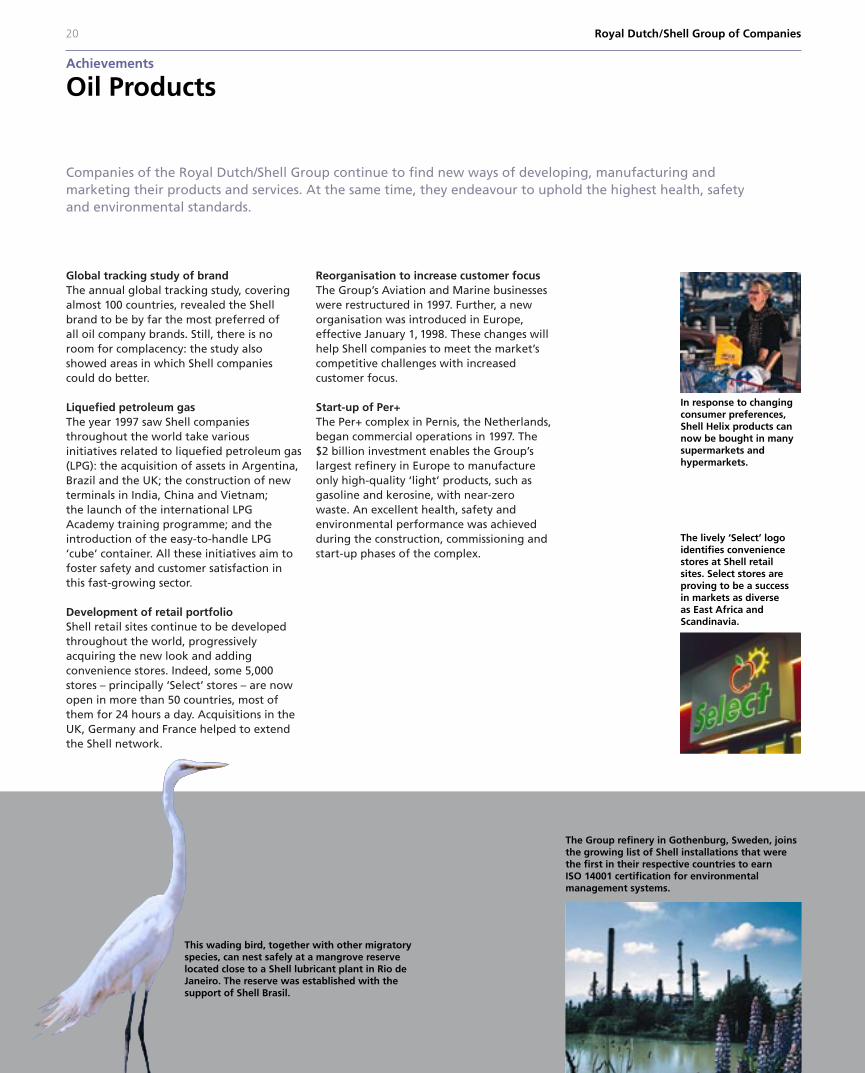
In response to changingconsumer preferences,Shell Helix products cannow be bought in manysupermarkets andhypermarkets.
The lively ‘Select’ logoidentifies conveniencestores at Shell retail sites. Select stores areproving to be a success in markets as diverse as East Africa andScandinavia.
This wading bird, together with other migratoryspecies, can nest safely at a mangrove reservelocated close to a Shell lubricant plant in Rio deJaneiro. The reserve was established with thesupport of Shell Brasil.
The Group refinery in Gothenburg, Sweden, joins the growing list of Shell installations that werethe first in their respective countries to earn ISO 14001 certification for environmentalmanagement systems.

A clean, portable cooking fuel is made available to communities in Senegal thanks to a newliquefied petroleum gas (LPG) complex. LPG isexpected to progressively replace the charcoal andwood that are still widely used, thereby helping toreduce deforestation and make for a healthierliving environment.
The first choiceof customers everywhere
Market-research discussion groups give Shell companiesan opportunity to listen to people and to learn about their wishes and attitudes. Here, reactions to a LEGO® Ferrari model influence the development of a new global promotion.

Reaching across the globewith a local touch
A polypropylene sample obtained with an unconventional, high-yield catalyst is being tested at Montell’s Giulio Natta Research Centre in Ferrara, Italy. Group companies promote best practice – including the appropriateuse of protective clothing – not only amongst technicians inlaboratories but also amongst all workers in the industry.
By maximising the use of existing assets, developing new products and processes, and entering into commercialpartnerships, the Royal Dutch/Shell Group is compiling a portfolio of chemicals businesses, each of which aims to be the leader in its sector.
Royal Dutch/Shell Group of Companies 23
Achievements
Chemicals
GlobalisationOn January 1, 1998, the separate companiesthat comprise Shell Chemicals put into effect a series of agreements with a newmanagement services company that willenable them to bring their combinedresources to bear on world-wide markets,on the one hand, and on key product areas,on the other. The new company will provideglobal strategic advice through productbusiness units. This globalisation is notcentralisation, however. The companies will continue to support their network oflocal customers.
Full acquisition of MontellEstablished in 1995 under equal ownershipwith Montedison, the Montell joint venturewas immediately recognised as a key playerin the polypropylene sector of the worldplastics market. In 1997 the venture’sownership passed entirely into the hands of Shell companies, thereby demonstratingtheir belief in the development potential ofpolypropylene and their determination toremain the world leader in the productionand marketing of this thermoplastic.
New plant in Moerdijk, the NetherlandsShell companies and BASF have put in placea joint venture for the construction of aworld-scale styrene monomer/propyleneoxide plant at Moerdijk. This plant, togetherwith a similar one in Singapore, strengthens
Group companies’ manufacturing status atopposite sides of the world.
Expansion of plant in Geismar, LouisianaThe Geismar plant is set to move furtherahead of the competition with twoinvestments: the introduction of a catalyst-based system to boost the output ofdetergent alcohols and the construction of a new plant to produce the Carilonengineering thermoplastic, for which evermore varied applications are being found.
Polystyrene joint venture in ChinaA joint-venture agreement has led to the incorporation of the Jinling ShellPetrochemical Company in the People’sRepublic of China. The company, 60% ofwhich is owned by Shell companies and 40%by the Jinling Petrochemical Corporation,will modernise a plant in Nanjing that hasmanufactured expandable polystyrene forseveral years under Shell licence.
Polyethylene joint venture in EuropeIn another major initiative, Shell companiesand BASF teamed up again to put in place a50:50 joint venture in the polyethylenebusiness. The joint venture, named Elenac,will have manufacturing sites across Europethat offer customers a wide range ofproduct grades and services. It will be one ofthe major European polyethylene suppliers.
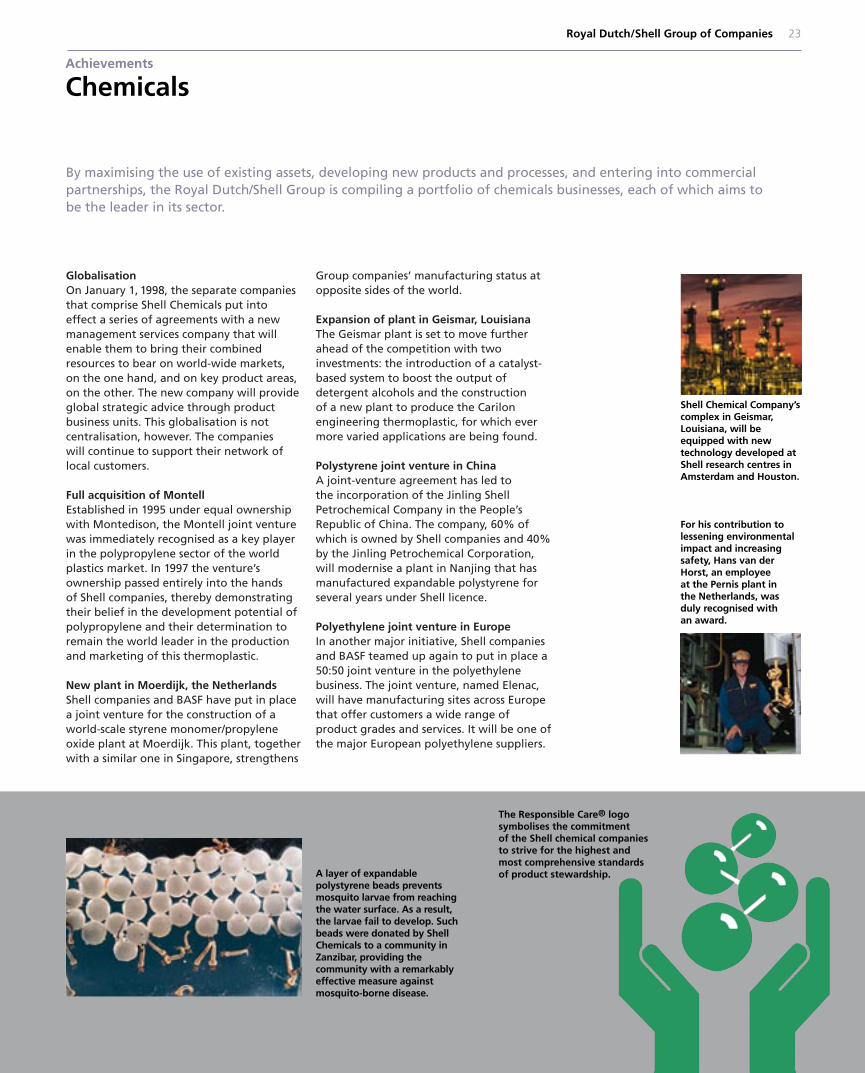
Shell Chemical Company’scomplex in Geismar,Louisiana, will beequipped with newtechnology developed atShell research centres inAmsterdam and Houston.
For his contribution tolessening environmentalimpact and increasingsafety, Hans van derHorst, an employee at the Pernis plant in the Netherlands, wasduly recognised with an award.
A layer of expandablepolystyrene beads preventsmosquito larvae from reachingthe water surface. As a result,the larvae fail to develop. Suchbeads were donated by ShellChemicals to a community inZanzibar, providing thecommunity with a remarkablyeffective measure againstmosquito-borne disease.
The Responsible Care® logosymbolises the commitment of the Shell chemical companiesto strive for the highest andmost comprehensive standardsof product stewardship.
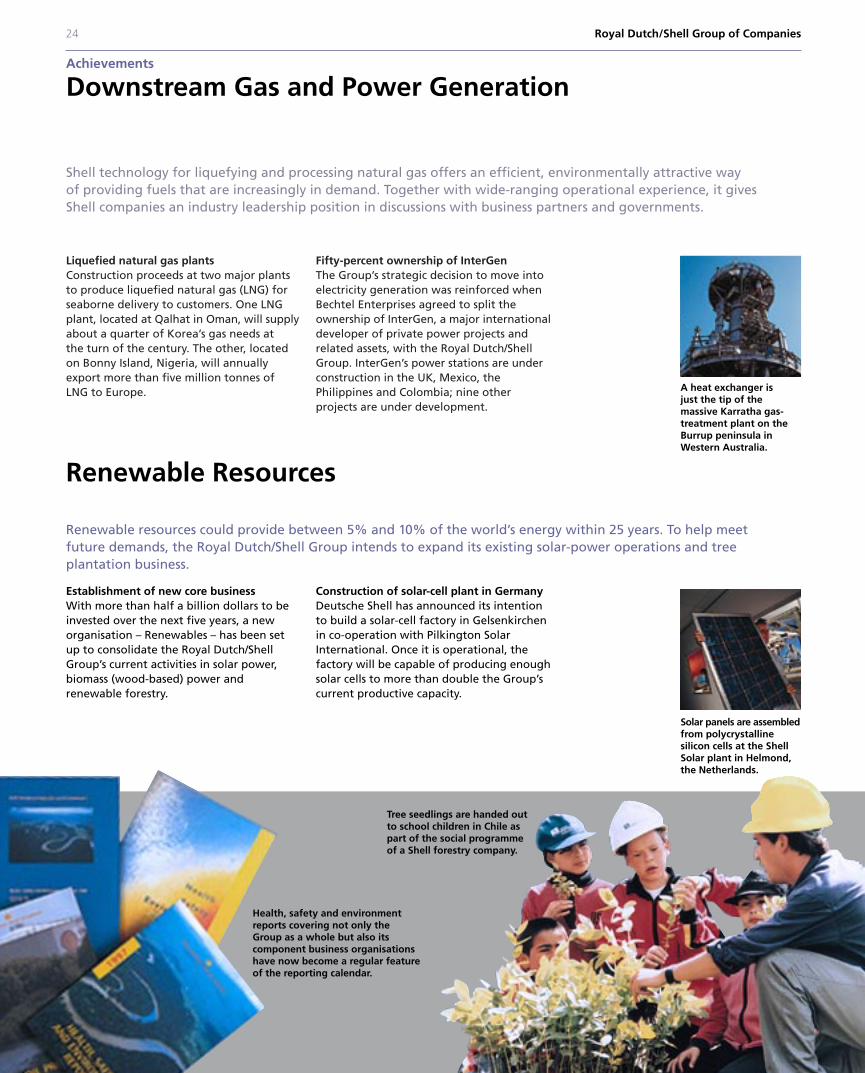
Shell technology for liquefying and processing natural gas offers an efficient, environmentally attractive way of providing fuels that are increasingly in demand. Together with wide-ranging operational experience, it gives Shell companies an industry leadership position in discussions with business partners and governments.
24 Royal Dutch/Shell Group of Companies
Achievements
Downstream Gas and Power Generation
Liquefied natural gas plantsConstruction proceeds at two major plantsto produce liquefied natural gas (LNG) forseaborne delivery to customers. One LNGplant, located at Qalhat in Oman, will supplyabout a quarter of Korea’s gas needs at the turn of the century. The other, locatedon Bonny Island, Nigeria, will annuallyexport more than five million tonnes of LNG to Europe.
Fifty-percent ownership of InterGenThe Group’s strategic decision to move intoelectricity generation was reinforced whenBechtel Enterprises agreed to split theownership of InterGen, a major internationaldeveloper of private power projects andrelated assets, with the Royal Dutch/ShellGroup. InterGen’s power stations are underconstruction in the UK, Mexico, thePhilippines and Colombia; nine otherprojects are under development.
Renewable Resources
Renewable resources could provide between 5% and 10% of the world’s energy within 25 years. To help meet future demands, the Royal Dutch/Shell Group intends to expand its existing solar-power operations and treeplantation business.
Western Australia.
Establishment of new core businessWith more than half a billion dollars to beinvested over the next five years, a neworganisation – Renewables – has been set up to consolidate the Royal Dutch/ShellGroup’s current activities in solar power,biomass (wood-based) power andrenewable forestry.
Construction of solar-cell plant in GermanyDeutsche Shell has announced its intentionto build a solar-cell factory in Gelsenkirchenin co-operation with Pilkington SolarInternational. Once it is operational, thefactory will be capable of producing enoughsolar cells to more than double the Group’scurrent productive capacity.
A heat exchanger is just the tip of themassive Karratha gas-treatment plant on theBurrup peninsula in
Solar panels are assembledfrom polycrystallinesilicon cells at the ShellSolar plant in Helmond,the Netherlands.
Tree seedlito school cpart of theof a Shell f
Health, safety and environmentreports covering not only theGroup as a whole but also itscomponent business organisationshave now become a regular featureof the reporting calendar.
ngs are handed outhildren in Chile as social programmeorestry company.

The gas-fired power station at Rocksavage, UK, was constructed byInterGen, a developer of power projects.With its 50% acquisition of the company,the Royal Dutch/Shell Group combines itsaccess to natural gas – the cleanest fossilfuel – with electricity generation.
Taking thelong-term view
The fast-growing eucalyptus trees of ShellForestry’s Rucamanqui plantation in Chilesupply wood for the global paper andfibreboard industries. They also provideShell companies with valuable experiencein the development of biomass power: the conversion of wood into energy.
26
Discussion and Analysis of Financial Conditionand Results of OperationsSummary
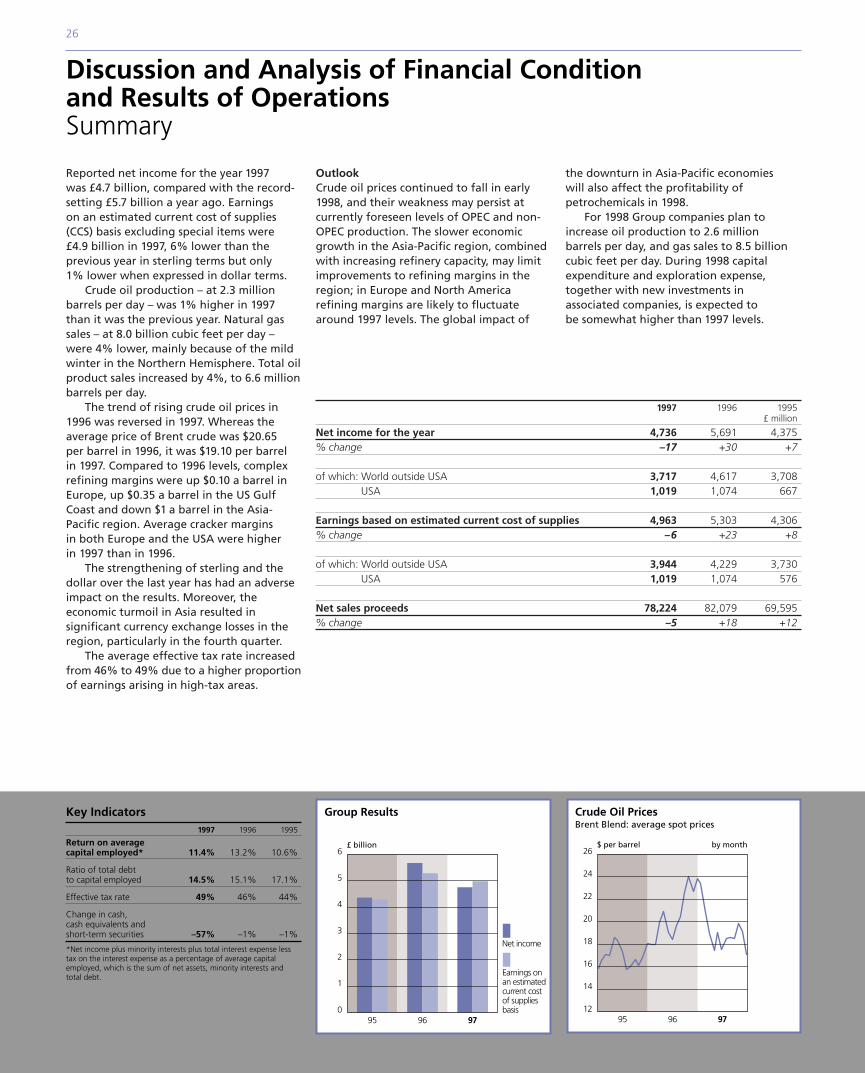
Reported net income for the year 1997was £4.7 billion, compared with the record-setting £5.7 billion a year ago. Earnings on an estimated current cost of supplies(CCS) basis excluding special items were £4.9 billion in 1997, 6% lower than theprevious year in sterling terms but only 1% lower when expressed in dollar terms.
Crude oil production – at 2.3 millionbarrels per day – was 1% higher in 1997than it was the previous year. Natural gassales – at 8.0 billion cubic feet per day –were 4% lower, mainly because of the mildwinter in the Northern Hemisphere. Total oilproduct sales increased by 4%, to 6.6 millionbarrels per day.
The trend of rising crude oil prices in1996 was reversed in 1997. Whereas theaverage price of Brent crude was $20.65 per barrel in 1996, it was $19.10 per barrel in 1997. Compared to 1996 levels, complexrefining margins were up $0.10 a barrel inEurope, up $0.35 a barrel in the US GulfCoast and down $1 a barrel in the Asia-Pacific region. Average cracker margins in both Europe and the USA were higher in 1997 than in 1996.
The strengthening of sterling and thedollar over the last year has had an adverseimpact on the results. Moreover, theeconomic turmoil in Asia resulted insignificant currency exchange losses in theregion, particularly in the fourth quarter.
The average effective tax rate increasedfrom 46% to 49% due to a higher proportionof earnings arising in high-tax areas.
OutlookCrude oil prices continued to fall in early1998, and their weakness may persist atcurrently foreseen levels of OPEC and non-OPEC production. The slower economicgrowth in the Asia-Pacific region, combinedwith increasing refinery capacity, may limitimprovements to refining margins in theregion; in Europe and North Americarefining margins are likely to fluctuatearound 1997 levels. The global impact of
the downturn in Asia-Pacific economies will also affect the profitability ofpetrochemicals in 1998.
For 1998 Group companies plan toincrease oil production to 2.6 million barrels per day, and gas sales to 8.5 billioncubic feet per day. During 1998 capitalexpenditure and exploration expense,together with new investments in associated companies, is expected to be somewhat higher than 1997 levels.
1997 1996 1995£ million
Net income for the year 4,736 5,691 4,375% change –17 +30 +7
of which: World outside USA 3,717 4,617 3,708USA 1,019 1,074 667
Earnings based on estimated current cost of supplies 4,963 5,303 4,306% change –6 +23 +8
of which: World outside USA 3,944 4,229 3,730USA 1,019 1,074 576
Net sales proceeds 78,224 82,079 69,595% change –5 +18 +12
Key Indicators1997 1996 1995
Return on averagecapital employed* 11.4% 13.2% 10.6%
Ratio of total debt to capital employed 14.5% 15.1% 17.1%
Effective tax rate 49% 46% 44%
Change in cash, cash equivalents and short-term securities –57% –1% –1%
*Net income plus minority interests plus total interest expense lesstax on the interest expense as a percentage of average capitalemployed, which is the sum of net assets, minority interests and total debt.
6
5
4
3
2
1
095 96 97
Group Results
Earnings onan estimatedcurrent costof suppliesbasis
Net income
£ billion26
24
22
20
18
16
14
1295 96 97
Crude Oil Prices Brent Blend: average spot prices
$ per barrel by month
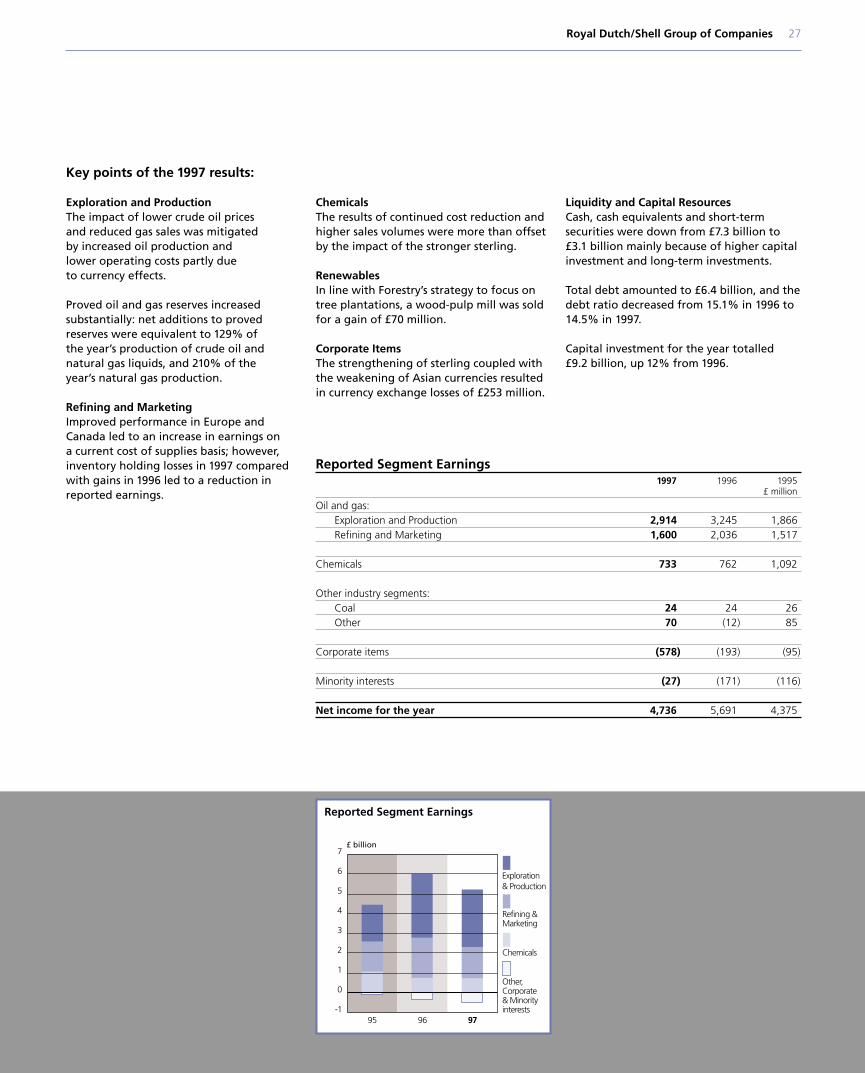
Royal Dutch/Shell Group of Companies 27
Key points of the 1997 results:
Exploration and ProductionThe impact of lower crude oil prices and reduced gas sales was mitigated by increased oil production and lower operating costs partly due to currency effects.
Proved oil and gas reserves increasedsubstantially: net additions to provedreserves were equivalent to 129% of the year’s production of crude oil andnatural gas liquids, and 210% of the year’s natural gas production.
Refining and MarketingImproved performance in Europe andCanada led to an increase in earnings on a current cost of supplies basis; however,inventory holding losses in 1997 comparedwith gains in 1996 led to a reduction in
reported earnings.ChemicalsThe results of continued cost reduction andhigher sales volumes were more than offsetby the impact of the stronger sterling.
RenewablesIn line with Forestry’s strategy to focus ontree plantations, a wood-pulp mill was soldfor a gain of £70 million.
Corporate ItemsThe strengthening of sterling coupled withthe weakening of Asian currencies resultedin currency exchange losses of £253 million.
Liquidity and Capital ResourcesCash, cash equivalents and short-termsecurities were down from £7.3 billion to£3.1 billion mainly because of higher capitalinvestment and long-term investments.
Total debt amounted to £6.4 billion, and thedebt ratio decreased from 15.1% in 1996 to14.5% in 1997.
Capital investment for the year totalled £9.2 billion, up 12% from 1996.
Reported Segment Earnings1997 1996 1995
£ million
Oil and gas:Exploration and Production 2,914 3,245 1,866Refining and Marketing 1,600 2,036 1,517
Chemicals 733 762 1,092
Other industry segments:Coal 24 24 26Other 70 (12) 85
Corporate items (578) (193) (95)
Minority interests (27) (171) (116)
Net income for the year 4,736 5,691 4,375
7
6
5
4
3
2
1
0
-195 96 97
Reported Segment Earnings
Refining &Marketing
Chemicals
Other,Corporate& Minorityinterests
Exploration& Production
£ billion
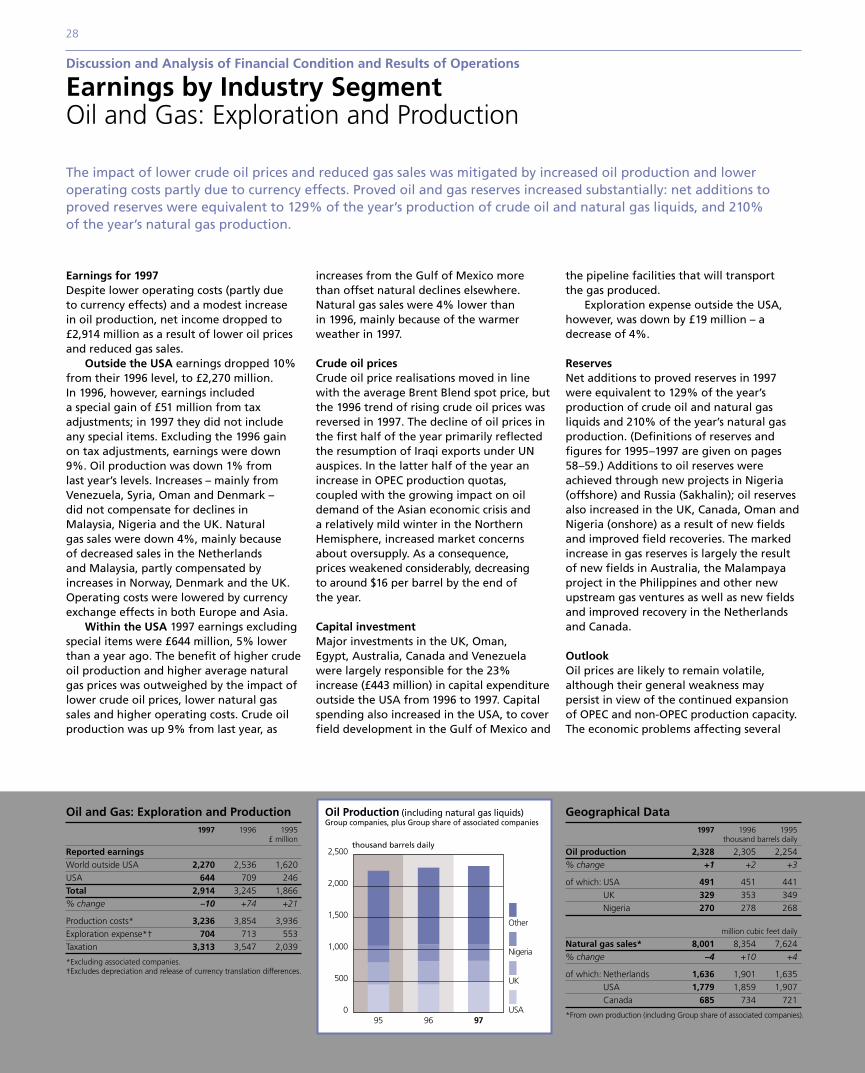
28
Discussion and Analysis of Financial Condition and Results of Operations
Earnings by Industry SegmentOil and Gas: Exploration and Production
The impact of lower crude oil prices and reduced gas sales was mitigated by increased oil production and loweroperating costs partly due to currency effects. Proved oil and gas reserves increased substantially: net additions toproved reserves were equivalent to 129% of the year’s production of crude oil and natural gas liquids, and 210% of the year’s natural gas production.
Earnings for 1997Despite lower operating costs (partly due to currency effects) and a modest increase in oil production, net income dropped to£2,914 million as a result of lower oil pricesand reduced gas sales.
Outside the USA earnings dropped 10%from their 1996 level, to £2,270 million. In 1996, however, earnings included a special gain of £51 million from taxadjustments; in 1997 they did not includeany special items. Excluding the 1996 gainon tax adjustments, earnings were down9%. Oil production was down 1% from last year’s levels. Increases – mainly fromVenezuela, Syria, Oman and Denmark – did not compensate for declines in Malaysia, Nigeria and the UK. Natural gas sales were down 4%, mainly because of decreased sales in the Netherlands and Malaysia, partly compensated byincreases in Norway, Denmark and the UK.Operating costs were lowered by currencyexchange effects in both Europe and Asia.
Within the USA 1997 earnings excludingspecial items were £644 million, 5% lowerthan a year ago. The benefit of higher crudeoil production and higher average naturalgas prices was outweighed by the impact oflower crude oil prices, lower natural gassales and higher operating costs. Crude oilproduction was up 9% from last year, as
increases from the Gulf of Mexico morethan offset natural declines elsewhere.Natural gas sales were 4% lower than in 1996, mainly because of the warmerweather in 1997.
Crude oil pricesCrude oil price realisations moved in linewith the average Brent Blend spot price, butthe 1996 trend of rising crude oil prices wasreversed in 1997. The decline of oil prices inthe first half of the year primarily reflectedthe resumption of Iraqi exports under UNauspices. In the latter half of the year anincrease in OPEC production quotas,coupled with the growing impact on oildemand of the Asian economic crisis and a relatively mild winter in the NorthernHemisphere, increased market concernsabout oversupply. As a consequence, prices weakened considerably, decreasing to around $16 per barrel by the end of the year.
Capital investmentMajor investments in the UK, Oman, Egypt, Australia, Canada and Venezuelawere largely responsible for the 23%increase (£443 million) in capital expenditureoutside the USA from 1996 to 1997. Capitalspending also increased in the USA, to coverfield development in the Gulf of Mexico and
the pipeline facilities that will transport the gas produced.
Exploration expense outside the USA,however, was down by £19 million – adecrease of 4%.
ReservesNet additions to proved reserves in 1997were equivalent to 129% of the year’sproduction of crude oil and natural gasliquids and 210% of the year’s natural gasproduction. (Definitions of reserves andfigures for 1995–1997 are given on pages58–59.) Additions to oil reserves wereachieved through new projects in Nigeria(offshore) and Russia (Sakhalin); oil reservesalso increased in the UK, Canada, Oman andNigeria (onshore) as a result of new fieldsand improved field recoveries. The markedincrease in gas reserves is largely the resultof new fields in Australia, the Malampayaproject in the Philippines and other newupstream gas ventures as well as new fieldsand improved recovery in the Netherlandsand Canada.
OutlookOil prices are likely to remain volatile,although their general weakness may persist in view of the continued expansionof OPEC and non-OPEC production capacity.The economic problems affecting several
Oil and Gas: Exploration and Production1997 1996 1995
£ million
Reported earningsWorld outside USA 2,270 2,536 1,620USA 644 709 246Total 2,914 3,245 1,866% change –10 +74 +21
Production costs* 3,236 3,854 3,936Exploration expense*† 704 713 553Taxation 3,313 3,547 2,039
*Excluding associated companies.†Excludes depreciation and release of currency translation differences.
2,500
2,000
1,500
1,000
500
095 96 97
Oil Production (including natural gas liquids)Group companies, plus Group share of associated companies
Nigeria
UK
USA
Other
thousand barrels daily
Geogra
Oil produ% change
of which: UUN
Natural ga% change
of which: NUC
*From own
phical Data1997 1996 1995
thousand barrels daily
ction 2,328 2,305 2,254+1 +2 +3
SA 491 451 441K 329 353 349igeria 270 278 268
million cubic feet daily
s sales* 8,001 8,354 7,624–4 +10 +4
etherlands 1,636 1,901 1,635SA 1,779 1,859 1,907anada 685 734 721
production (including Group share of associated companies).
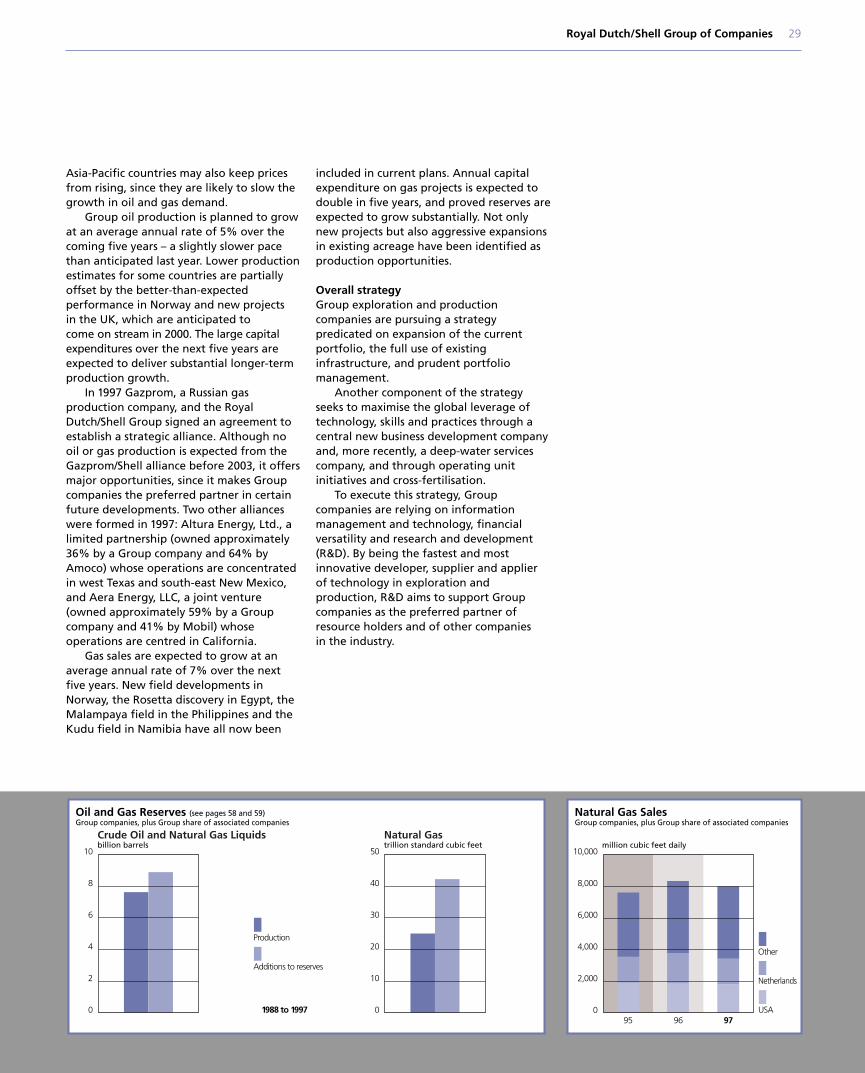
Royal Dutch/Shell Group of Companies 29
Asia-Pacific countries may also keep pricesfrom rising, since they are likely to slow thegrowth in oil and gas demand.
Group oil production is planned to growat an average annual rate of 5% over thecoming five years – a slightly slower pacethan anticipated last year. Lower productionestimates for some countries are partiallyoffset by the better-than-expectedperformance in Norway and new projects in the UK, which are anticipated to come on stream in 2000. The large capitalexpenditures over the next five years areexpected to deliver substantial longer-termproduction growth.
In 1997 Gazprom, a Russian gasproduction company, and the RoyalDutch/Shell Group signed an agreement toestablish a strategic alliance. Although nooil or gas production is expected from theGazprom/Shell alliance before 2003, it offersmajor opportunities, since it makes Groupcompanies the preferred partner in certainfuture developments. Two other allianceswere formed in 1997: Altura Energy, Ltd., alimited partnership (owned approximately36% by a Group company and 64% byAmoco) whose operations are concentratedin west Texas and south-east New Mexico,and Aera Energy, LLC, a joint venture(owned approximately 59% by a Groupcompany and 41% by Mobil) whoseoperations are centred in California.
Gas sales are expected to grow at anaverage annual rate of 7% over the nextfive years. New field developments inNorway, the Rosetta discovery in Egypt, theMalampaya field in the Philippines and theKudu field in Namibia have all now been
included in current plans. Annual capitalexpenditure on gas projects is expected todouble in five years, and proved reserves areexpected to grow substantially. Not onlynew projects but also aggressive expansionsin existing acreage have been identified asproduction opportunities.
Overall strategyGroup exploration and productioncompanies are pursuing a strategypredicated on expansion of the currentportfolio, the full use of existinginfrastructure, and prudent portfoliomanagement.
Another component of the strategyseeks to maximise the global leverage oftechnology, skills and practices through acentral new business development companyand, more recently, a deep-water servicescompany, and through operating unitinitiatives and cross-fertilisation.
To execute this strategy, Groupcompanies are relying on informationmanagement and technology, financialversatility and research and development(R&D). By being the fastest and mostinnovative developer, supplier and applierof technology in exploration andproduction, R&D aims to support Groupcompanies as the preferred partner ofresource holders and of other companies in the industry.
10
8
6
4
2
0 1988 to 1997
Oil and Gas Reserves (see pages 58 and 59)Group companies, plus Group share of associated companies
Crude Oil and Natural Gas Liquids Natural Gas
Production
Additions to reserves
50
40
30
20
10
0
billion barrels trillion standard cubic feet
10,0008,000
6,000
4,000
2,000
095 96 97
Natural Gas SalesGroup companies, plus Group share of associated companies
Netherlands
USA
Other
million cubic feet daily
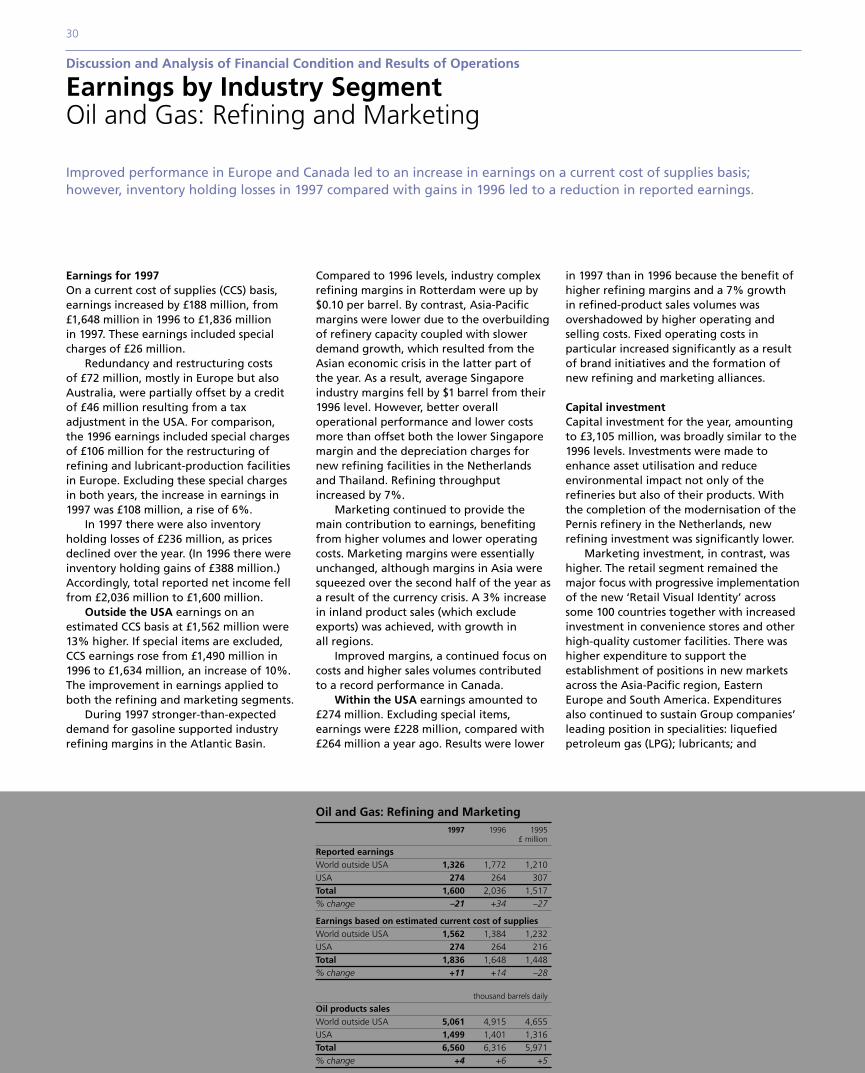
30
Discussion and Analysis of Financial Condition and Results of Operations
Earnings by Industry Segment Oil and Gas: Refining and Marketing
Improved performance in Europe and Canada led to an increase in earnings on a current cost of supplies basis;however, inventory holding losses in 1997 compared with gains in 1996 led to a reduction in reported earnings.
Earnings for 1997On a current cost of supplies (CCS) basis,earnings increased by £188 million, from£1,648 million in 1996 to £1,836 million in 1997. These earnings included specialcharges of £26 million.
Redundancy and restructuring costs of £72 million, mostly in Europe but alsoAustralia, were partially offset by a credit of £46 million resulting from a taxadjustment in the USA. For comparison, the 1996 earnings included special chargesof £106 million for the restructuring ofrefining and lubricant-production facilitiesin Europe. Excluding these special charges in both years, the increase in earnings in1997 was £108 million, a rise of 6%.
In 1997 there were also inventoryholding losses of £236 million, as pricesdeclined over the year. (In 1996 there wereinventory holding gains of £388 million.)Accordingly, total reported net income fellfrom £2,036 million to £1,600 million.
Outside the USA earnings on anestimated CCS basis at £1,562 million were13% higher. If special items are excluded,CCS earnings rose from £1,490 million in1996 to £1,634 million, an increase of 10%.The improvement in earnings applied toboth the refining and marketing segments.
During 1997 stronger-than-expecteddemand for gasoline supported industryrefining margins in the Atlantic Basin.
Compared to 1996 levels, industry complexrefining margins in Rotterdam were up by$0.10 per barrel. By contrast, Asia-Pacificmargins were lower due to the overbuildingof refinery capacity coupled with slowerdemand growth, which resulted from theAsian economic crisis in the latter part ofthe year. As a result, average Singaporeindustry margins fell by $1 barrel from their1996 level. However, better overalloperational performance and lower costsmore than offset both the lower Singaporemargin and the depreciation charges fornew refining facilities in the Netherlandsand Thailand. Refining throughputincreased by 7%.
Marketing continued to provide themain contribution to earnings, benefitingfrom higher volumes and lower operatingcosts. Marketing margins were essentiallyunchanged, although margins in Asia weresqueezed over the second half of the year asa result of the currency crisis. A 3% increasein inland product sales (which excludeexports) was achieved, with growth in all regions.
Improved margins, a continued focus oncosts and higher sales volumes contributedto a record performance in Canada.
Within the USA earnings amounted to£274 million. Excluding special items,earnings were £228 million, compared with£264 million a year ago. Results were lower
in 1997 than in 1996 because the benefit ofhigher refining margins and a 7% growth in refined-product sales volumes wasovershadowed by higher operating andselling costs. Fixed operating costs inparticular increased significantly as a resultof brand initiatives and the formation ofnew refining and marketing alliances.
Capital investmentCapital investment for the year, amountingto £3,105 million, was broadly similar to the1996 levels. Investments were made toenhance asset utilisation and reduceenvironmental impact not only of therefineries but also of their products. Withthe completion of the modernisation of thePernis refinery in the Netherlands, newrefining investment was significantly lower.
Marketing investment, in contrast, washigher. The retail segment remained themajor focus with progressive implementationof the new ‘Retail Visual Identity’ acrosssome 100 countries together with increasedinvestment in convenience stores and otherhigh-quality customer facilities. There washigher expenditure to support theestablishment of positions in new marketsacross the Asia-Pacific region, EasternEurope and South America. Expendituresalso continued to sustain Group companies’leading position in specialities: liquefiedpetroleum gas (LPG); lubricants; and
Oil and Gas: Refining and Marketing1997 1996 1995
£ million
Reported earningsWorld outside USA 1,326 1,772 1,210USA 274 264 307Total 1,600 2,036 1,517% change –21 +34 –27
Earnings based on estimated current cost of suppliesWorld outside USA 1,562 1,384 1,232USA 274 264 216Total 1,836 1,648 1,448% change +11 +14 –28
thousand barrels daily
Oil products salesWorld outside USA 5,061 4,915 4,655USA 1,499 1,401 1,316Total 6,560 6,316 5,971% change +4 +6 +5
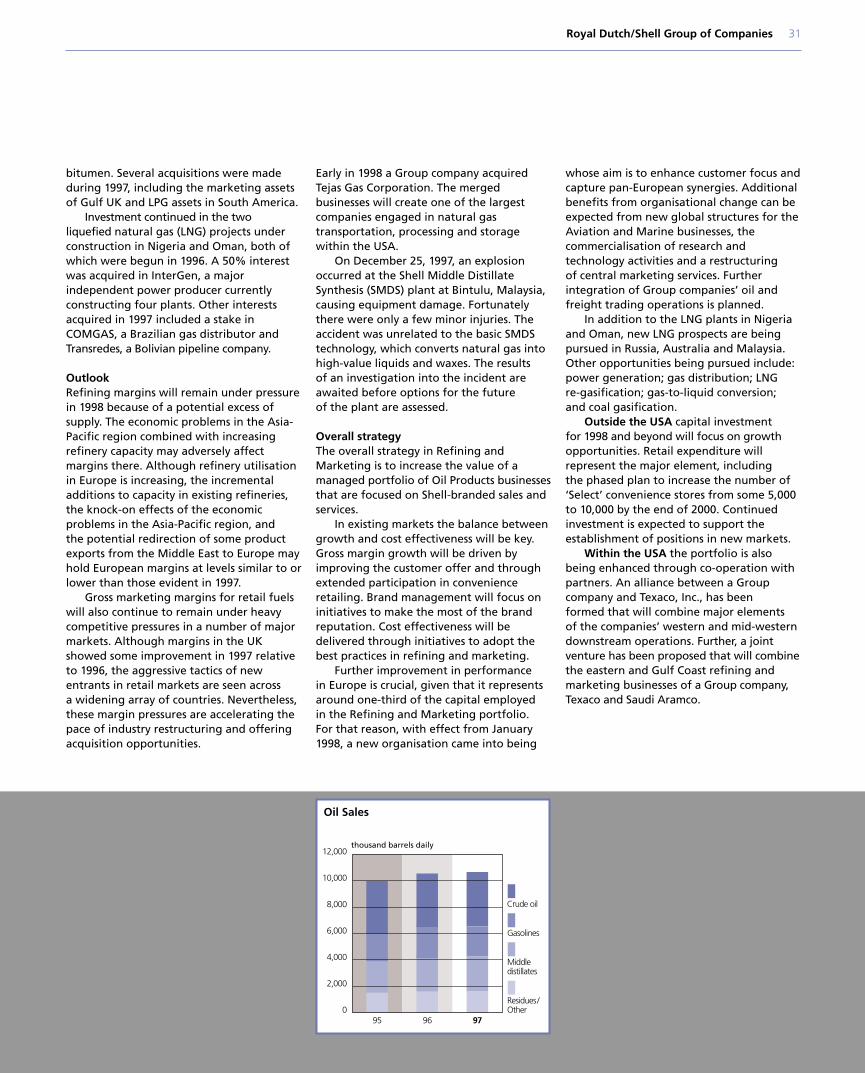
Royal Dutch/Shell Group of Companies 31
bitumen. Several acquisitions were madeduring 1997, including the marketing assetsof Gulf UK and LPG assets in South America.
Investment continued in the two liquefied natural gas (LNG) projects underconstruction in Nigeria and Oman, both ofwhich were begun in 1996. A 50% interestwas acquired in InterGen, a majorindependent power producer currentlyconstructing four plants. Other interestsacquired in 1997 included a stake inCOMGAS, a Brazilian gas distributor andTransredes, a Bolivian pipeline company.
OutlookRefining margins will remain under pressurein 1998 because of a potential excess ofsupply. The economic problems in the Asia-Pacific region combined with increasingrefinery capacity may adversely affectmargins there. Although refinery utilisationin Europe is increasing, the incrementaladditions to capacity in existing refineries,the knock-on effects of the economicproblems in the Asia-Pacific region, and the potential redirection of some productexports from the Middle East to Europe mayhold European margins at levels similar to orlower than those evident in 1997.
Gross marketing margins for retail fuelswill also continue to remain under heavycompetitive pressures in a number of majormarkets. Although margins in the UKshowed some improvement in 1997 relativeto 1996, the aggressive tactics of newentrants in retail markets are seen across a widening array of countries. Nevertheless,these margin pressures are accelerating thepace of industry restructuring and offeringacquisition opportunities.
Early in 1998 a Group company acquiredTejas Gas Corporation. The mergedbusinesses will create one of the largestcompanies engaged in natural gastransportation, processing and storagewithin the USA.
On December 25, 1997, an explosionoccurred at the Shell Middle DistillateSynthesis (SMDS) plant at Bintulu, Malaysia,causing equipment damage. Fortunatelythere were only a few minor injuries. Theaccident was unrelated to the basic SMDStechnology, which converts natural gas intohigh-value liquids and waxes. The results of an investigation into the incident areawaited before options for the future of the plant are assessed.
Overall strategyThe overall strategy in Refining andMarketing is to increase the value of amanaged portfolio of Oil Products businessesthat are focused on Shell-branded sales andservices.
In existing markets the balance betweengrowth and cost effectiveness will be key.Gross margin growth will be driven byimproving the customer offer and throughextended participation in convenienceretailing. Brand management will focus oninitiatives to make the most of the brandreputation. Cost effectiveness will bedelivered through initiatives to adopt thebest practices in refining and marketing.
Further improvement in performance in Europe is crucial, given that it representsaround one-third of the capital employed in the Refining and Marketing portfolio. For that reason, with effect from January1998, a new organisation came into being
whose aim is to enhance customer focus andcapture pan-European synergies. Additionalbenefits from organisational change can beexpected from new global structures for theAviation and Marine businesses, thecommercialisation of research andtechnology activities and a restructuring of central marketing services. Furtherintegration of Group companies’ oil andfreight trading operations is planned.
In addition to the LNG plants in Nigeriaand Oman, new LNG prospects are beingpursued in Russia, Australia and Malaysia.Other opportunities being pursued include:power generation; gas distribution; LNG re-gasification; gas-to-liquid conversion; and coal gasification.
Outside the USA capital investment for 1998 and beyond will focus on growthopportunities. Retail expenditure willrepresent the major element, including the phased plan to increase the number of‘Select’ convenience stores from some 5,000to 10,000 by the end of 2000. Continuedinvestment is expected to support theestablishment of positions in new markets.
Within the USA the portfolio is alsobeing enhanced through co-operation withpartners. An alliance between a Groupcompany and Texaco, Inc., has been formed that will combine major elements of the companies’ western and mid-westerndownstream operations. Further, a jointventure has been proposed that will combinethe eastern and Gulf Coast refining andmarketing businesses of a Group company,Texaco and Saudi Aramco.
12,000
10,000
8,000
6,000
4,000
2,000
095 96 97
Oil Sales
Gasolines
Middledistillates
Residues /Other
Crude oil
thousand barrels daily
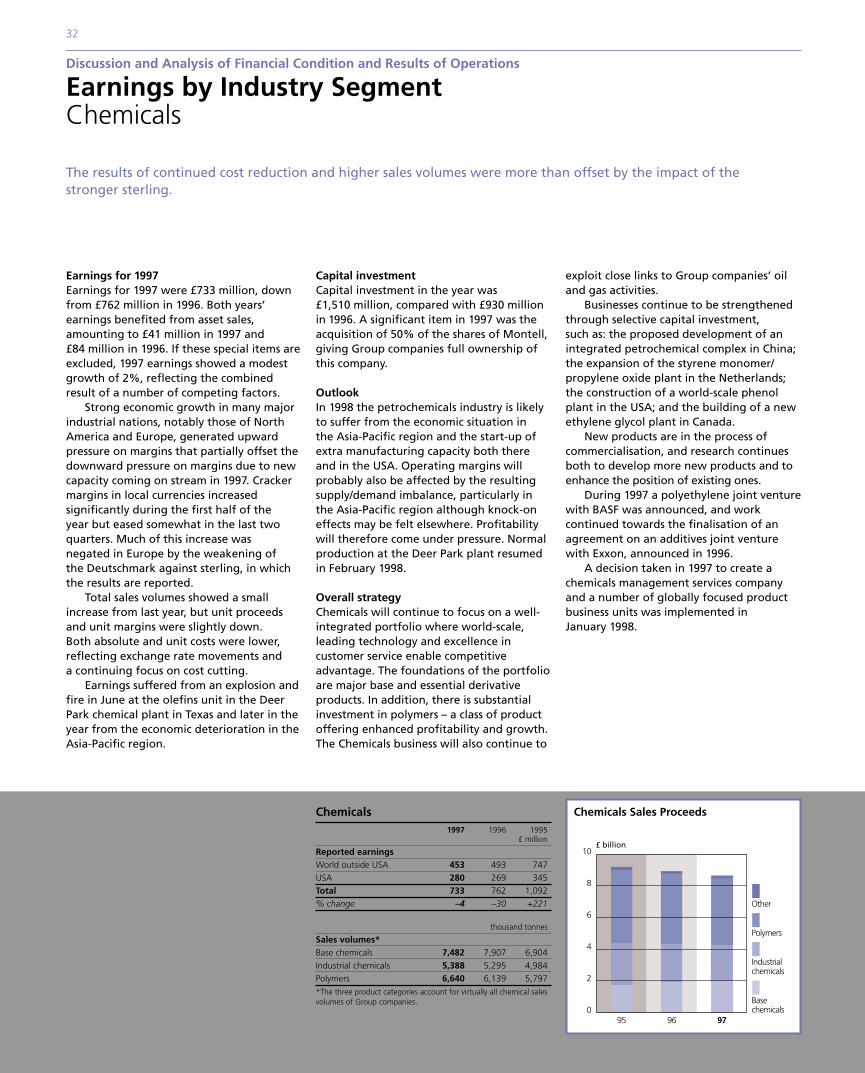
32
Discussion and Analysis of Financial Condition and Results of Operations
Earnings by Industry SegmentChemicals
The results of continued cost reduction and higher sales volumes were more than offset by the impact of the stronger sterling.
Earnings for 1997Earnings for 1997 were £733 million, downfrom £762 million in 1996. Both years’earnings benefited from asset sales,amounting to £41 million in 1997 and £84 million in 1996. If these special items areexcluded, 1997 earnings showed a modestgrowth of 2%, reflecting the combinedresult of a number of competing factors.
Strong economic growth in many majorindustrial nations, notably those of NorthAmerica and Europe, generated upwardpressure on margins that partially offset thedownward pressure on margins due to newcapacity coming on stream in 1997. Crackermargins in local currencies increasedsignificantly during the first half of the year but eased somewhat in the last twoquarters. Much of this increase was negated in Europe by the weakening of the Deutschmark against sterling, in whichthe results are reported.
Total sales volumes showed a smallincrease from last year, but unit proceedsand unit margins were slightly down. Both absolute and unit costs were lower,reflecting exchange rate movements and a continuing focus on cost cutting.
Earnings suffered from an explosion andfire in June at the olefins unit in the DeerPark chemical plant in Texas and later in theyear from the economic deterioration in theAsia-Pacific region.
Capital investmentCapital investment in the year was £1,510 million, compared with £930 millionin 1996. A significant item in 1997 was theacquisition of 50% of the shares of Montell,giving Group companies full ownership ofthis company.
OutlookIn 1998 the petrochemicals industry is likelyto suffer from the economic situation in the Asia-Pacific region and the start-up ofextra manufacturing capacity both thereand in the USA. Operating margins willprobably also be affected by the resultingsupply/demand imbalance, particularly inthe Asia-Pacific region although knock-oneffects may be felt elsewhere. Profitabilitywill therefore come under pressure. Normalproduction at the Deer Park plant resumedin February 1998.
Overall strategyChemicals will continue to focus on a well-integrated portfolio where world-scale,leading technology and excellence incustomer service enable competitiveadvantage. The foundations of the portfolioare major base and essential derivativeproducts. In addition, there is substantialinvestment in polymers – a class of productoffering enhanced profitability and growth.The Chemicals business will also continue to
exploit close links to Group companies’ oiland gas activities.
Businesses continue to be strengthenedthrough selective capital investment, such as: the proposed development of anintegrated petrochemical complex in China;the expansion of the styrene monomer/propylene oxide plant in the Netherlands;the construction of a world-scale phenolplant in the USA; and the building of a newethylene glycol plant in Canada.
New products are in the process ofcommercialisation, and research continuesboth to develop more new products and toenhance the position of existing ones.
During 1997 a polyethylene joint venturewith BASF was announced, and workcontinued towards the finalisation of anagreement on an additives joint venturewith Exxon, announced in 1996.
A decision taken in 1997 to create achemicals management services companyand a number of globally focused productbusiness units was implemented inJanuary 1998.
95 96 97
Chemicals Sales Proceeds
Polymers
Industrialchemicals
Basechemicals
Other
10
8
6
4
2
0
£ billion
Chemicals1997 1996 1995
£ million
Reported earningsWorld outside USA 453 493 747USA 280 269 345Total 733 762 1,092% change –4 –30 +221
thousand tonnes
Sales volumes*Base chemicals 7,482 7,907 6,904Industrial chemicals 5,388 5,295 4,984Polymers 6,640 6,139 5,797*The three product categories account for virtually all chemical salesvolumes of Group companies.
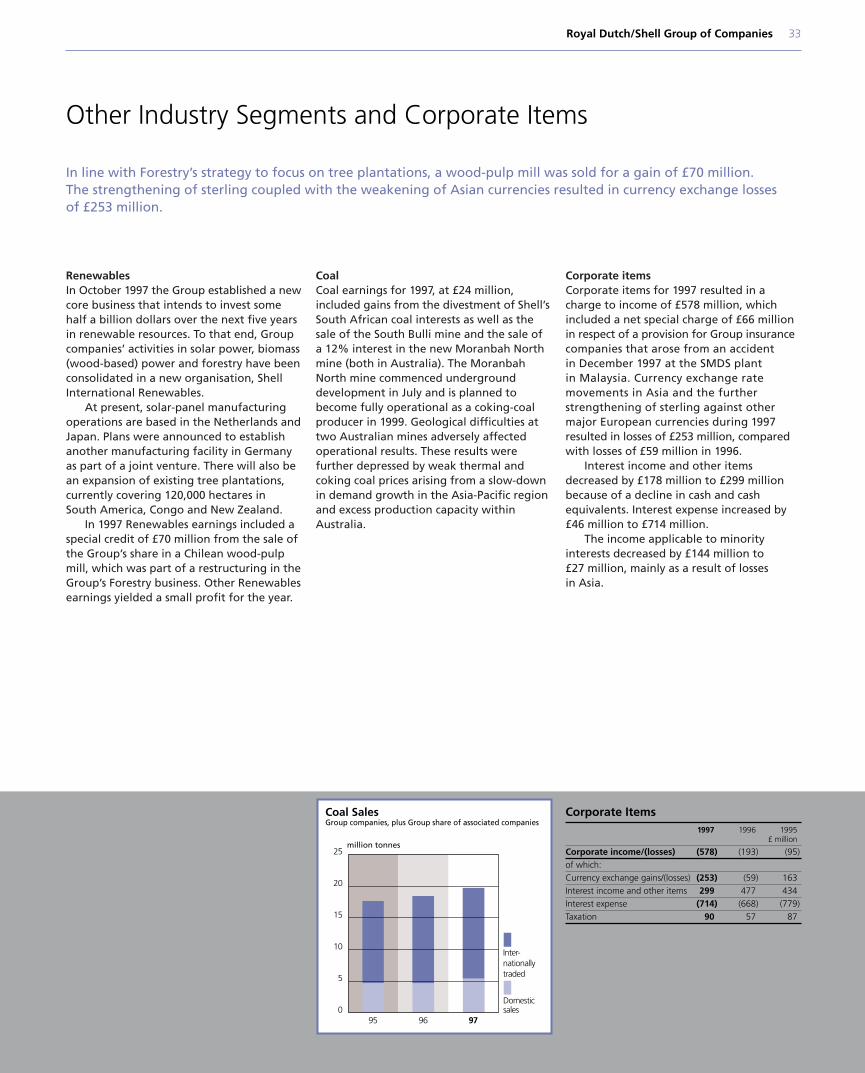
25
20
15
10
5
095 96 97
Coal SalesGroup companies, plus Group share of associated companies
Domesticsales
Inter-nationallytraded
million tonnes
Corporate Items1997 1996 1995
£ million
Corporate income/(losses) (578) (193) (95)of which:Currency exchange gains/(losses) (253) (59) 163Interest income and other items 299 477 434Interest expense (714) (668) (779)Taxation 90 57 87
Royal Dutch/Shell Group of Companies 33
Other Industry Segments and Corporate Items
In line with Forestry’s strategy to focus on tree plantations, a wood-pulp mill was sold for a gain of £70 million. The strengthening of sterling coupled with the weakening of Asian currencies resulted in currency exchange losses of £253 million.
RenewablesIn October 1997 the Group established a newcore business that intends to invest somehalf a billion dollars over the next five yearsin renewable resources. To that end, Groupcompanies’ activities in solar power, biomass(wood-based) power and forestry have beenconsolidated in a new organisation, ShellInternational Renewables.
At present, solar-panel manufacturingoperations are based in the Netherlands andJapan. Plans were announced to establishanother manufacturing facility in Germanyas part of a joint venture. There will also bean expansion of existing tree plantations,currently covering 120,000 hectares in South America, Congo and New Zealand.
In 1997 Renewables earnings included aspecial credit of £70 million from the sale ofthe Group’s share in a Chilean wood-pulpmill, which was part of a restructuring in theGroup’s Forestry business. Other Renewablesearnings yielded a small profit for the year.
CoalCoal earnings for 1997, at £24 million,included gains from the divestment of Shell’sSouth African coal interests as well as thesale of the South Bulli mine and the sale ofa 12% interest in the new Moranbah Northmine (both in Australia). The MoranbahNorth mine commenced undergrounddevelopment in July and is planned tobecome fully operational as a coking-coalproducer in 1999. Geological difficulties attwo Australian mines adversely affectedoperational results. These results werefurther depressed by weak thermal andcoking coal prices arising from a slow-downin demand growth in the Asia-Pacific regionand excess production capacity withinAustralia.
Corporate itemsCorporate items for 1997 resulted in acharge to income of £578 million, which included a net special charge of £66 millionin respect of a provision for Group insurancecompanies that arose from an accident in December 1997 at the SMDS plant in Malaysia. Currency exchange ratemovements in Asia and the furtherstrengthening of sterling against othermajor European currencies during 1997resulted in losses of £253 million, comparedwith losses of £59 million in 1996.
Interest income and other itemsdecreased by £178 million to £299 millionbecause of a decline in cash and cashequivalents. Interest expense increased by£46 million to £714 million.
The income applicable to minorityinterests decreased by £144 million to £27 million, mainly as a result of losses in Asia.
34
Discussion and Analysis of Financial Condition and Results of Operations
Liquidity and Capital Resources
Cash, cash equivalents and short-term securities were down from £7.3 billion to £3.1 billion mainly because of highercapital investment and long-term investments. Total debt amounted to £6.4 billion, and the debt ratio decreased from 15.1% in 1996 to 14.5% in 1997. Capital investment for the year totalled £9.2 billion, up 12% from 1996.
Statement of cash flowsCash flow generated by operationsdecreased from £10.7 billion to £10.2 billion,of which £8.3 billion was reinvested in thebusinesses. After payment of dividends of£3.1 billion to the Parent Companies, RoyalDutch and Shell Transport, there was adeficit before financing of £1,179 million.(For comparison, in 1996 there was a surplusof £1,037 million, and in 1995 a deficit of£23 million.)
Within cash flow generated byoperations, working capital decreased by£1,698 million compared with an increase of £681 million in 1996.
Capital expenditure and newinvestments in associates increased by £995 million. Proceeds from sales of assetsand disposals of investments in associatescontributed £952 million to cash flow. (In 1996 such proceeds amounted to £989 million.) There was a net repayment of debt amounting to £62 million. Dividendspaid to the Parent Companies decreased by2%, to £3.1 billion (after increases of 11% in1996 and 16% in 1995).
The net effect of this flow of funds forthe year as a whole was a decrease of £1,933 million in cash and cash equivalents.
Financial conditionLiquidity, whilst remaining robust, wasreduced. Cash, cash equivalents andshort-term securities were £3.1 billion at the end of 1997, down £4.2 billion on1996, mainly attributed to higher capitalinvestment and long-term investments andthe use of cash to establish a pension trustfor a previously unfunded OperatingCompany plan. Long-term and short-termdebt, at £6.4 billion, was £569 million lowerthan a year ago. The total debt ratiodecreased from 15.1% to 14.5% in 1997.
Net assets decreased by £725 million, to £36.5 billion during the year. As in 1996, a significant portion of the decrease was a reflection of movements in year-endexchange rates. In 1997, sterling strengthenedagainst the other major European and Asiancurrencies whilst weakening slightly againstthe US dollar. Excluding these currencyeffects, net assets would have increased by£1,161 million in 1997.
Capital investmentGroup companies’ capital expenditure andexploration expense, plus new investmentsin associated companies, rose by almost £1.0 billion to £9.2 billion, which is 6%above last year’s forecast of £8.7 billion forthe year 1997. Oil and gas exploration andproduction expenditure was the largestcomponent at £4.4 billion, up £490 millionon the 1996 figure. Refining and Marketing,at £3.1 billion, was slightly lower than in1996. Chemicals investment increased by62%, from £930 million to £1,510 millionmainly because of the Montell acquisition.
In 1998 capital investment is expected tobe somewhat higher than 1997 levels, withmore than half attributable to Explorationand Production. The Group companies’investment programme is expected to be financed largely from internallygenerated funds.
Statement of Cash Flows (see Note 17)(translated at average rates of exchange)
1997 1996 1995£ million
Cash flow provided byoperating activities 10,229 10,653 9,424% change –4 +13 +23of which: (increase)/decreasein net working capital 1,698 (681) (92)
Cash flow used ininvesting activities 8,283 6,412 6,557% change +29 –2 +40of which: capital expenditure 7,474 7,039 6,951
Cash flow provided by/(used in) financing activities (423) (368) (313)
Dividends paid toParent Companies 3,125 3,204 2,890% change –2 +11 +16
Increase/(Decrease) in cashand cash equivalents (1,933) 180 (261)
Financial Condition(translated at year-end rates of exchange)
1997 1996 1995£ million
Net assets 36,452 37,177 37,970
Net current assets 2,237 5,927 4,773of which: cash, cash equivalents and short-term securities 3,123 7,282 7,335
Total debt* 6,402 6,971 8,256of which: short-term* 2,894 3,357 3,509
long-term* 3,508 3,614 4,747
*Including capitalised lease obligations.
Capital Investment(by industry segment)
1997 1996 1995£ million
Capital expenditure 7,474 7,039 6,951Exploration expense† 708 716 552New investments in associated companies‡ 1,052 492 350Total 9,234 8,247 7,853of which:Oil and gas:
Exploration and Production 4,444 3,953 3,397Refining and Marketing 3,105 3,178 3,357
Chemicals 1,510 930 836Coal 86 104 102Other 89 82 161
†Exploration expense excludes depreciation and release of currencytranslation differences.
‡Note 5(b) on pages 44–45 sets out 1996–1997 changes ininvestments in associated companies.
Royal Dutch/Shell Group of Companies 35
Other Matters
Internal controlsThe Royal Dutch/Shell Group of Companieshas a number of control mechanisms thatare considered to provide a reasonablebalance between a comprehensive internalcontrol structure and the need for a strongentrepreneurial decentralised culture.The primary control mechanisms are self-appraisal processes in combination withstrict accountability for results underpinnedby a number of checks and balances includingmandatory policies, procedures (within theframework of the Royal Dutch/Shell Group ofCompanies’ Statement of General BusinessPrinciples), and appraisals and reviews.
Business control reviews of Groupcompanies are regularly carried out todemonstrate to the Group HoldingCompanies and the Group Audit Committee(comprising three members of theSupervisory Board of Royal Dutch and threenon-executive Directors of Shell Transport)that controls of the key business processesare in place and operate effectively. There is an annual review and appraisal process as part of the planning cycle and a formalLetter of Representation process in respectof over 1,500 companies. The Letter ofRepresentation, which was introduced in1978, is a declaration by the management of these companies regarding the operationof sound financial controls, the properrecording of transactions and any instancesof bribes or illegal payments. The results ofthis process and any qualifications made arereviewed by the Group Audit Committeeand support representations made toexternal auditors.
Environmental and decommissioning costsGroup companies operate in over 130countries throughout the world and aresubject to a number of differentenvironmental laws, regulations andreporting requirements. It is the responsibilityof each Group company to implement ahealth, safety and environmentalmanagement system that is suited to itsparticular circumstances.
The costs of prevention, control,abatement or elimination of releases intothe air and water and disposal and handlingof wastes at operating facilities areconsidered to be an ordinary part of business,and as such these amounts are notaccounted for separately. An estimate of theorder of magnitude of amounts incurred in1997 for Group companies mostly in Europeand North America, based on allocationsand managerial judgement, is £700 million. (In 1996 such an estimate amounted to £800 million.) These estimates include thecosts of reformulated fuels in the USA.
Expenditures of a capital nature to limitor monitor hazardous substances or releasesinclude both remedial measures on existingplants and integral features of new plants.Whilst some environmental expendituresare discrete and readily identifiable, othersmust be reasonably estimated or allocatedbased on technical and financial judgementswhich develop over time. Consistent withthe preceding, estimated environmentalcapital expenditures made by companieswith major capital programmes during 1997were £400 million (1996: £500 million).Those Group companies are expected to
incur environmental capital costs of at least£400–500 million per year during both 1998and 1999. These estimates include costsrelated to reformulated fuels in the USA.
It is not possible to predict with certaintythe magnitude of the effect of requiredinvestments in existing facilities on Groupcompanies’ future earnings, since this willdepend amongst other things on the abilityto recover the higher costs from consumersand through fiscal incentives offered bygovernments. Nevertheless, it is anticipatedthat over time there will be no materialimpact on the total of Group companies’earnings. These risks are comparable tothose faced by other companies in similarbusinesses.
At the end of 1997, the total liabilitiesbeing carried for environmental clean-upwere £412 million (1996: £467 million),whilst additions to provisions in 1997amounted to £53 million.
Provisions being carried for expenditureson decommissioning and site restoration,including oil and gas platforms, amountedto £1,403 million (1996: £1,408 million).
36
Discussion and Analysis of Financial Condition and Results of OperationsOther Matters
Dollar reportingWith effect from the first quarter of 1998,the financial statements of the RoyalDutch/Shell Group of Companies will bereported in US dollars instead of sterling.
EmployeesOverall, the number of employees in Groupcompanies is expected to decline over thenext year or two as the companies continuetheir efforts to streamline operations and asbusinesses are transferred to associated jointventures. The decline, however, will not beuniform throughout the companies: incertain activities and areas personnelnumbers may well increase. Groupcompanies will still need to recruit manypeople every year around the world.
Risk managementAs further discussed in Note 25 on pages56–57, Group companies, in the normalcourse of their business, use financialinstruments of various kinds for thepurposes of managing exposure to currency, commodity price and interest rate movements. The Group has TreasuryGuidelines applicable to all Groupcompanies, and each Group company isrequired to adopt a treasury policy consistentwith these guidelines. These policies coverfinancing structure, foreign exchange andinterest rate risk management, insurance,counterparty risk management and derivativeinstruments, as well as the treasury controlsframework. Wherever possible the Groupseeks to centralise treasury operations inspecialist central organisations withoutremoving from each Group company the
responsibility to formulate and implementappropriate treasury policies.
Each Group company measures itsforeign currency exposures against theunderlying currency of its business (its‘functional currency’), reports foreignexchange gains and losses against itsfunctional currency and has hedging andtreasury policies in place which are designedto minimise foreign exchange exposure sodefined. The functional currency for mostupstream companies and for othercompanies with significant internationalbusiness is the US dollar, but othercompanies normally have their localcurrency as their functional currency.
The financing of most Group OperatingCompanies is structured on a floating-ratebasis and, except in special cases, furtherinterest-rate risk management isdiscouraged.
Apart from forward foreign exchangecontracts to meet known commitments, theuse of derivative financial instruments bymost Group companies is not permitted bytheir treasury policies.
Some Group companies operate astraders in crude oil and products and usecommodity swaps and options as a means of managing price and timing risks arisingfrom this trading. In effecting thesetransactions the companies concernedoperate within procedures and policiesdesigned to ensure that risks, includingthose relating to the default of counter-parties, are minimised.
Except in exceptional cases, the use of derivative instruments is generally confinedto specialist oil trading and central treasury
organisations which have appropriate skills,experience, supervision, and control andreporting systems.
The Group’s Operating Companies insure against most major property andliability risks with the Group’s captiveinsurance companies. These captiveinsurance companies reinsure part of their major catastrophe risks with a variety of international insurers. The effect of these arrangements is thatuninsured losses for any one incident areunlikely to exceed $400 million.
Year 2000Group companies are currently addressingYear 2000 problems, whether caused by ITsystems, industrial automation (embeddedchips), hardware, communications or thebusiness chain. The Group’s aim is to ensurethat corrective measures are taken toprevent interruptions to business operationsand to have contingency plans in placewhere necessary. Each Group company is addressing the issue with a managedprogramme aimed at containing theproblem before the critical date. Total costsfor the Group are as yet unknown, but theyare not anticipated to be material to theGroup’s financial position.
Cautionary StatementThe forward-looking discussion and analysisin this Report contains statements that aresubject to risk factors associated with theoil, gas, chemicals, renewable resources and coal businesses. It is believed that theexpectations reflected in these statementsare reasonable, but they may be affected by a variety of variables which could causeactual results or trends to differ materially,including, but not limited to: pricefluctuations; currency fluctuations; drillingand production results; reserve estimates;loss of market; environmental risks; physicalrisks; and legislative, fiscal and regulatorydevelopments.
Royal Dutch/Shell Group of Companies 37
To Royal Dutch Petroleum Company and The 3 Transport and Trading Company, p.l.c.
We have audited the financial statements appearing on pages 38 to 57 of the Royal Dutch/Shell Group of Companies for the years1997, 1996 and 1995. The preparation of financial statements is theresponsibility of management. Our responsibility is to express anopinion on financial statements based on our audits.
We conducted our audits in accordance with generally acceptedauditing standards. Those standards require that we plan andperform the audit to obtain reasonable assurance about whetherthe financial statements are free of material misstatement. An auditincludes examining, on a test basis, evidence supporting theamounts and disclosures in the financial statements. An audit alsoincludes assessing the accounting principles used and significantestimates made by management in the preparation of financialstatements, as well as evaluating the overall financial statementpresentation. We believe that our audits provide a reasonable basisfor our opinion.
In our opinion, the financial statements referred to abovepresent fairly, in all material respects, the financial position of theRoyal Dutch/Shell Group of Companies at December 31, 1997 and1996 and the results of its operations and its cash flows for each of the three years in the period ended December 31, 1997 inaccordance with generally accepted accounting principles in theNetherlands and the United States.
KPMG Accountants N.V., The Hague
Price Waterhouse, London
March 12, 1998
Report of the Auditors
38 Financial Statements41 Notes to Financial Statements41 1 The Royal Dutch/Shell Group of Companies
2 Accounting policies43 3 Division of Group net income between the
Parent Companies44 4 Parent Companies’ interest in Group net assets
5 Associated companies45 6 Interest and other income
7 Interest expense8 Taxation
46 9 Tangible fixed assets by industry segment47 10 Inventories
11 Accounts receivable12 Investments – securities and short-term securities
48 13 Debt49 14 Commitments
15 Accounts payable and accrued liabilities16 Long-term liabilities – Other17 Statement of Cash Flows
50 18 Employee emoluments and numbers19 Employee retirement plans
51 20 Postretirement benefits other than pensions52 21 Information by geographical area and by
industry segment54 22 Oil and gas exploration and producing activities55 23 Stock options and Parent Companies’ shares
held by Group companies24 Contingencies and litigation
56 25 Financial instruments58 Supplementary Information – Oil and Gas
58 Reserves60 Standardised measure of discounted future
cash flows61 Summarised Financial Data63 Operational Comparisons 1993–1997
Group Financial Statementsand Operational Data
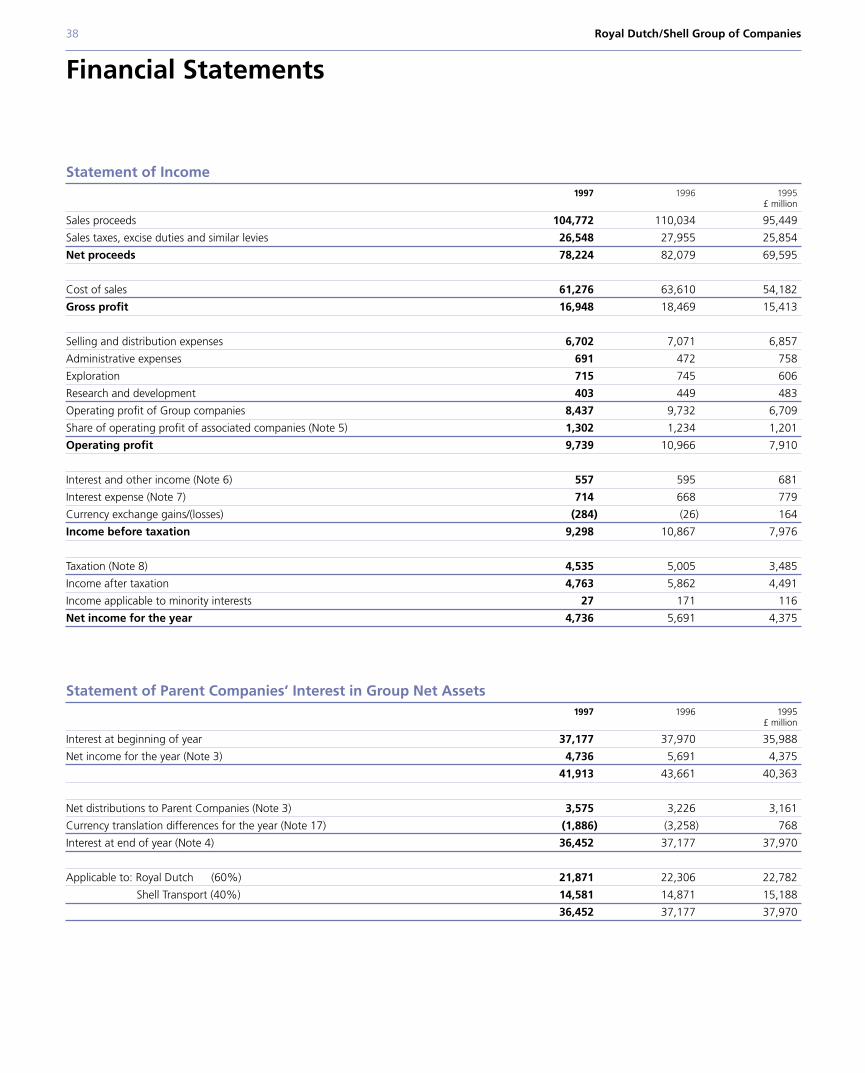
38 Royal Dutch/Shell Group of Companies
Financial Statements
Statement of Income1997 1996 1995
£ million
Sales proceeds 104,772 110,034 95,449
Sales taxes, excise duties and similar levies 26,548 27,955 25,854
Net proceeds 78,224 82,079 69,595
Cost of sales 61,276 63,610 54,182
Gross profit 16,948 18,469 15,413
Selling and distribution expenses 6,702 7,071 6,857
Administrative expenses 691 472 758
Exploration 715 745 606
Research and development 403 449 483
Operating profit of Group companies 8,437 9,732 6,709
Share of operating profit of associated companies (Note 5) 1,302 1,234 1,201
Operating profit 9,739 10,966 7,910
Interest and other income (Note 6) 557 595 681
Interest expense (Note 7) 714 668 779
Currency exchange gains/(losses) (284) (26) 164
Income before taxation 9,298 10,867 7,976
Taxation (Note 8) 4,535 5,005 3,485
Income after taxation 4,763 5,862 4,491
Income applicable to minority interests 27 171 116
Net income for the year 4,736 5,691 4,375
Statement of Parent Companies’ Interest in Group Net Assets1997 1996 1995
£ million
Interest at beginning of year 37,177 37,970 35,988
Net income for the year (Note 3) 4,736 5,691 4,375
41,913 43,661 40,363
Net distributions to Parent Companies (Note 3) 3,575 3,226 3,161
Currency translation differences for the year (Note 17) (1,886) (3,258) 768
Interest at end of year (Note 4) 36,452 37,177 37,970
Applicable to: Royal Dutch (60%) 21,871 22,306 22,782
Shell Transport (40%) 14,581 14,871 15,188
36,452 37,177 37,970
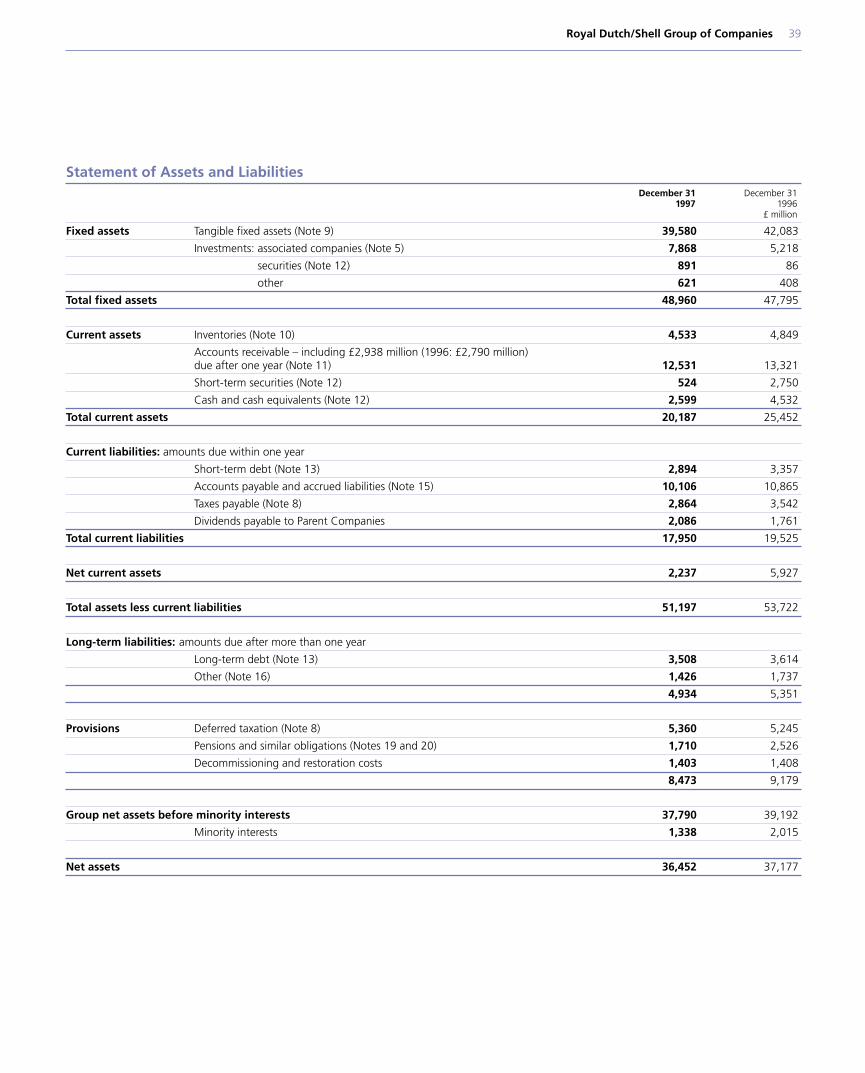
Royal Dutch/Shell Group of Companies 39
Statement of Assets and LiabilitiesDecember 31 December 31
1997 1996£ million
Fixed assets Tangible fixed assets (Note 9) 39,580 42,083
Investments: associated companies (Note 5) 7,868 5,218
securities (Note 12) 891 86
other 621 408
Total fixed assets 48,960 47,795
Current assets Inventories (Note 10) 4,533 4,849
Accounts receivable – including £2,938 million (1996: £2,790 million) due after one year (Note 11) 12,531 13,321
Short-term securities (Note 12) 524 2,750
Cash and cash equivalents (Note 12) 2,599 4,532
Total current assets 20,187 25,452
Current liabilities: amounts due within one year
Short-term debt (Note 13) 2,894 3,357
Accounts payable and accrued liabilities (Note 15) 10,106 10,865
Taxes payable (Note 8) 2,864 3,542
Dividends payable to Parent Companies 2,086 1,761
Total current liabilities 17,950 19,525
Net current assets 2,237 5,927
Total assets less current liabilities 51,197 53,722
Long-term liabilities: amounts due after more than one year
Long-term debt (Note 13) 3,508 3,614
Other (Note 16) 1,426 1,737
4,934 5,351
Provisions Deferred taxation (Note 8) 5,360 5,245
Pensions and similar obligations (Notes 19 and 20) 1,710 2,526
Decommissioning and restoration costs 1,403 1,408
8,473 9,179
Group net assets before minority interests 37,790 39,192
Minority interests 1,338 2,015
Net assets 36,452 37,177
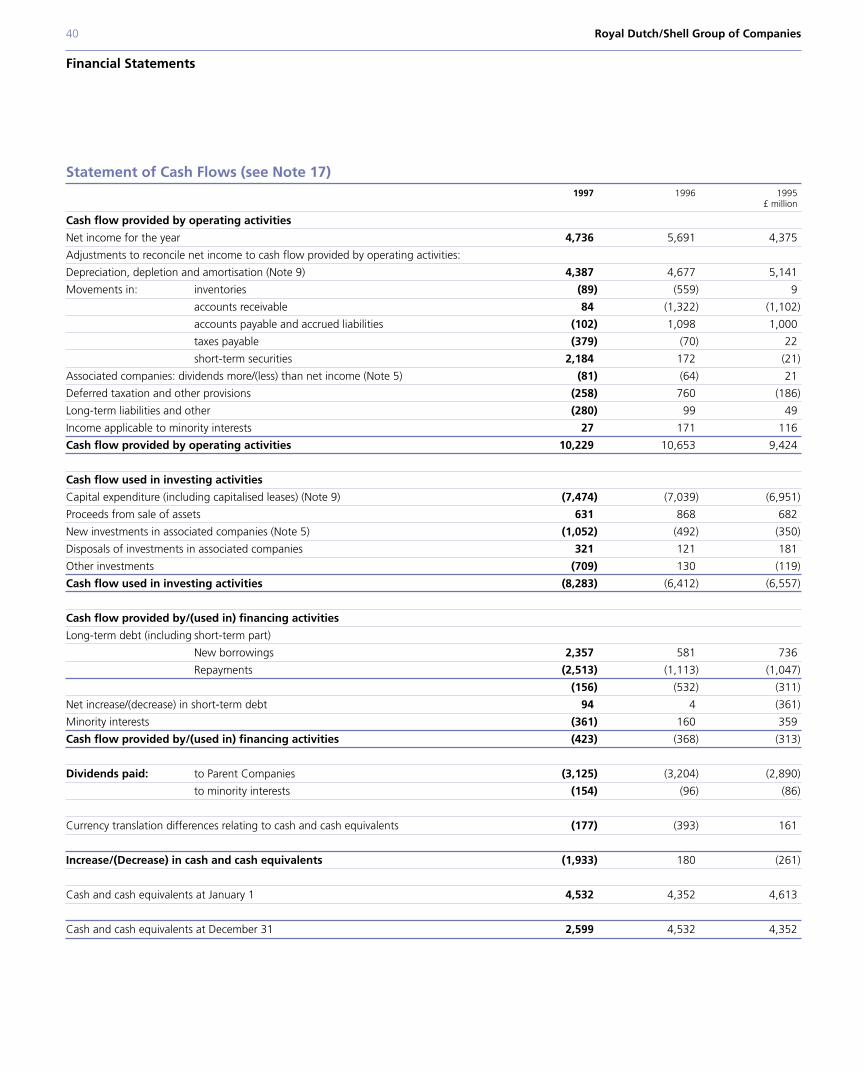
40 Royal Dutch/Shell Group of Companies
Financial Statements
Statement of Cash Flows (see Note 17)1997 1996 1995
£ million
Cash flow provided by operating activities
Net income for the year 4,736 5,691 4,375
Adjustments to reconcile net income to cash flow provided by operating activities:
Depreciation, depletion and amortisation (Note 9) 4,387 4,677 5,141
Movements in: inventories (89) (559) 9
accounts receivable 84 (1,322) (1,102)
accounts payable and accrued liabilities (102) 1,098 1,000
taxes payable (379) (70) 22
short-term securities 2,184 172 (21)
Associated companies: dividends more/(less) than net income (Note 5) (81) (64) 21
Deferred taxation and other provisions (258) 760 (186)
Long-term liabilities and other (280) 99 49
Income applicable to minority interests 27 171 116
Cash flow provided by operating activities 10,229 10,653 9,424
Cash flow used in investing activities
Capital expenditure (including capitalised leases) (Note 9) (7,474) (7,039) (6,951)
Proceeds from sale of assets 631 868 682
New investments in associated companies (Note 5) (1,052) (492) (350)
Disposals of investments in associated companies 321 121 181
Other investments (709) 130 (119)
Cash flow used in investing activities (8,283) (6,412) (6,557)
Cash flow provided by/(used in) financing activities
Long-term debt (including short-term part)
New borrowings 2,357 581 736
Repayments (2,513) (1,113) (1,047)
(156) (532) (311)
Net increase/(decrease) in short-term debt 94 4 (361)
Minority interests (361) 160 359
Cash flow provided by/(used in) financing activities (423) (368) (313)
Dividends paid: to Parent Companies (3,125) (3,204) (2,890)
to minority interests (154) (96) (86)
Currency translation differences relating to cash and cash equivalents (177) (393) 161
Increase/(Decrease) in cash and cash equivalents (1,933) 180 (261)
Cash and cash equivalents at January 1 4,532 4,352 4,613
Cash and cash equivalents at December 31 2,599 4,532 4,352
Royal Dutch/Shell Group of Companies 41
Notes to Financial Statements
1 The Royal Dutch/Shell Group of CompaniesThe Parent Companies, Royal Dutch Petroleum Company (RoyalDutch) and The 2 Transport and Trading Company, p.l.c. (ShellTransport) are holding companies which together own, directly orindirectly, investments in numerous companies known collectively asthe Royal Dutch/Shell Group. Group companies are engaged in allprincipal aspects of the oil and natural gas business throughout theworld. They also have substantial chemical and coal interests. Theseactivities are conducted in more than 130 countries and are subjectto changing economic, regulatory and political conditions.
Arrangements between Royal Dutch and Shell Transportprovide, inter alia, that notwithstanding variations in shareholdings,Royal Dutch and Shell Transport shall share in the aggregate netassets and in the aggregate dividends and interest received fromGroup companies in the proportion of 60:40. It is further arrangedthat the burden of all taxes in the nature of or corresponding to anincome tax leviable in respect of such dividends and interest shallfall in the same proportion.
The 60:40 arrangements referred to above have beensupplemented by further arrangements, beginning with Groupdividends payable to the Parent Companies in respect of 1977,whereby each Parent Company is to bring into account towards itsshare in the 60:40 division of dividends from Group companies taxcredits and other tax benefits which are related to the liability totax of a Group company and which arise to the Parent Company orwhich would arise to the holders of its ordinary shares if there wereto be an immediate full onward distribution to them of Groupdividends (for which purpose all shareholders are assumed to beindividuals resident and subject to tax in the country of residence ofthe Parent Company in question). The tax benefit to Shell Transportfor the 1994 dividend through to the 1997 interim dividendamounts to 8% of total Group income divisible for 60:40 purposes.
In 1997 the UK government announced changes to tax law inrespect of company distributions, including the abolition ofAdvance Corporation Tax. The Parent Companies have agreed thatthe tax benefit to Shell Transport for the 1997 final dividend andthe 1998 interim dividend will be 4% of total Group incomedivisible for 60:40 purposes and, subject to the abolition of AdvanceCorporation Tax being enacted, there will be no tax benefit to Shell Transport for the 1998 final and subsequent dividends whichwill have the effect of Shell Transport receiving the whole of itsentitlement in cash.
2 Accounting policiesNature of the financial statementsThe accounts of the Parent Companies are not included in thefinancial statements, the objective of which is to demonstrate thefinancial position, results of operations and cash flows of a group of undertakings in which each Parent Company has an interest incommon whilst maintaining its separate identity. The financialstatements reflect an aggregation in sterling of the accounts ofcompanies in which Royal Dutch and Shell Transport together,either directly or indirectly, have control either through a majorityof the voting rights or the right to exercise a controlling influence.Investments in companies over which Group companies havesignificant influence but not control are classified as associatedcompanies and are accounted for on the equity basis. Certain joint
ventures are taken up in the financial statements in proportion tothe relevant Group interest.
The financial statements have been prepared under the historicalcost convention. They have been prepared in all material respects inaccordance with generally accepted accounting principles in theNetherlands and the United States. Group accounting policies arealso substantially consistent with accounting principles generallyaccepted in the United Kingdom, with the notable exception of theprovision for deferred taxation.
The preparation of financial statements in conformity withgenerally accepted accounting principles requires management tomake estimates and assumptions that affect the amounts reportedin the financial statements and notes thereto. Actual results coulddiffer from those estimates.
Currency translationAssets and liabilities of non-sterling Group companies are translatedto sterling at year-end rates of exchange, whilst their statements ofincome and cash flows are translated at quarterly average rates.Translation differences arising on aggregation are taken directly to a currency translation differences account, which forms part ofParent Companies’ interest in Group net assets. Upon disinvestmentor liquidation of a non-sterling Group company, cumulative currencytranslation differences related to that company are taken to income.
The sterling equivalents of exchange gains and losses arising asa result of foreign currency transactions (including those in respectof inter-company balances unless related to transactions of a long-term investment nature) are included in Group net income.
SecuritiesSecurities of a trading nature are carried at fair value withunrealised holding gains and losses being included in net income.Securities intended to be held to maturity are carried at cost, unless permanently impaired in which case they are carried at fairvalue. All other securities are classified as available for sale and are carried at fair value, with unrealised holding gains and lossesbeing taken directly to Parent Companies’ interest in Group netassets. Upon sale or maturity, the net gains and losses are includedin net income.
Short-term securities with a maturity from acquisition of threemonths or less that are readily convertible into known amounts ofcash are classified as cash equivalents. Securities forming part of aportfolio which is required to be held long-term are classified underfixed assets – investments.
Cash flows resulting from movements in securities of a tradingnature are reported under cash flow provided by operatingactivities while cash flows resulting from movements in othersecurities are reported under cash flow used in investing activities.
Financial instruments The accounting method used for derivative financial instruments isdetermined by whether or not the instrument is designated as ahedge of an existing exposure or a firm commitment and, if so, bythe accounting method used for the item being hedged. Hedges ofexisting exposures are accounted for in the same way as the itembeing hedged. Forward exchange contracts and currency swapsused to hedge exchange rate exposure are valued at market with
42 Royal Dutch/Shell Group of Companies
Notes to Financial Statements
resulting gains and losses taken to income when the gains and losseson the underlying hedged transactions are recognised. Gains orlosses on hedges of firm commitments are deferred and recognisedwhen any gains or losses on the hedged transactions are recognised.Derivative financial instruments that are not designated as hedgesare valued at market and gains and losses are taken to income.
The effect of derivative financial instruments is reflected in thefinancial statements as follows:
Statement of Income: premiums or discounts on derivativeinstruments that are designated as hedges are reflected asadjustments to interest income or expense. Interest differentials oninterest rate derivatives used to hedge debt or debt securities areincluded within interest expense and interest income respectively.Gains or losses on foreign currency contracts used to hedge assets or liabilities are included within currency exchange gains/losses. Gains or losses on commodity derivative contracts, other than those designated as hedges of firm commitments, are includedwithin cost of sales.
Statement of Assets and Liabilities: the carrying amounts offoreign exchange derivatives that hedge debt or debt securities are included within investments – securities, short-term securities,cash and cash equivalents, short-term debt or long-term debt asapplicable. The carrying amounts of other derivatives are includedwithin current assets or liabilities.
Statement of Cash Flows: the effect of interest rate derivativeson interest payments and the effect of commodity derivativecontracts are included within cash flow provided by operatingactivities. The effect of foreign exchange derivatives is includedwithin the movement in the item being hedged.
Oil tradingOil trading contracts such as futures and forward contracts and swapsare entered into by some Group companies, generally in order tohedge exposure to price fluctuations which arise on purchases andsales of crude oil and oil products. Contracts designated as hedgesare valued at market and resulting gains and losses are taken toincome when the gains and losses on the underlying hedgedtransactions are recognised. The gains and losses on contracts thatare not designated as hedges are taken to income in the period inwhich they arise.
InventoriesInventories are stated at cost to the Group or net realisable value,whichever is lower. Such cost is determined for the most part by thefirst-in first-out method (FIFO), but relatively important amountsare determined on the basis of the last-in first-out method (LIFO).Cost comprises direct purchase costs, cost of production,transportation and manufacturing expenses and taxes.
Exploration costsGroup companies follow the successful efforts method of accountingfor oil and gas exploration costs. Exploration costs are charged toincome when incurred, with the exception that exploratory drillingcosts are initially included in tangible fixed assets pendingdetermination of commercial reserves; should the efforts bedetermined unsuccessful, they are then charged to income.
Interest capitalisationInterest is capitalised, as an increase in tangible fixed assets, onsignificant capital projects during construction. Interest is alsocapitalised, as an increase in investments in associated companies,on funds invested by Group companies which are used by associatedcompanies for significant capital projects during construction.
Depreciation, depletion and amortisationTangible fixed assets related to producing activities are depreciatedon a unit-of-production basis over the proved developed reserves of the field concerned, except in the case of assets whose useful life is shorter than the lifetime of the field, in which case thestraight-line method is applied. Rights and concessions are depleted on the unit-of-production basis over the total provedreserves of the relevant area. Unproved properties are amortised as required by particular circumstances. Other tangible fixed assetsare generally depreciated on a straight-line basis over theirestimated useful lives.
The carrying amounts of fixed assets are reviewed for possibleimpairment whenever events or changes in circumstances indicate.For this purpose, assets are grouped based on separately identifiableand largely independent cash flows. Where impairment is indicated,the carrying amounts of assets are written down to fair value,usually determined as the amount of estimated discounted futurecash flows. Assets held for sale are written down to the amount of estimated net realisable value.
Environmental expendituresLiabilities for environmental remediation resulting from pastoperations or events are recognised in the period in which anobligation to a third party arises and the amount can be reasonablyestimated. Measurement of liabilities is based on current legalrequirements and existing technology. Recognition of any joint andseveral liability is based upon Group companies’ best estimate oftheir final pro-rata share of the liability. Liabilities are determinedindependently of expected insurance recoveries. Recoveries arerecognised and reported as separate events and brought intoaccount when reasonably certain of realisation. The carryingamount of liabilities is regularly reviewed and adjusted for newfacts or changes in law or technology.
Decommissioning and restoration costsEstimated decommissioning and restoration costs are based oncurrent requirements, technology and price levels. In respect of oiland gas producing activities, the estimated cost is provided over the life of the proved developed reserves on a unit-of-productionbasis. For other activities, the estimated cost is provided over the remaining life of a facility on a straight-line basis once anobligation crystallises and the amount can be reasonably estimated.Changes in estimates of costs are accrued on a prospective basis.
Deferred taxationDeferred taxation is provided using the comprehensive liabilitymethod of accounting for income taxes based on provisions ofenacted laws. Recognition is given to deferred tax assets andliabilities for the expected future tax consequences of events thathave been recognised in the financial statements or in the tax
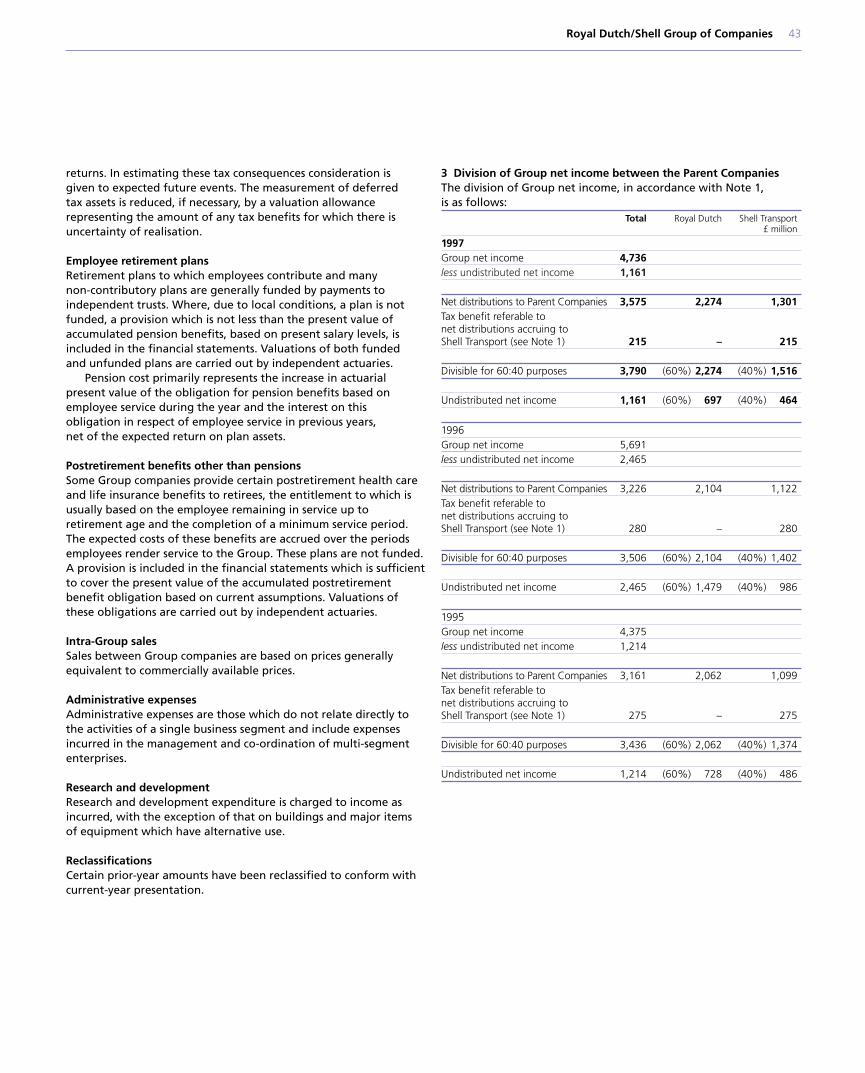
Royal Dutch/Shell Group of Companies 43
returns. In estimating these tax consequences consideration is given to expected future events. The measurement of deferred tax assets is reduced, if necessary, by a valuation allowancerepresenting the amount of any tax benefits for which there isuncertainty of realisation.
Employee retirement plansRetirement plans to which employees contribute and many non-contributory plans are generally funded by payments toindependent trusts. Where, due to local conditions, a plan is notfunded, a provision which is not less than the present value ofaccumulated pension benefits, based on present salary levels, isincluded in the financial statements. Valuations of both funded and unfunded plans are carried out by independent actuaries.
Pension cost primarily represents the increase in actuarialpresent value of the obligation for pension benefits based onemployee service during the year and the interest on this obligation in respect of employee service in previous years, net of the expected return on plan assets.
Postretirement benefits other than pensionsSome Group companies provide certain postretirement health careand life insurance benefits to retirees, the entitlement to which isusually based on the employee remaining in service up toretirement age and the completion of a minimum service period.The expected costs of these benefits are accrued over the periodsemployees render service to the Group. These plans are not funded.A provision is included in the financial statements which is sufficientto cover the present value of the accumulated postretirementbenefit obligation based on current assumptions. Valuations ofthese obligations are carried out by independent actuaries.
Intra-Group salesSales between Group companies are based on prices generallyequivalent to commercially available prices.
Administrative expensesAdministrative expenses are those which do not relate directly tothe activities of a single business segment and include expensesincurred in the management and co-ordination of multi-segmententerprises.
Research and developmentResearch and development expenditure is charged to income asincurred, with the exception of that on buildings and major itemsof equipment which have alternative use.
ReclassificationsCertain prior-year amounts have been reclassified to conform withcurrent-year presentation.
3 Division of Group net income between the Parent CompaniesThe division of Group net income, in accordance with Note 1, is as follows:
Total Royal Dutch Shell Transport£ million
1997Group net income 4,736less undistributed net income 1,161
Net distributions to Parent Companies 3,575 2,274 1,301Tax benefit referable to net distributions accruing to Shell Transport (see Note 1) 215 – 215
Divisible for 60:40 purposes 3,790 (60%) 2,274 (40%) 1,516
Undistributed net income 1,161 (60%) 697 (40%) 464
1996Group net income 5,691less undistributed net income 2,465
Net distributions to Parent Companies 3,226 2,104 1,122Tax benefit referable to net distributions accruing to Shell Transport (see Note 1) 280 – 280
Divisible for 60:40 purposes 3,506 (60%) 2,104 (40%) 1,402
Undistributed net income 2,465 (60%) 1,479 (40%) 986
1995Group net income 4,375less undistributed net income 1,214
Net distributions to Parent Companies 3,161 2,062 1,099Tax benefit referable to net distributions accruing to Shell Transport (see Note 1) 275 – 275
Divisible for 60:40 purposes 3,436 (60%) 2,062 (40%) 1,374
Undistributed net income 1,214 (60%) 728 (40%) 486
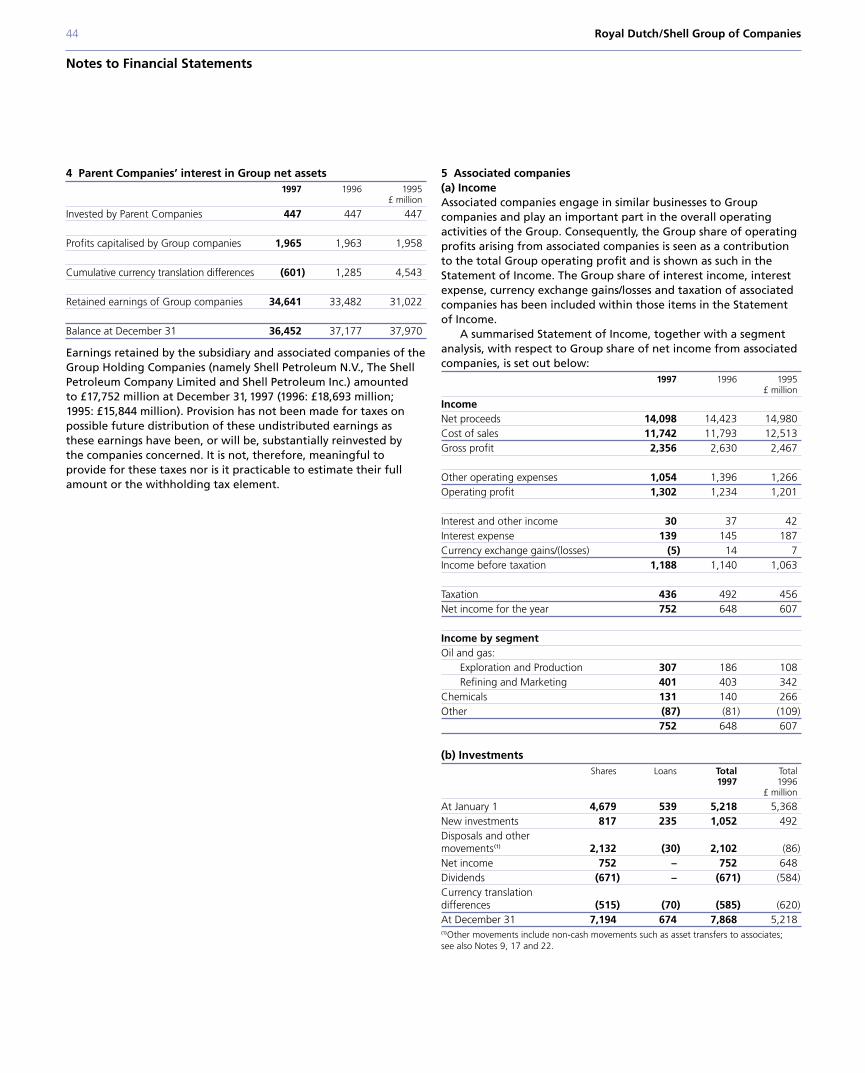
44 Royal Dutch/Shell Group of Companies
Notes to Financial Statements
4 Parent Companies’ interest in Group net assets1997 1996 1995
£ million
Invested by Parent Companies 447 447 447
Profits capitalised by Group companies 1,965 1,963 1,958
Cumulative currency translation differences (601) 1,285 4,543
Retained earnings of Group companies 34,641 33,482 31,022
Balance at December 31 36,452 37,177 37,970
Earnings retained by the subsidiary and associated companies of theGroup Holding Companies (namely Shell Petroleum N.V., The ShellPetroleum Company Limited and Shell Petroleum Inc.) amounted to £17,752 million at December 31, 1997 (1996: £18,693 million; 1995: £15,844 million). Provision has not been made for taxes onpossible future distribution of these undistributed earnings as these earnings have been, or will be, substantially reinvested by the companies concerned. It is not, therefore, meaningful toprovide for these taxes nor is it practicable to estimate their fullamount or the withholding tax element.
5 Associated companies(a) IncomeAssociated companies engage in similar businesses to Groupcompanies and play an important part in the overall operatingactivities of the Group. Consequently, the Group share of operatingprofits arising from associated companies is seen as a contributionto the total Group operating profit and is shown as such in theStatement of Income. The Group share of interest income, interestexpense, currency exchange gains/losses and taxation of associatedcompanies has been included within those items in the Statementof Income.
A summarised Statement of Income, together with a segmentanalysis, with respect to Group share of net income from associatedcompanies, is set out below:
1997 1996 1995£ million
IncomeNet proceeds 14,098 14,423 14,980Cost of sales 11,742 11,793 12,513Gross profit 2,356 2,630 2,467
Other operating expenses 1,054 1,396 1,266Operating profit 1,302 1,234 1,201
Interest and other income 30 37 42Interest expense 139 145 187Currency exchange gains/(losses) (5) 14 7Income before taxation 1,188 1,140 1,063
Taxation 436 492 456Net income for the year 752 648 607
Income by segmentOil and gas:
Exploration and Production 307 186 108Refining and Marketing 401 403 342
Chemicals 131 140 266Other (87) (81) (109)
752 648 607
(b) InvestmentsShares Loans Total Total
1997 1996£ million
At January 1 4,679 539 5,218 5,368New investments 817 235 1,052 492Disposals and other movements(1) 2,132 (30) 2,102 (86)Net income 752 – 752 648Dividends (671) – (671) (584)Currency translation differences (515) (70) (585) (620)At December 31 7,194 674 7,868 5,218(1)Other movements include non-cash movements such as asset transfers to associates;see also Notes 9, 17 and 22.
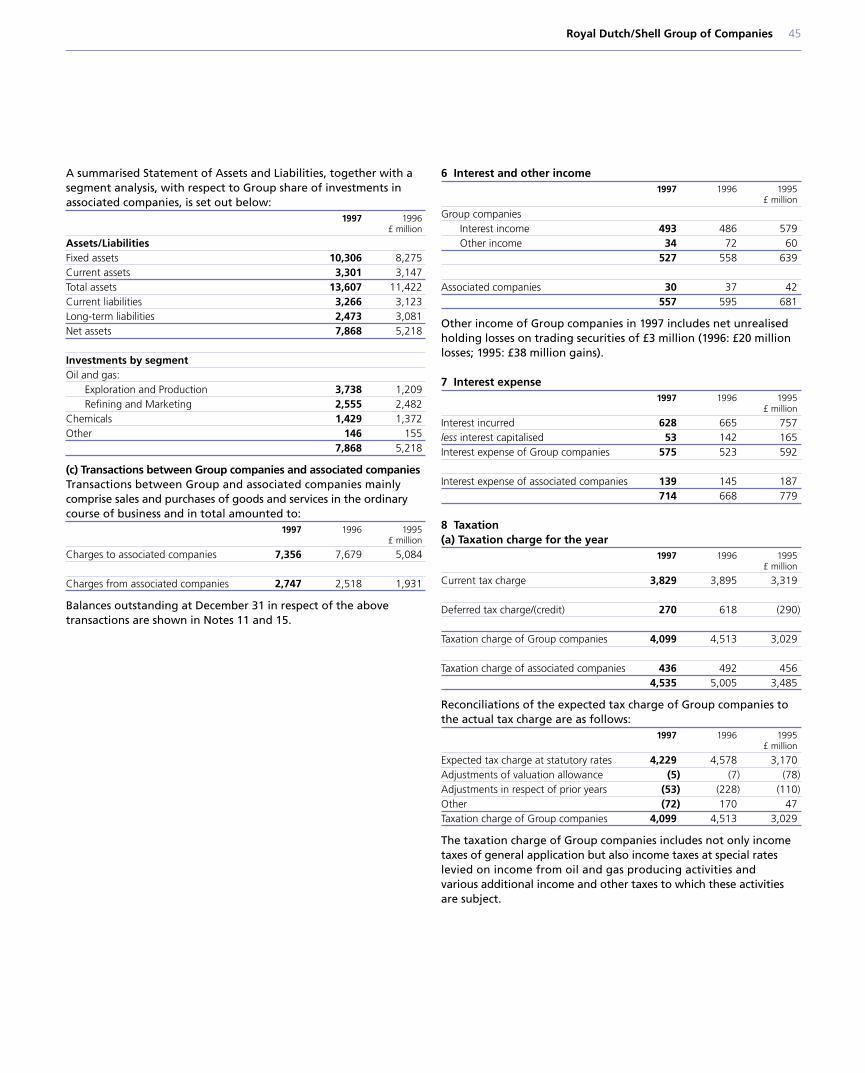
Royal Dutch/Shell Group of Companies 45
A summarised Statement of Assets and Liabilities, together with asegment analysis, with respect to Group share of investments inassociated companies, is set out below:
1997 1996£ million
Assets/LiabilitiesFixed assets 10,306 8,275Current assets 3,301 3,147Total assets 13,607 11,422Current liabilities 3,266 3,123Long-term liabilities 2,473 3,081Net assets 7,868 5,218
Investments by segmentOil and gas:
Exploration and Production 3,738 1,209Refining and Marketing 2,555 2,482
Chemicals 1,429 1,372Other 146 155
7,868 5,218
(c) Transactions between Group companies and associated companiesTransactions between Group and associated companies mainlycomprise sales and purchases of goods and services in the ordinarycourse of business and in total amounted to:
1997 1996 1995£ million
Charges to associated companies 7,356 7,679 5,084
Charges from associated companies 2,747 2,518 1,931
Balances outstanding at December 31 in respect of the above
transactions are shown in Notes 11 and 15.6 Interest and other income1997 1996 1995
£ million
Group companiesInterest income 493 486 579Other income 34 72 60
527 558 639
Associated companies 30 37 42557 595 681
Other income of Group companies in 1997 includes net unrealisedholding losses on trading securities of £3 million (1996: £20 millionlosses; 1995: £38 million gains).
7 Interest expense1997 1996 1995
£ million
Interest incurred 628 665 757less interest capitalised 53 142 165Interest expense of Group companies 575 523 592
Interest expense of associated companies 139 145 187714 668 779
8 Taxation(a) Taxation charge for the year
1997 1996 1995£ million
Current tax charge 3,829 3,895 3,319
Deferred tax charge/(credit) 270 618 (290)
Taxation charge of Group companies 4,099 4,513 3,029
Taxation charge of associated companies 436 492 4564,535 5,005 3,485
Reconciliations of the expected tax charge of Group companies tothe actual tax charge are as follows:
1997 1996 1995£ million
Expected tax charge at statutory rates 4,229 4,578 3,170Adjustments of valuation allowance (5) (7) (78)Adjustments in respect of prior years (53) (228) (110)Other (72) 170 47Taxation charge of Group companies 4,099 4,513 3,029
The taxation charge of Group companies includes not only incometaxes of general application but also income taxes at special rateslevied on income from oil and gas producing activities and various additional income and other taxes to which these activitiesare subject.
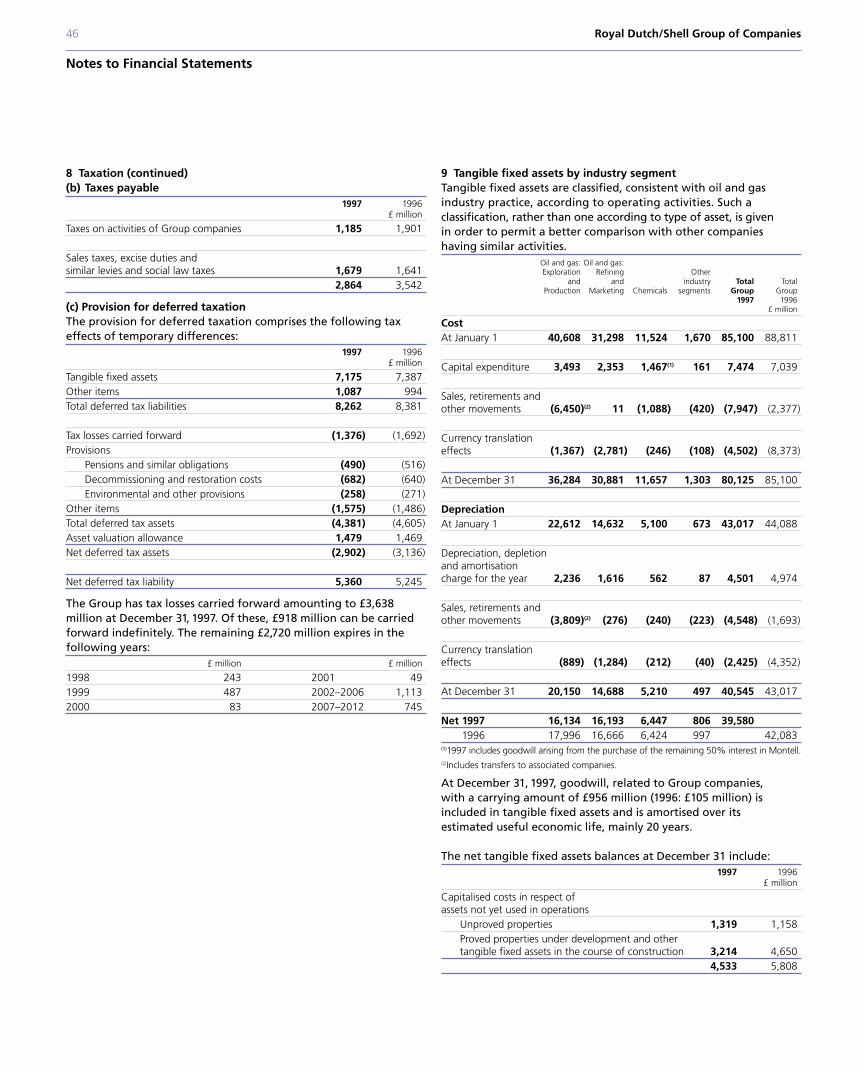
46 Royal Dutch/Shell Group of Companies
Notes to Financial Statements
8 Taxation (continued)(b) Taxes payable
1997 1996£ million
Taxes on activities of Group companies 1,185 1,901
Sales taxes, excise duties and similar levies and social law taxes 1,679 1,641
2,864 3,542
(c) Provision for deferred taxationThe provision for deferred taxation comprises the following taxeffects of temporary differences:
1997 1996£ million
Tangible fixed assets 7,175 7,387Other items 1,087 994Total deferred tax liabilities 8,262 8,381
Tax losses carried forward (1,376) (1,692)Provisions
Pensions and similar obligations (490) (516)Decommissioning and restoration costs (682) (640)Environmental and other provisions (258) (271)
Other items (1,575) (1,486)Total deferred tax assets (4,381) (4,605)Asset valuation allowance 1,479 1,469Net deferred tax assets (2,902) (3,136)
Net deferred tax liability 5,360 5,245
The Group has tax losses carried forward amounting to £3,638million at December 31, 1997. Of these, £918 million can be carriedforward indefinitely. The remaining £2,720 million expires in thefollowing years:
£ million £ million
1998 243 2001 491999 487 2002–2006 1,1132000 83 2007–2012 745
9 Tangible fixed assets by industry segmentTangible fixed assets are classified, consistent with oil and gasindustry practice, according to operating activities. Such aclassification, rather than one according to type of asset, is given in order to permit a better comparison with other companieshaving similar activities.
Oil and gas: Oil and gas:Exploration Refining Other
and and industry Total TotalProduction Marketing Chemicals segments Group Group
1997 1996£ million
CostAt January 1 40,608 31,298 11,524 1,670 85,100 88,811
Capital expenditure 3,493 2,353 1,467(1) 161 7,474 7,039
Sales, retirements and other movements (6,450)(2) 11 (1,088) (420) (7,947) (2,377)
Currency translationeffects (1,367) (2,781) (246) (108) (4,502) (8,373)
At December 31 36,284 30,881 11,657 1,303 80,125 85,100
DepreciationAt January 1 22,612 14,632 5,100 673 43,017 44,088
Depreciation, depletion and amortisation charge for the year 2,236 1,616 562 87 4,501 4,974
Sales, retirements and other movements (3,809)(2) (276) (240) (223) (4,548) (1,693)
Currency translation effects (889) (1,284) (212) (40) (2,425) (4,352)
At December 31 20,150 14,688 5,210 497 40,545 43,017
Net 1997 16,134 16,193 6,447 806 39,5801996 17,996 16,666 6,424 997 42,083
(1)1997 includes goodwill arising from the purchase of the remaining 50% interest in Montell.(2)Includes transfers to associated companies.
At December 31, 1997, goodwill, related to Group companies, with a carrying amount of £956 million (1996: £105 million) isincluded in tangible fixed assets and is amortised over its estimated useful economic life, mainly 20 years.
The net tangible fixed assets balances at December 31 include:1997 1996
£ million
Capitalised costs in respect of assets not yet used in operations
Unproved properties 1,319 1,158Proved properties under development and other tangible fixed assets in the course of construction 3,214 4,650
4,533 5,808
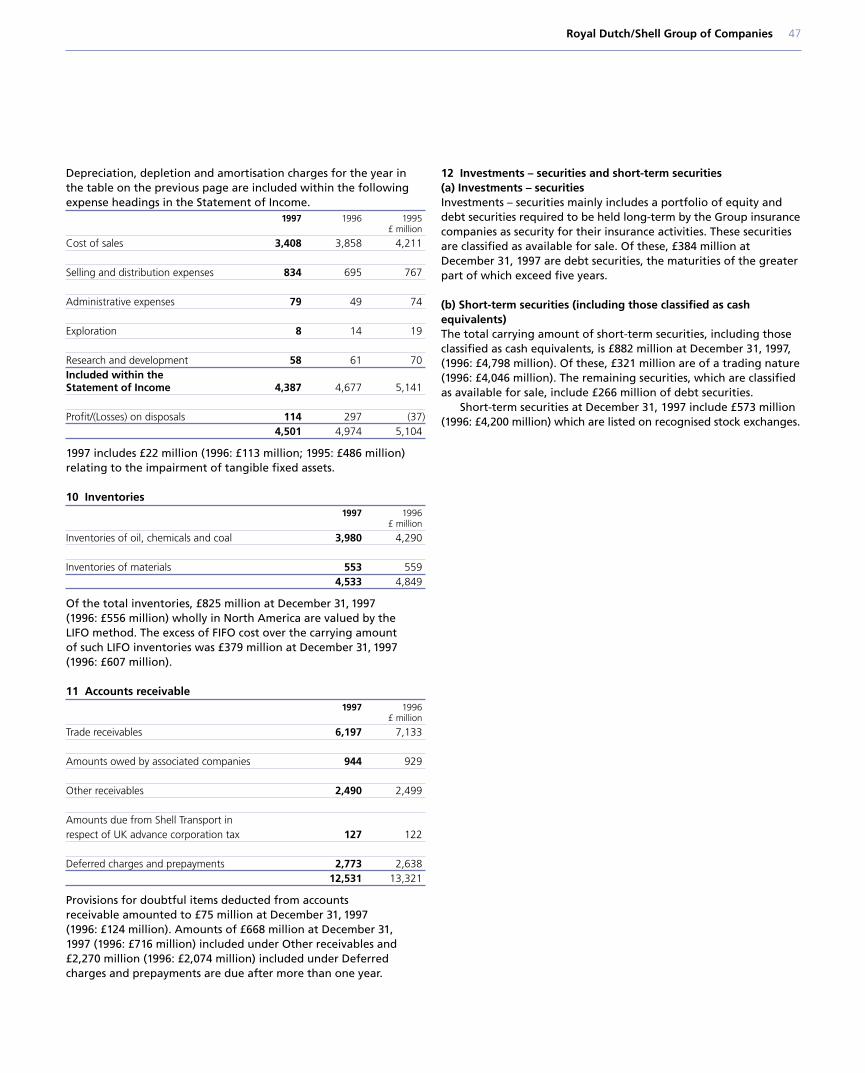
Royal Dutch/Shell Group of Companies 47
Depreciation, depletion and amortisation charges for the year inthe table on the previous page are included within the followingexpense headings in the Statement of Income.
1997 1996 1995£ million
Cost of sales 3,408 3,858 4,211
Selling and distribution expenses 834 695 767
Administrative expenses 79 49 74
Exploration 8 14 19
Research and development 58 61 70Included within the Statement of Income 4,387 4,677 5,141
Profit/(Losses) on disposals 114 297 (37)4,501 4,974 5,104
1997 includes £22 million (1996: £113 million; 1995: £486 million)relating to the impairment of tangible fixed assets.
10 Inventories1997 1996
£ million
Inventories of oil, chemicals and coal 3,980 4,290
Inventories of materials 553 5594,533 4,849
Of the total inventories, £825 million at December 31, 1997 (1996: £556 million) wholly in North America are valued by the LIFO method. The excess of FIFO cost over the carrying amount of such LIFO inventories was £379 million at December 31, 1997(1996: £607 million).
11 Accounts receivable1997 1996
£ million
Trade receivables 6,197 7,133
Amounts owed by associated companies 944 929
Other receivables 2,490 2,499
Amounts due from Shell Transport in respect of UK advance corporation tax 127 122
Deferred charges and prepayments 2,773 2,63812,531 13,321
Provisions for doubtful items deducted from accounts receivable amounted to £75 million at December 31, 1997 (1996: £124 million). Amounts of £668 million at December 31,1997 (1996: £716 million) included under Other receivables and £2,270 million (1996: £2,074 million) included under Deferredcharges and prepayments are due after more than one year.
12 Investments – securities and short-term securities(a) Investments – securitiesInvestments – securities mainly includes a portfolio of equity anddebt securities required to be held long-term by the Group insurancecompanies as security for their insurance activities. These securitiesare classified as available for sale. Of these, £384 million atDecember 31, 1997 are debt securities, the maturities of the greaterpart of which exceed five years.
(b) Short-term securities (including those classified as cashequivalents)The total carrying amount of short-term securities, including thoseclassified as cash equivalents, is £882 million at December 31, 1997,(1996: £4,798 million). Of these, £321 million are of a trading nature(1996: £4,046 million). The remaining securities, which are classifiedas available for sale, include £266 million of debt securities.
Short-term securities at December 31, 1997 include £573 million(1996: £4,200 million) which are listed on recognised stock exchanges.
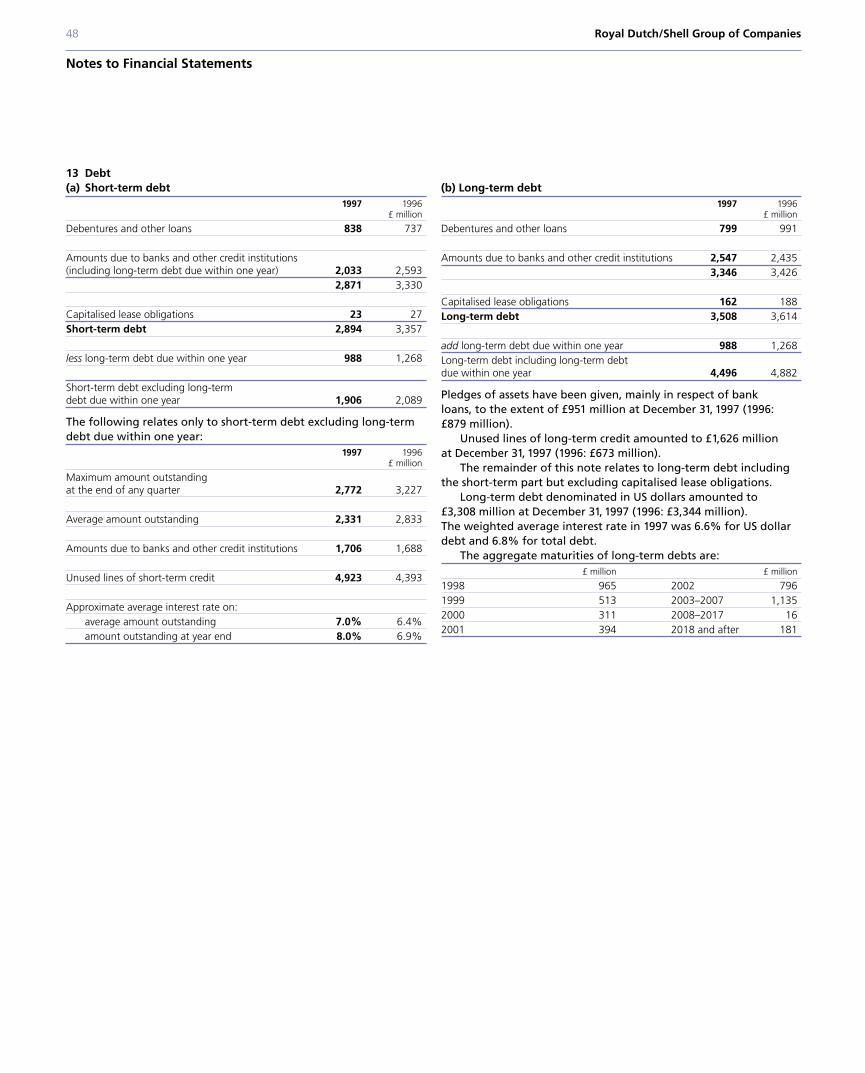
48 Royal Dutch/Shell Group of Companies
Notes to Financial Statements
13 Debt(a) Short-term debt
1997 1996£ million
Debentures and other loans 838 737
Amounts due to banks and other credit institutions(including long-term debt due within one year) 2,033 2,593
2,871 3,330
Capitalised lease obligations 23 27Short-term debt 2,894 3,357
less long-term debt due within one year 988 1,268
Short-term debt excluding long-term debt due within one year 1,906 2,089
The following relates only to short-term debt excluding long-termdebt due within one year:
1997 1996£ million
Maximum amount outstanding at the end of any quarter 2,772 3,227
Average amount outstanding 2,331 2,833
Amounts due to banks and other credit institutions 1,706 1,688
Unused lines of short-term credit 4,923 4,393
Approximate average interest rate on:average amount outstanding 7.0% 6.4%amount outstanding at year end 8.0% 6.9%
(b) Long-term debt1997 1996
£ million
Debentures and other loans 799 991
Amounts due to banks and other credit institutions 2,547 2,4353,346 3,426
Capitalised lease obligations 162 188Long-term debt 3,508 3,614
add long-term debt due within one year 988 1,268Long-term debt including long-term debt due within one year 4,496 4,882
Pledges of assets have been given, mainly in respect of bank loans, to the extent of £951 million at December 31, 1997 (1996: £879 million).
Unused lines of long-term credit amounted to £1,626 million at December 31, 1997 (1996: £673 million).
The remainder of this note relates to long-term debt includingthe short-term part but excluding capitalised lease obligations.
Long-term debt denominated in US dollars amounted to £3,308 million at December 31, 1997 (1996: £3,344 million). The weighted average interest rate in 1997 was 6.6% for US dollardebt and 6.8% for total debt.
The aggregate maturities of long-term debts are:£ million £ million
1998 965 2002 7961999 513 2003–2007 1,1352000 311 2008–2017 162001 394 2018 and after 181
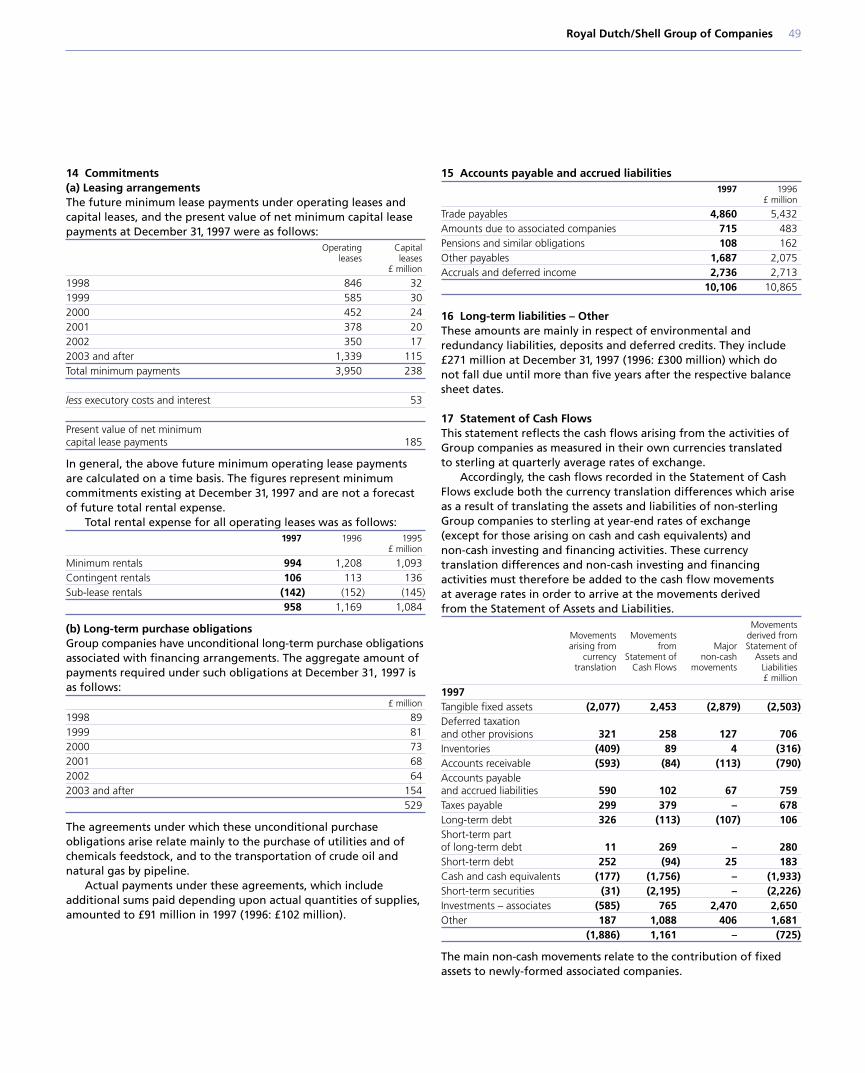
Royal Dutch/Shell Group of Companies 49
14 Commitments(a) Leasing arrangementsThe future minimum lease payments under operating leases andcapital leases, and the present value of net minimum capital leasepayments at December 31, 1997 were as follows:
Operating Capitalleases leases
£ million
1998 846 321999 585 302000 452 242001 378 202002 350 172003 and after 1,339 115Total minimum payments 3,950 238
less executory costs and interest 53
Present value of net minimum capital lease payments 185
In general, the above future minimum operating lease paymentsare calculated on a time basis. The figures represent minimumcommitments existing at December 31, 1997 and are not a forecastof future total rental expense.
Total rental expense for all operating leases was as follows:1997 1996 1995
£ million
Minimum rentals 994 1,208 1,093Contingent rentals 106 113 136Sub-lease rentals (142) (152) (145)
958 1,169 1,084
(b) Long-term purchase obligationsGroup companies have unconditional long-term purchase obligationsassociated with financing arrangements. The aggregate amount ofpayments required under such obligations at December 31, 1997 isas follows:
£ million
1998 891999 812000 732001 682002 642003 and after 154
529
The agreements under which these unconditional purchaseobligations arise relate mainly to the purchase of utilities and ofchemicals feedstock, and to the transportation of crude oil andnatural gas by pipeline.
Actual payments under these agreements, which includeadditional sums paid depending upon actual quantities of supplies,amounted to £91 million in 1997 (1996: £102 million).
15 Accounts payable and accrued liabilities1997 1996
£ million
Trade payables 4,860 5,432Amounts due to associated companies 715 483Pensions and similar obligations 108 162Other payables 1,687 2,075Accruals and deferred income 2,736 2,713
10,106 10,865
16 Long-term liabilities – OtherThese amounts are mainly in respect of environmental andredundancy liabilities, deposits and deferred credits. They include£271 million at December 31, 1997 (1996: £300 million) which do not fall due until more than five years after the respective balancesheet dates.
17 Statement of Cash FlowsThis statement reflects the cash flows arising from the activities ofGroup companies as measured in their own currencies translated to sterling at quarterly average rates of exchange.
Accordingly, the cash flows recorded in the Statement of CashFlows exclude both the currency translation differences which ariseas a result of translating the assets and liabilities of non-sterlingGroup companies to sterling at year-end rates of exchange (except for those arising on cash and cash equivalents) and non-cash investing and financing activities. These currencytranslation differences and non-cash investing and financingactivities must therefore be added to the cash flow movements at average rates in order to arrive at the movements derived from the Statement of Assets and Liabilities.
MovementsMovements Movements derived fromarising from from Major Statement of
currency Statement of non-cash Assets andtranslation Cash Flows movements Liabilities
£ million
1997Tangible fixed assets (2,077) 2,453 (2,879) (2,503)Deferred taxation and other provisions 321 258 127 706Inventories (409) 89 4 (316)Accounts receivable (593) (84) (113) (790)Accounts payable and accrued liabilities 590 102 67 759Taxes payable 299 379 – 678Long-term debt 326 (113) (107) 106Short-term part of long-term debt 11 269 – 280Short-term debt 252 (94) 25 183Cash and cash equivalents (177) (1,756) – (1,933)Short-term securities (31) (2,195) – (2,226)Investments – associates (585) 765 2,470 2,650Other 187 1,088 406 1,681
(1,886) 1,161 – (725)
The main non-cash movements relate to the contribution of fixedassets to newly-formed associated companies.
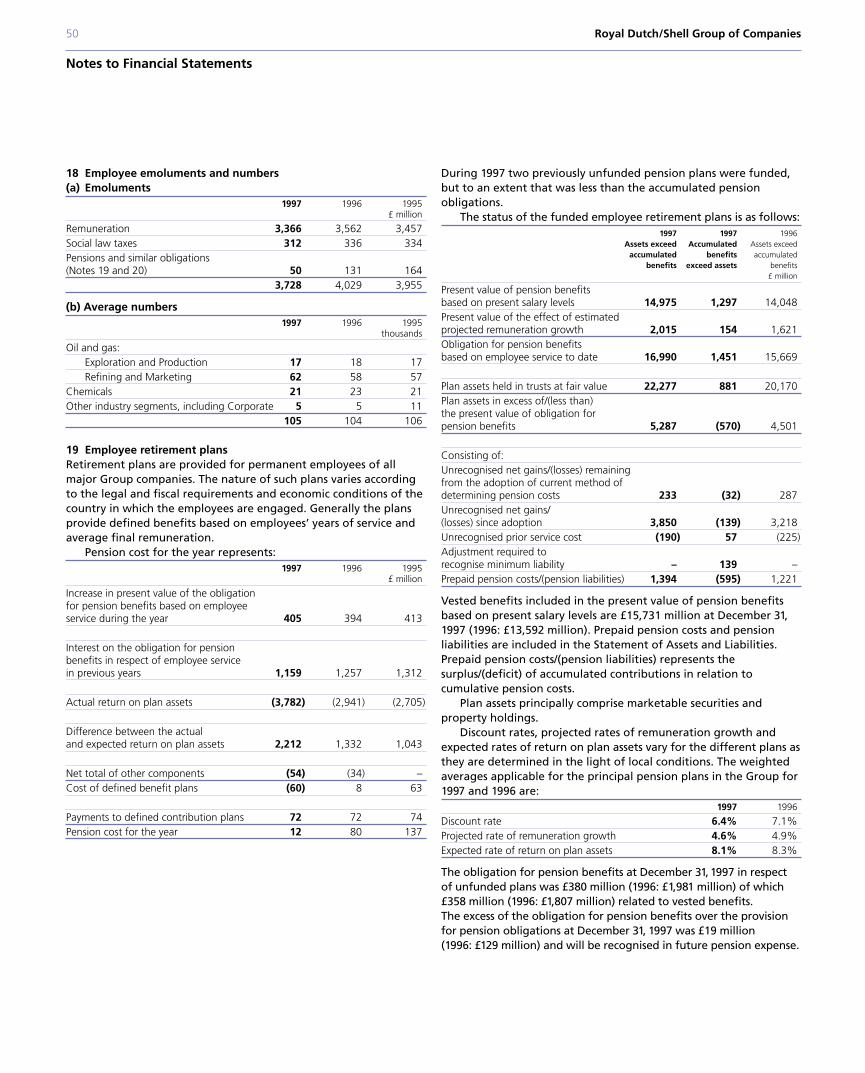
50 Royal Dutch/Shell Group of Companies
Notes to Financial Statements
18 Employee emoluments and numbers(a) Emoluments
1997 1996 1995£ million
Remuneration 3,366 3,562 3,457Social law taxes 312 336 334Pensions and similar obligations (Notes 19 and 20) 50 131 164
3,728 4,029 3,955
(b) Average numbers1997 1996 1995
thousands
Oil and gas:Exploration and Production 17 18 17Refining and Marketing 62 58 57
Chemicals 21 23 21Other industry segments, including Corporate 5 5 11
105 104 106
19 Employee retirement plansRetirement plans are provided for permanent employees of allmajor Group companies. The nature of such plans varies accordingto the legal and fiscal requirements and economic conditions of thecountry in which the employees are engaged. Generally the plansprovide defined benefits based on employees’ years of service andaverage final remuneration.
Pension cost for the year represents:1997 1996 1995
£ million
Increase in present value of the obligationfor pension benefits based on employeeservice during the year 405 394 413
Interest on the obligation for pensionbenefits in respect of employee servicein previous years 1,159 1,257 1,312
Actual return on plan assets (3,782) (2,941) (2,705)
Difference between the actual and expected return on plan assets 2,212 1,332 1,043
Net total of other components (54) (34) –Cost of defined benefit plans (60) 8 63
Payments to defined contribution plans 72 72 74Pension cost for the year 12 80 137
During 1997 two previously unfunded pension plans were funded,but to an extent that was less than the accumulated pensionobligations.
The status of the funded employee retirement plans is as follows:1997 1997 1996
Assets exceed Accumulated Assets exceedaccumulated benefits accumulated
benefits exceed assets benefits£ million
Present value of pension benefits based on present salary levels 14,975 1,297 14,048Present value of the effect of estimatedprojected remuneration growth 2,015 154 1,621Obligation for pension benefits based on employee service to date 16,990 1,451 15,669
Plan assets held in trusts at fair value 22,277 881 20,170Plan assets in excess of/(less than) the present value of obligation for pension benefits 5,287 (570) 4,501
Consisting of:Unrecognised net gains/(losses) remaining from the adoption of current method of determining pension costs 233 (32) 287Unrecognised net gains/(losses) since adoption 3,850 (139) 3,218Unrecognised prior service cost (190) 57 (225)Adjustment required to recognise minimum liability – 139 –Prepaid pension costs/(pension liabilities) 1,394 (595) 1,221
Vested benefits included in the present value of pension benefitsbased on present salary levels are £15,731 million at December 31,1997 (1996: £13,592 million). Prepaid pension costs and pensionliabilities are included in the Statement of Assets and Liabilities.Prepaid pension costs/(pension liabilities) represents thesurplus/(deficit) of accumulated contributions in relation tocumulative pension costs.
Plan assets principally comprise marketable securities andproperty holdings.
Discount rates, projected rates of remuneration growth andexpected rates of return on plan assets vary for the different plans asthey are determined in the light of local conditions. The weightedaverages applicable for the principal pension plans in the Group for1997 and 1996 are:
1997 1996
Discount rate 6.4% 7.1%Projected rate of remuneration growth 4.6% 4.9%Expected rate of return on plan assets 8.1% 8.3%
The obligation for pension benefits at December 31, 1997 in respect of unfunded plans was £380 million (1996: £1,981 million) of which£358 million (1996: £1,807 million) related to vested benefits. The excess of the obligation for pension benefits over the provisionfor pension obligations at December 31, 1997 was £19 million (1996: £129 million) and will be recognised in future pension expense.
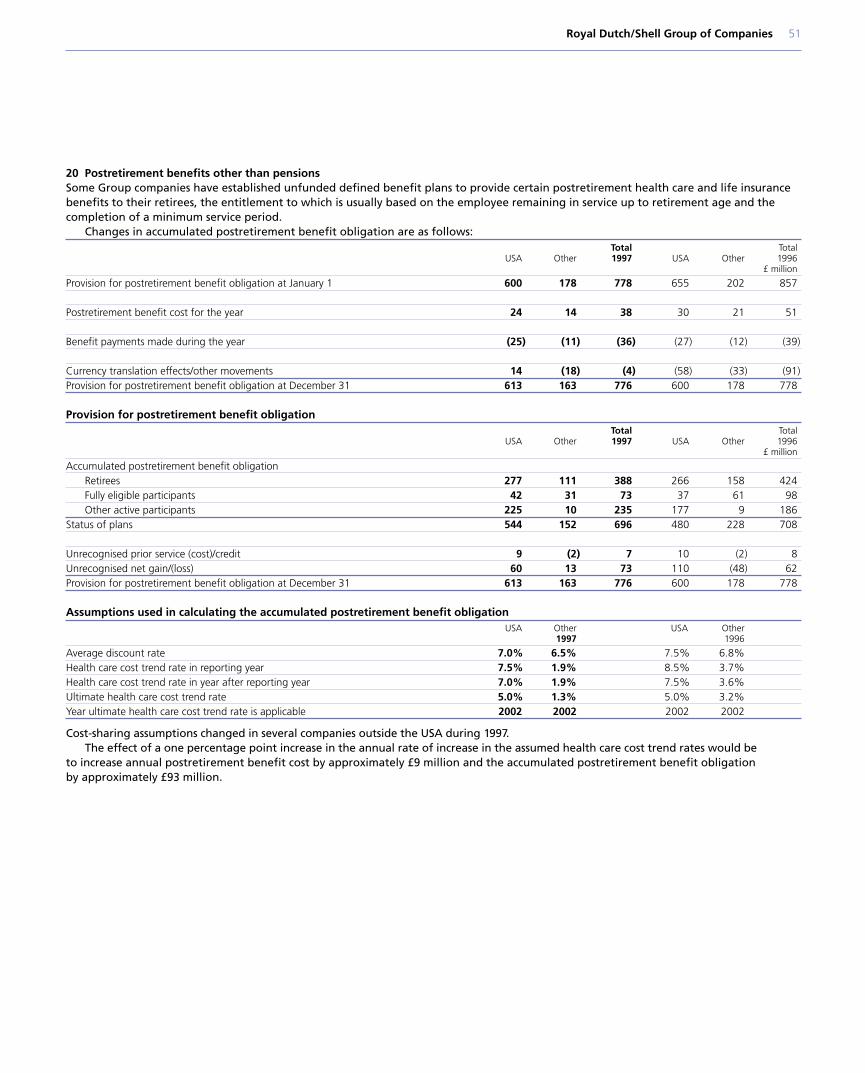
Royal Dutch/Shell Group of Companies 51
20 Postretirement benefits other than pensionsSome Group companies have established unfunded defined benefit plans to provide certain postretirement health care and life insurancebenefits to their retirees, the entitlement to which is usually based on the employee remaining in service up to retirement age and thecompletion of a minimum service period.
Changes in accumulated postretirement benefit obligation are as follows:Total Total
USA Other 1997 USA Other 1996£ million
Provision for postretirement benefit obligation at January 1 600 178 778 655 202 857
Postretirement benefit cost for the year 24 14 38 30 21 51
Benefit payments made during the year (25) (11) (36) (27) (12) (39)
Currency translation effects/other movements 14 (18) (4) (58) (33) (91)Provision for postretirement benefit obligation at December 31 613 163 776 600 178 778
Provision for postretirement benefit obligationTotal Total
USA Other 1997 USA Other 1996£ million
Accumulated postretirement benefit obligationRetirees 277 111 388 266 158 424Fully eligible participants 42 31 73 37 61 98Other active participants 225 10 235 177 9 186
Status of plans 544 152 696 480 228 708
Unrecognised prior service (cost)/credit 9 (2) 7 10 (2) 8Unrecognised net gain/(loss) 60 13 73 110 (48) 62Provision for postretirement benefit obligation at December 31 613 163 776 600 178 778
Assumptions used in calculating the accumulated postretirement benefit obligationUSA Other USA Other
1997 1996
Average discount rate 7.0% 6.5% 7.5% 6.8%Health care cost trend rate in reporting year 7.5% 1.9% 8.5% 3.7%Health care cost trend rate in year after reporting year 7.0% 1.9% 7.5% 3.6%Ultimate health care cost trend rate 5.0% 1.3% 5.0% 3.2%Year ultimate health care cost trend rate is applicable 2002 2002 2002 2002
Cost-sharing assumptions changed in several companies outside the USA during 1997.The effect of a one percentage point increase in the annual rate of increase in the assumed health care cost trend rates would be
to increase annual postretirement benefit cost by approximately £9 million and the accumulated postretirement benefit obligation by approximately £93 million.
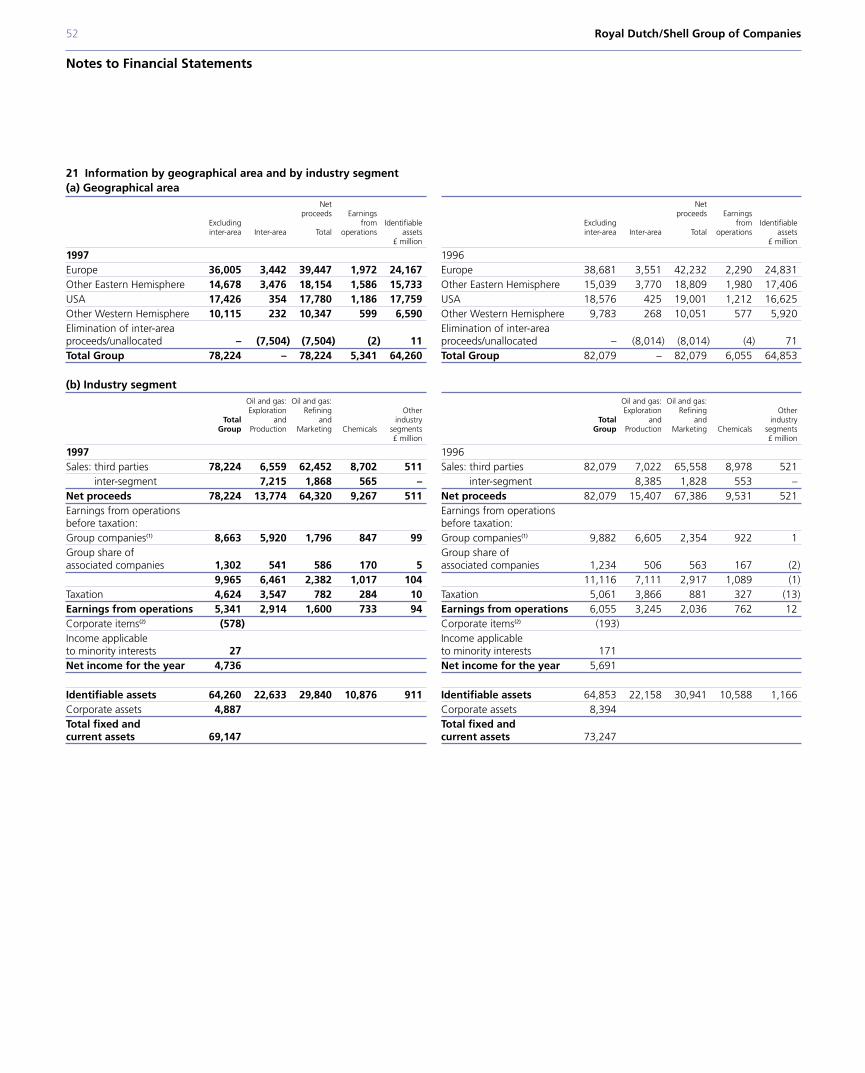
52 Royal Dutch/Shell Group of Companies
Notes to Financial Statements
21 Information by geographical area and by industry segment(a) Geographical area
Net proceeds Earnings
Excluding from Identifiableinter-area Inter-area Total operations assets
£ million
1997Europe 36,005 3,442 39,447 1,972 24,167Other Eastern Hemisphere 14,678 3,476 18,154 1,586 15,733USA 17,426 354 17,780 1,186 17,759Other Western Hemisphere 10,115 232 10,347 599 6,590Elimination of inter-areaproceeds/unallocated – (7,504) (7,504) (2) 11Total Group 78,224 – 78,224 5,341 64,260
(b) Industry segmentOil and gas: Oil and gas:Exploration Refining Other
Total and and industry Group Production Marketing Chemicals segments
£ million
1997Sales: third parties 78,224 6,559 62,452 8,702 511
inter-segment 7,215 1,868 565 –Net proceeds 78,224 13,774 64,320 9,267 511Earnings from operationsbefore taxation:Group companies(1) 8,663 5,920 1,796 847 99Group share of associated companies 1,302 541 586 170 5
9,965 6,461 2,382 1,017 104Taxation 4,624 3,547 782 284 10Earnings from operations 5,341 2,914 1,600 733 94Corporate items(2) (578)Income applicable to minority interests 27Net income for the year 4,736
Identifiable assets 64,260 22,633 29,840 10,876 911Corporate assets 4,887Total fixed andcurrent assets 69,147
Netproceeds Earnings
Excluding from Identifiableinter-area Inter-area Total operations assets
£ million
1996Europe 38,681 3,551 42,232 2,290 24,831Other Eastern Hemisphere 15,039 3,770 18,809 1,980 17,406USA 18,576 425 19,001 1,212 16,625Other Western Hemisphere 9,783 268 10,051 577 5,920Elimination of inter-areaproceeds/unallocated – (8,014) (8,014) (4) 71Total Group 82,079 – 82,079 6,055 64,853
Oil and gas: Oil and gas:Exploration Refining Other
Total and and industry Group Production Marketing Chemicals segments
£ million
1996Sales: third parties 82,079 7,022 65,558 8,978 521
inter-segment 8,385 1,828 553 –Net proceeds 82,079 15,407 67,386 9,531 521Earnings from operationsbefore taxation:Group companies(1) 9,882 6,605 2,354 922 1Group share of associated companies 1,234 506 563 167 (2)
11,116 7,111 2,917 1,089 (1)Taxation 5,061 3,866 881 327 (13)Earnings from operations 6,055 3,245 2,036 762 12Corporate items(2) (193)Income applicable to minority interests 171Net income for the year 5,691
Identifiable assets 64,853 22,158 30,941 10,588 1,166Corporate assets 8,394Total fixed andcurrent assets 73,247

Royal Dutch/Shell Group of Companies 53
Net proceeds Earnings
Excluding from Identifiableinter-area Inter-area Total operations assets
£ million
1995Europe 32,704 2,539 35,243 1,807 24,500Other Eastern Hemisphere 13,197 2,984 16,181 1,401 17,931USA 15,372 433 15,805 846 16,580Other Western Hemisphere 8,322 299 8,621 551 5,992Elimination of inter-areaproceeds/unallocated – (6,255) (6,255) (19) 279Total Group 69,595 – 69,595 4,586 65,282
Oil and gas: Oil and gas:Exploration Refining Other
Total and and industry Group Production Marketing Chemicals segments
£ million
1995Sales: third parties 69,595 5,493 54,135 9,239 728
inter-segment 6,761 1,443 280 –Net proceeds 69,595 12,254 55,578 9,519 728Earnings from operationsbefore taxation:Group companies(1) 6,957 3,797 1,772 1,303 85Group share of associated companies 1,201 284 576 335 6
8,158 4,081 2,348 1,638 91Taxation 3,572 2,215 831 546 (20)Earnings from operations 4,586 1,866 1,517 1,092 111Corporate items(2) (95)Income applicable to minority interests 116Net income for the year 4,375
Identifiable assets 65,282 22,271 30,586 11,233 1,192Corporate assets 10,683Total fixed and current assets 75,965(1)Excludes certain items included in Corporate which form part of Operating profit inthe Statement of Income and includes certain currency exchange gains/losses which areallocated to the appropriate segment. (2)Corporate includes currency exchange losses of £253 million in 1997 (1996: losses of£59 million; 1995: gains of £163 million).
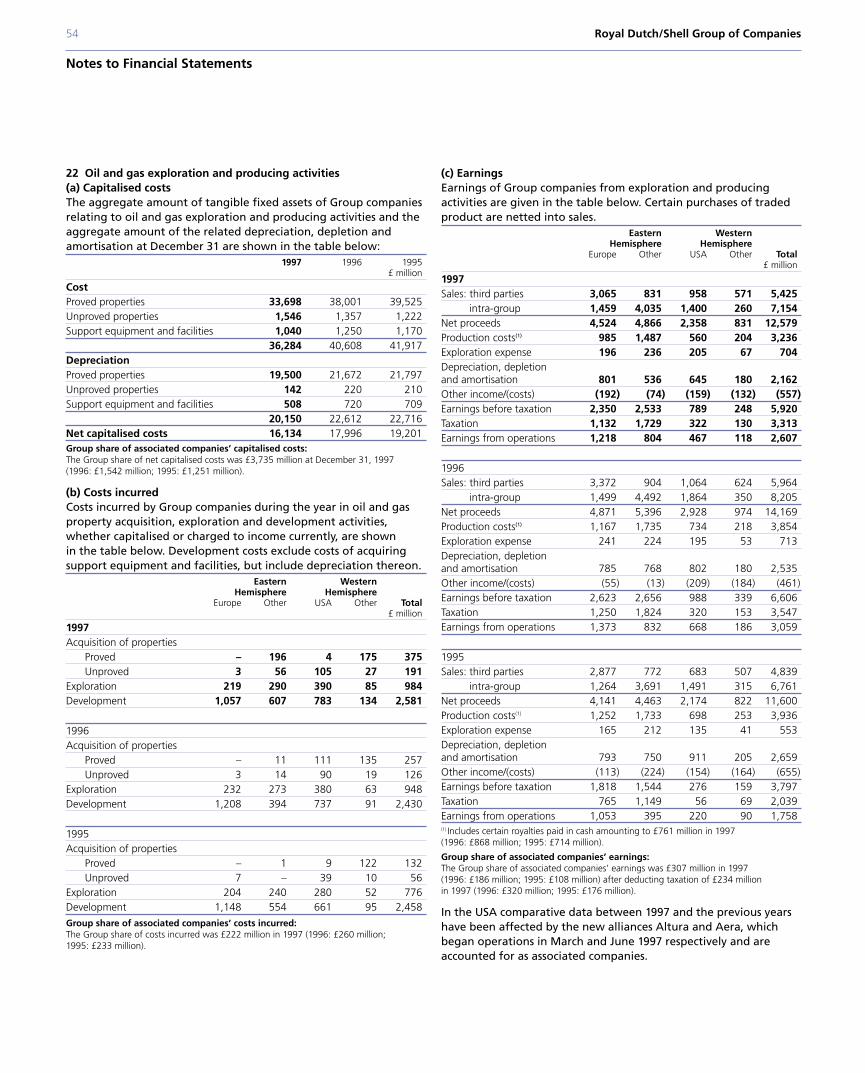
54 Royal Dutch/Shell Group of Companies
Notes to Financial Statements
22 Oil and gas exploration and producing activities(a) Capitalised costsThe aggregate amount of tangible fixed assets of Group companiesrelating to oil and gas exploration and producing activities and theaggregate amount of the related depreciation, depletion andamortisation at December 31 are shown in the table below:
1997 1996 1995£ million
CostProved properties 33,698 38,001 39,525Unproved properties 1,546 1,357 1,222Support equipment and facilities 1,040 1,250 1,170
36,284 40,608 41,917DepreciationProved properties 19,500 21,672 21,797Unproved properties 142 220 210Support equipment and facilities 508 720 709
20,150 22,612 22,716Net capitalised costs 16,134 17,996 19,201Group share of associated companies’ capitalised costs:The Group share of net capitalised costs was £3,735 million at December 31, 1997(1996: £1,542 million; 1995: £1,251 million).
(b) Costs incurredCosts incurred by Group companies during the year in oil and gasproperty acquisition, exploration and development activities,whether capitalised or charged to income currently, are shown in the table below. Development costs exclude costs of acquiringsupport equipment and facilities, but include depreciation thereon.
Eastern WesternHemisphere Hemisphere
Europe Other USA Other Total£ million
1997Acquisition of properties
Proved – 196 4 175 375Unproved 3 56 105 27 191
Exploration 219 290 390 85 984Development 1,057 607 783 134 2,581
1996Acquisition of properties
Proved – 11 111 135 257Unproved 3 14 90 19 126
Exploration 232 273 380 63 948Development 1,208 394 737 91 2,430
1995Acquisition of properties
Proved – 1 9 122 132Unproved 7 – 39 10 56
Exploration 204 240 280 52 776Development 1,148 554 661 95 2,458
Group share of associated companies’ costs incurred:The Group share of costs incurred was £222 million in 1997 (1996: £260 million; 1995: £233 million).
(c) EarningsEarnings of Group companies from exploration and producingactivities are given in the table below. Certain purchases of tradedproduct are netted into sales.
Eastern WesternHemisphere Hemisphere
Europe Other USA Other Total£ million
1997Sales: third parties 3,065 831 958 571 5,425
intra-group 1,459 4,035 1,400 260 7,154Net proceeds 4,524 4,866 2,358 831 12,579Production costs(1) 985 1,487 560 204 3,236Exploration expense 196 236 205 67 704Depreciation, depletion and amortisation 801 536 645 180 2,162Other income/(costs) (192) (74) (159) (132) (557)Earnings before taxation 2,350 2,533 789 248 5,920Taxation 1,132 1,729 322 130 3,313Earnings from operations 1,218 804 467 118 2,607
1996Sales: third parties 3,372 904 1,064 624 5,964
intra-group 1,499 4,492 1,864 350 8,205Net proceeds 4,871 5,396 2,928 974 14,169Production costs(1) 1,167 1,735 734 218 3,854Exploration expense 241 224 195 53 713Depreciation, depletion and amortisation 785 768 802 180 2,535Other income/(costs) (55) (13) (209) (184) (461)Earnings before taxation 2,623 2,656 988 339 6,606Taxation 1,250 1,824 320 153 3,547Earnings from operations 1,373 832 668 186 3,059
1995Sales: third parties 2,877 772 683 507 4,839
intra-group 1,264 3,691 1,491 315 6,761Net proceeds 4,141 4,463 2,174 822 11,600Production costs(1) 1,252 1,733 698 253 3,936Exploration expense 165 212 135 41 553Depreciation, depletion and amortisation 793 750 911 205 2,659Other income/(costs) (113) (224) (154) (164) (655)Earnings before taxation 1,818 1,544 276 159 3,797Taxation 765 1,149 56 69 2,039Earnings from operations 1,053 395 220 90 1,758(1) Includes certain royalties paid in cash amounting to £761 million in 1997 (1996: £868 million; 1995: £714 million).
Group share of associated companies’ earnings:The Group share of associated companies’ earnings was £307 million in 1997 (1996: £186 million; 1995: £108 million) after deducting taxation of £234 million in 1997 (1996: £320 million; 1995: £176 million).
In the USA comparative data between 1997 and the previous yearshave been affected by the new alliances Altura and Aera, whichbegan operations in March and June 1997 respectively and areaccounted for as associated companies.
Royal Dutch/Shell Group of Companies 55
23 Stock options and Parent Companies’ shares held by GroupcompaniesCertain Group companies have outstanding stock options grantedto executives and other key employees of those and other Groupcompanies. The options are granted, according to the particularoption plan, for periods of not more than five or ten years at pricesnot less than the market value at the date of granting the option.
The Senior Executive Stock Option Scheme has been inoperation for 30 years providing stock options to the most seniorexecutives of the Group from time to time. Beginning in 1995,options were granted to a larger group of over 900 managers. This enlargement of an otherwise unchanged scheme was part of amove to performance-related pay for the wider management cadreof the Group which, by aligning remuneration with shareholderinterest, is intended to support the drive for improved businessperformance.
The following table shows, in respect of these plans, the optionsexercised and options granted during the year, and the number ofshares under option at December 31, 1997. The share data givenbelow take into account the 1997 stock splits by Royal Dutch and by Shell Canada and the capitalisation issue by Shell Transport.
Exercised Granted Underoption
Royal Dutch ordinary shares 1,426,680 2,352,320 5,213,940
Shell Transport ordinary shares 7,090,420 11,323,598 30,110,218
Shell Canada common shares 595,795 268,200 970,469†
†Unissued
In connection with certain of these plans 5,212,340 shares of Royal Dutch and 30,110,218 shares of Shell Transport were held at December 31, 1997 at an aggregate cost of £233 million.
In addition, 33,600 shares of Royal Dutch were held by Groupcompanies.
The Shell Petroleum Company Limited operates a savings-relatedshare option scheme, under which options are granted over sharesof Shell Transport at prices not less than the market value on a datenot more than 30 days before the date of the grant of option andare normally exercisable after completion of a three or five yearcontractual savings period. At December 31, 1997 options wereoutstanding over an aggregate of 31,987,211 shares of ShellTransport and 24,754,517 shares to back these options have beenpurchased by a Group company at a cost of £62 million. During1997, options over 10,853,723 shares were exercised and optionsover 5,698,262 shares granted.
24 Contingencies and litigationTwo production joint ventures, in which the Group has an interestand which are based in the Netherlands and in Germany respectively,have co-operated to extract gas on an equal basis from a commonborder area. In the process of the final redetermination of gasreserves in the common area it emerged that the German jointventure has in good faith received considerable quantities of gas in excess of its entitlement. In 1991 the two joint ventures reachedan agreement on the quantification of the excess, and this wassubsequently approved by the respective governments. Due todifferences of opinion between the parties involved relating tocompensation in respect of the over-delivery, arbitration proceedingswere commenced and are on-going in Zurich under the rules of theInternational Chamber of Commerce with respect to that issue.
Apart from the issue subject to arbitration proceedings, thereare other substantive issues which remain outstanding: in particular,the recovery of royalties paid in respect of the over-delivery andgovernmental levies on any compensation.
Since the ultimate Group interest in the ventures and the taxregimes applicable to them are different, this over-delivery couldlead to a net cost to the Group. In 1996 an interim award was madeby the arbitrators. During the year there were no developmentswhich resulted in any changes to the provisions already made inrespect of this matter. However, at this time, the ultimate costcannot be established with reasonable certainty.
Group companies are subject to a number of other losscontingencies arising out of litigation and claims brought bygovernmental and private parties, including product liability claims against Shell Oil involving the failure of plumbing systemsconstructed with polybutylene plastic pipe.
Certain other contingent liabilities of Group companies, arising mainly from guarantees for customs duties and third partyindebtedness, amounted to £929 million at December 31, 1997(1996: £953 million).
In the judgement of the Directors of the Group HoldingCompanies no losses, in excess of provisions made, which arematerial in relation to the Group financial position are likely toarise in respect of the foregoing matters, although their occurrencemay have a significant effect on periodic results.
The operations and earnings of Group companies continue,from time to time, to be affected to varying degrees by political,legislative, fiscal and regulatory developments, including thoserelating to environmental protection, in the countries in which theyoperate. The industries in which Group companies are engaged arealso subject to physical risks of various types. The nature andfrequency of these developments and events, not all of which arecovered by insurance, as well as their effect on future operationsand earnings, are unpredictable.

56 Royal Dutch/Shell Group of Companies
Notes to Financial Statements
25 Financial instrumentsGroup companies, in the normal course of business, use varioustypes of financial instruments which expose the Group to market or credit risk. These include those recognised in the Statement ofAssets and Liabilities (‘on-balance sheet’) and derivative financialinstruments. To the extent that financial instruments are used tomanage exposures, estimated fair values of these instruments willoffset, and be recognised concurrently with, gains and lossesassociated with the underlying transactions.
Group companies have procedures and policies in place to limitthe amount of credit exposure to any counterparty or market.These procedures and the broad geographical spread of Groupcompanies’ activities limit the Group’s exposure to concentrations of credit or market risk.
In the event of a counterparty defaulting on payments due toGroup companies the resulting losses, if any, would be limited tothe fair values of the instruments on which the default occurred.The contract/notional amounts of the financial instrumentsoutstanding give an indication of the extent that these financialinstruments are used but not of the exposure to credit or market risk.
Additional data related to derivatives and risk disclosures,required by the United States Securities and Exchange Commission,are given in the 1997 Annual Report on Form 20-F of Royal Dutchand Shell Transport. See inside back cover for details of where toobtain a copy.
(a) On-balance sheet financial instrumentsFinancial instruments in the Statement of Assets and Liabilitiesinclude fixed assets: investments – securities, trade receivables,short-term securities, cash and cash equivalents, short-term andlong-term debt. The estimated fair values of these instrumentsapproximate their carrying amounts.
The remainder of this note relates to derivative instruments.
(b) Interest rate riskSome Group companies, primarily those with specialist treasuryoperations, use derivatives, such as interest-rate swaps/forward-rateagreements and interest rate caps, to manage their exposure tomovements in interest rates and thus to help achieve target levelsof interest income or expense. The financing of most GroupOperating Companies is structured on a floating-rate basis and,except in special cases, further interest-rate risk management isdiscouraged. The effect of these derivatives is reflected, asappropriate, in interest expense or interest income.
The total contract/notional amounts and estimated fair values ofGroup companies’ interest rate swaps/forward rate agreements andinterest rate caps at December 31 are given in the table below:
Contract/ Contract/notional Estimated notional Estimatedamount fair value amount fair value
1997 1996£ million
Interest rate swaps/forward rate agreements and interest rate caps 3,779 2 3,932 (16)
The amount of hedging gains or losses on these instruments whichhad been deferred at December 31, 1997 and at December 31, 1996in respect of firm commitments was not significant.
(c) Foreign exchange riskForeign exchange derivatives, including forward exchange contractsand currency swaps/options, are used by some Group companies.Group companies do not trade in these derivatives, but rather useforward exchange contracts to maintain an appropriate currencybalance for investments of a trading nature. Group companies alsouse these instruments to hedge future transactions and cash flows.
The total contract/notional amounts and estimated fair values ofGroup companies’ forward exchange contracts and currencyswaps/options at December 31 are given in the table below:
Contract/ Contract/notional Estimated notional Estimatedamount fair value amount fair value
1997 1996£ million
Forward exchange contracts 2,698 (32) 3,458 79Currency swaps/options 451 47 596 (1)
The amount of hedging gains or losses on these instruments whichhad been deferred at December 31, 1997 and at December 31, 1996in respect of firm commitments was not significant.
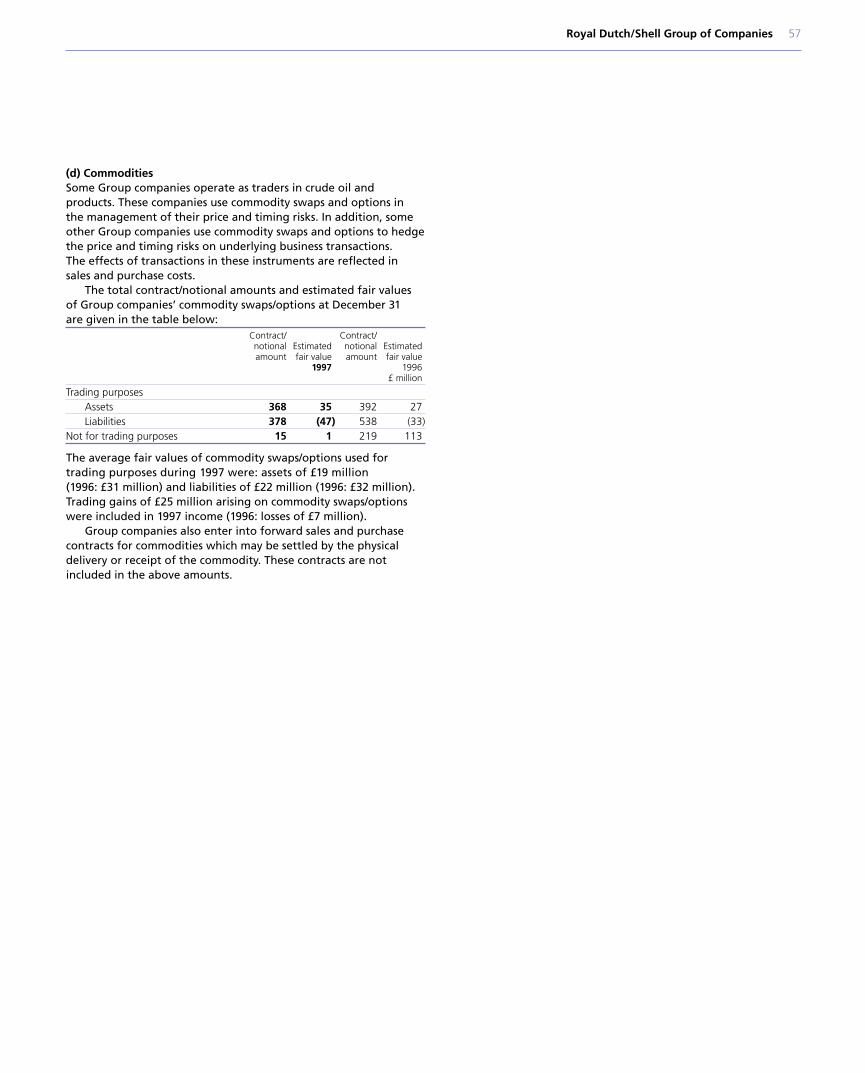
Royal Dutch/Shell Group of Companies 57
(d) CommoditiesSome Group companies operate as traders in crude oil andproducts. These companies use commodity swaps and options in the management of their price and timing risks. In addition, some other Group companies use commodity swaps and options to hedgethe price and timing risks on underlying business transactions. The effects of transactions in these instruments are reflected in sales and purchase costs.
The total contract/notional amounts and estimated fair values of Group companies’ commodity swaps/options at December 31 are given in the table below:
Contract/ Contract/notional Estimated notional Estimatedamount fair value amount fair value
1997 1996£ million
Trading purposesAssets 368 35 392 27Liabilities 378 (47) 538 (33)
Not for trading purposes 15 1 219 113
The average fair values of commodity swaps/options used fortrading purposes during 1997 were: assets of £19 million (1996: £31 million) and liabilities of £22 million (1996: £32 million). Trading gains of £25 million arising on commodity swaps/optionswere included in 1997 income (1996: losses of £7 million).
Group companies also enter into forward sales and purchasecontracts for commodities which may be settled by the physicaldelivery or receipt of the commodity. These contracts are notincluded in the above amounts.
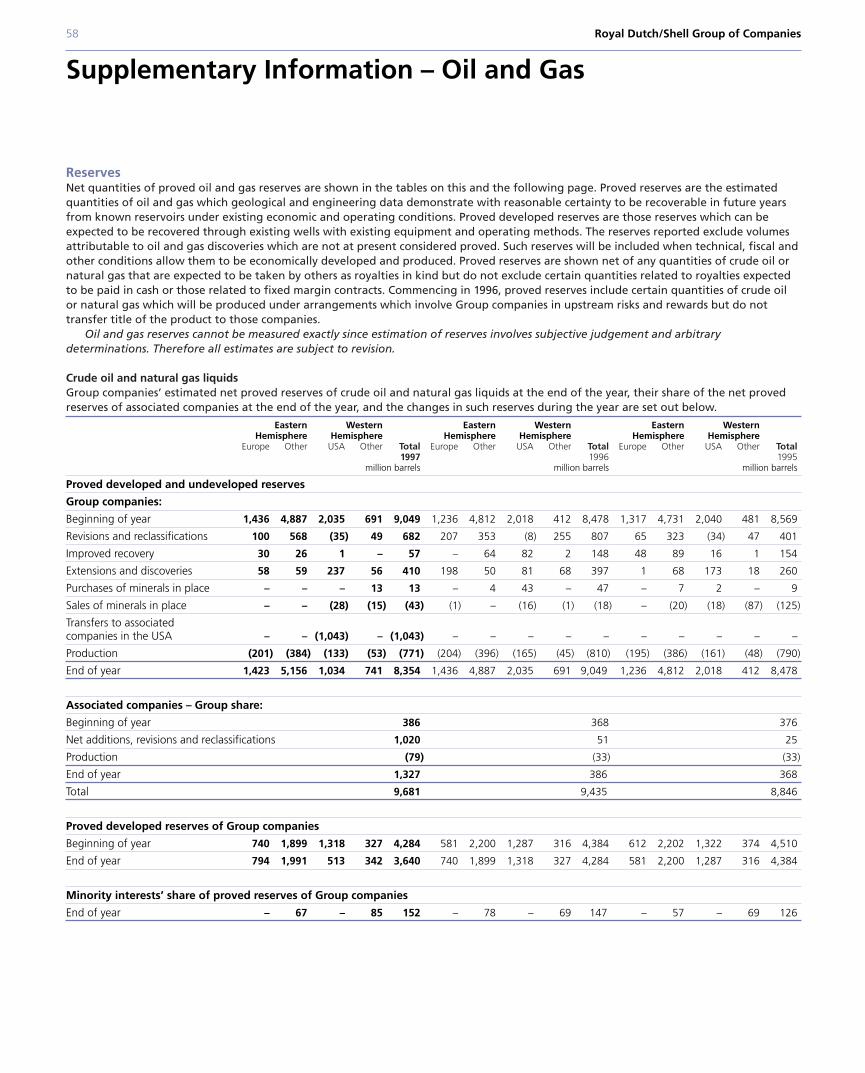
ReservesNet quantities of proved oil and gas reserves are shown in the tables on this and the following page. Proved reserves are the estimatedquantities of oil and gas which geological and engineering data demonstrate with reasonable certainty to be recoverable in future yearsfrom known reservoirs under existing economic and operating conditions. Proved developed reserves are those reserves which can beexpected to be recovered through existing wells with existing equipment and operating methods. The reserves reported exclude volumesattributable to oil and gas discoveries which are not at present considered proved. Such reserves will be included when technical, fiscal andother conditions allow them to be economically developed and produced. Proved reserves are shown net of any quantities of crude oil ornatural gas that are expected to be taken by others as royalties in kind but do not exclude certain quantities related to royalties expectedto be paid in cash or those related to fixed margin contracts. Commencing in 1996, proved reserves include certain quantities of crude oilor natural gas which will be produced under arrangements which involve Group companies in upstream risks and rewards but do nottransfer title of the product to those companies.
Oil and gas reserves cannot be measured exactly since estimation of reserves involves subjective judgement and arbitrarydeterminations. Therefore all estimates are subject to revision.
Crude oil and natural gas liquidsGroup companies’ estimated net proved reserves of crude oil and natural gas liquids at the end of the year, their share of the net provedreserves of associated companies at the end of the year, and the changes in such reserves during the year are set out below.
Eastern Western Eastern Western Eastern WesternHemisphere Hemisphere Hemisphere Hemisphere Hemisphere Hemisphere
Europe Other USA Other Total Europe Other USA Other Total Europe Other USA Other Total1997 1996 1995
million barrels million barrels million barrels
Proved developed and undeveloped reserves
Group companies:
Beginning of year 1,436 4,887 2,035 691 9,049 1,236 4,812 2,018 412 8,478 1,317 4,731 2,040 481 8,569
Revisions and reclassifications 100 568 (35) 49 682 207 353 (8) 255 807 65 323 (34) 47 401
Improved recovery 30 26 1 – 57 – 64 82 2 148 48 89 16 1 154
Extensions and discoveries 58 59 237 56 410 198 50 81 68 397 1 68 173 18 260
Purchases of minerals in place – – – 13 13 – 4 43 – 47 – 7 2 – 9
Sales of minerals in place – – (28) (15) (43) (1) – (16) (1) (18) – (20) (18) (87) (125)
Transfers to associated companies in the USA – – (1,043) – (1,043) – – – – – – – – – –
Production (201) (384) (133) (53) (771) (204) (396) (165) (45) (810) (195) (386) (161) (48) (790)
End of year 1,423 5,156 1,034 741 8,354 1,436 4,887 2,035 691 9,049 1,236 4,812 2,018 412 8,478
Associated companies – Group share:
Beginning of year 386 368 376
Net additions, revisions and reclassifications 1,020 51 25
Production (79) (33) (33)
End of year 1,327 386 368
Total 9,681 9,435 8,846
Proved developed reserves of Group companies
Beginning of year 740 1,899 1,318 327 4,284 581 2,200 1,287 316 4,384 612 2,202 1,322 374 4,510
End of year 794 1,991 513 342 3,640 740 1,899 1,318 327 4,284 581 2,200 1,287 316 4,384
Minority interests’ share of proved reserves of Group companies
End of year – 67 – 85 152 – 78 – 69 147 – 57 – 69 126
58 Royal Dutch/Shell Group of Companies
Supplementary Information – Oil and Gas
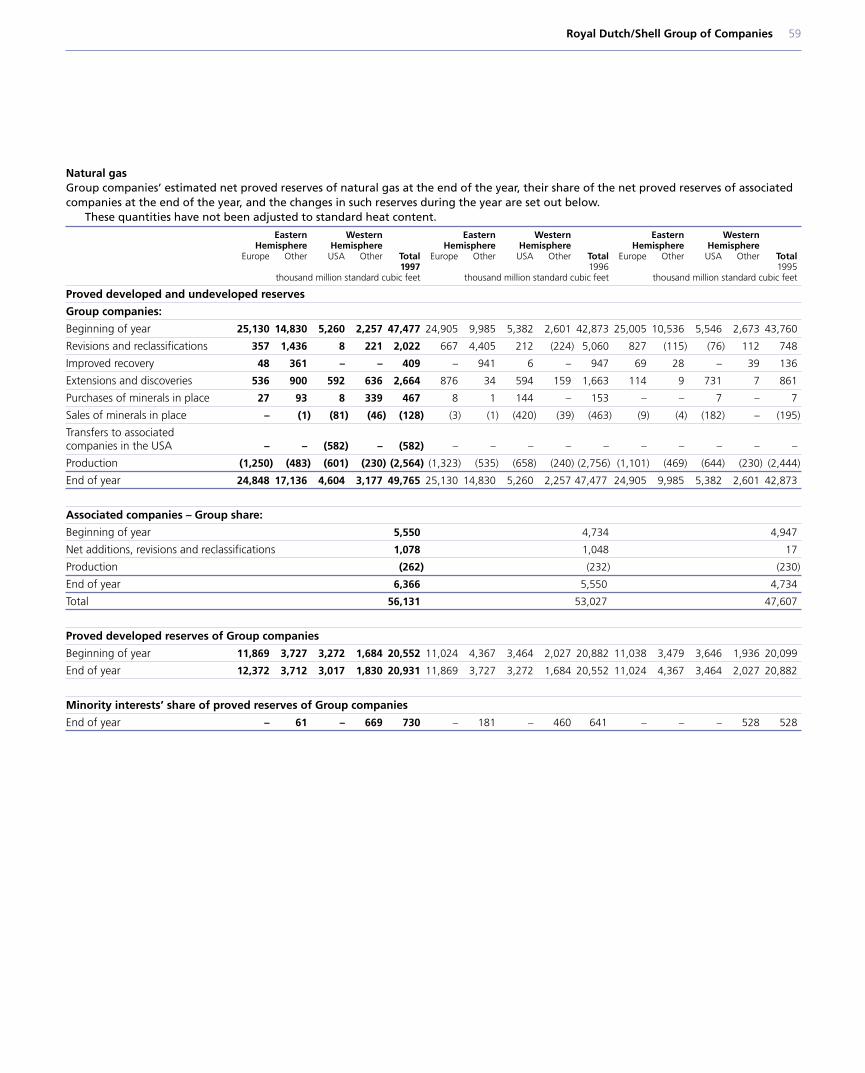
Royal Dutch/Shell Group of Companies 59
Natural gasGroup companies’ estimated net proved reserves of natural gas at the end of the year, their share of the net proved reserves of associatedcompanies at the end of the year, and the changes in such reserves during the year are set out below.
These quantities have not been adjusted to standard heat content.
Eastern Western Eastern Western Eastern WesternHemisphere Hemisphere Hemisphere Hemisphere Hemisphere Hemisphere
Europe Other USA Other Total Europe Other USA Other Total Europe Other USA Other Total1997 1996 1995
thousand million standard cubic feet thousand million standard cubic feet thousand million standard cubic feet
Proved developed and undeveloped reserves
Group companies:
Beginning of year 25,130 14,830 5,260 2,257 47,477 24,905 9,985 5,382 2,601 42,873 25,005 10,536 5,546 2,673 43,760
Revisions and reclassifications 357 1,436 8 221 2,022 667 4,405 212 (224) 5,060 827 (115) (76) 112 748
Improved recovery 48 361 – – 409 – 941 6 – 947 69 28 – 39 136
Extensions and discoveries 536 900 592 636 2,664 876 34 594 159 1,663 114 9 731 7 861
Purchases of minerals in place 27 93 8 339 467 8 1 144 – 153 – – 7 – 7
Sales of minerals in place – (1) (81) (46) (128) (3) (1) (420) (39) (463) (9) (4) (182) – (195)
Transfers to associated companies in the USA – – (582) – (582) – – – – – – – – – –
Production (1,250) (483) (601) (230) (2,564) (1,323) (535) (658) (240) (2,756) (1,101) (469) (644) (230) (2,444)
End of year 24,848 17,136 4,604 3,177 49,765 25,130 14,830 5,260 2,257 47,477 24,905 9,985 5,382 2,601 42,873
Associated companies – Group share:
Beginning of year 5,550 4,734 4,947
Net additions, revisions and reclassifications 1,078 1,048 17
Production (262) (232) (230)
End of year 6,366 5,550 4,734
Total 56,131 53,027 47,607
Proved developed reserves of Group companies
Beginning of year 11,869 3,727 3,272 1,684 20,552 11,024 4,367 3,464 2,027 20,882 11,038 3,479 3,646 1,936 20,099
End of year 12,372 3,712 3,017 1,830 20,931 11,869 3,727 3,272 1,684 20,552 11,024 4,367 3,464 2,027 20,882
Minority interests’ share of proved reserves of Group companies
End of year – 61 – 669 730 – 181 – 460 641 – – – 528 528
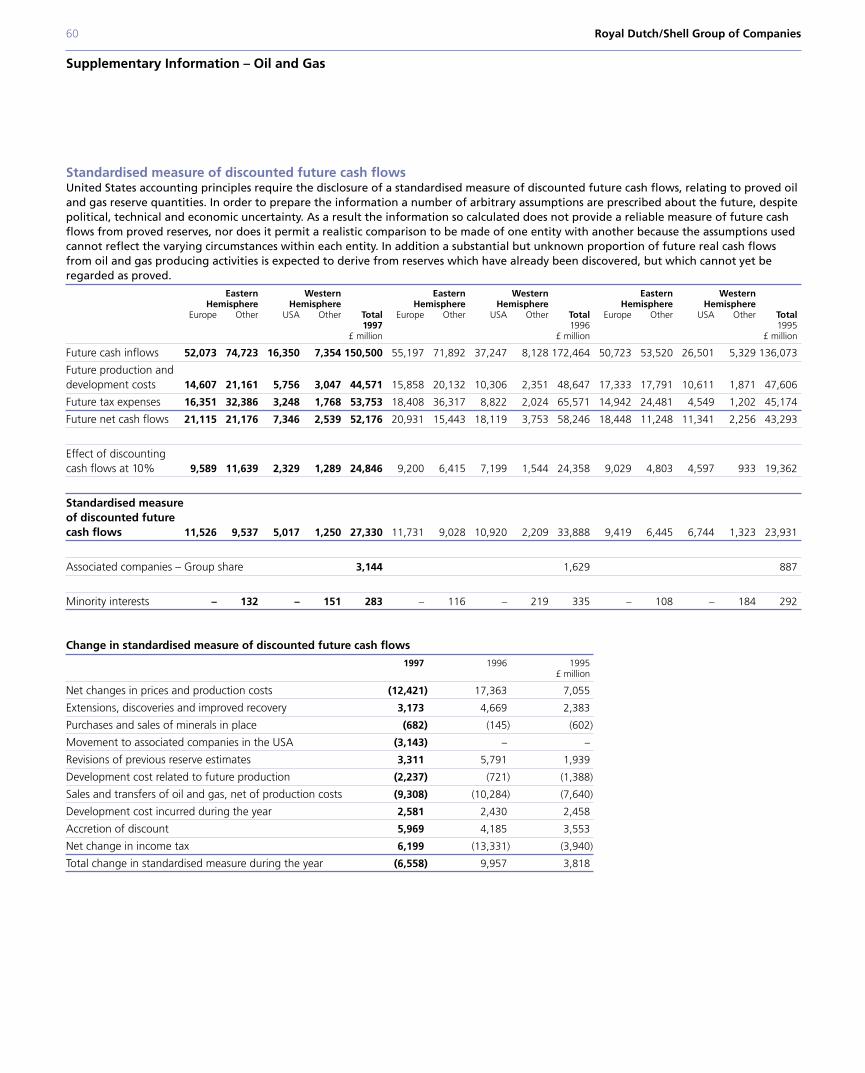
60 Royal Dutch/Shell Group of Companies
Supplementary Information – Oil and Gas
Standardised measure of discounted future cash flowsUnited States accounting principles require the disclosure of a standardised measure of discounted future cash flows, relating to proved oiland gas reserve quantities. In order to prepare the information a number of arbitrary assumptions are prescribed about the future, despitepolitical, technical and economic uncertainty. As a result the information so calculated does not provide a reliable measure of future cashflows from proved reserves, nor does it permit a realistic comparison to be made of one entity with another because the assumptions usedcannot reflect the varying circumstances within each entity. In addition a substantial but unknown proportion of future real cash flows from oil and gas producing activities is expected to derive from reserves which have already been discovered, but which cannot yet beregarded as proved.
Eastern Western Eastern Western Eastern WesternHemisphere Hemisphere Hemisphere Hemisphere Hemisphere Hemisphere
Europe Other USA Other Total Europe Other USA Other Total Europe Other USA Other Total1997 1996 1995
£ million £ million £ million
Future cash inflows 52,073 74,723 16,350 7,354 150,500 55,197 71,892 37,247 8,128 172,464 50,723 53,520 26,501 5,329 136,073
Future production anddevelopment costs 14,607 21,161 5,756 3,047 44,571 15,858 20,132 10,306 2,351 48,647 17,333 17,791 10,611 1,871 47,606
Future tax expenses 16,351 32,386 3,248 1,768 53,753 18,408 36,317 8,822 2,024 65,571 14,942 24,481 4,549 1,202 45,174
Future net cash flows 21,115 21,176 7,346 2,539 52,176 20,931 15,443 18,119 3,753 58,246 18,448 11,248 11,341 2,256 43,293
Effect of discounting cash flows at 10% 9,589 11,639 2,329 1,289 24,846 9,200 6,415 7,199 1,544 24,358 9,029 4,803 4,597 933 19,362
Standardised measure of discounted future cash flows 11,526 9,537 5,017 1,250 27,330 11,731 9,028 10,920 2,209 33,888 9,419 6,445 6,744 1,323 23,931
Associated companies – Group share 3,144 1,629 887
Minority interests – 132 – 151 283 – 116 – 219 335 – 108 – 184 292
Change in standardised measure of discounted future cash flows
1997 1996 1995£ million
Net changes in prices and production costs (12,421) 17,363 7,055
Extensions, discoveries and improved recovery 3,173 4,669 2,383
Purchases and sales of minerals in place (682) (145) (602)
Movement to associated companies in the USA (3,143) – –
Revisions of previous reserve estimates 3,311 5,791 1,939
Development cost related to future production (2,237) (721) (1,388)
Sales and transfers of oil and gas, net of production costs (9,308) (10,284) (7,640)
Development cost incurred during the year 2,581 2,430 2,458
Accretion of discount 5,969 4,185 3,553
Net change in income tax 6,199 (13,331) (3,940)
Total change in standardised measure during the year (6,558) 9,957 3,818
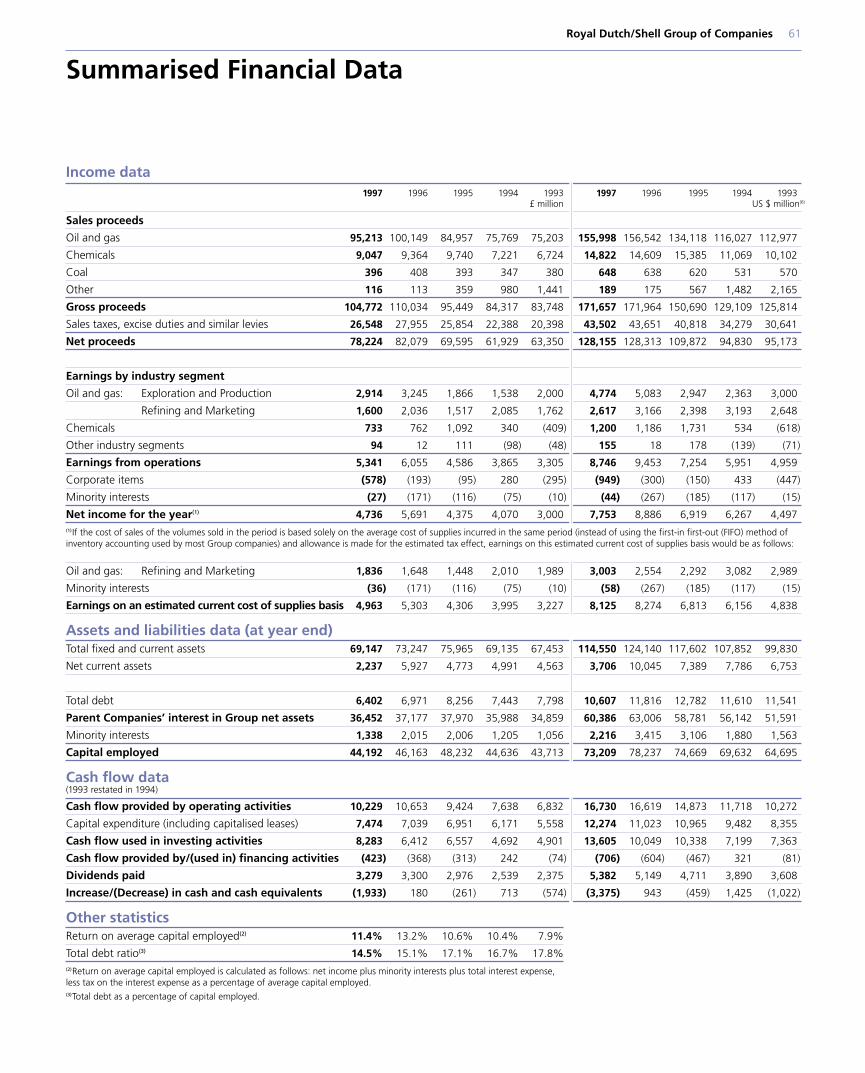
Income data1997 1996 1995 1994 1993 1997 1996 1995 1994 1993
£ million US $ million(6)
Sales proceeds
Oil and gas 95,213 100,149 84,957 75,769 75,203 155,998 156,542 134,118 116,027 112,977
Chemicals 9,047 9,364 9,740 7,221 6,724 14,822 14,609 15,385 11,069 10,102
Coal 396 408 393 347 380 648 638 620 531 570
Other 116 113 359 980 1,441 189 175 567 1,482 2,165
Gross proceeds 104,772 110,034 95,449 84,317 83,748 171,657 171,964 150,690 129,109 125,814
Sales taxes, excise duties and similar levies 26,548 27,955 25,854 22,388 20,398 43,502 43,651 40,818 34,279 30,641
Net proceeds 78,224 82,079 69,595 61,929 63,350 128,155 128,313 109,872 94,830 95,173
Earnings by industry segment
Oil and gas: Exploration and Production 2,914 3,245 1,866 1,538 2,000 4,774 5,083 2,947 2,363 3,000
Refining and Marketing 1,600 2,036 1,517 2,085 1,762 2,617 3,166 2,398 3,193 2,648
Chemicals 733 762 1,092 340 (409) 1,200 1,186 1,731 534 (618)
Other industry segments 94 12 111 (98) (48) 155 18 178 (139) (71)
Earnings from operations 5,341 6,055 4,586 3,865 3,305 8,746 9,453 7,254 5,951 4,959
Corporate items (578) (193) (95) 280 (295) (949) (300) (150) 433 (447)
Minority interests (27) (171) (116) (75) (10) (44) (267) (185) (117) (15)
Net income for the year(1) 4,736 5,691 4,375 4,070 3,000 7,753 8,886 6,919 6,267 4,497(1)If the cost of sales of the volumes sold in the period is based solely on the average cost of supplies incurred in the same period (instead of using the first-in first-out (FIFO) method ofinventory accounting used by most Group companies) and allowance is made for the estimated tax effect, earnings on this estimated current cost of supplies basis would be as follows:
Oil and gas: Refining and Marketing 1,836 1,648 1,448 2,010 1,989 3,003 2,554 2,292 3,082 2,989
Minority interests (36) (171) (116) (75) (10) (58) (267) (185) (117) (15)
Earnings on an estimated current cost of supplies basis 4,963 5,303 4,306 3,995 3,227 8,125 8,274 6,813 6,156 4,838
Assets and liabilities data (at year end)Total fixed and current assets 69,147 73,247 75,965 69,135 67,453 114,550 124,140 117,602 107,852 99,830
Net current assets 2,237 5,927 4,773 4,991 4,563 3,706 10,045 7,389 7,786 6,753
Total debt 6,402 6,971 8,256 7,443 7,798 10,607 11,816 12,782 11,610 11,541
Parent Companies’ interest in Group net assets 36,452 37,177 37,970 35,988 34,859 60,386 63,006 58,781 56,142 51,591
Minority interests 1,338 2,015 2,006 1,205 1,056 2,216 3,415 3,106 1,880 1,563
Capital employed 44,192 46,163 48,232 44,636 43,713 73,209 78,237 74,669 69,632 64,695
Cash flow data(1993 restated in 1994)
Cash flow provided by operating activities 10,229 10,653 9,424 7,638 6,832 16,730 16,619 14,873 11,718 10,272
Capital expenditure (including capitalised leases) 7,474 7,039 6,951 6,171 5,558 12,274 11,023 10,965 9,482 8,355
Cash flow used in investing activities 8,283 6,412 6,557 4,692 4,901 13,605 10,049 10,338 7,199 7,363
Cash flow provided by/(used in) financing activities (423) (368) (313) 242 (74) (706) (604) (467) 321 (81)
Dividends paid 3,279 3,300 2,976 2,539 2,375 5,382 5,149 4,711 3,890 3,608
Increase/(Decrease) in cash and cash equivalents (1,933) 180 (261) 713 (574) (3,375) 943 (459) 1,425 (1,022)
Other statisticsReturn on average capital employed(2) 11.4% 13.2% 10.6% 10.4% 7.9%
Total debt ratio(3) 14.5% 15.1% 17.1% 16.7% 17.8%(2)Return on average capital employed is calculated as follows: net income plus minority interests plus total interest expense,less tax on the interest expense as a percentage of average capital employed.(3)Total debt as a percentage of capital employed.
Royal Dutch/Shell Group of Companies 61
Summarised Financial Data
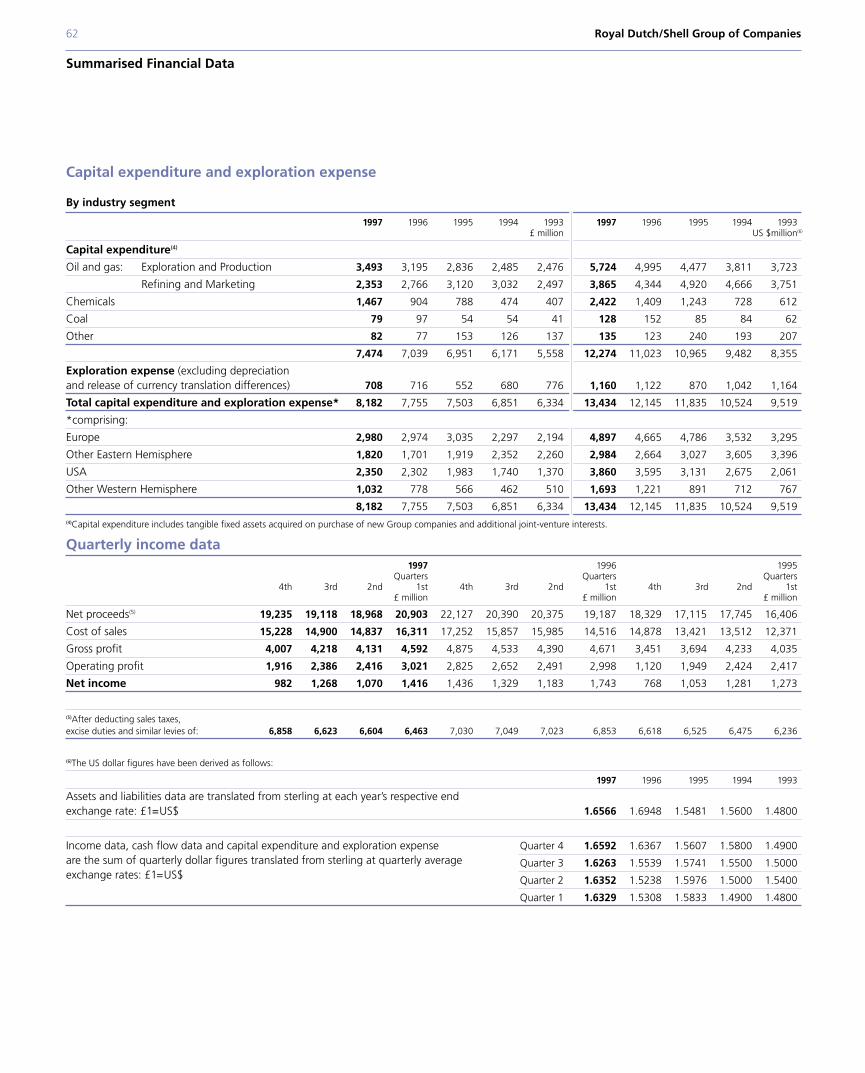
62 Royal Dutch/Shell Group of Companies
Summarised Financial Data
Capital expenditure and exploration expense
By industry segment
1997 1996 1995 1994 1993 1997 1996 1995 1994 1993£ million US $million(6)
Capital expenditure(4)
Oil and gas: Exploration and Production 3,493 3,195 2,836 2,485 2,476 5,724 4,995 4,477 3,811 3,723
Refining and Marketing 2,353 2,766 3,120 3,032 2,497 3,865 4,344 4,920 4,666 3,751
Chemicals 1,467 904 788 474 407 2,422 1,409 1,243 728 612
Coal 79 97 54 54 41 128 152 85 84 62
Other 82 77 153 126 137 135 123 240 193 207
7,474 7,039 6,951 6,171 5,558 12,274 11,023 10,965 9,482 8,355
Exploration expense (excluding depreciation and release of currency translation differences) 708 716 552 680 776 1,160 1,122 870 1,042 1,164
Total capital expenditure and exploration expense* 8,182 7,755 7,503 6,851 6,334 13,434 12,145 11,835 10,524 9,519
*comprising:
Europe 2,980 2,974 3,035 2,297 2,194 4,897 4,665 4,786 3,532 3,295
Other Eastern Hemisphere 1,820 1,701 1,919 2,352 2,260 2,984 2,664 3,027 3,605 3,396
USA 2,350 2,302 1,983 1,740 1,370 3,860 3,595 3,131 2,675 2,061
Other Western Hemisphere 1,032 778 566 462 510 1,693 1,221 891 712 767
8,182 7,755 7,503 6,851 6,334 13,434 12,145 11,835 10,524 9,519(4)Capital expenditure includes tangible fixed assets acquired on purchase of new Group companies and additional joint-venture interests.
Quarterly income data1997 1996 1995
Quarters Quarters Quarters4th 3rd 2nd 1st 4th 3rd 2nd 1st 4th 3rd 2nd 1st
£ million £ million £ million
Net proceeds(5) 19,235 19,118 18,968 20,903 22,127 20,390 20,375 19,187 18,329 17,115 17,745 16,406
Cost of sales 15,228 14,900 14,837 16,311 17,252 15,857 15,985 14,516 14,878 13,421 13,512 12,371
Gross profit 4,007 4,218 4,131 4,592 4,875 4,533 4,390 4,671 3,451 3,694 4,233 4,035
Operating profit 1,916 2,386 2,416 3,021 2,825 2,652 2,491 2,998 1,120 1,949 2,424 2,417
Net income 982 1,268 1,070 1,416 1,436 1,329 1,183 1,743 768 1,053 1,281 1,273
(5)After deducting sales taxes, excise duties and similar levies of: 6,858 6,623 6,604 6,463 7,030 7,049 7,023 6,853 6,618 6,525 6,475 6,236
(6)The US dollar figures have been derived as follows:
1997 1996 1995 1994 1993
Assets and liabilities data are translated from sterling at each year’s respective end exchange rate: £1=US$ 1.6566 1.6948 1.5481 1.5600 1.4800
Income data, cash flow data and capital expenditure and exploration expense Quarter 4 1.6592 1.6367 1.5607 1.5800 1.4900are the sum of quarterly dollar figures translated from sterling at quarterly average Quarter 3 1.6263 1.5539 1.5741 1.5500 1.5000exchange rates: £1=US$ Quarter 2 1.6352 1.5238 1.5976 1.5000 1.5400
Quarter 1 1.6329 1.5308 1.5833 1.4900 1.4800
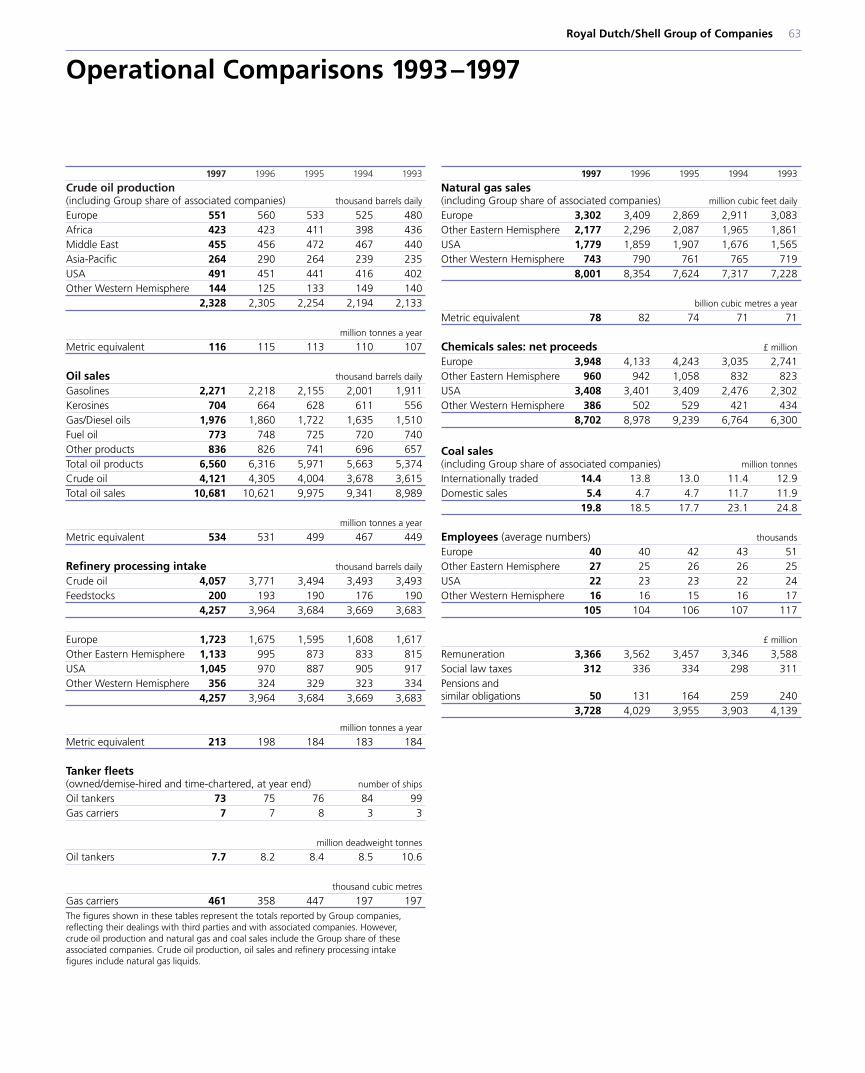
Royal Dutch/Shell Group of Companies 63
Operational Comparisons 1993–1997
1997 1996 1995 1994 1993
Crude oil production(including Group share of associated companies) thousand barrels daily
Europe 551 560 533 525 480Africa 423 423 411 398 436Middle East 455 456 472 467 440Asia-Pacific 264 290 264 239 235USA 491 451 441 416 402Other Western Hemisphere 144 125 133 149 140
2,328 2,305 2,254 2,194 2,133
million tonnes a year
Metric equivalent 116 115 113 110 107
Oil sales thousand barrels daily
Gasolines 2,271 2,218 2,155 2,001 1,911Kerosines 704 664 628 611 556Gas/Diesel oils 1,976 1,860 1,722 1,635 1,510Fuel oil 773 748 725 720 740Other products 836 826 741 696 657Total oil products 6,560 6,316 5,971 5,663 5,374Crude oil 4,121 4,305 4,004 3,678 3,615Total oil sales 10,681 10,621 9,975 9,341 8,989
million tonnes a year
Metric equivalent 534 531 499 467 449
Refinery processing intake thousand barrels daily
Crude oil 4,057 3,771 3,494 3,493 3,493Feedstocks 200 193 190 176 190
4,257 3,964 3,684 3,669 3,683
Europe 1,723 1,675 1,595 1,608 1,617Other Eastern Hemisphere 1,133 995 873 833 815USA 1,045 970 887 905 917Other Western Hemisphere 356 324 329 323 334
4,257 3,964 3,684 3,669 3,683
million tonnes a year
Metric equivalent 213 198 184 183 184
Tanker fleets(owned/demise-hired and time-chartered, at year end) number of ships
Oil tankers 73 75 76 84 99Gas carriers 7 7 8 3 3
million deadweight tonnes
Oil tankers 7.7 8.2 8.4 8.5 10.6
thousand cubic metres
Gas carriers 461 358 447 197 197The figures shown in these tables represent the totals reported by Group companies,reflecting their dealings with third parties and with associated companies. However,crude oil production and natural gas and coal sales include the Group share of theseassociated companies. Crude oil production, oil sales and refinery processing intakefigures include natural gas liquids.
1997 1996 1995 1994 1993
Natural gas sales(including Group share of associated companies) million cubic feet daily
Europe 3,302 3,409 2,869 2,911 3,083Other Eastern Hemisphere 2,177 2,296 2,087 1,965 1,861USA 1,779 1,859 1,907 1,676 1,565Other Western Hemisphere 743 790 761 765 719
8,001 8,354 7,624 7,317 7,228
billion cubic metres a year
Metric equivalent 78 82 74 71 71
Chemicals sales: net proceeds £ million
Europe 3,948 4,133 4,243 3,035 2,741Other Eastern Hemisphere 960 942 1,058 832 823USA 3,408 3,401 3,409 2,476 2,302Other Western Hemisphere 386 502 529 421 434
8,702 8,978 9,239 6,764 6,300
Coal sales(including Group share of associated companies) million tonnes
Internationally traded 14.4 13.8 13.0 11.4 12.9Domestic sales 5.4 4.7 4.7 11.7 11.9
19.8 18.5 17.7 23.1 24.8
Employees (average numbers) thousands
Europe 40 40 42 43 51Other Eastern Hemisphere 27 25 26 26 25USA 22 23 23 22 24Other Western Hemisphere 16 16 15 16 17
105 104 106 107 117
£ million
Remuneration 3,366 3,562 3,457 3,346 3,588Social law taxes 312 336 334 298 311Pensions and similar obligations 50 131 164 259 240
3,728 4,029 3,955 3,903 4,139
PublicationsFinancial and Operational InformationFive years’ detailed financial and statistical information about the Group, including maps of exploration and production activities.
The Shell ReportReview of how Group companies are meeting their responsibilities and the expectations of society in relation to various economic,environmental and social issues.
Investment in Society ReportInformation about the Group’s social investment programmes, which aim to support the development of local communities and play a role in helping to address major national and international social issues.
Health, Safety and Environment ReportFacts about Group companies’ performance in the areas of health, safety and the environment. It also discusses Group views on pertinentissues related to those areas.
Statement of General Business PrinciplesFundamental principles that govern how each Shell company conducts its affairs. (Last revised 1997.)
The above publications, as well as copies of the Parent Companies’ Annual Reports, can be obtained from any of the following addresses:
64 Royal Dutch/Shell Group of Companies
Published Group Information
Shell International LimitedSLBPA DivisionShell CentreLondon SE1 7NAUK
Telephone: +44-(0)171-934 5293Fax: +44-(0)171-934 5555
Shell International B.V.FHK DivisionPO Box 1622501 AN The HagueThe Netherlands
Telephone: +31-(0)70-377 4540Fax: +31-(0)70-377 3115
Shell Oil CompanyGSDF Division712 Fifth Avenue – 26th floorNew York, NY 10019-4102USA
Telephone: +1-212-261 5660Fax: +1-212-261 5663
World Wide Web
This Annual Report, all published Group information as listed above, and other information about the Royal Dutch/Shell Group of Companiescan be accessed at the above World Wide Web address.
The paper used in this Report is made from a base pulp extracted from the timber of sustainably managed forests and bleached with oxygen. It has also been awardedthe Nordic Swan environmental label for low emissions during manufacture. The manufacturer is accredited with ISO 9002 Quality Assurance and is working to the ISO 14001 standard for Environmental Management Systems.
http://www.shell.com
Designed by CGITypeset by Real Time StudioReproduced by Wace Corporate ImagingPrinted in England by Wace Corporate Print, Poole
Cover photography by Murray Alcosser; other photography by Ric Gemmell, Colin Whyman, Michael Harding, Francisco Dallmeier, Custódio Coimbra and others.
Royal Dutch Petroleum CompanyN.V. Koninklijke Nederlandsche Petroleum Maatschappij
Annual Report 1997
Royal Dutch PetroleumCompany
Contents
Royal Dutch/Shell Groupof Companies
Contents
Royal Dutch Petroleum Company (Royal
Dutch) has no operations of its own and
virtually the whole of its income derives
from its 60% interest in the companies
known collectively as the Royal Dutch/Shell
Group of Companies; the other 40% is
owned by The 2 Transport and
Trading Company, p.l.c. (Shell Transport),
an English company. Royal Dutch is a
Parent Company of the Group, but is not
itself part of the Group.
The Royal Dutch/Shell Group of Companies
has grown out of an alliance made in 1907
between Royal Dutch Petroleum Company
and The 2 Transport and Trading
Company, p.l.c., by which the two companies
agreed to merge their interests on a 60:40
basis while keeping their separate identities.
Today, Shell companies are engaged in oil,
natural gas, chemicals, renewable resources
and other businesses throughout the world.
2 President’s Foreword
4 Financial Highlights
5 Supervisory Board
5 Board of Management
6 To the Shareholders
8 Annual Report
8 Annual Accounts
13 Other Information
14 Report of the Auditors
15 The Boards of the Parent Companies
16 Group Managing Directors and PrincipalExecutives of the Service Companies
17 Achievements
17 Countries of Operations
18 Exploration and Production
20 Oil Products
22 Chemicals
24 Downstream Gas and Power Generation
24 Renewable Resources
26 Discussion and Analysis of FinancialCondition and Results of Operations
26 Summary
28 Earnings by Industry Segment Oil and Gas: Exploration and Production
30 Earnings by Industry Segment Oil and Gas: Refining and Marketing
32 Earnings by Industry SegmentChemicals
33 Earnings by Industry SegmentOther Industry Segments andCorporate Items
34 Liquidity and Capital Resources
35 Other Matters
37 Report of the Auditors
37 Contents of Group Financial Statementsand Operational Data
38 Financial Statements
41 Notes to Financial Statements
58 Supplementary Information – Oil and Gas
58 Reserves
60 Standardised measure of discounted future cash flows
61 Summarised Financial Data
63 Operational Comparisons 1993–1997
64 Published Group Information
The companies in which Royal Dutch Petroleum Company and The 2 Transport and Trading Company, p.l.c. directly or indirectly own investmentsare separate and distinct entities, but in this Report the collective expressions ‘Shell’, ‘Group’ and ‘Royal Dutch/Shell Group of Companies’ are sometimesused for convenience in contexts where reference is made to the companies of the Royal Dutch/Shell Group in general. Those expressions are also usedwhere no useful purpose is served by identifying the particular company or companies.
Throughout this Report, a billion = 1,000 million.
Financial CalendarFinancial year ends December 31, 1997
AnnouncementsFull year results for 1997 February 12, 1998First quarter results: 1998 May 7, 1998*Second quarter results: 1998 August 6, 1998*Third quarter results: 1998 November 5, 1998*
Dividends – The Hague Register and Bearer shares1997 Final: – Proposed dividend announced February 12, 1998
– Record date May 8, 1998– Ex-dividend date May 11, 1998– Payment date May 19, 1998
1998 Interim: – Announced September 10, 1998*– Record date September 11, 1998*– Ex-dividend date September 14, 1998*– Payment date September 22, 1998*
Dividends – New York Register1997 Final: – Proposed dividend announced February 12, 1998
– Ex-dividend date May 11, 1998– Record date May 13, 1998– Payment date May 28, 1998
1998 Interim: – Announced September 10, 1998*– Ex-dividend date September 14, 1998*– Record date September 16, 1998*– Payment date September 30, 1998*
Report and Annual AccountsPublication April 3, 1998
General Meeting of Shareholders May 8, 1998* The dates shown are provisional and subject to final confirmation.
Investor Relations OfficesInvestor relations offices in The Hague, London and New York will be pleasedto answer questions and supply copies of the original Dutch Report as well as further copies of the English translation. Copies of other publications (e.g. Quarterly Results Announcements or the Annual Report on Form 20-Ffiled with the US Securities and Exchange Commission) can also be obtainedfrom these offices.
The HagueShell International B.V.FHK DivisionPO Box 1622501 AN The HagueThe NetherlandsTelephone: +31-70-377 4540 Fax: +31-70-377 3115
LondonShell International LimitedGroup Investor RelationsFTC Division, Shell CentreLondon SE1 7NAUnited KingdomTelephone: +44-171-934 3856 Fax: +44-171-934 3702
New YorkShell Oil CompanyGSDF Division712 Fifth Avenue – 26th FloorNew York, NY 10019 – 4102USATelephone: +1-212-261 5660 Fax: +1-212-261 5663
The Hague Register of ShareholdersRoyal Dutch shareholders registered in the Hague Register with inquiriesabout share ownership, changes of address or payment of dividends maycontact:N.V. Algemeen Nederlands Trustkantoor ANTPO Box 110631001 GB AmsterdamThe NetherlandsTelephone: +31-20-623 6991 Fax: +31-20-638 2516
Stockholder Information for USARoyal Dutch stockholders in the USA with inquiries about stock ownership,changes of address or payment of dividends may contact:Stock Transfer and Paying AgentJ P Morgan Service CenterPO Box 8205Boston, MA 02266-8205Telephone: +1-800-556 8639 (USA only); +1-781-575 4328 (international) Fax: +1-781-575 4082

Ro
yal Du
tch Petro
leum
Co
mp
any N
.V. Koninklijke N
ederlandsche Petroleum M
aatschappij An
nu
al Rep
ort 1997