thermal sunyaev-zel'dovich effect from high redshift (z...
TRANSCRIPT

Thermal Sunyaev-Zel’dovich effect from high redshift (z > 2) structures
Loïc Verdier
CEA Saclay
March 2016
Loïc Verdier Thermal Sunyaev-Zel’dovich effect from high redshift (z > 2) structures 1 / 17

Thermal Sunyaev-Zel’dovich effect from high redshift (z > 2) structures
Loïc Verdier
CEA Saclay
March 2016
Based on : Loïc Verdier, Jean-Baptiste Melin, James G. Bartlett, Christophe Magneville,Nathalie Palanque-Delabrouille and Christophe Yèche, 2016, A&A, 588, A61
Loïc Verdier Thermal Sunyaev-Zel’dovich effect from high redshift (z > 2) structures 2 / 17

Table of contents
1 An overview of the hot gas detection at high redshift
2 A significant signal at QSO positions
3 Low-frequency tSZ extraction
4 Evidence for a tSZ signal for z>2 quasars
5 Conclusion
Loïc Verdier Thermal Sunyaev-Zel’dovich effect from high redshift (z > 2) structures 2 / 17

An overview of the hot gas detection at high redshift
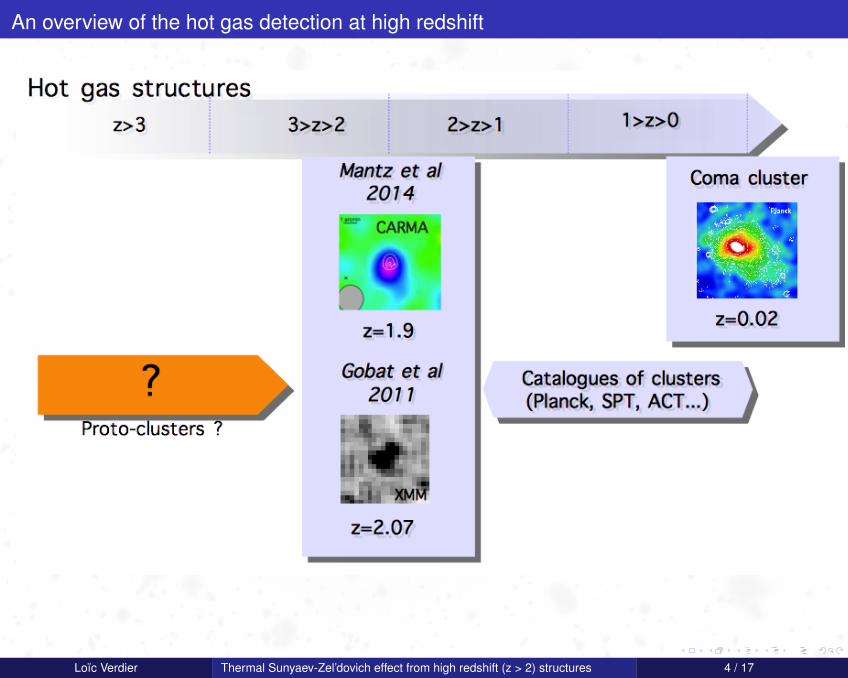
Detection of galaxy clusters/hot gas structures?
Loïc Verdier Thermal Sunyaev-Zel’dovich effect from high redshift (z > 2) structures 3 / 17

An overview of the hot gas detection at high redshift
Loïc Verdier Thermal Sunyaev-Zel’dovich effect from high redshift (z > 2) structures 3 / 17

An overview of the hot gas detection at high redshift
Loïc Verdier Thermal Sunyaev-Zel’dovich effect from high redshift (z > 2) structures 4 / 17

An overview of the hot gas detection at high redshift
Loïc Verdier Thermal Sunyaev-Zel’dovich effect from high redshift (z > 2) structures 4 / 17
An overview of the hot gas detection at high redshift
Loïc Verdier Thermal Sunyaev-Zel’dovich effect from high redshift (z > 2) structures 4 / 17

An overview of the hot gas detection at high redshift
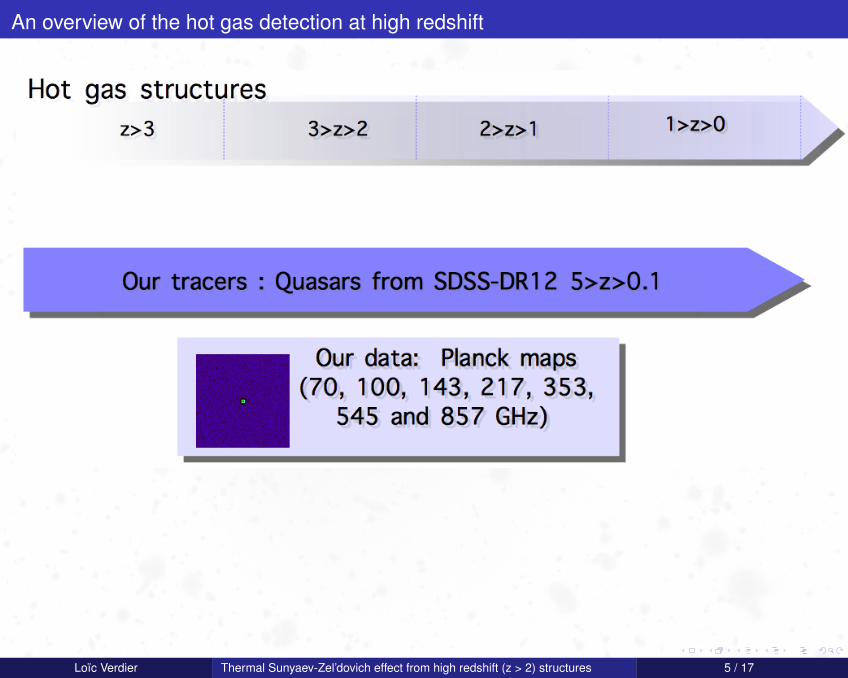
Detection of hot gas structures at high redshift? Millimeter maps + independent tracers.
Loïc Verdier Thermal Sunyaev-Zel’dovich effect from high redshift (z > 2) structures 5 / 17

An overview of the hot gas detection at high redshift
Loïc Verdier Thermal Sunyaev-Zel’dovich effect from high redshift (z > 2) structures 5 / 17
An overview of the hot gas detection at high redshift
Loïc Verdier Thermal Sunyaev-Zel’dovich effect from high redshift (z > 2) structures 5 / 17
Table of contents
1 An overview of the hot gas detection at high redshift
2 A significant signal at QSO positions
3 Low-frequency tSZ extraction
4 Evidence for a tSZ signal for z>2 quasars
5 Conclusion
Loïc Verdier Thermal Sunyaev-Zel’dovich effect from high redshift (z > 2) structures 5 / 17

A significant signal at QSO positions
Find a signal (1)
First step: what is the nature of the signal at QSO positions?
• Extract a flux at the position of the QSOs with a matched filter.
• To increase the signal-to-noise, work with the average flux for a given sample ofQSOs.
Loïc Verdier Thermal Sunyaev-Zel’dovich effect from high redshift (z > 2) structures 6 / 17
A significant signal at QSO positions
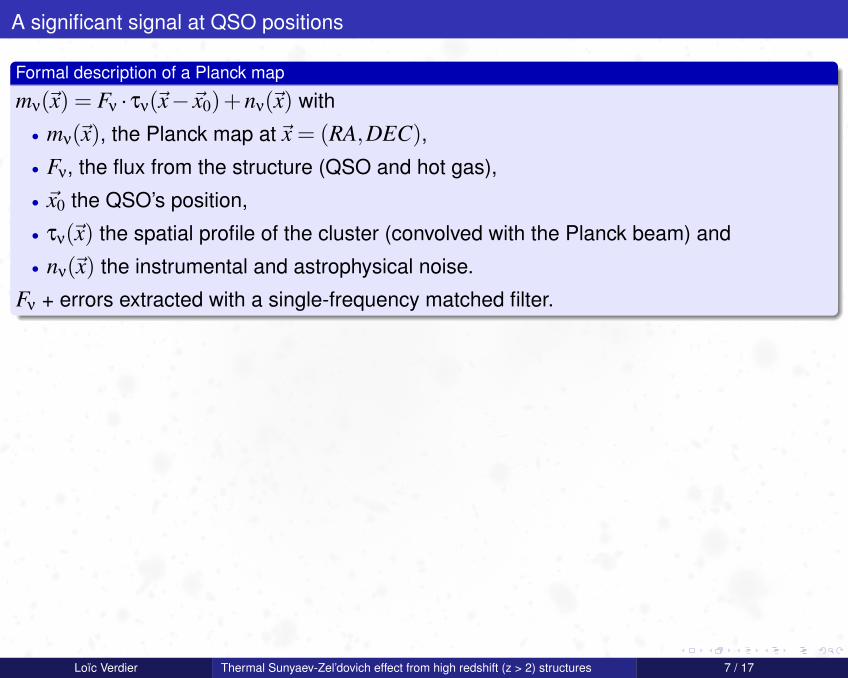
Formal description of a Planck map
mν(~x) = Fν · τν(~x−~x0)+nν(~x) with
• mν(~x), the Planck map at~x = (RA,DEC),
• Fν, the flux from the structure (QSO and hot gas),
• ~x0 the QSO’s position,
• τν(~x) the spatial profile of the cluster (convolved with the Planck beam) and
• nν(~x) the instrumental and astrophysical noise.
Fν + errors extracted with a single-frequency matched filter.
Loïc Verdier Thermal Sunyaev-Zel’dovich effect from high redshift (z > 2) structures 7 / 17

A significant signal at QSO positions
Average flux
Average filtered maps centered on QSO positions. Size of the maps: 10◦×10◦.
Average filtered map at 70 GHz Average filtered map at 100 GHz Average filtered map at 143 GHz Average filtered map at 217 GHz
Average filtered map at 353 GHz Average filtered map at 545 GHz Average filtered map at 857 GHz
Loïc Verdier Thermal Sunyaev-Zel’dovich effect from high redshift (z > 2) structures 8 / 17

A significant signal at QSO positions
Loïc Verdier Thermal Sunyaev-Zel’dovich effect from high redshift (z > 2) structures 9 / 17

A significant signal at QSO positions
Loïc Verdier Thermal Sunyaev-Zel’dovich effect from high redshift (z > 2) structures 9 / 17

Table of contents
1 An overview of the hot gas detection at high redshift
2 A significant signal at QSO positions
3 Low-frequency tSZ extraction
4 Evidence for a tSZ signal for z>2 quasars
5 Conclusion
Loïc Verdier Thermal Sunyaev-Zel’dovich effect from high redshift (z > 2) structures 9 / 17

Low-frequency tSZ extraction
Find a signal (1) [DONE]
First step: what is the nature of the signal at QSO positions?
• Extract a flux at the position of the QSOs with a matched filter.
• To increase the signal-to-noise, work with the average flux for a given sample ofQSOs.
Find a signal (2)
Second step: assume the tSZ is the dominant signal and extract its amplitude.
• Frequencies kept for the analysis: 100 GHz and 143 GHz (where tSZ is negative anddust emission is weaker).
• Assume Fν = y ·SZ(ν)
• Y500 = y ·E−2/3(z) ·(
DA(z)2
500Mpc
)= f (Mgas)
Loïc Verdier Thermal Sunyaev-Zel’dovich effect from high redshift (z > 2) structures 10 / 17

Low-frequency tSZ extraction
Loïc Verdier Thermal Sunyaev-Zel’dovich effect from high redshift (z > 2) structures 11 / 17

Low-frequency tSZ extraction
Loïc Verdier Thermal Sunyaev-Zel’dovich effect from high redshift (z > 2) structures 12 / 17

Low-frequency tSZ extraction
Higher frequencies required
• No significant tSZ signal detected.
• Need leverage at high frequency for removing dust.
Loïc Verdier Thermal Sunyaev-Zel’dovich effect from high redshift (z > 2) structures 12 / 17

Table of contents
1 An overview of the hot gas detection at high redshift
2 A significant signal at QSO positions
3 Low-frequency tSZ extraction
4 Evidence for a tSZ signal for z>2 quasars
5 Conclusion
Loïc Verdier Thermal Sunyaev-Zel’dovich effect from high redshift (z > 2) structures 12 / 17

Evidence for a tSZ signal for z>2 quasars
Find a signal (1) [DONE]
First step: what is the nature of the signal at QSO positions?
• Extract a flux at the position of the QSOs with a matched filter.
• To increase the signal-to-noise, work with the average flux for a given sample ofQSOs.
Find a signal (2) [DONE]
Second step: assume the tSZ is the dominant signal and extract its amplitude.
• Frequencies kept for the analysis: 100 GHz and 143 GHz (where tSZ is negative anddust emission is weaker).
• Assume Fν = y ·SZ(ν)
• Y500 = y ·E−2/3(z) ·(
DA(z)2
500Mpc
)= f (Mgas)
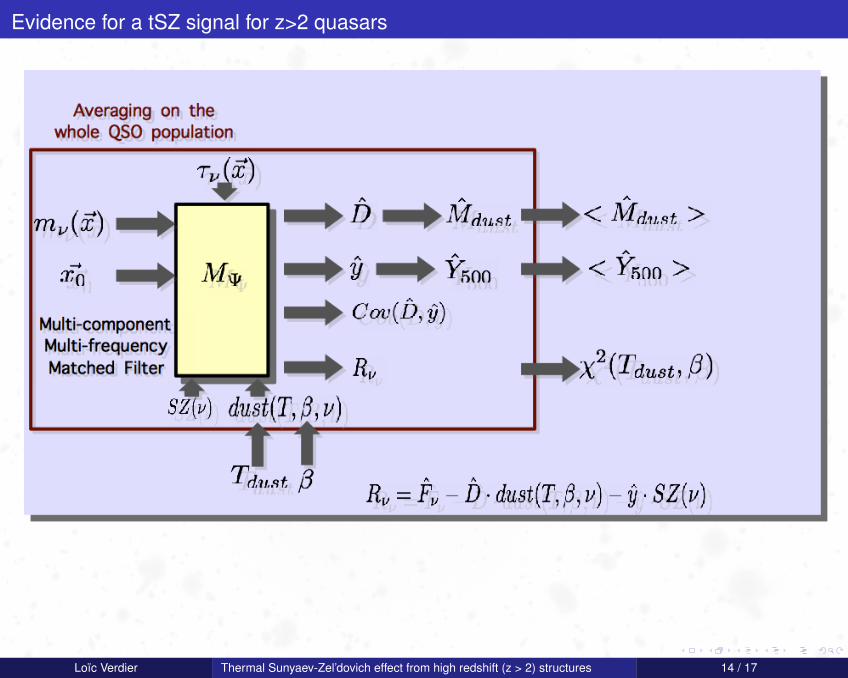
Find a signal (3)
Third step: extract the dominant component of the signal, the dust emission and thesub-dominant tSZ signal.
• Assume Fν = D ·dust(Tdust,β,ν)+ y ·SZ(ν) with dust(Tdust,β,ν) = νβ ·Bν(Tdust).
• Mdust = f (Tdust,β,D,z) (Beelen et al 2006)
Loïc Verdier Thermal Sunyaev-Zel’dovich effect from high redshift (z > 2) structures 13 / 17
Evidence for a tSZ signal for z>2 quasars
Loïc Verdier Thermal Sunyaev-Zel’dovich effect from high redshift (z > 2) structures 14 / 17

Evidence for a tSZ signal for z>2 quasars
Loïc Verdier Thermal Sunyaev-Zel’dovich effect from high redshift (z > 2) structures 14 / 17

Evidence for a tSZ signal for z>2 quasars
Loïc Verdier Thermal Sunyaev-Zel’dovich effect from high redshift (z > 2) structures 14 / 17

Evidence for a tSZ signal for z>2 quasars
Loïc Verdier Thermal Sunyaev-Zel’dovich effect from high redshift (z > 2) structures 15 / 17
Evidence for a tSZ signal for z>2 quasars
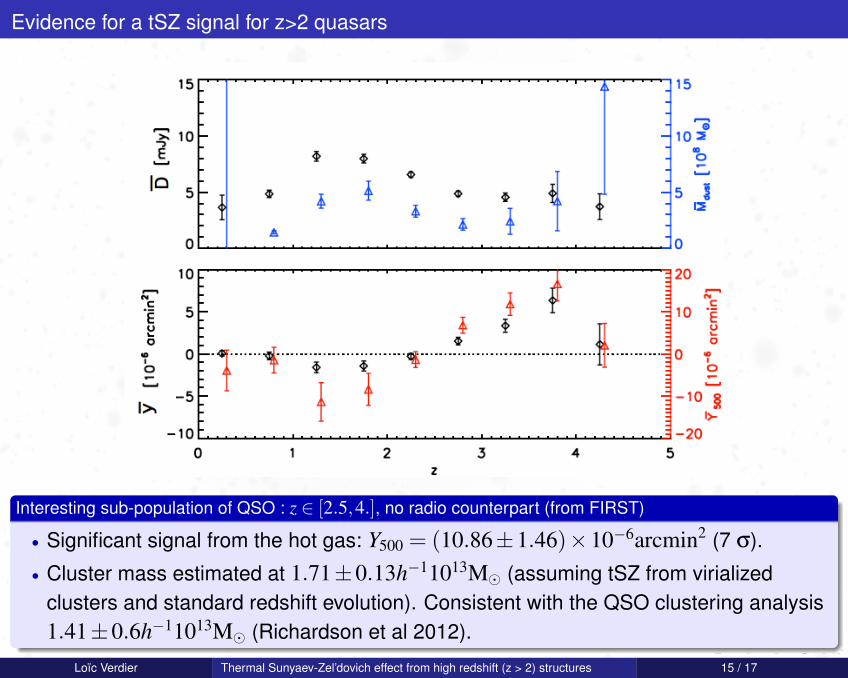
Interesting sub-population of QSO : z ∈ [2.5,4.], no radio counterpart (from FIRST)
• Significant signal from the hot gas: Y500 = (10.86±1.46)×10−6arcmin2 (7 σ).
• Cluster mass estimated at 1.71±0.13h−11013M� (assuming tSZ from virializedclusters and standard redshift evolution). Consistent with the QSO clustering analysis1.41±0.6h−11013M� (Richardson et al 2012).
Loïc Verdier Thermal Sunyaev-Zel’dovich effect from high redshift (z > 2) structures 15 / 17

Table of contents
1 An overview of the hot gas detection at high redshift
2 A significant signal at QSO positions
3 Low-frequency tSZ extraction
4 Evidence for a tSZ signal for z>2 quasars
5 Conclusion
Loïc Verdier Thermal Sunyaev-Zel’dovich effect from high redshift (z > 2) structures 15 / 17

Conclusion
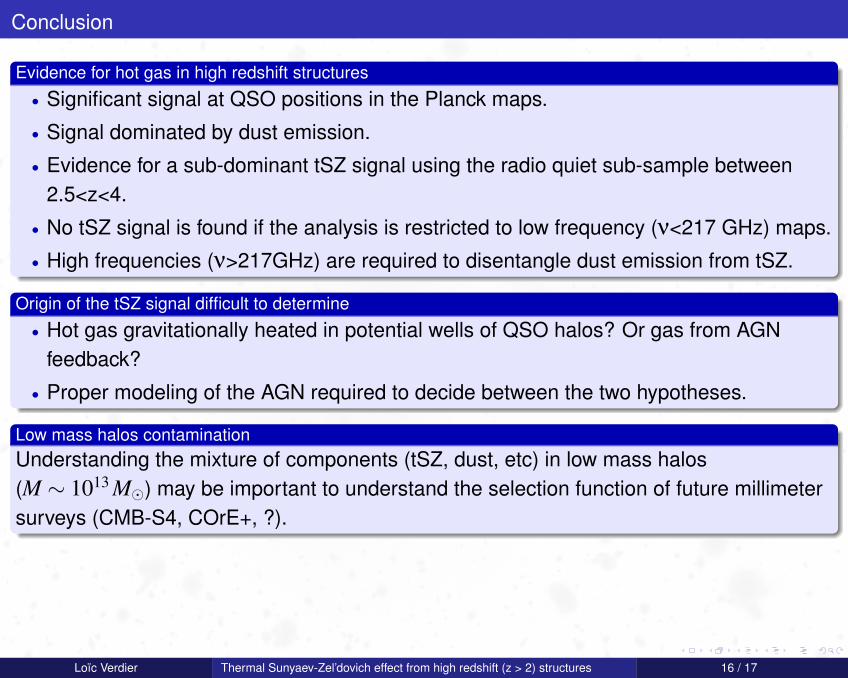
Evidence for hot gas in high redshift structures
• Significant signal at QSO positions in the Planck maps.
• Signal dominated by dust emission.
• Evidence for a sub-dominant tSZ signal using the radio quiet sub-sample between2.5<z<4.
• No tSZ signal is found if the analysis is restricted to low frequency (ν<217 GHz) maps.
• High frequencies (ν>217GHz) are required to disentangle dust emission from tSZ.
Loïc Verdier Thermal Sunyaev-Zel’dovich effect from high redshift (z > 2) structures 16 / 17

Conclusion
Evidence for hot gas in high redshift structures
• Significant signal at QSO positions in the Planck maps.
• Signal dominated by dust emission.
• Evidence for a sub-dominant tSZ signal using the radio quiet sub-sample between2.5<z<4.
• No tSZ signal is found if the analysis is restricted to low frequency (ν<217 GHz) maps.
• High frequencies (ν>217GHz) are required to disentangle dust emission from tSZ.
Origin of the tSZ signal difficult to determine
• Hot gas gravitationally heated in potential wells of QSO halos? Or gas from AGNfeedback?
• Proper modeling of the AGN required to decide between the two hypotheses.
Loïc Verdier Thermal Sunyaev-Zel’dovich effect from high redshift (z > 2) structures 16 / 17
Conclusion
Evidence for hot gas in high redshift structures
• Significant signal at QSO positions in the Planck maps.
• Signal dominated by dust emission.
• Evidence for a sub-dominant tSZ signal using the radio quiet sub-sample between2.5<z<4.
• No tSZ signal is found if the analysis is restricted to low frequency (ν<217 GHz) maps.
• High frequencies (ν>217GHz) are required to disentangle dust emission from tSZ.
Origin of the tSZ signal difficult to determine
• Hot gas gravitationally heated in potential wells of QSO halos? Or gas from AGNfeedback?
• Proper modeling of the AGN required to decide between the two hypotheses.
Low mass halos contaminationUnderstanding the mixture of components (tSZ, dust, etc) in low mass halos(M ∼ 1013 M�) may be important to understand the selection function of future millimetersurveys (CMB-S4, COrE+, ?).
Loïc Verdier Thermal Sunyaev-Zel’dovich effect from high redshift (z > 2) structures 16 / 17
Thanks for your attention!
Loïc Verdier Thermal Sunyaev-Zel’dovich effect from high redshift (z > 2) structures 17 / 17