dark matter searches at cms -...
TRANSCRIPT

Dark Matter Searches at CMS
Adish VartakUniversity of California San Diego

Dark MatterExistence of dark matter known through its gravitational interactions
2
Weak lensing CMBGalactic rotation
Underlying nature of dark matter (DM) remains unknown
There is a well established case for weakly interacting DM particles (WIMPs)Such particles may be produced in high energy p-p collisions at LHC!!

DM Signature at CMS• How do we detect DM at CMS ?
• DM particles leave no trace in the detector
• But they may create a transverse momentum imbalance in the event (MET)
• To produce significant MET, DM particles must recoil against some boosted object “X”
• X is typically some form of ISR Gluon (jet), photon, W, Z .. “Mono-X” or MET+X signatures
3
(X)
DMDM
Jet, photon, …
p p
DM pair recoils against a visible high pT object
Substantial MET
Monojet Mono-photon

Monojet Search
4
Event selection
• Large MET (200 GeV or more) Driven by trigger thresholds
• At least one high pT, central jet (pT > 100 GeV, |η| < 2.4)
• Vetos to remove fake MET events from instrumental noise, non-collision bkg
• Vetos on events with leptons, ɣ or b-jets Kills backgrounds with genuine MET Ensures signal region is orthogonal to
other DM final states
pTjet = 1.26 TeV
ETmiss = 1.28 TeV
Large signal cross-sectionTypically the most sensitive final state

Monojet Analysis Overview
5
• Main backgrounds
Z(νν)+jets (~ 60%)
W(lν)+jets where lepton is lost (~30%)
Minor bkg : Top, dibosons, etc.
• Signal Extraction
Fit the MET spectrum in data to look for an excess in the tails
Need precise estimation of the MET shape of electroweak backgrounds
Achieved by using multiple control regions in data : Z(μμ)+jets, Z(ee)+jets, W(μν)+jets, W(eν)+jets, ɣ+jets
Background uncertainty constrained at ~15% at MET of 1 TeV
Signal has a harder MET spectrumcompared to the background
11
has an uncertainty of 20% [73, 74]. These uncertainties in the top quark and diboson back-291
grounds are correlated across the signal and control samples. Several experimental sources of292
uncertainty are associated with the backgrounds estimated from simulation. An uncertainty of293
6.2% in the integrated luminosity measurement [75] is propagated to the background yields.294
The uncertainty in the efficiency of the b-jet veto is estimated to be 6% for the top quark back-295
ground and 2% for the diboson background. The uncertainty in the efficiency of the V tagging296
requirements is estimated to be 13% in the mono-V category. The uncertainty in the modeling297
of EmissT in simulation [76] is dominated by the jet energy scale uncertainty, and is estimated to298
be 5%.299
6 Results and interpretation300
Figure 6 shows the EmissT distributions in the monojet and mono-V signal regions. The back-301
ground prediction is obtained from a combined fit in all the control samples, excluding the302
signal region. Data are found to be in agreement with the SM prediction. Tables 1 and 2 show
Even
ts /
GeV
2−10
1−10
1
10
210
310
410
510 Data
)+jetsννZ(
)+jetsνW(l
WW/ZZ/WZ
Top quark
+jetsγZ(ll)+jets,
QCD
= 125 GeVH
Higgs Invisible, m
= 1.6 TeVmedAxial-vector, m
(13 TeV)-112.9 fb
CMSmonojet
Dat
a / P
red.
0.5
1
1.5
[GeV]missTE
200 400 600 800 1000 1200
pred
σ(D
ata-
Pred
.)
2−02
Even
ts /
GeV
2−10
1−10
1
10
210
310
41012.9 fb-1 (13 TeV)
CMSmono-V
Data
)+jetsννZ(
)+jetsνW(l
WW/WZ/ZZ
Top quark
+jetsγ(ll), γZ/
QCD
= 125 GeVH
Higgs invisible, m
= 1.6 TeVmedAxial-vector, m
Dat
a / P
red.
0.5
1
1.5
[GeV]missTE
300 400 500 600 700 800 900 1000
pred
σ(D
ata-
Pred
.)
2−02
Figure 6: Observed EmissT distribution in the monojet (left) and mono-V (right) signal regions
compared with the background expectations for various SM processes evaluated after perform-ing a combined fit to the data in all the control samples, but excluding the signal region. Thelast bin includes all events with Emiss
T > 1160 (750) GeV for the monojet (mono-V) category.Expected signal distributions for a 125 GeV Higgs boson decaying exclusively to invisible par-ticles, and for a 1.6 TeV axial-vector mediator decaying to 1 GeV DM particles, are overlaid.The ratio of data and the post-fit background prediction is shown for both the monojet andmono-V signal regions. The gray bands in these ratio plots indicate the post-fit uncertaintyin the background prediction. Finally, the distributions of the pulls, defined as the differencebetween data and the post-fit background prediction relative to the post-fit uncertainty in theprediction, are also shown in the lower panels.
303
EXO-16-037arXiv:1703.01651

Interpretation : Simplified Models
6
From
ene
rgy
scal
ing
to lu
min
osity
sca
ling
– A
few
Tho
ught
s O
. Buc
hmue
ller
25 25
Example of a bottom-up approach
gq’ gDMgq
Mmed
mq’
Generic Lagrangian & width
q’, DM
q’, DM
q
q
Adding a decay width for DM to oursimple Lagrangian!
• Results interpreted in a generic framework of ‘simplified models’• These are benchmarks that capture certain characteristic features of
DM signal at LHC • Assume one pair of fermionic DM, and a massive boson that
mediates the interaction between DM and SM quarks
• Five parameters of the model : Spin/parity of the mediator Mediator mass (Mmed) DM mass (mDM) Mediator coupling to quarks (gq) Mediator coupling to DM (gDM)

Limits For Axial Vector Mediator
7EXO-16-037
Observed Exclusion
mMED : upto 2 TeV
Constraints from relic density
14 6 Results and interpretation
on the combined cross section due to the monojet and mono-V signal processes. In the case331
of the pseudoscalar mediator, limits are computed assuming only the monojet signal process.332
The mono-V signal process (Fig. 2, right), in which a pseudoscalar mediator couples directly333
to vector bosons, is ill-defined without making additional assumptions [82] and therefore is334
not included. Figure 8 shows the exclusion contours in the mmed–mDM plane for the vector and335
axial-vector mediators. Mediator masses up to 1.95 TeV and DM masses up to 750 and 550 GeV336
are excluded for the vector and axial-vector models, respectively, at 95% CL. Figure 9 shows337
the exclusion contours in the mmed–mDM plane for the scalar and pseudoscalar mediators. For338
scalar mediators, masses up to 100 GeV and DM masses up to 35 GeV are excluded at 95% CL,339
and no exclusion is expected or observed considering only the monojet signal process. Pseu-340
doscalar mediator masses up to 430 GeV and DM masses up to 170 GeV are excluded at 95%341
CL. Figure 10 shows the limits for the spin-0 models as a function of the mediator mass, as-342
suming the DM mass to be 1 GeV. In the case of the scalar mediator limits are computed for the343
monojet signal process, and for the combination of the monojet and mono-V signal processes.344
Figure 8: Exclusion limits at 95% CL on the signal strength µ = s/sth in the mmed–mDM planeassuming vector (left) and axial-vector (right) mediators. The limits are shown for mmed be-tween 150 GeV and 2.5 TeV, and mDM between 50 GeV and 1.2 TeV. While the excluded area isexpected to extend below these minimum values of mmed and mDM, the axes do not extend be-low these values as the signal simulation was not performed in this region. The solid (dotted)red (blue) line shows the contour for the observed (expected) exclusion. The solid contoursaround the observed limit and the dashed contours around the expected limit represent onestandard deviation theoretical uncertainties in the signal cross section and the combination ofthe statistical and experimental systematic uncertainties, respectively. Constraints from thePlanck satellite experiment [83] are shown with the dark green contours and associated hatch-ing. The hatched area indicates the region where the DM density exceeds the observed value.
Figures 8 and 9 also show the constraints from the observed cosmological relic density of DM345
as determined from measurements of the cosmic microwave background by the Planck satellite346
experiment [83]. The expected DM abundance is estimated using the thermal freeze-out mech-347
anism implemented in the MADDM [84] package, and compared to the observed cold DM348
density Wch2 = 0.12 [85], where Wc is the DM relic abundance and h is the Hubble constant,349
under the assumption that a single DM particle describes DM interactions in the early uni-350
verse and that this particle only interacts with SM particles through the considered simplified351
model [86].352
The limits obtained using the simplified DM models may be compared to the results from direct353
Excluded RegionOff-s
hell, Not E
xcluded
Results for vector mediator are similar

Mono-Z(ℓℓ) & Mono-ɣ SearchesTarget DM signal produced is association with ɣ or a Z
8
• Select events with Z(ee), Z(μμ) events
• At least 100 GeV MET in the event
• Main bkg : Z(νν)Z(ℓℓ), W(ℓν)Z(ℓℓ)
• Perform a binned fit to the MET spectrum
Mono-Z : EXO-16-038• Select events with a ɣ (pT > 175 GeV)
• At least 170 GeV MET in the event
• Main bkg : Z(νν)ɣ, W(ℓν)ɣ
• Cut-based analysis to extract signal
7
Table 1: Summary of estimated backgrounds and observed total number of candidates. Sys-tematic and statistical uncertainties on the background estimates are added in quadrature.
Process EstimateZ(! nn) + g 215 ± 32W(! `n) + g 57.2 ± 8.0Electron misidentification 52.7 ± 4.2ECAL spikes 8.5 ± 6.7Beam halo 5.5+9.3
5.5g + jets 10.1 ± 5.7W ! µn 8.5 ± 3.0tt g 8.2 ± 0.6Jet misidentification 5.9 ± 1.7W ! tn 5.2 ± 2.3WZ 3.5 ± 1.7Z(! ``) + g 2.9 ± 0.2Z Z 1.3 ± 0.7WWg 0.7 ± 0.1Total background 385.6 ± 35.4Data 400
200 400 600 800 1000
Even
ts/G
eV
-310
-210
-110
1
10
210
(13 TeV)-112.9 fbCMS
γ), ttντ, W(γ), Z(ll)νµ+jet, W(γ γWZ, ZZ, WWBeam-halo Spikes
MisIDγ →jet MisIDγ →electronγν l→γW γνν →γZ
Bkg. uncertainty ADD, MD=2TeV, n=5=50GeVDM=200GeV, mmedDM AV, M Data
[GeV]γ
Tp
200 300 400 500 600 700 800 900 1000
Dat
a/SM
01234
200 400 600 800 1000
Even
ts/G
eV
-310
-210
-110
1
10
210
(13 TeV)-112.9 fbCMS
γ), ttντ, W(γ), Z(ll)νµ+jet, W(γ γWZ, ZZ, WWBeam-halo Spikes
MisIDγ →jet MisIDγ →electronγν l→γW γνν →γZ
Bkg. uncertainty ADD, MD=2TeV, n=5=50GeVDM=200GeV, mmedDM AV, M Data
[GeV]γ
Tp
200 300 400 500 600 700 800 900 1000
Data
/SM
01234
(a) Photon pT
200 400 600 800 1000
Even
ts/G
eV
-310
-210
-110
1
10
210
(13 TeV)-112.9 fbCMS
γ), ttντ, W(γ), Z(ll)νµ+jet, W(γ γWZ, ZZ, WWBeam halo Spikes
MisIDγ →jet MisIDγ →electronγν l→γW γνν →γZ
Bkg. uncertainty ADD, MD=2TeV, n=5=50GeVDM=200GeV, mmedDM AV, M Data
[GeV]TE200 300 400 500 600 700 800 900 1000
Dat
a/SM
0123
(b) Particle Flow EmissT
Figure 2: The pgT and Emiss
T distribution for the candidate sample, compared with estimatedcontributions from SM backgrounds. Background uncertainty includes statistical and system-atic error. The last bin includes the overflow. The bottom panel shows the ratio of data and SMbackground predictions, where the uncertainty band shows the systematic error.
Mono-ɣ : EXO-16-039
9.2 Limit on invisible Higgs boson decays 9
Figure 1: Left: Distribution of the EmissT after the full selection except that 50 GeV < Emiss
T < 100GeV. Right: The Emiss
T in the signal region. The error bars represent statistical uncertainty, andthe shaded bands represent systematic uncertainty. The histogram stack correspond to the sumof all background predictions, the dots are the data, the red line is the prediction for the Z(``)H(mH = 125 GeV) signal, and the dashed green line is the prediction for the DM signal for thesimplified model with vector mediator with (mc, MV) = (150, 500) GeV. The DM signal yieldis multiplied by a factor three.
Figure 2: The 95% CL observed limits on signal strength sobs/sth in both vector (left) and axial-vector (right) coupling scenario, for coupling gq = 0.25. The expected exclusion curves forunity signal strength are shown as a reference.

Mono-Z(ℓℓ) & Mono-ɣ SearchesTarget DM signal produced is association with ɣ or a Z
9
• Select events with Z(ee), Z(μμ) events
• At least 100 GeV MET in the event
• Main bkg : Z(νν)Z(ℓℓ), W(ℓν)Z(ℓℓ)
• Perform a binned fit to the MET spectrum
• Select events with a ɣ (pT > 175 GeV)
• At least 170 GeV MET in the event
• Main bkg : Z(νν)ɣ, W(ℓν)ɣ
• Cut-based analysis to extract signal
2 Figure
[GeV]MedM0 200 400 600 800 1000 1200 1400 1600 1800 2000
[GeV
]D
Mm
0
100
200
300
400
500
600
700 Observed exclusion 95% CL
[EXO-16-037] qqDM + j/V
[EXO-16-039] γDM +
[EXO-16-038] llDM + Z
0.12≥ 2
hcΩ
Preliminary CMS ICHEP 2016 Dark Matter Summary
Observed exclusion 95% CL
[EXO-16-037] qqDM + j/V
[EXO-16-039] γDM +
[EXO-16-038] llDM + Z
= 1DM
= 0.25, gqgAxial-vector mediator, Dirac DM
Preliminary CMS ICHEP 2016 Dark Matter Summary
[GeV]MedM0 200 400 600 800 1000 1200 1400 1600 1800 2000
[GeV
]D
Mm
0
100
200
300
400
500
600
700Observed exclusion 95% CL
[EXO-16-037] qq
DM + j/V
[EXO-16-039] γDM +
[EXO-16-038] llDM + Z
[EXO-16-040]DM + t (100% FC)
0.12≥ 2 hcΩ
Preliminary CMS ICHEP 2016 Dark Matter Summary
Observed exclusion 95% CL
[EXO-16-037] qq
DM + j/V
[EXO-16-039] γDM +
[EXO-16-038] llDM + Z
[EXO-16-040]DM + t (100% FC)
= 1DM
= 0.25, gqgVector mediator, Dirac DM
Preliminary CMS ICHEP 2016 Dark Matter Summary
Figure 2. 95% CL exclusion regions in Mmed mDM plane for di↵erent /ET based DM searchesfrom CMS in the lepto-phobic AV and V models. It should be noted that the exclusion regions andrelic density contours in this plot are not applicable to other choices of coupling values or models.
3 Figure
[GeV]DMm10 210 310
]2 [c
mSDσ
45−10
44−10
43−10
42−10
41−10
40−10
39−10
38−10
37−10
36−10
35−10ICHEP 2016
[EXO-16-038] llCMS DM+Z
[EXO-16-039] γCMS DM+
[EXO-16-037] qqCMS DM+j/V
Pico 2L
Pico 60
-τ+τSuper-K
-τ+τIceCube
ICHEP 2016
Preliminary CMS
= 1DM
= 0.25, gqgAxial-vector med., Dirac DM observed exclusion 90% CLCMS
[EXO-16-037]qq
CMS DM+j/V
[EXO-16-039]γCMS DM+
[EXO-16-038]llCMS DM+Z
observed exclusion 90% CLDD/ID
[arXiv:1601.03729]Pico 2L
[arXiv:1510.07754]Pico 60
[arXiv:1503.04858]-τ+τSuper-K
[arXiv:1601.00653]-τ+τIceCube
Figure 3. A comparison of CMS results to the mDM–SD plane. Unlike in the mass-mass plane, thelimits are shown at 90% CL. The CMS contour in the SD plane is for an Axial Vector mediator,Dirac DM and couplings gq = 0.25 and gDM = 1. The SD exclusion contour is compared withlimits from the PICO experiments, the IceCube limit for the tt annihilation channel and the Super-Kamiokande limit for the bb annihilation channel. It should be noted that the CMS limits do notinclude a constraint on the relic density and also the absolute exclusion of the di↵erent CMS searchesas well as their relative importance will strongly depend on the chosen coupling and model scenario.Therefore, the shown CMS exclusion regions in this plot are not applicable to other choices ofcoupling values or models.
– 2 –
Mono-Z : EXO-16-038 Mono-ɣ : EXO-16-039
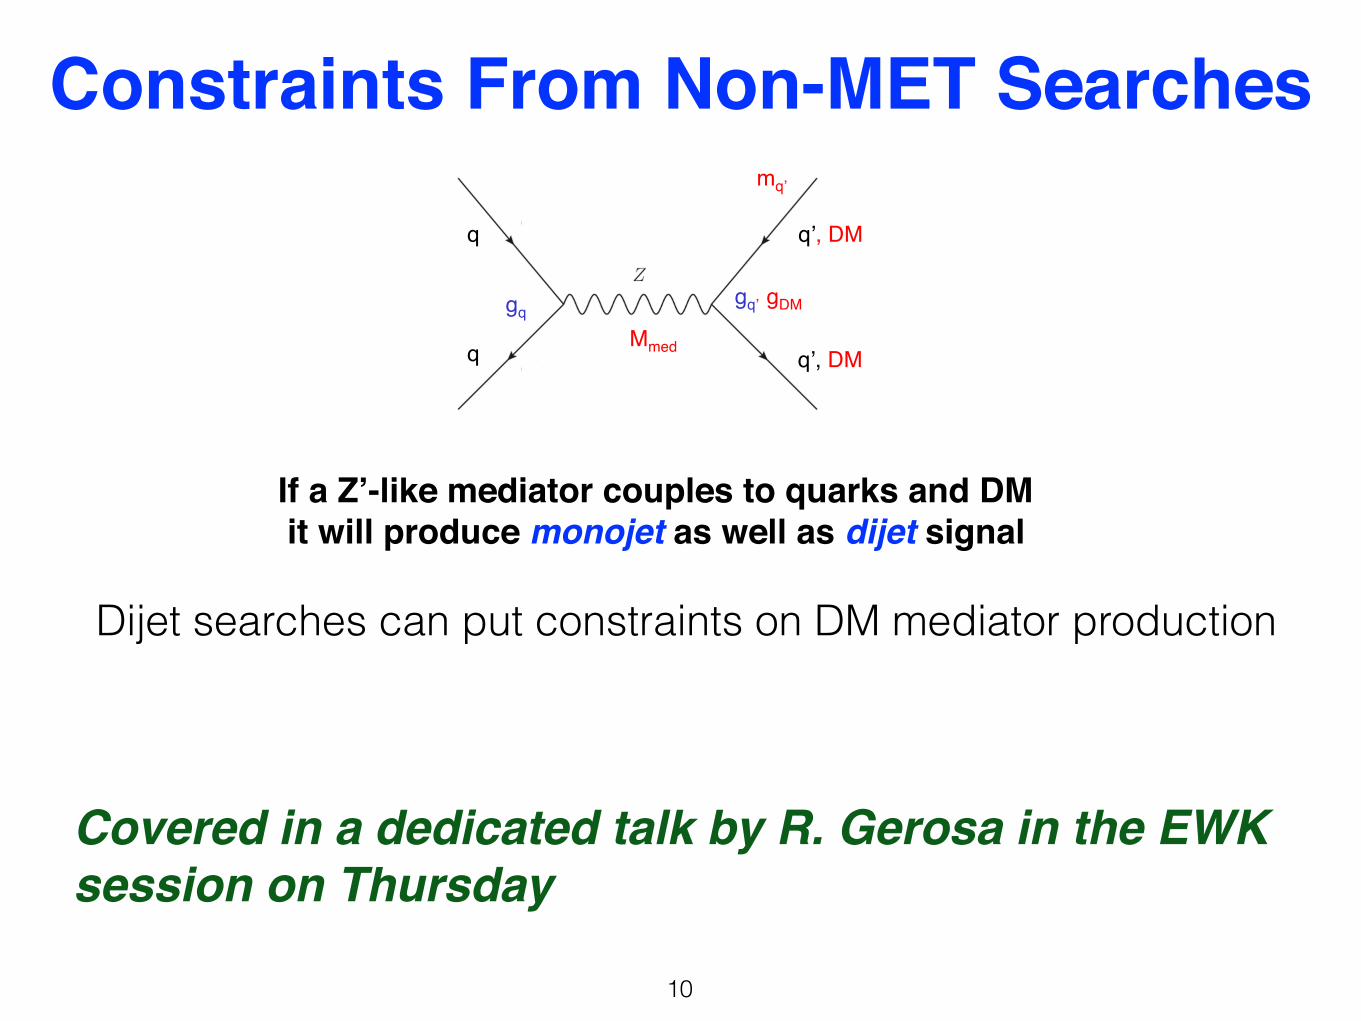
Constraints From Non-MET Searches
10
From
ene
rgy
scal
ing
to lu
min
osity
sca
ling
– A
few
Tho
ught
s O
. Buc
hmue
ller
25 25
Example of a bottom-up approach
gq’ gDMgq
Mmed
mq’
Generic Lagrangian & width
q’, DM
q’, DM
q
q
Adding a decay width for DM to oursimple Lagrangian!
Dijet searches can put constraints on DM mediator production
If a Z’-like mediator couples to quarks and DM it will produce monojet as well as dijet signal
Covered in a dedicated talk by R. Gerosa in the EWK session on Thursday

Spin-0 Mediators• Also consider DM interactions mediated by scalar and pseudoscalar
particles
• Require the interaction between spin-0 mediator and quarks to have the SM Yukawa structure (Minimal Flavor Violation)
• Coupling to quarks proportional to the quark mass (like the SM Higgs boson)
• Mediator couples preferentially to the top quark
1
1 Introduction1
Astrophysical observations provide strong indirect evidence for the existence of particle dark2
matter (DM), and therefore of physics beyond the standard model (BSM). In a large class of3
BSM models, DM is considered to consist of long-lived, weakly interacting massive particles4
(WIMPs). At collider experiments, WIMP particles (c) may be pair-produced through the ex-5
change of new mediating particles that couple both to DM and to standard model (SM) par-6
ticles. Once produced, DM particles escape the experiments without interacting, creating an7
imbalance of transverse momentum (pmissT ).8
Mediator interactions inherit the Yukawa structure of the SM if the new physics associated9
with DM obeys the principle of Minimal Flavour Violation (MFV) [1, 2]. The MFV hypothesis is10
strongly motivated by the apparent lack of new flavor physics at the electroweak scale. Because11
only the top quark Yukawa is of O(1), WIMP DM preferentially couples to the heavy top quark12
in such scenarios. The top-mediator coupling gives rise to tt+ cc at tree-level (Figure 1), and to13
the production of so-called “mono-X” final states (eg: monojet) through a top quark loop [3–7].14
At the LHC, the tt+cc tree-level process can be directly probed via the tt+pmissT and bb+ pmiss
T15
signatures [8, 9]. The bb + pmissT signature provides additional sensitivity to processes in which16
mediator couplings to up-type quarks are suppressed, as is the case in Type-II Two-Higgs-17
Doublet models (2HDM) at large tanb [10].18
Figure 1: Leading order Feynman diagram describing the production of DM particles (c) inassociation with heavy flavor (top or bottom) quarks through scalar (F) and pseudoscalar (a)mediators.
This article describes a search for DM produced in association with tt/bb atp
s = 13 TeV with19
the CMS experiment at the CERN Large Hadron Collider (LHC). A potential DM signal is ex-20
tracted from simultaneous shape fits to the pmissT distributions in the bb + pmiss
T and tt + pmissT21
search channels. Data from background-enriched control regions are included in the fits in22
order to constrain the contributions of major backgrounds. All tt decay modes – dileptonic23
(ee, µµ, eµ), semileptonic (e, µ) and fully hadronic – are explored. The search adopts a simpli-24
fied model framework to interpret results in terms of the decays of spin-0 mediators with pure25
scalar (F) or pseudoscalar (a) couplings. This work represents the first combination of dilep-26
tonic, semileptonic and hadronic tt+ cc DM searches, and it is the first to statistically combine27
tt + cc and bb + cc search results.28
The document is organized as follows: Section 2 reviews the CMS detector and the recon-29
structed physics objects used in the analysis. Section 3 describes the modeling of tt/bb + cc30
signal and SM background events. Section 4 describes the selections applied to reconstructed31
physics objects in data and simulation. Section 5 discusses the techniques used to extract a po-32
tential DM signal in the tt/bb + pmissT channels, and the systematic uncertainties considered in33
2 3 Event selection
g
g
t
t tS
t
g
(a)
q
W/ZW/Z
S
q
(b)
Figure 2: Monojet (a) and mono-V (b) production and decay diagrams for a spin-0 mediator.
up to a pseudorapidity of |h| < 2.5. The tracker is surrounded by a lead tungstate crystal elec-35
tromagnetic calorimeter (ECAL), and a sampling hadron calorimeter (HCAL) made of brass36
and scintillator, which provide coverage up to |h| < 3. The steel and quartz-fiber Cerenkov37
hadron forward (HF) calorimeter extends the coverage to |h| < 5. The muon system consists38
of gas-ionization detectors embedded in the steel flux-return yoke of the solenoid, and covers39
|h| < 2.4.40
Simulated samples of background events are produced for the Z + jets and g + jets processes at41
leading order (LO) with up to four partons in the final state, using MADGRAPH5 AMC@NLO42
2.2.3 [38]. The W(`n) + jets and tt processes are simulated at next-to-leading order (NLO),43
whereas the QCD multijet background is simulated using MADGRAPH5 AMC@NLO at LO.44
The single top quark background sample is produced using POWHEG V2 [39], and a set of di-45
boson samples is produced with PYTHIA 8.205 [40]. The monojet DM signal is simulated at LO46
for spin-0 mediators and at NLO for spin-1 mediators using POWHEG. The mono-V DM signal47
samples are produced at LO with the JHUGEN 5.2.5 generator [41–43] for the scalar mediator,48
and with MADGRAPH5 AMC@NLO for the spin-1 mediators. SM Higgs boson signal events49
produced through gluon fusion and vector boson fusion are generated using POWHEG, while50
SM Higgs boson production in association with W or Z bosons is simulated using the JHUGEN51
generator.52
Events produced using MADGRAPH5 AMC@NLO, POWHEG, and JHUGEN generators are53
further processed with PYTHIA using the CUETP8M1 tune [44] for the simulation of frag-54
mentation, parton shower, hadronization, and the underlying event. In the case of the MAD-55
GRAPH5 AMC@NLO samples, jets from the matrix element calculations are matched to the56
parton shower description following the FxFx matching prescription [45] for the NLO samples57
and the MLM scheme [46] for the LO ones. The NNPDF 3.0 [47] parton distribution functions58
(PDFs) are used for all generated samples. Interactions of final-state particles with the CMS59
detector are simulated with GEANT4 [48]. Simulated events include the effect of additional un-60
correlated interactions in the same, or neighbouring bunch crossings (pileup), and are weighted61
to reproduce the distribution of reconstructed primary vertices observed in data.62
3 Event selection63
Candidate events are selected using triggers that have thresholds of 90, 100, or 110 GeV on64
both the EmissT trig and Hmiss
T trig, where EmissT trig is computed as the magnitude of the vector sum of65
the pT of all the particles reconstructed at the trigger level, and HmissT trig is the magnitude of the66
vector sum of the pT of jets reconstructed at trigger level. Jets used in the HmissT trig computation67
are required to have pT > 20 GeV and |h| < 5.0. The energy fraction attributed to neutral68
hadrons in these jets is required to be less than 0.9. This requirement helps to remove jets69
tt+DM Final State(Sensitive for spin-0 mediators)
Monojet Final State(Produced through gluon fusion)
11
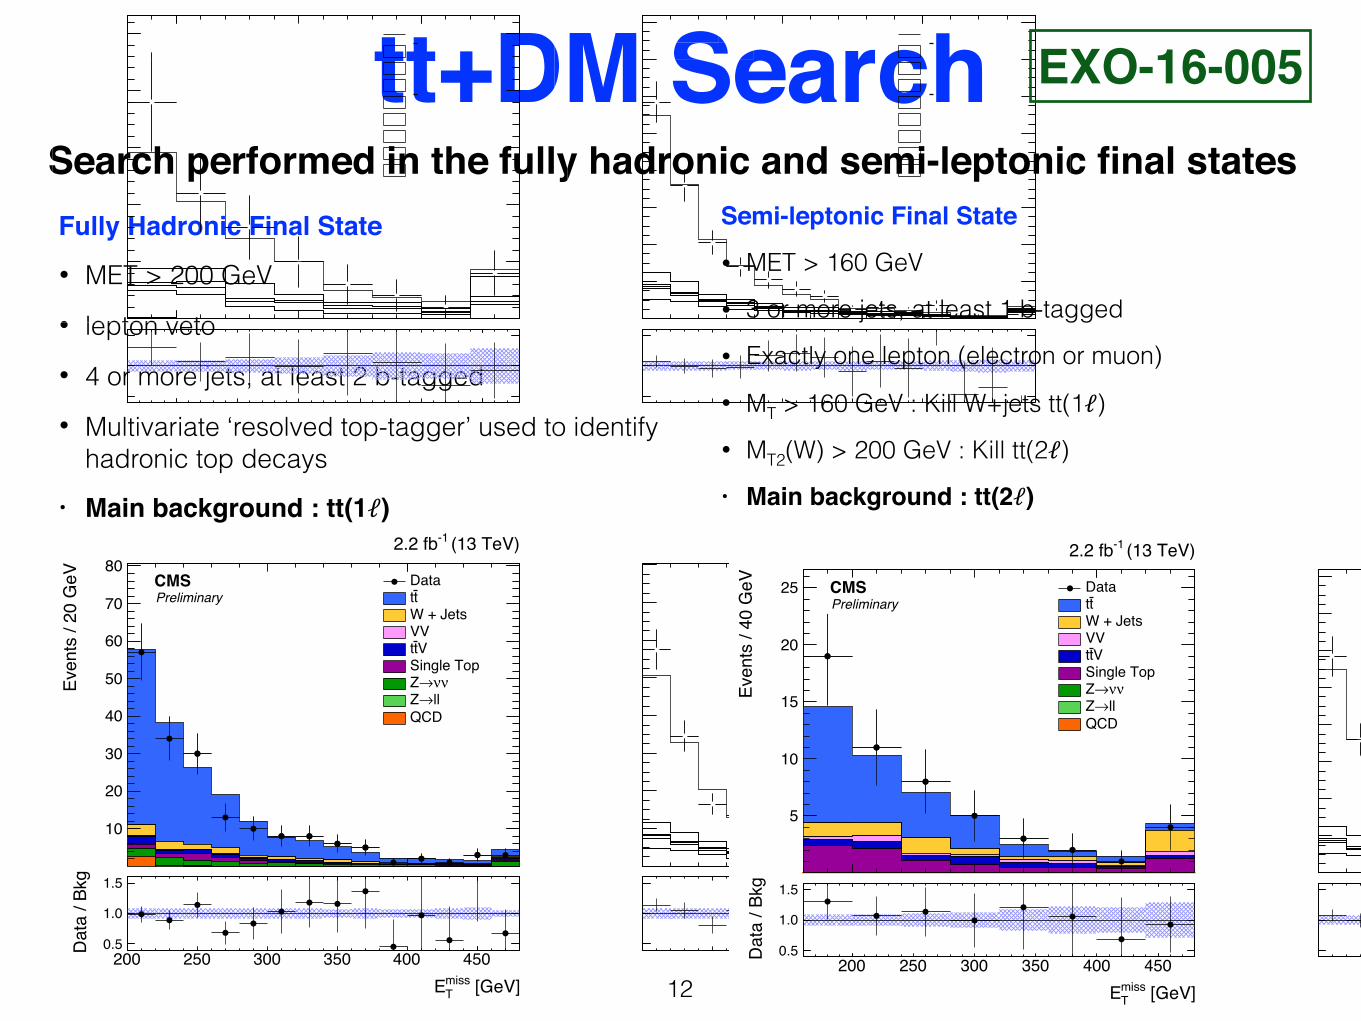
tt+DM SearchSearch performed in the fully hadronic and semi-leptonic final states
12
Fully Hadronic Final State• MET > 200 GeV
• lepton veto • 4 or more jets, at least 2 b-tagged • Multivariate ‘resolved top-tagger’ used to identify
hadronic top decays • Main background : tt(1ℓ)
13
[GeV]missTE
200 300 400
Even
ts /
40 G
eV
5
10
15
20
25 DatattW + JetsVVVtt
Single Topνν→Z
ll→ZQCD
(13 TeV)-12.2 fb
CMSPreliminary
[GeV]missTE
200 250 300 350 400 450Dat
a / B
kg
0.5
1.0
1.5
(a)
[GeV]missTE
200 300 400
Even
ts /
20 G
eV
20
40
60
80
100
120
140
160 DatattW + JetsVVVtt
Single Topνν→Z
ll→ZQCD
(13 TeV)-12.2 fb
CMSPreliminary
[GeV]missTE
200 250 300 350 400 450Dat
a / B
kg
0.5
1.0
1.5
(b)
[GeV]missTE
200 300 400
Even
ts /
20 G
eV
10
20
30
40
50
60
70
80DatattW + JetsVVVtt
Single Topνν→Z
ll→ZQCD
(13 TeV)-12.2 fb
CMSPreliminary
[GeV]missTE
200 250 300 350 400 450Dat
a / B
kg
0.5
1.0
1.5
(c)
[GeV]missTE
200 300 400
Even
ts /
20 G
eV
20
40
60
80
100
120
140
160DatattW + JetsVVVtt
Single Topνν→Z
ll→ZQCD
(13 TeV)-12.2 fb
CMSPreliminary
[GeV]missTE
200 250 300 350 400 450Dat
a / B
kg
0.5
1.0
1.5
(d)
Figure 8: Post-fit distributions of EmissT expected from SM backgrounds and observed in data in
the signal regions for the (a) semileptonic, (b) inclusive hadronic, (c) two top tags hadronic cat-egory and (c) less than two top tags hadronic category. The expected distributions are shownafter fitting to the observed data simultaneously across signal and control regions with an as-sumption of zero signal contribution. The overall post-fit uncertainties are shown in the blueband on the lower panel.
EXO-16-005
Semi-leptonic Final State
• MET > 160 GeV
• 3 or more jets, at least 1 b-tagged
• Exactly one lepton (electron or muon)
• MT > 160 GeV : Kill W+jets tt(1ℓ) • MT2(W) > 200 GeV : Kill tt(2ℓ) • Main background : tt(2ℓ)
13
[GeV]missTE
200 300 400
Even
ts /
40 G
eV
5
10
15
20
25 DatattW + JetsVVVtt
Single Topνν→Z
ll→ZQCD
(13 TeV)-12.2 fb
CMSPreliminary
[GeV]missTE
200 250 300 350 400 450Dat
a / B
kg
0.5
1.0
1.5
(a)
[GeV]missTE
200 300 400
Even
ts /
20 G
eV
20
40
60
80
100
120
140
160 DatattW + JetsVVVtt
Single Topνν→Z
ll→ZQCD
(13 TeV)-12.2 fb
CMSPreliminary
[GeV]missTE
200 250 300 350 400 450Dat
a / B
kg
0.5
1.0
1.5
(b)
[GeV]missTE
200 300 400
Even
ts /
20 G
eV
10
20
30
40
50
60
70
80DatattW + JetsVVVtt
Single Topνν→Z
ll→ZQCD
(13 TeV)-12.2 fb
CMSPreliminary
[GeV]missTE
200 250 300 350 400 450Dat
a / B
kg
0.5
1.0
1.5
(c)
[GeV]missTE
200 300 400
Even
ts /
20 G
eV
20
40
60
80
100
120
140
160DatattW + JetsVVVtt
Single Topνν→Z
ll→ZQCD
(13 TeV)-12.2 fb
CMSPreliminary
[GeV]missTE
200 250 300 350 400 450Dat
a / B
kg
0.5
1.0
1.5
(d)
Figure 8: Post-fit distributions of EmissT expected from SM backgrounds and observed in data in
the signal regions for the (a) semileptonic, (b) inclusive hadronic, (c) two top tags hadronic cat-egory and (c) less than two top tags hadronic category. The expected distributions are shownafter fitting to the observed data simultaneously across signal and control regions with an as-sumption of zero signal contribution. The overall post-fit uncertainties are shown in the blueband on the lower panel.
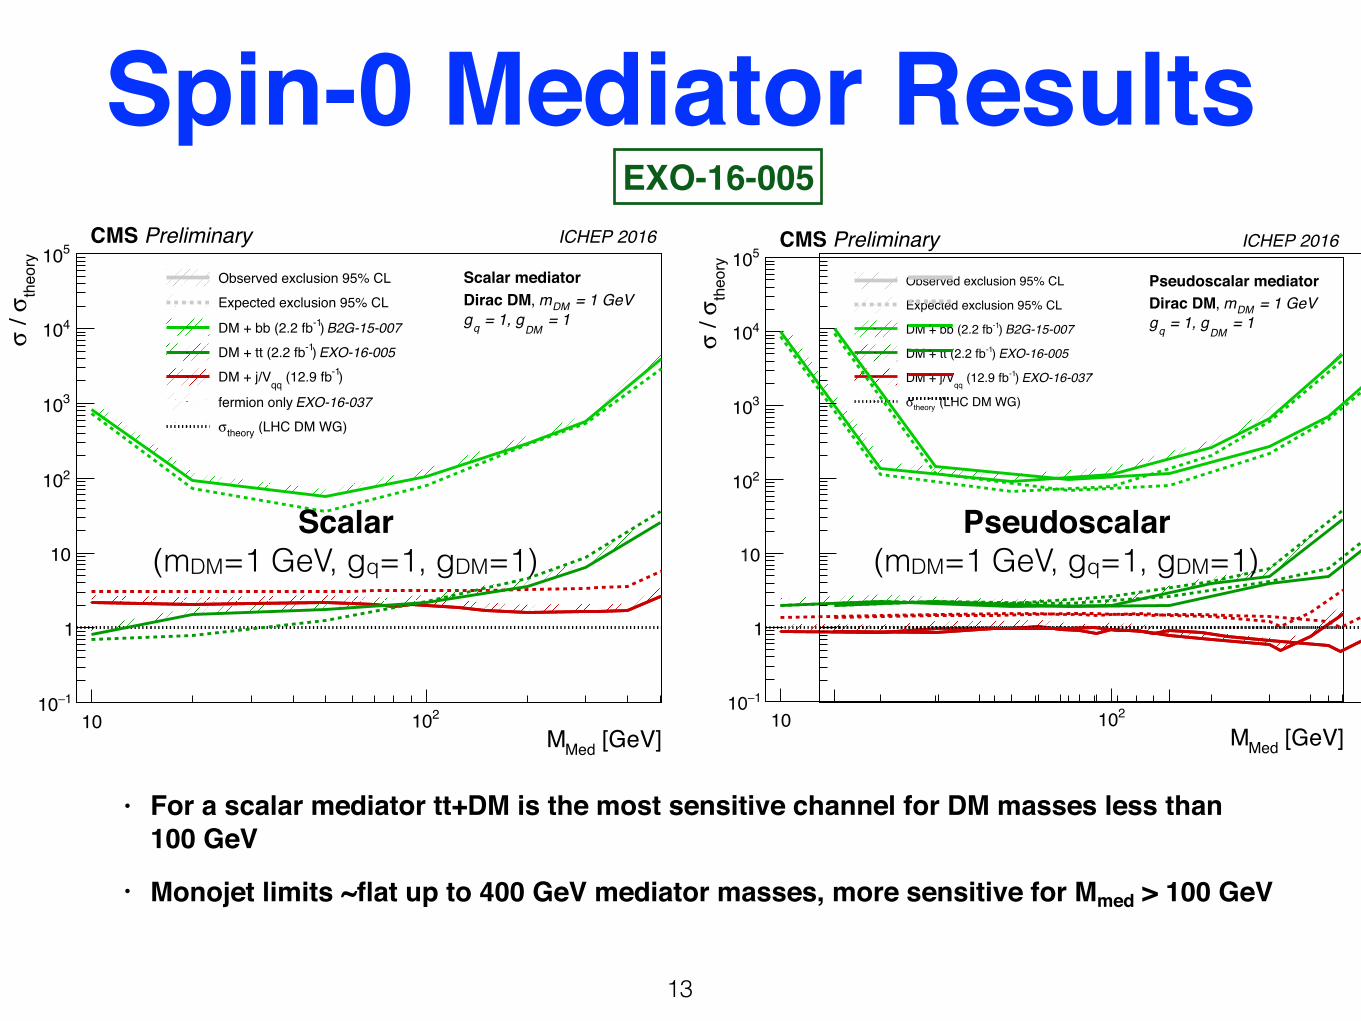
Spin-0 Mediator Results
• For a scalar mediator tt+DM is the most sensitive channel for DM masses less than 100 GeV
• Monojet limits ~flat up to 400 GeV mediator masses, more sensitive for Mmed > 100 GeV
13
5 Figure
[GeV]MedM10 210
theo
ryσ
/ σ
1−10
1
10
210
310
410
510Scalar mediator
= 1 GeVDMm, Dirac DM = 1
DM = 1, gqg
Observed exclusion 95% CLExpected exclusion 95% CL
B2G-15-007) -1DM + bb (2.2 fbEXO-16-005) -1DM + tt (2.2 fb
)-1 (12.9 fbqqDM + j/V
EXO-16-037fermion only (LHC DM WG)theoryσ
Preliminary CMS ICHEP 2016
Observed exclusion 95% CLExpected exclusion 95% CL
B2G-15-007) -1DM + bb (2.2 fbEXO-16-005) -1DM + tt (2.2 fb
)-1 (12.9 fbqqDM + j/V
EXO-16-037fermion only (LHC DM WG)theoryσ
Preliminary CMS ICHEP 2016
[GeV]MedM10 210
theo
ryσ
/ σ1−10
1
10
210
310
410
510Pseudoscalar mediator
= 1 GeVDMm, Dirac DM = 1
DM = 1, gqg
Observed exclusion 95% CL
Expected exclusion 95% CL
B2G-15-007) -1DM + bb (2.2 fb
EXO-16-005) -1DM + tt (2.2 fb
EXO-16-037) -1 (12.9 fbqq
DM + j/V
(LHC DM WG)theoryσ
Preliminary CMS ICHEP 2016
Observed exclusion 95% CL
Expected exclusion 95% CL
B2G-15-007) -1DM + bb (2.2 fb
EXO-16-005) -1DM + tt (2.2 fb
EXO-16-037) -1 (12.9 fbqq
DM + j/V
(LHC DM WG)theoryσ
Preliminary CMS ICHEP 2016
Figure 5. 95% CL observed (full-line) and expected (dashed-line) exclusion limits for the Scalar(left) and Pseudoscalar (right) model as a function of Mmed for di↵erent /ET based DM searchesfrom CMS. Following the recommendation of the LHC DM working group [1, 2], the exclusions arecomputed for quark coupling gq = 1.00 and for a DM coupling of gDM = 1.0 It should be notedthat an exclusion away from /0 1 only applies to coupling combinations that yield the samekinematic distributions as the benchmark model considered here.
6 Figure
Maximal excluded mass [GeV]1 10 210 310 410
=1
q=g
DMg
t/tbDM + b
=1q
=gDM
g tDM + t
=1
q=g
DMg
)qDM + jets/V(q
=0.8Z'
g =100GeV
DM=300GeV; m0A
m )γγDM + H(bb/
=0.25FC=b
FC=1, a
DMg
DM + t
=0.25q
=1, gDM
g )-l+DM + Z(l
=0.25
q=1, g
DMg
γDM +
=0.25q
=1, gDM
g )qDM + jets/V(q
DM exclusions
exclusionsmediator
-113TeV, 12.9fbEXO-16-037
-113TeV, 12.9fbEXO-16-039
-113TeV, 12.9fbEXO-16-038
-113TeV, 12.9fbEXO-16-040
-113TeV, 2.3fbEXO-16-011EXO-16-012
-113TeV, 12.9fbEXO-16-037
-113TeV, 2.2fbEXO-16-005
-113TeV, 2.2fbB2G-15-007
V
AV
V
AV
V
AV
V
S
PS
S
PS
S
PS
V = vector ; AV = axial-vectorS = scalar ; PS = pseudoscalar
CMS Preliminary Dark Matter Summary - ICHEP 2016
Observed limits at 95%CLfor considered simplified modelsTheory uncertainties not included
spin 0 mediator
spin 1 mediator
= 20σ/σ
= 50σ/σ
= 300σ/σ
Figure 6. Maximal/minimal reach of DM searches from CMS in mediator mass (blue bar) andDM mass (red bar). The limits represent 95% CL observed exclusions and they are only applicableto the model and coupling choices indicated next to the bars.
– 4 –
5 Figure
[GeV]MedM10 210
theo
ryσ
/ σ
1−10
1
10
210
310
410
510Scalar mediator
= 1 GeVDMm, Dirac DM = 1
DM = 1, gqg
Observed exclusion 95% CLExpected exclusion 95% CL
B2G-15-007) -1DM + bb (2.2 fbEXO-16-005) -1DM + tt (2.2 fb
)-1 (12.9 fbqqDM + j/V
EXO-16-037fermion only (LHC DM WG)theoryσ
Preliminary CMS ICHEP 2016
Observed exclusion 95% CLExpected exclusion 95% CL
B2G-15-007) -1DM + bb (2.2 fbEXO-16-005) -1DM + tt (2.2 fb
)-1 (12.9 fbqqDM + j/V
EXO-16-037fermion only (LHC DM WG)theoryσ
Preliminary CMS ICHEP 2016
[GeV]MedM10 210
theo
ryσ
/ σ
1−10
1
10
210
310
410
510Pseudoscalar mediator
= 1 GeVDMm, Dirac DM = 1
DM = 1, gqg
Observed exclusion 95% CL
Expected exclusion 95% CL
B2G-15-007) -1DM + bb (2.2 fb
EXO-16-005) -1DM + tt (2.2 fb
EXO-16-037) -1 (12.9 fbqq
DM + j/V
(LHC DM WG)theoryσ
Preliminary CMS ICHEP 2016
Observed exclusion 95% CL
Expected exclusion 95% CL
B2G-15-007) -1DM + bb (2.2 fb
EXO-16-005) -1DM + tt (2.2 fb
EXO-16-037) -1 (12.9 fbqq
DM + j/V
(LHC DM WG)theoryσ
Preliminary CMS ICHEP 2016
Figure 5. 95% CL observed (full-line) and expected (dashed-line) exclusion limits for the Scalar(left) and Pseudoscalar (right) model as a function of Mmed for di↵erent /ET based DM searchesfrom CMS. Following the recommendation of the LHC DM working group [1, 2], the exclusions arecomputed for quark coupling gq = 1.00 and for a DM coupling of gDM = 1.0 It should be notedthat an exclusion away from /0 1 only applies to coupling combinations that yield the samekinematic distributions as the benchmark model considered here.
6 Figure
Maximal excluded mass [GeV]1 10 210 310 410
=1
q=g
DMg
t/tbDM + b
=1q
=gDM
g tDM + t
=1
q=g
DMg
)qDM + jets/V(q
=0.8Z'
g =100GeV
DM=300GeV; m0A
m )γγDM + H(bb/
=0.25FC=b
FC=1, a
DMg
DM + t
=0.25q
=1, gDM
g )-l+DM + Z(l
=0.25
q=1, g
DMg
γDM +
=0.25q
=1, gDM
g )qDM + jets/V(q
DM exclusions
exclusionsmediator
-113TeV, 12.9fbEXO-16-037
-113TeV, 12.9fbEXO-16-039
-113TeV, 12.9fbEXO-16-038
-113TeV, 12.9fbEXO-16-040
-113TeV, 2.3fbEXO-16-011EXO-16-012
-113TeV, 12.9fbEXO-16-037
-113TeV, 2.2fbEXO-16-005
-113TeV, 2.2fbB2G-15-007
V
AV
V
AV
V
AV
V
S
PS
S
PS
S
PS
V = vector ; AV = axial-vectorS = scalar ; PS = pseudoscalar
CMS Preliminary Dark Matter Summary - ICHEP 2016
Observed limits at 95%CLfor considered simplified modelsTheory uncertainties not included
spin 0 mediator
spin 1 mediator
= 20σ/σ
= 50σ/σ
= 300σ/σ
Figure 6. Maximal/minimal reach of DM searches from CMS in mediator mass (blue bar) andDM mass (red bar). The limits represent 95% CL observed exclusions and they are only applicableto the model and coupling choices indicated next to the bars.
– 4 –
Scalar(mDM=1 GeV, gq=1, gDM=1)
Pseudoscalar(mDM=1 GeV, gq=1, gDM=1)
EXO-16-005
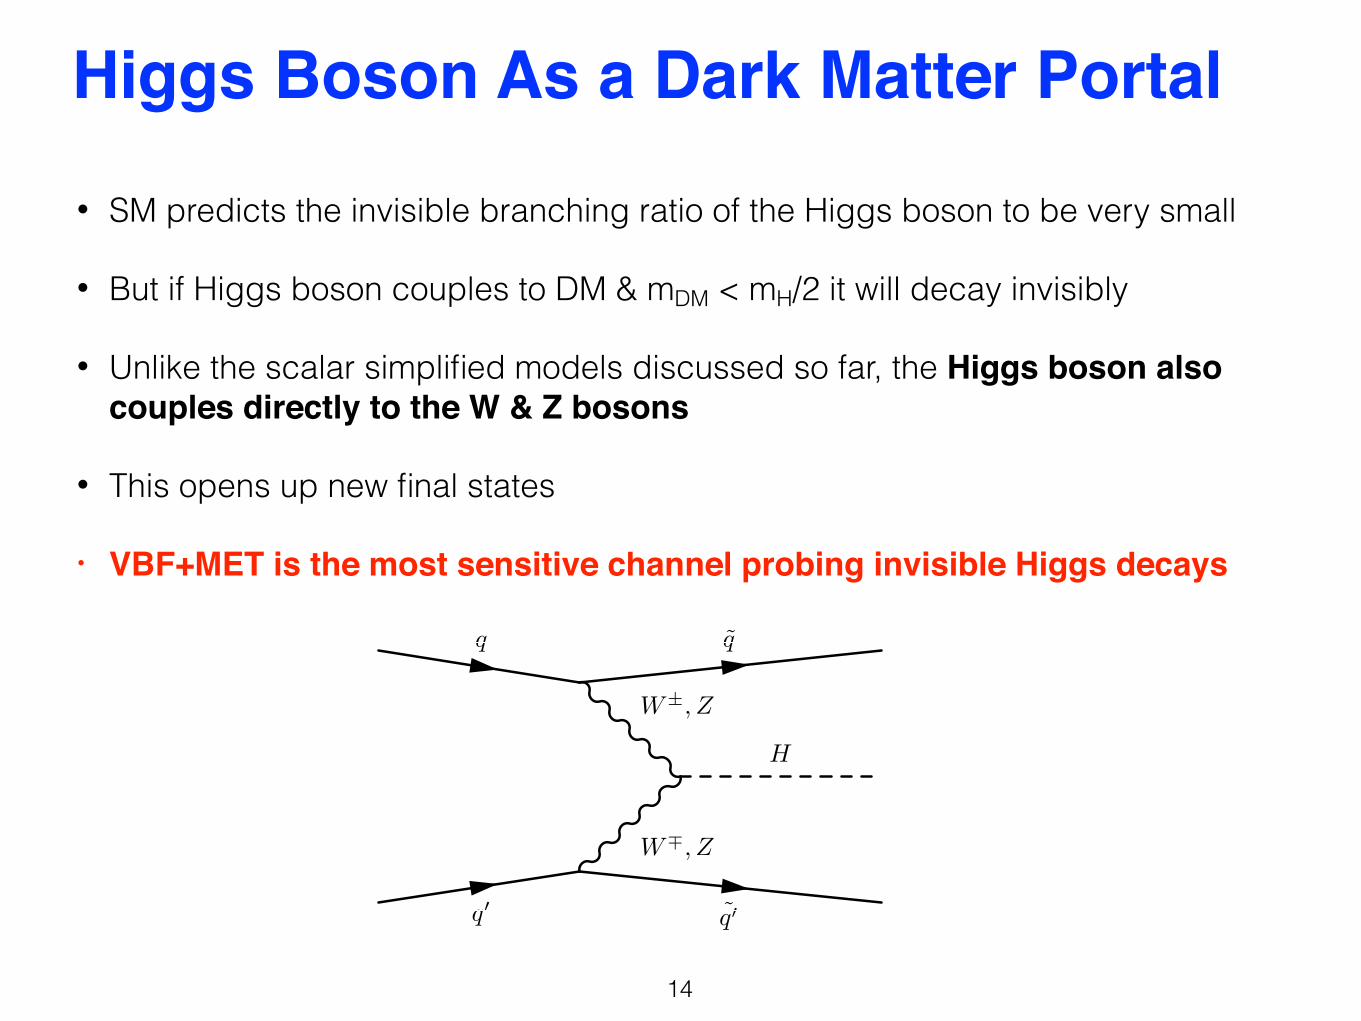
Higgs Boson As a Dark Matter Portal
• SM predicts the invisible branching ratio of the Higgs boson to be very small
• But if Higgs boson couples to DM & mDM < mH/2 it will decay invisibly
• Unlike the scalar simplified models discussed so far, the Higgs boson also couples directly to the W & Z bosons
• This opens up new final states
• VBF+MET is the most sensitive channel probing invisible Higgs decays
14
26
g
g
t
t
tH
q
q
q
W, Z
q
W±, Z
H
q
q
W±, Z
W±, Z
H
g
g
tt
tt
H
Figure 1.6 Leading order Feynman diagram for weak boson fusion
Associated Production
The other electroweak mode involves the production of the Higgs boson in as-
sociation with a W or a Z boson through the s-channel as shown in Fig. 1.7(a). This
mode is also known as ‘Higgs-strahlung’ since one can think of the Higgs boson as being
radiated o↵ of a weak boson. At the Tevatron, which is a p p collider, this mode turns
out to be more dominant than VBF. The presence of the associated W or Z boson in
the event provides a very useful handle in suppressing large QCD backgrounds in several
search modes. The cross-section for this process has been evaluated to NNLO in QCD
corrections [83–89] by carrying over the results from the classic ‘Drell-Yan’ cross-section
(this is possible because both processes are essentially s-channel processes involving a
weak boson). For the ZH process, however, when computing the cross-section at NNLO
one needs to also take into account gluon induced diagrams with a top-quark loop [90,91]
as shown in Fig. 1.7(b). Electroweak corrections are also available for this process at
NLO [92,93].
g
g
t
t
tH
q
q
q
W, Z
q
W±, Z
H
q
q
W±, Z
W±, Z
H
g
g
tt
tt
H
(a)
g
g
t
t t
H
t
Z
(a)q
q
q
W, Z
q
W±, Z
H
(b)
q
q
W±, Z
W±, Z
H
(c)g
g
tt
tt
H
(d)
gg
gg
tt
ggtt
tt
H
(e)
tt
ggtt
tt
H
(f)
(b)
Figure 1.7 Higgs boson production in association with a W or a Z boson.

VBF+MET SearchEvent selection :
• Two jets with large η-gap, large invariant mass |ηjj| > 3.6; mjj > 1100 GeV pT(j1) > 80 GeV, pT(j2) > 70 GeV
• Substantial MET in the event MET > 200 GeV
• Lepton veto
Cut-n-count analysis
Main backgrounds : • Z(νν)+jets, W(ℓv)+jets • Estimated using dimuon and single-lepton
control regions • Z/W cross-section ratio from theory used to
constrain the EWK background (like monojet)15
4.1 The VBF analysis 7
)|2
,j1
(jη∆|4 4.5 5 5.5 6 6.5 7
Even
ts/0
.17
0
5
10
15
20
25
30 Data
)+jetsνν→Z(
)+jetsνℓ→W(
VV
QCD multijet
Top quark
inv)=100%→H, B(H
(13 TeV)-12.3 fb
VBF jetsCMS
[GeV]jjm1500 2000 2500 3000 3500 4000
Even
ts/1
45 G
eV
05
1015202530354045 Data
)+jetsνν→Z(
)+jetsνℓ→W(
VV
QCD multijet
Top quark
inv)=100%→H, B(H
(13 TeV)-12.3 fb
VBF jetsCMS
Figure 3: Distributions of (left) Dh(j1, j2) and (right) mjj in events selected in the VBF analysisfor data and simulation at 13 TeV. The background yields are scaled to their post-fit values,with the total post-fit uncertainty represented as the black hatched area. The last bin containsthe overflow events. The expected contribution from a Higgs boson with a mass of 125 GeV,produced with the SM cross section and decaying to invisible particles with 100% branchingfraction, is overlaid.
4.1.2 Background estimation
The dominant backgrounds to this search arise from Z(nn)+jets events and W(`n)+jets eventswith the charged lepton outside of the detector acceptance or not identified. These backgroundsare estimated using data control regions, in which a Z or W boson, produced in association withthe same dijet topology, decays to well-identified charged leptons. These control regions aredesigned to be as similar to the signal region as possible to limit the extrapolation requiredbetween different kinematic phase spaces. An additional control region, enriched in QCD mul-tijet events, is defined to estimate the contribution arising due to mismeasured jet energiescausing apparent Emiss
T . Additional smaller contributions due to diboson, tt, and single topquark production are estimated directly from simulation.
A dimuon control region is defined, enriched in Z ! µ+µ events, requiring a pair of oppo-sitely charged muons with pT > 20 GeV, |h| < 2.1, and an invariant mass mµµ in the range60–120 GeV. Three single-lepton regions (one enriched in each of the W ! en, W ! µn, andW ! tn processes) are defined by removing the lepton veto and requiring exactly one isolatedlepton, with pT > 20 GeV, of a given flavour, and no leptons of any other flavour. The lep-ton is required to be within |h| < 2.1, 2.4, or 2.3 for the single-muon, single-electron, or singlet lepton region, respectively. The remaining jets and Emiss
T criteria are identical to the signalregion, except in the W ! tn control region where the min Df(~pmiss
T , j) criterion is relaxed tomin Df(~pmiss
T , j) > 1, taking the minimum over the leading two jets only, to ensure QCD mul-tijet events are suppressed, while retaining a sufficient number of events in the control region.Additionally, a requirement that min Df(~pmiss
T , j) < 2.3 is applied to maintain an orthogonalselection to the signal region.
Finally, additional control regions are defined in data that are identical to the signal regionselection except for the requirement on min Df(~pmiss
T , j). In the 8 TeV analysis, a two-stepprocedure is used in which two control regions are defined. The first control region is de-fined by min Df(~pmiss
T , j) < 1 and is used to determine the distribution of S(EmissT ) for QCD
multijet events once the contributions from other backgrounds are subtracted. The distribu-
HIG-16-016

Higgs → Invisible Combination
16
Dominated by mono-jetVBF(Most sensitive channel)Limit on H(inv) BR : 24%
• Limit on H→inv BR obtained from a combination of several states using both Run-1 and Run-2 (2015) data
• Limit dominated by the VBF+MET search • Monojet (gluon fusion) and mono-V(Higgsstrahlung) final states also included
5.1 Upper limits on B(H ! inv) assuming SM production 17
the production cross sections take their SM values, the results can be used to constrain thebranching fraction of the Higgs boson to invisible particles. Assuming SM production rates forthe ggH, qqH, and VH modes, the combination yields an observed (expected) upper limit ofB(H ! inv) < 0.24 (0.23) at the 95% CL.
Combined qqH-tagged VH-tagged ggH-tagged
(SM
) - U
pper
lim
it 95
% C
Lσ
inv)
/→
B(H
σ
0
0.2
0.4
0.6
0.8
1
1.2
1.4
1.6
1.8
2 (13 TeV)-1 (8 TeV) + 2.3 fb-1 (7 TeV) + 19.7 fb-14.9 fb
CMSObserved
Median expected
68% expected
95% expected
Figure 6: Observed and expected 95% CL limits on s B(H ! inv)/s(SM) for individual com-binations of categories targeting qqH, VH, and ggH production, and the full combination as-suming a Higgs boson with a mass of 125 GeV.
The profile likelihood ratios as a function of B(H ! inv) using partial combinations of the7+8 and 13 TeV analyses, and for the full combination are shown in Fig. 7 (left). The profilelikelihood ratio scans for the partial combinations of the qqH-tagged, VH-tagged, and ggH-tagged analyses are shown in Fig. 7 (right). The results are shown for the data and for anAsimov data set, defined as the data set for which the maximum likelihood estimates of allparameters are equal to their true values [85], in which B(H ! inv) = 0 is assumed.
The dominant systematic uncertainties for the qqH-tagged, Z(`+`), V(jj), and ggH-taggedsearches in the 13 TeV data set are listed in Tables 7, 8, 9, and 10, respectively.
The impact of each independent source of systematic uncertainty is calculated for an Asimovdata set in which s B(H ! inv)/s(SM) is assumed to be 1. The impact is defined as themaximum difference in the fitted value of s B(H ! inv)/s(SM), when varying the nuisanceparameter associated to that source of systematic uncertainty within one standard deviation ofits maximum likelihood estimate. The total systematic uncertainty, and the total uncertaintyfixing all nuisance parameters associated to systematic uncertainties that are not expected toimprove with additional luminosity (statistical only), for each analysis is also shown. Finally,the total uncertainty is given for each analysis. The statistical only and total uncertainties aredetermined from the interval in s B(H ! inv)/s(SM) for which q < 1. The total systematicuncertainty is determined by subtracting the statistical only uncertainty from the total uncer-tainty in quadrature. With the luminosity of the 13 TeV data set, the sensitivity of the qqH-tagged and Z(`+`) analyses is dominated by the statistical uncertainty while for the V(jj) andggH-tagged analyses, a reduction in the theoretical and experimental systematic uncertaintiesrelated to the modelling of the Z(nn)+jets and W(`n)+jets backgrounds would yield significant
HIG-16-016

Comparison With Direct Searches
17
For a vector and scalar mediators collider searches provide complementarity at low DM masses
EXO-16-037
6.2 Invisible decays of the Higgs boson 17
[GeV]DMm1 10 210 310
]2 [c
mD
M-n
ucle
onSI σ
46−10
45−10
44−10
43−10
42−10
41−10
40−10
39−10
38−10
37−10
36−10
35−10
34−10
CMS median exp. 90% CLCMS obs. 90% CLLUXCDMSLitePandaX-IICRESST-II
(13 TeV)-112.9 fb
CMS = 1
DM = 0.25, g
qVector med, Dirac DM, g
[GeV]DMm1 10 210
]2 [c
mD
M-p
roto
nSD σ
44−10
43−10
42−10
41−10
40−10
39−10
38−10
37−10
36−10
35−10
34−10
33−10
CMS median exp. 90% CLCMS obs. 90% CLPICO-60PICO-2L
-τ+τIceCube -τ+τSuper-K
(13 TeV)-112.9 fb
CMS = 1
DM = 0.25, g
qAxial-vector med, Dirac DM, g
Figure 11: Exclusion limits at 90% CL in the mDM vs. sSI/SD plane for vector (left) and axial-vector (right) mediator models. The solid (dotted) red line shows the contour for the observed(expected) exclusion in this search. Limits from the CDMSLite [90], LUX [91], PandaX-II [92],and CRESST-II [93] experiments are shown for the vector mediator. Limits from the PICO-2L [94], PICO-60 [95], IceCube [96], and Super-Kamiokande [97] experiments are shown for theaxial-vector mediator.
[GeV]DMm1 10 210 310
]2 [c
mD
M-n
ucle
onSI σ
46−10
45−10
44−10
43−10
42−10
41−10
40−10
39−10
38−10
37−10
36−10
35−10
34−10
CMS obs. 90% CLLUXCDMSLitePandaX-IICRESST-II
(13 TeV)-112.9 fb
CMS = 1
DM = 1, g
qScalar med, Dirac DM, g
[GeV]DMm10 210
/s)
3 v
> (c
mσ
<
30−10
29−10
28−10
27−10
26−10
25−10
24−10
CMS obs. 90% CL
FermiLAT
(13 TeV)-112.9 fb
CMS = 1
DM = 1, g
qPseudoscalar med, Dirac DM, g
Figure 12: Exclusion limits at 90% CL in the mDM vs. sSI/SD plane for the scalar mediator model(left). The observed exclusion in this search (red line) is compared to the results from the CDM-SLite [90], LUX [91], PandaX-II [92], and CRESST-II [93] experiments. For the pseudoscalarmediator (right), limits are compared to the the velocity-averaged DM annihilation cross sec-tion upper limits from Fermi–LAT [89]. There are no comparable limits from direct detectionexperiments as the scattering cross section between DM particles and SM quarks is suppressedat nonrelativistic velocities for a pseudoscalar mediator [98, 99].
Vector
6.2 Invisible decays of the Higgs boson 17
[GeV]DMm1 10 210 310
]2 [c
mD
M-n
ucle
onSI σ
46−10
45−10
44−10
43−10
42−10
41−10
40−10
39−10
38−10
37−10
36−10
35−10
34−10
CMS median exp. 90% CLCMS obs. 90% CLLUXCDMSLitePandaX-IICRESST-II
(13 TeV)-112.9 fb
CMS = 1
DM = 0.25, g
qVector med, Dirac DM, g
[GeV]DMm1 10 210
]2 [c
mD
M-p
roto
nSD σ
44−10
43−10
42−10
41−10
40−10
39−10
38−10
37−10
36−10
35−10
34−10
33−10
CMS median exp. 90% CLCMS obs. 90% CLPICO-60PICO-2L
-τ+τIceCube -τ+τSuper-K
(13 TeV)-112.9 fb
CMS = 1
DM = 0.25, g
qAxial-vector med, Dirac DM, g
Figure 11: Exclusion limits at 90% CL in the mDM vs. sSI/SD plane for vector (left) and axial-vector (right) mediator models. The solid (dotted) red line shows the contour for the observed(expected) exclusion in this search. Limits from the CDMSLite [90], LUX [91], PandaX-II [92],and CRESST-II [93] experiments are shown for the vector mediator. Limits from the PICO-2L [94], PICO-60 [95], IceCube [96], and Super-Kamiokande [97] experiments are shown for theaxial-vector mediator.
[GeV]DMm1 10 210 310
]2 [c
mD
M-n
ucle
onSI σ
46−10
45−10
44−10
43−10
42−10
41−10
40−10
39−10
38−10
37−10
36−10
35−10
34−10
CMS obs. 90% CLLUXCDMSLitePandaX-IICRESST-II
(13 TeV)-112.9 fb
CMS = 1
DM = 1, g
qScalar med, Dirac DM, g
[GeV]DMm10 210
/s)
3 v
> (c
mσ
<
30−10
29−10
28−10
27−10
26−10
25−10
24−10
CMS obs. 90% CL
FermiLAT
(13 TeV)-112.9 fb
CMS = 1
DM = 1, g
qPseudoscalar med, Dirac DM, g
Figure 12: Exclusion limits at 90% CL in the mDM vs. sSI/SD plane for the scalar mediator model(left). The observed exclusion in this search (red line) is compared to the results from the CDM-SLite [90], LUX [91], PandaX-II [92], and CRESST-II [93] experiments. For the pseudoscalarmediator (right), limits are compared to the the velocity-averaged DM annihilation cross sec-tion upper limits from Fermi–LAT [89]. There are no comparable limits from direct detectionexperiments as the scattering cross section between DM particles and SM quarks is suppressedat nonrelativistic velocities for a pseudoscalar mediator [98, 99].
Scalar

Comparison With Direct/Indirect Searches
18
• For axial vector mediator, collider searches provide strong constraints over a large DM mass range
• For a pseudoscalar mediator collider searches stand out
EXO-16-037
6.2 Invisible decays of the Higgs boson 17
[GeV]DMm1 10 210 310
]2 [c
mD
M-n
ucle
onSI σ
46−10
45−10
44−10
43−10
42−10
41−10
40−10
39−10
38−10
37−10
36−10
35−10
34−10
CMS median exp. 90% CLCMS obs. 90% CLLUXCDMSLitePandaX-IICRESST-II
(13 TeV)-112.9 fb
CMS = 1
DM = 0.25, g
qVector med, Dirac DM, g
[GeV]DMm1 10 210
]2 [c
mD
M-p
roto
nSD σ
44−10
43−10
42−10
41−10
40−10
39−10
38−10
37−10
36−10
35−10
34−10
33−10
CMS median exp. 90% CLCMS obs. 90% CLPICO-60PICO-2L
-τ+τIceCube -τ+τSuper-K
(13 TeV)-112.9 fb
CMS = 1
DM = 0.25, g
qAxial-vector med, Dirac DM, g
Figure 11: Exclusion limits at 90% CL in the mDM vs. sSI/SD plane for vector (left) and axial-vector (right) mediator models. The solid (dotted) red line shows the contour for the observed(expected) exclusion in this search. Limits from the CDMSLite [90], LUX [91], PandaX-II [92],and CRESST-II [93] experiments are shown for the vector mediator. Limits from the PICO-2L [94], PICO-60 [95], IceCube [96], and Super-Kamiokande [97] experiments are shown for theaxial-vector mediator.
[GeV]DMm1 10 210 310
]2 [c
mD
M-n
ucle
onSI σ
46−10
45−10
44−10
43−10
42−10
41−10
40−10
39−10
38−10
37−10
36−10
35−10
34−10
CMS obs. 90% CLLUXCDMSLitePandaX-IICRESST-II
(13 TeV)-112.9 fb
CMS = 1
DM = 1, g
qScalar med, Dirac DM, g
[GeV]DMm10 210
/s)
3 v
> (c
mσ
<
30−10
29−10
28−10
27−10
26−10
25−10
24−10
CMS obs. 90% CL
FermiLAT
(13 TeV)-112.9 fb
CMS = 1
DM = 1, g
qPseudoscalar med, Dirac DM, g
Figure 12: Exclusion limits at 90% CL in the mDM vs. sSI/SD plane for the scalar mediator model(left). The observed exclusion in this search (red line) is compared to the results from the CDM-SLite [90], LUX [91], PandaX-II [92], and CRESST-II [93] experiments. For the pseudoscalarmediator (right), limits are compared to the the velocity-averaged DM annihilation cross sec-tion upper limits from Fermi–LAT [89]. There are no comparable limits from direct detectionexperiments as the scattering cross section between DM particles and SM quarks is suppressedat nonrelativistic velocities for a pseudoscalar mediator [98, 99].
6.2 Invisible decays of the Higgs boson 17
[GeV]DMm1 10 210 310
]2 [c
mD
M-n
ucle
onSI σ
46−10
45−10
44−10
43−10
42−10
41−10
40−10
39−10
38−10
37−10
36−10
35−10
34−10
CMS median exp. 90% CLCMS obs. 90% CLLUXCDMSLitePandaX-IICRESST-II
(13 TeV)-112.9 fb
CMS = 1
DM = 0.25, g
qVector med, Dirac DM, g
[GeV]DMm1 10 210
]2 [c
mD
M-p
roto
nSD σ
44−10
43−10
42−10
41−10
40−10
39−10
38−10
37−10
36−10
35−10
34−10
33−10
CMS median exp. 90% CLCMS obs. 90% CLPICO-60PICO-2L
-τ+τIceCube -τ+τSuper-K
(13 TeV)-112.9 fb
CMS = 1
DM = 0.25, g
qAxial-vector med, Dirac DM, g
Figure 11: Exclusion limits at 90% CL in the mDM vs. sSI/SD plane for vector (left) and axial-vector (right) mediator models. The solid (dotted) red line shows the contour for the observed(expected) exclusion in this search. Limits from the CDMSLite [90], LUX [91], PandaX-II [92],and CRESST-II [93] experiments are shown for the vector mediator. Limits from the PICO-2L [94], PICO-60 [95], IceCube [96], and Super-Kamiokande [97] experiments are shown for theaxial-vector mediator.
[GeV]DMm1 10 210 310
]2 [c
mD
M-n
ucle
onSI σ
46−10
45−10
44−10
43−10
42−10
41−10
40−10
39−10
38−10
37−10
36−10
35−10
34−10
CMS obs. 90% CLLUXCDMSLitePandaX-IICRESST-II
(13 TeV)-112.9 fb
CMS = 1
DM = 1, g
qScalar med, Dirac DM, g
[GeV]DMm10 210/s
)3
v >
(cm
σ<
30−10
29−10
28−10
27−10
26−10
25−10
24−10
CMS obs. 90% CL
FermiLAT
(13 TeV)-112.9 fb
CMS = 1
DM = 1, g
qPseudoscalar med, Dirac DM, g
Figure 12: Exclusion limits at 90% CL in the mDM vs. sSI/SD plane for the scalar mediator model(left). The observed exclusion in this search (red line) is compared to the results from the CDM-SLite [90], LUX [91], PandaX-II [92], and CRESST-II [93] experiments. For the pseudoscalarmediator (right), limits are compared to the the velocity-averaged DM annihilation cross sec-tion upper limits from Fermi–LAT [89]. There are no comparable limits from direct detectionexperiments as the scattering cross section between DM particles and SM quarks is suppressedat nonrelativistic velocities for a pseudoscalar mediator [98, 99].
Axial vectorPseudoscalar

Summary• Comprehensive dark matter search program currently being pursued at the
LHC
• Could not cover all of them in this talk
• Mono-Higgs search : arXiv:1703.05236
• Mono-top search : EXO-16-040
• DM searches at LHC largely complementary to the direct and indirect searches
• No signs of dark matter with 13 fb-1 of 13 TeV data yet
• x2 additional data from 2016 still to be analyzed
• Plus more data will start streaming in soon this year
• Stay tuned for more updates!!
19