the relationship between firm performance and executive...
TRANSCRIPT

The Relationship between Firm Performance and
Executive Pay:
Dynamics, Asymmetries, and Alternative
Performance Measures*7)
Sun Wung Hwang**8)
Woo Yong Shin***9)
Abstract
This study explores the dynamic structure of the pay-for-performance relationship in
executive compensation and quantifies the effect of introducing a more complex model of
financial performance on the estimated performance sensitivity of executive pay.
The results suggest that current compensation responds to past performance outcomes,
but that the effect decays considerably within two years. This contrasts sharply with
models of infinitely persistent performance effects implicitly assumed in much of the
empirical compensation literature.
We find that both accounting and market performance measures influence compensation
and that the salary and bonus component of pay as well as total compensation have become
more sensitive to firm financial performance over the past decades.
There is no evidence that boards fail to penalize executives for poor financial
performance or reward them disproportionately well for good performance. Finally, the
data suggest that boards may discount extreme performance outcomes both - high and
low - relative to performance that lies within some "normal" band in setting
compensation.
* This work was supported by FnGuide as fourth research support project of Korea Securities
Association in 2011 and FnGuide provided research data.
** Professor, College of Business & Economics, Chung-Ang University, Seoul, Korea
*** Instructor, College of Business & Economics, Chung-Ang University, Seoul, Korea

1. Introduction
The relationship between firm performance and executive pay has been one of
the most widely studied questions in the executive compensation literature.
A substantial theoretical literature develops optimal executive compensation
contracts that link pay to variations in firm performance as a means of aligning
the incentives of managers (the "agents") with the interests of shareholders.
This theoretical literature has spawned numerous empirical tests of the presence,
form and strength of the relationship between executive compensation and firm
financial performance. The desirability of "incentive pay" based on firm performance
has become so widely accepted that it was written into recent reforms in the
corporate income tax code intended to reduce or limit overall executive pay.
As a theoretical matter, the precise form of the optimal compensation contract
is complicated(Rosen, 1992). In general, it will depend on such factors as the
preferences of managers toward risk, the sensitivity of managerial effort to
compensation, and the information on true managerial performance provided by
the measures of firm performance that are observable by boards of directors.1)
This paper has two primary objectives. First, we examine how more complex
measures of firm performance affect the estimated pay for performance relationship.
In this analysis we allow firm performance to be measured by a vector of indicators
that includes both market return and accounting return measures of financial
performance, allows the sensitivity of pay to performance to change over time,
and allows the performance sensitivity to depend on how good or bad the firm's
financial performance has been. We believe that this richer specification of firm
financial performance is essential given that traditional measures necessarily are
noisy signals of underlying managerial performance. A broader set of measures
is likely to provide a better signal of managerial performance than does a single
unidimensional performance measure, and appears to accord more closely with
institutional descriptions of the compensation process(Milgrom and Roberts,
1992).
Our second objective is to explore the dynamic structure of the pay-for
performance relationship. A variety of different functional forms has been used
in the literature, embodying quite different implicit assumptions about the
1) Gibbons and Murphy (1990) provide one of the few analyses that report results for different functional
forms, but even their study focuses on choosing one form (using a minimum least squares based
criterion), rather than on interpreting the differences in the results.
persistence of firm performance effects on executive pay.
At one extreme are specifications that assume no memory in the compensation
process. Current compensation is influenced by current performance only; past
financial performance has no impact. At the other extreme are specifications that
assume complete persistence: current compensation is determined by current
financial performance and all previous performance realizations, with all
realizations weighted equally. Few authors have acknowledged the implication of
these differing assumptions, and this paper, along with independent work by
Boschen and Smith(1994) is among the first to test them explicitly.
2 . Literature Review
Gibbons and Murphy (1990) provide one of the few analyses that report
results for different functional forms, but even their study focuses on choosing
one form (using a minimum least squares based criterion), rather than on
interpreting the differences in the results.
Boschen and Smith (1994) use a vector autoregressive approach that relates
the level of current compensation (in logs; either salary and bonus or total
compensation) to current and past financial performance (measured by stock
market rates of return I and lagged compensation, and the level of financial
performance to current and past compensation and lagged financial performance.
Their analysis uses three lags in both compensation and market rates of return.
Their estimates, based on data for 16 firms over the 1948-1990 period, yield the
same general conclusions as our results. Past performance appears to have a
significant influence on current compensation, but the effect is not permanent.
Their study also indicates changes in performance sensitivity of pay over the
four decades spanned by their data, although the relatively small size of their
cross section may somewhat limit the generalizations one can draw from this
finding.
3. Empirical Models of the Pay- For- Performance Relationship

An extensive empirical literature investigates the sensitivity of top executive
pay to variations in firm performance. Rosen(1992) provides an overview of
many of these analyses; Sloan (1993) provides additional references to the
accounting literature on this topic.
We have identified four dimensions along which empirical analyses tend to
vary. These are:
ⅰ) The choice of performance measure (accounting-based, stock market-based,
or both)
ⅱ) Whether performance sensitivities are restricted to be the same or are
allowed to vary across firms
ⅲ) The functional form of the compensation-return specification
ⅳ) The use of absolute returns or returns relative to other firms in the same
industry or overall market.
To the best of our knowledge, the literature is uniform in imposing constant
performance coefficients over time and estimating a constant performance slope
over the entire range of the chosen performance measure. We describe below
each of these dimensions of the pay-for-performance specification and sketch its
implications for our investigation.
1) Stock-market v. accounting performance:
In the economics and finance literatures, most studies of the
pay-for-performance relationship focus on stock market-based measures of
financial performance (e.g., Murphy, 1985; Jensen and Murphy, 1990; Gibbons
and Murphy, 1990; Barro and Barro, 1990; and Hubbard and Palia, 1994). In
contrast, studies in the accounting literature typically use either
accounting-based measures of firm performance, or include both accounting and
stock market measures of performance in their analysis (e.g., Antle and Smith,
1986; Lambert and Larcker, 1987; and Sloan, 1993)2).
While the appropriate choice of performance measure is not obvious a priori, it
seems reasonable to expect both accounting and market measures of firm
financial performance to influence compensation. Boards must confront the task
of extracting information about true managerial performance from noisy financial
performance realizations. Both accounting and market returns are determined in
2) Exceptions to this division by field are Kaplan (1994), who includes both market returns and a dummy
variable for negative accounting earnings; and Joskow, Rose and Shepard (1993) and Rose and Shepard
(1994), discussed below.

part by factors beyond the control or influence of the firm's managers. To the
extent that they also are influenced by the quality of managerial inputs and
actions, they may provide useful information on managerial performance. Given
the imperfect correlation between these financial performance measures, the
theoretical literature suggests that contracting on both may enhance the firm's
ability to filter the signal of true managerial input (e.g., Holmstrom, 1979).
Institutional factors support this conclusion, as firms appear in practice to use
both measures. Compensation contracts most frequently link bonuses to
accounting earnings (Sloan, 1993) while stock-based forms of compensation,
particularly options grants, tie realized compensation to stock market returns.
We explore models that include both accounting and market-based measures in
the specification of firm performance.
2) Changes in performance sensitivities over time:
Most studies of executive compensation estimate a single return coefficient for
a panel of firms and executives over time. The primary exceptions are:
accounting studies, which tend to estimate performance slopes on a
firm-by-firm basis (e.g., Lambert and Larcker, 1987 and Sloan, 1993, who
explore how the relative market and accounting performance sensitivities vary
with their signal-to-noise ratios for each firm); Gibbons and Murphy (1992),
who find evidence that the performance sensitivity of pay varies over a CEO's
career; Schaefer (1993), who develops theoretical and empirical support for an
inverse relation between performance sensitivity and firm size (measured by
dollar changes in compensation on dollar changes in market value); and Boschen
and Smith (1994), who analyze how the pay-for-performance relationship varies
over 1948-1990 for their sample of 16 large companies.
In this study, we explore whether the sensitivity of executive pay to firm
performance has been constant over time. The rhetoric of corporate proxy
statements and business press discussions of executive compensation strongly
suggest that incentive pay has become more visible and widespread over the
last 10 years. Some empirical support for this view is provided by the
compensation levels equations estimated by Joskow, Rose, and Shepard
(hereafter, JRS, 1993)' which suggest that performance sensitivities for
unregulated industries increased steadily between 1970 and 1990.3)
3) JRS estimated separate slope coefficients over five-year intervals. While there appears to be some
additional variation within decades, the 10-year splits reported in this paper capture much of the

To accommodate potential changes in the sensitivity of executive pay to firm
performance, we estimate separate performance slopes for the early 2000s and
late 2000s.
3) Asymmetries in performance sensitivities:
We examine a variety of potential asymmetries in the responsiveness of
executive pay to variations in firm performance. Of particular interest is the
claim that executive pay packages have "more upside than downside elasticity"
(Crystal, 1992). This argument, which has attracted considerable popular
attention, suggests that executive compensation is more sensitive to positive
performance realizations than to negative performance realizations.
We test for potential asymmetries in performance sensitivities by investigating
whether compensation is unusually sensitive to very poor financial performance
(measured by accounting losses), whether compensation responds more to
performance gains than to performance losses, and whether compensation
responds differentially to performance changes that are within some "normal"
range as opposed to outside that band.
4) Functional form and the temporal structure of pay-for-performance:
This is the dimension on which empirical studies exhibit the least consistency
or consensus, even across different studies by the same author. Common
specifications correspond to regressions of the log of compensation on the share
price (e.g., Murphy, 1985), dollar compensation on the dollar market value of the
firm (e.g., Jensen and Murphy, 1990); changes in the log of compensation on the
market rate of return (e.g., Gibbons and Murphy, 1990); and the log of
compensation on the rate of return (e.g., JRS, 1993). Compensation equations
may be estimated in levels or first differences (changes in compensation)' in
which case both compensation and performance are measured as changes in the
described variables. Studies that use both accounting and market-based returns
commonly model changes in the log of compensation as a function of the level
of market return and the change in the accounting return.
These alternative specifications imply quite different dynamic models of the
compensation process. For example, a model of changes in log compensation on
the level of return implies complete persistence in the performance component of
differences over time while preserving some parsimony in the length of the estimated parameter vector
executive compensation4). A one-time shock to the firm's "normal" return
generates a permanent change in compensation, even as return recedes to its
normal level in subsequent years. Alternatively, a model of changes in log
compensation on changes in return implies that the relationship between
compensation and performance is contemporaneous only. A one-time shock to
return generates higher compensation only in the current period.
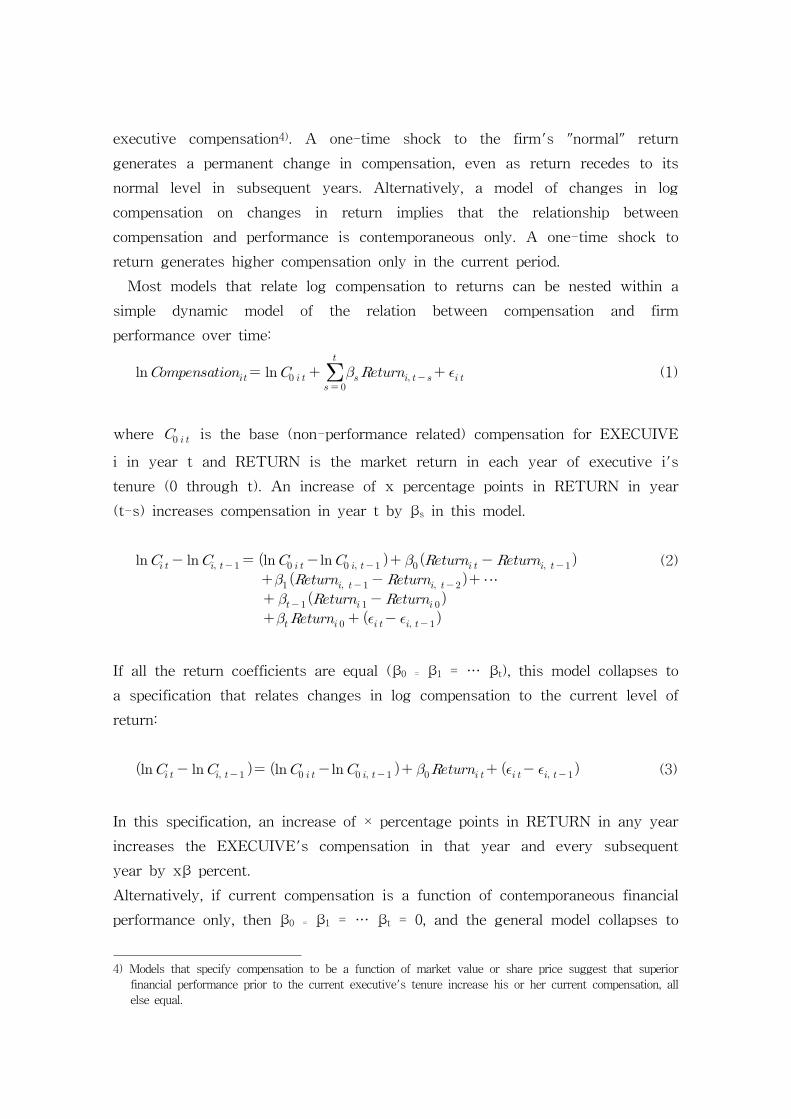
Most models that relate log compensation to returns can be nested within a
simple dynamic model of the relation between compensation and firm
performance over time:
(1)
where is the base (non-performance related) compensation for EXECUIVE
i in year t and RETURN is the market return in each year of executive i's
tenure (0 through t). An increase of x percentage points in RETURN in year
(t-s) increases compensation in year t by βs in this model.
⋯
(2)
If all the return coefficients are equal (β0 = β1 = … βt), this model collapses to
a specification that relates changes in log compensation to the current level of
return:
(3)
In this specification, an increase of × percentage points in RETURN in any year
increases the EXECUIVE's compensation in that year and every subsequent
year by xβ percent.
Alternatively, if current compensation is a function of contemporaneous financial
performance only, then β0 = β1 = … βt = 0, and the general model collapses to
4) Models that specify compensation to be a function of market value or share price suggest that superior
financial performance prior to the current executive's tenure increase his or her current compensation, all
else equal.
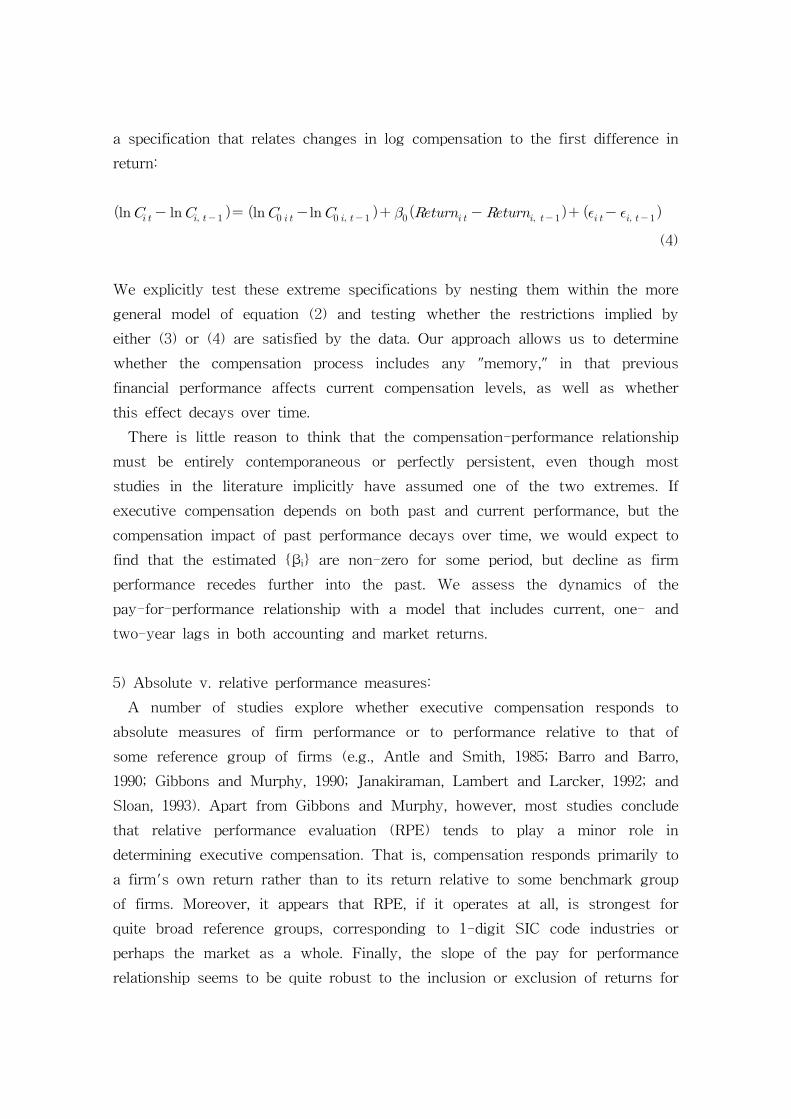
a specification that relates changes in log compensation to the first difference in
return:
(4)
We explicitly test these extreme specifications by nesting them within the more
general model of equation (2) and testing whether the restrictions implied by
either (3) or (4) are satisfied by the data. Our approach allows us to determine
whether the compensation process includes any "memory," in that previous
financial performance affects current compensation levels, as well as whether
this effect decays over time.
There is little reason to think that the compensation-performance relationship
must be entirely contemporaneous or perfectly persistent, even though most
studies in the literature implicitly have assumed one of the two extremes. If
executive compensation depends on both past and current performance, but the
compensation impact of past performance decays over time, we would expect to
find that the estimated {βi} are non-zero for some period, but decline as firm
performance recedes further into the past. We assess the dynamics of the
pay-for-performance relationship with a model that includes current, one- and
two-year lags in both accounting and market returns.
5) Absolute v. relative performance measures:
A number of studies explore whether executive compensation responds to
absolute measures of firm performance or to performance relative to that of
some reference group of firms (e.g., Antle and Smith, 1985; Barro and Barro,
1990; Gibbons and Murphy, 1990; Janakiraman, Lambert and Larcker, 1992; and
Sloan, 1993). Apart from Gibbons and Murphy, however, most studies conclude
that relative performance evaluation (RPE) tends to play a minor role in
determining executive compensation. That is, compensation responds primarily to
a firm's own return rather than to its return relative to some benchmark group
of firms. Moreover, it appears that RPE, if it operates at all, is strongest for
quite broad reference groups, corresponding to 1-digit SIC code industries or
perhaps the market as a whole. Finally, the slope of the pay for performance
relationship seems to be quite robust to the inclusion or exclusion of returns for

alternative reference groups (see Gibbons and Murphy, 1990). In light of these
previous results, and to limit the dimension of the performance parameter vector
we estimate, we adopt a specification that implicitly measures return and
compensation relative to the overall market (by including individual year effects
in the regression model), but do not investigate the RPE hypothesis any further
5).
4 . Data and Empirical Methodology
We model executive compensation as a function of firm scale, firm financial
performance, executive characteristics, and industry and market-wide norms in
executive pay. The data used to measure these variables are described below.
We next sketch the basic regression model, which is similar to models used by
JRS(1993) to investigate compensation differentials across regulated and
unregulated industries and by Rose and Shepard(1994) to explore the effects of
firm diversification on compensation. We finally summarize our tests of the key
restrictions on the performance sensitivity parameters of executive pay that are
implicit in this model.
1) Data
Our data base is developed from three primary sources. Information on
executive compensation and executive characteristics were obtained from KRX
and annual executive compensation over 2002-2010. Information on firm
characteristics, accounting profitability, and fiscal year stock market returns are
from FnGuide(DataGuide) data. To reduce non-comparability across firms we
exclude those in industries subject to economic regulation and those in financial
services, using KRX's SIC code assignment to determine industry affiliation.
Because some of the specifications that we present include first differences in
compensation and up to two-period lags in performance variables, we work with
a basic sample of executive-years for which we observe at least one prior year
5) We also include aggregated 2-digit SIC industry fixed effects, which implicitly control for industry
average performance over the entire sample period (see JRS for a description). The dimension of the
performance parameter space (K) for our chosen specification suggests the prudence of suppressing an
explicit investigation of RPE parameters, which would increase the parameter vector to 2K. In our simpler
specifications, K=10; this increases quickly to K=20 or K=30 as we relax various restrictions.

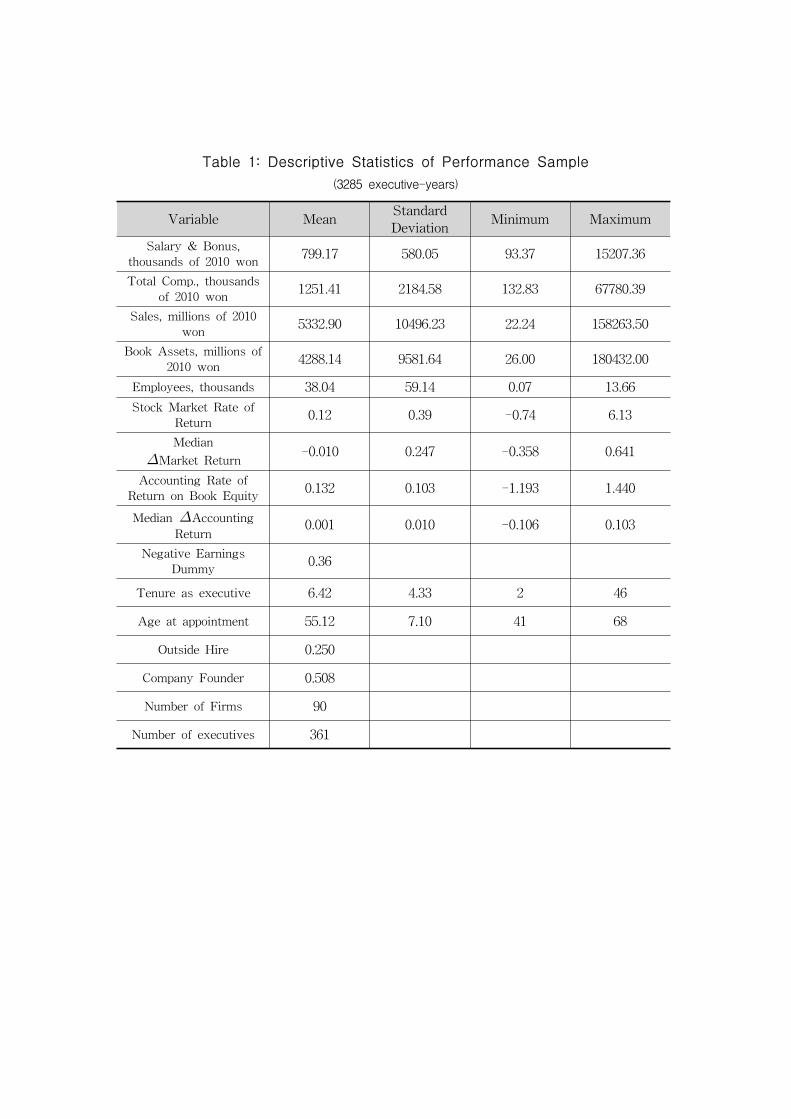
of compensation and three prior years of performance data. These criteria yield
a panel data set of 3285 observations on 361 executives in 90 firms(top 200
companies, excluding financial firms). Descriptive statistics for this sample are
reported in Table 1. Variables are described below.
ⅰ) Compensation Measures: We report results for two measures of
compensation.
The first, SALARY, includes current and deferred salary and bonus. This
generally is the least inclusive measure of compensation reported by KRX, and
its definition is relatively consistent over the entire sample period we analyze.
Real SALARY, in 2010 constant won, grew at an average annual rate of 4.5%
for our sample, and averaged ₩782,045 overall. Despite this growth, SALARY
accounts for a decreasing share of overall compensation over time.
The second measure of compensation, TOTAL, is the most inclusive
compensation measure reported by KRX. TOTAL includes salary and bonus,
contingent compensation excluded from SALARY, the cash value of
company-provided benefits (such as company-paid life insurance, private
automobiles, and drivers), and realized net gains from the exercise of stock
options, stock appreciation rights, and stock accrual rights. TOTAL
compensation in 2010 constant won averaged ₩3,025 million for our sample, and
at an average annual rate of 5.4% between 2002 and 2010. While TOTAL
compensation we have, its treatment of stock options, appreciation rights, and
accrual rights prevent it from accurately measuring overall current compensation
6).
ⅱ) Firm Scale: The relationship between CEO compensation and firm size is
one of the most consistent empirical results in the compensation literature, with
most studies reporting a compensation elasticity with respect to firm
revenues(SALES) of about 0.25(Rosen, 1992). We have experimented with a
variety of scale measures, including SALES, book assets, and employees. The
firms in our sample are large on all three dimensions. They average ₩12,893
6) As noted in JRS (1993), an ideal measure of total compensation would include the ex ante value of
options grants (or similar instruments) in the year they are awarded and the ex post change in the value
of previously awarded (as yet unexercised and unexpired) options each year. It seems impossible to
construct these exact measures, and difficult to construct even close approximations to them, from 1970
through 1990 proxy statements. SEC reporting requirements in place for 1 993 and subsequent years'
proxy statements should make these calculations more feasible in the future.

million in 2010 constant sales, ₩4,288 million in constant 2010 assets, and
123,000 employees. Because the estimated pay-for-performance relationship
appears to be reasonably robust to alternative definitions of firm scale, we
report results only for specifications that use SALES, the dominant measure of
firm scale in the compensation literature.
ⅲ) Firm Financial Performance: The basic constructs that we use to measure
firm performance are stock market rates of return and accounting rates of
return. The market return(MKTROR) is the annual rate of return to common
equity shareholders during the firm's reported fiscal year, and is constructed
from market interest rate. The accounting rate of return(ACCROE) is defined as
reported earnings excluding extraordinary items divided by total common equity
(book value), and is constructed from FnGuide & KRX data7). Although the
means of these two return measures are roughly comparable, stock market
returns exhibit much greater variance: MEDIAN-MKTROR and
MEDIAN-ACCROE are variables that denote the annual median change in
market and accounting returns, respectively, for the full JRS dataset of
unregulated, nonfinancial companies. We use these variables to separate our
sample observations into companies that have close to median performance
changes in a given year and those whose performance change is substantially
above or below the median. This allows us to test whether performance
sensitivities are dampened at the high or low extremes of performance.
ⅳ) Executive Characteristics: The levels equations model log compensation as a
function of executive characteristics as well as the variables described above.
These characteristics include the executive's tenure in the executive
position(TENURE), his/her age at appointment to the executive position(AGE),
an indicator variable for whether the executive was an appointment from outside
the firm as opposed to an internal promotion(OUTSIDE), and an indicator
variable for whether the executive was the founder of the firm(FOUNDER).
These variables and their empirical effects on compensation are described in
considerable detail in JRS(1993).
7) This definition poses a problem when a firm's chronic accounting losses drive the book value of its
common equity through zero. We define ACCROE to be missing if the book value of equity is negative
and therefore exclude these observations from the basic dataset.
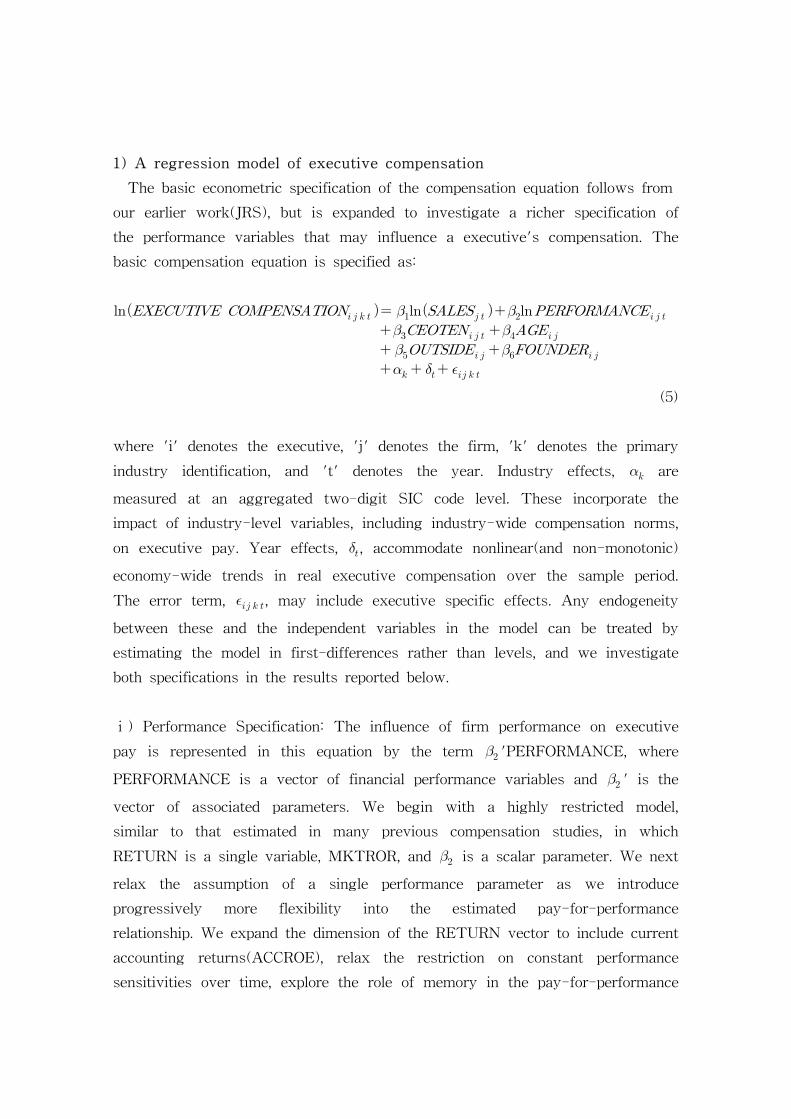
1) A regression model of executive compensation
The basic econometric specification of the compensation equation follows from
our earlier work(JRS), but is expanded to investigate a richer specification of
the performance variables that may influence a executive's compensation. The
basic compensation equation is specified as:
(5)
where 'i' denotes the executive, 'j' denotes the firm, 'k' denotes the primary
industry identification, and 't' denotes the year. Industry effects, are
measured at an aggregated two-digit SIC code level. These incorporate the
impact of industry-level variables, including industry-wide compensation norms,
on executive pay. Year effects, , accommodate nonlinear(and non-monotonic)
economy-wide trends in real executive compensation over the sample period.
The error term, , may include executive specific effects. Any endogeneity
between these and the independent variables in the model can be treated by
estimating the model in first-differences rather than levels, and we investigate
both specifications in the results reported below.
ⅰ) Performance Specification: The influence of firm performance on executive
pay is represented in this equation by the term 'PERFORMANCE, where
PERFORMANCE is a vector of financial performance variables and ' is the
vector of associated parameters. We begin with a highly restricted model,
similar to that estimated in many previous compensation studies, in which
RETURN is a single variable, MKTROR, and is a scalar parameter. We next
relax the assumption of a single performance parameter as we introduce
progressively more flexibility into the estimated pay-for-performance
relationship. We expand the dimension of the RETURN vector to include current
accounting returns(ACCROE), relax the restriction on constant performance
sensitivities over time, explore the role of memory in the pay-for-performance

relationship, and finally test for asymmetries in performance sensitivities.
5 . Empirical Results
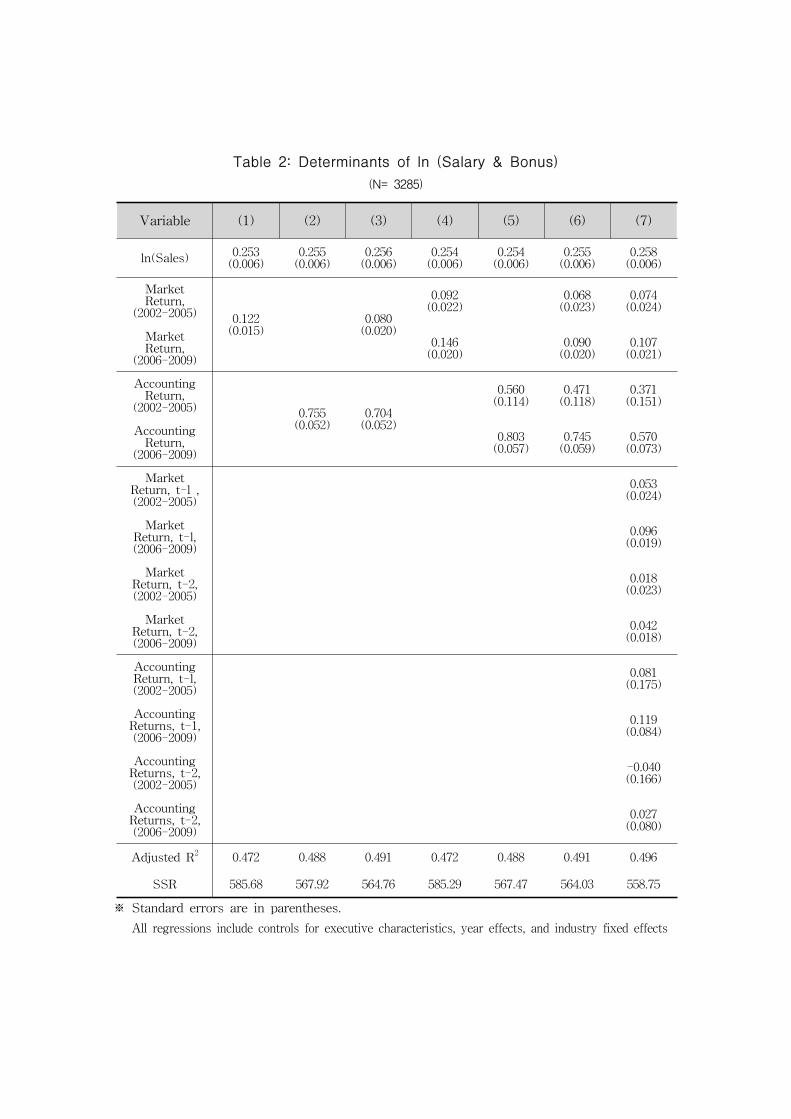
Table 2 presents results from compensation level equations that use In(Salary
& Bonus) as the dependent variable. To keep the size of the tables manageable,
we suppress all coefficients except those for firm size and the performance
measures. Column 1 displays results for the simplest model, which includes
current stock market return as the sole performance measure and restricts the
performance semi-elasticity to be the same for all observations. The coefficient
on market return implies that a 10 percentage point increase in the market
return8) increases salary and bonus by roughly 1.2% (standard error, 0.2%). This
is broadly similar to results from previous empirical studies(see Rosen, 1992).
Column 2, which substitutes the accounting rate of return as the single
performance measure, implies that a 10 percentage point(average) increase in
accounting return.
The results in column 3 include both accounting and market returns, and
suggest that both measures are important determinants of executive pay. In this
specification, the pay sensitivity to a 10 percentage point movement in return is
0.8%(0.2%) for market returns and 6.9%(0.5%) for accounting returns. Thus,
even when both return measures are included in the regression, the
semi-elasticity of pay is an order of magnitude larger for accounting returns
than for market returns. This pattern is consistent with results from previous
studies that have included accounting rates of return and with the observation
that compensation contracts are much more likely to base bonuses on explicit
accounting performance targets than on market-based targets. Given the
economic and statistical significance of both accounting and market returns in
determining executive pay, we focus our remaining attention on specifications
that include both measures.
Columns 4 through 6 repeat the first three specifications, but allow the
performance slopes to differ between the 2002-2005 and 2006-2009. The data
clearly reject the restriction of constant slopes over time. In column 6, which
allows both market and accounting return parameters to differ over time, the
performance slopes increase by one-third to one-half between the early 2000s
8) about one-quarter of the sample standard deviation of MKTROR

and late 2000s. This suggests that the increasing emphasis on incentive pay
over the sample period carries through to salary and bonus decisions and is not
solely a function of increased use of stock options in compensation packages.
Finally, column 7 estimates the more general dynamic performance
specification, based on equation (1). This column reports results that include
current and two lags for each return measure. The results from this model of
compensation level strongly reject both of the simple models of
pay-for-performance dynamics: past performance has an influence on current
compensation, but that influence is not perfectly persistent over time.
The dynamic pattern of performance effects on compensation differs
considerably between accounting and market performance measures. The
estimated overall impact of accounting return on pay is roughly constant
between the contemporaneous-only (column 6) and general dynamic(column 7)
specifications, but including lagged accounting returns shifts about 20% of the
estimated weight to the previous years' return measures. The results suggest
that a 10 percentage point increase in accounting returns during the 2006-2009
generates an average cumulative increase in salary and bonus equivalent to 7%
of one year's compensation.
In contrast, the estimated impact of market returns on executive pay is
substantially higher in the unrestricted dynamic model, relative to the
contemporaneous-only model of column 6. The effect of current market return
on current pay is slightly higher in column 7 than in column 6(though within
one standard error), and the lagged market return terms more than double that
impact.
We explore the intertemporal structure of the pay-for-performance relationship
in further detail in table 3, using first-difference models of compensation. These
regressions model changes in In(SALARY) as a function of changes in
In(SALES), year and industry effects, and alternative specifications of the
performance measures. To limit the size of the table, we use changes in
accounting return in all specifications that include an accounting measure of
performance. We vary the specifications to examine both levels of market return
and changes in market return.
Columns 1, 2, and 3 in table 3 model changes in In(SALARY) as a function
of changes in market returns. These correspond to simple first-difference
estimates of the specifications reported in columns 1, 2, and 6 of table 2. These
restricted models, based on equation (3), implicitly assume no "memory" in the
compensation process: a one-time shock to return generates a one-time shock to
compensation. The estimated coefficients are considerably smaller than those
reported in table 2, suggesting that positive correlations between unobserved
executive-specific effects and firm performance may overstate the performance
sensitivity of pay in compensation levels equations.
Columns 4 and 5 of table 3 model changes in In (SALARY) as a function of
the level of market return. These correspond to the restricted model of equation
(4), which assumes that performance effects are perfectly (and infinitely)
persistent: a one-time shock to the firm's market return triggers a permanent
increase in current and future compensation. These results imply much greater
sensitivity of executive pay to market returns than do the column 1-3 results.
These estimates are comparable to those reported by Gibbons and
Murphy(1990) for a somewhat different Forbes sample and slightly modified, but
similar, compensation equations9).
The choice of functional form makes a significant difference to the fit of these
restricted equations. A minimum least squared errors test would prefer the
restricted model of equation (4) to the restrictions imposed by equation (3)
(compare the SSR of columns 1 and 4 or of columns 3 and 5). If one is forced
to choose between one of these two highly simplified specifications, assuming
that performance effects are perfectly persistent appears to better satisfy the
data. As in the levels equations, however, this specification is strongly rejected
in favor of the more general dynamic model of equations (1) and (2).
Column 6 of table 3 reports results for the general dynamic performance
structure. This model corresponds to first-difference estimates of the
specification reported in column 7 of table 2, and is based on the first-difference
equation (2). These estimates decisively reject both the restriction that
performance effects are contemporaneous only and the restriction that the
performance coefficients are constant over time. The pattern of coefficients
highlights the reasons these restrictions are rejected.
Finally, we note that the market return estimates from the general dynamic
first difference model in column 6, table 3, are quite similar to those of the
9) The Gibbons and Murphy sample covers a shorter time period (1974-1986) but larger sample of
CEO-years than does ours (due partially to our exclusion of financial sector and regulated firms and the
elimination of the first three years of each CEO's tenure due to the data requirements of our lagged
return structure tests) Gibbons and Murphy do not include sales and do include various industry return
measures as variables in their compensation equations.
levels model in column 7 of table 2. This may suggest that the differences
between these two estimation methods for the contemporaneous-only model are
due more to mis-specification of the pay-for-performance relationship than to
correlation between returns and a executive-specific component of the error
term.
For completeness, we report in column 7 of table 3 estimates from a first
difference model that uses the level of market return and its lags rather than
first differences in market return. This is similar to the model that assumes
completely persistent market performance effects in compensation(e.g., column 5
of table 3). If this assumption is correct, the coefficients on the lagged market
return terms should be zero. As expected from the results in column 6, which
nest this model as a special case, the data reject this restriction. For the
2006-2009, the previous year's market return has a slightly larger impact on
current compensation than does the current year's return.
Given the superiority of the general dynamic specification in both the levels
and first-difference equations, we focus our attention on variants of this model
in the remaining analysis.
Table 4 replicates the analysis of Tables 2 and 3 using total compensation
(TOTAL) rather than salary and bonus as the measure of executive pay.
Column 1 reports the simplest performance specification (market return only,
with slopes split by decade) for comparability with table 2 and previous studies.
Columns 2 and 3 report results from the "full dynamic" specification, estimated
in levels (2) and first differences (3). Total compensation is, not surprisingly,
more responsive to market performance variations than is salary and bonus, and
the sensitivity increased markedly during the 2006-2009. As in the salary and
bonus results, past performance influences current compensation but the effect
decays after the first lag. This is more than twice the cumulative market return
effect on salary and bonus (column 6, table 3).
As our final step in modelling the pay-for-performance relationship, we
explore potential asymmetries in the impact of performance on executive
compensation. We consider three types of possible asymmetries. First, is
compensation unusually responsive (or non-responsive) to accounting losses?
Second, does compensation respond differently to performance gains than to
performance losses? Third, does compensation respond differently to unusually
large changes in performance than to changes within some "normal" range?

Table 5 reports results of these tests for salary and bonus; table 6 repeats the
analysis for total compensation. Both tables use the first difference specification
of In(compensation) with the general dynamic return structure(as in column 7,
table 3, and column 3, table 4). To simplify the exposition, we report coefficients
only for the contemporaneous return measures; the patterns of coefficients on
the lagged performance terms tend to be similar but noisier.
In column 1 of tables 5 and 6 we modify our basic specification to include a
separate control for negative accounting earnings. To test whether accounting
losses shift the level of compensation beyond that predicted by the slope
coefficient on accounting return, we estimate these first difference models
using the change in an indicator variable that equals one in years with reported
accounting losses.
The results suggest that accounting losses reduce compensation beyond their
direct effect through the accounting return variable.
Finally, we explore whether compensation responds differentially to unusually
large changes in performance. The definition of an "unusually large change
inperformance" is fairly arbitrary. We operationalize it as follows. For each
firm-year we compare the change in each return measure to the median change
in that return measure across all firms in the JRS dataset. We then divide the
observations into three classes: those in which the change in return was
"substantially" below the median change, those within a band around the median
change, and those "substantially" above the median change. We have
experimented with several numerical thresholds for "substantial." The results
reported in the paper use thresholds of more than 20 percentage points above or
below the median change in market return, and more than 2 percentage points
above or below the median change in accounting return. The distribution of
observations using these thresholds is given in table 7. Forty-two percent of the
observations fall within the median band for market return and 52 percent of
the observations fall within the median band for accounting return under these
definitions.
The results are reported in the last columns of tables 5 and 6. For parsimony
and because the data generally do not reject the restriction of common slope
coefficients for observations above and below the median band, we report a
single coefficient for these observations (denoted as "outside the median band").
For accounting returns, compensation may be much more responsive to changes

within the median band than to changes outside the median band. The
accounting return coefficients differ by roughly a factor of two or more for both
salary and bonus and total compensation, although the point estimates are
sufficiently noisy that the restriction of common slopes across the return range
cannot be rejected. This pattern would be consistent with some smoothing by
boards of directors when accounting earnings experience unusually large
movements from one year to the next. For market returns, the results suggest
roughly constant performance sensitivity across the entire range: the point
estimates generally are quite close and well within the statistical margin of
error from each other. These results suggest no evidence of compensation
smoothing in response to even quite large fluctuations in market returns.
6 . C onclusions
The results of this study suggest that the pay-for-performance relationship is
considerably richer than the models typically incorporated into most previous
studies.
Compensation is sensitive to both accounting and market measures of firm
performance, and the sensitivity of executive pay to firm performance has
increased considerably during the 2000s. This increased performance sensitivity
is due to more than increased used of stock options in compensation packages,
as it carries through to salary and bonus decisions as well.
We find that the dynamic structure of the pay for performance relationship is
more complex than implied by the specifications used in earlier compensation
analyses. Past financial performance has an effect on current compensation, but
the effect appears to decay substantially over two to three years. For market
returns, current compensation is influenced as much or more by the previous
year's market return(relative to current market returns), but returns more
distant than this have a relatively small compensation impact. For accounting
returns, the compensation impact decays almost proportionally over time. Our
results suggest that failure to model the full dynamic structure of the
pay-for-performance relationship may have important consequences for both the
magnitude and interpretation of estimated performance sensitivities.
Finally, we find no evidence for the popular view that boards of directors tend

to reward good performance and ignore poor performance in setting
compensation. Indeed, the strongest evidence of asymmetry in the
pay-for-performance relationship is an additional compensation penalty for
exceptionally poor accounting performance.
While our estimates of performance sensitivities do not alter the general
conclusion that changes in managerial compensation resulting from superior
financial performance of the firm are small in comparison to changes in total
shareholder wealth, the compensation effects are nonetheless economically
important.

Reference
Andrew, A. O., and T. M. Welbourne., 2000. "The People/Performance Balance
in IPO Firm: The Effect of the Chief Executive Officer's Financial
Orientation," Entrepreneurship Theory and Practice 25(1), pp.93-106.
Antle, Rick and Abbie Smith., 1986. "An Empirical Investigation of the Relative
Performance Evaluation of Corporate Executives." Journal of Accounting
Research 24: pp.1-39.
Bamford, C., G. Bruton, and Y. Hinson., 2006. "Founder/Chief Executive Officer
Exit: A Social Capital Perspective of New Ventures," Journal of Small
Business Management 44(2), pp.207-220.
Barro, Jason R. and Robert J. Barro., 1990. "Pay, Performance, and Turnover of
Bank CEOs," Journal of Labor Economics. 8: pp.448-481.
Boschen, John F. and Kimberly J. Smith., 1994. "You Can Pay Me Now and
You Can Pay Me Later: The Dynamic Response of Executive
Compensation to Firm Performance." College of William and Mary: mimeo,
May.
Cheng, S., 2008, Board size and the variability of corporate performance, Journal
of Financial Economics 87, pp.157-176
Crystal, Graef S., 1992. In Search of Excess. New York: W.W. Norton.
Fahlenbrach, R., A. Low, and R.M. Stulz, 2010. "Why do Firms Appoint CEOs
as Outside Directors? Journal of Financial Economics 97, pp.12-32.
Faleye, O., 2007, Classified boards, Firm Value, and Managerial Entrenchment,
Journal of Financial Economics 83, pp.501-529.
Gibbons, Robert and Kevin J. Murphy., 1990. "Relative Performance Evaluation
for Chief Executive Officers." Industrial and Labor Relations Review. 43:
pp.30-51.

Gibbons, Robert and Kevin J. Murphy., 1992 "Optimal Incentive Contracts in the
Presence of Career Concerns: Theory and Evidence." Journal of Political
Economy 100: pp.468-505.
Holmstrom, Bengt., 1979. "Moral Hazard and Observability." RAND Journal of
Economics 10: pp.74-91.
Hubbard, R. Glenn and Darius Palia., 1994. "Executive Pay and Performance:
Evidence from the Banking Industry." NBER Working Paper No. 4704.
Janakiraman, Surya N., Richard A. Lambert, and David F. Larcker., 1992. "An
Empirical Investigation of the Relative Performance Evaluation Hypothesis."
Journal of Accounting Research 30: pp.53-69.
Jensen, Michael C. and Kevin J. Murphy., 1990. "Performance Pay and
Top-Management Incentives." Journal of Political Economy. 98: pp.225-264.
Joskow, Paul, Nancy Rose, and Andrea Shepard., 1993. "Regulatory Constraints
on CEO Compensation." Brookings Papers on Economic Activity -
Microeconomics Microeconomics I: pp.1-58, pp.70-72.
Kaplan, Steven N., 1994. "Top Executive Rewards and Firm Performance: A
Comparison of Japan and the U. S." Journal of Political Economy 102:
pp.510-546.
Lambert, Richard A., 1983. "Long-term Contracts and Moral Hazard." Bell
Journal of Economics 14: pp.441-452.
Lambert, Richard A., 1993. "The Use of Accounting and Security Price Measures
of Performance in Managerial Compensation Contracts: A Discussion."
Journal of Accounting and Economics 16: pp.101-123.
Lambert, Richard A. and David F. Larcker., 1987 "An Analysis of the Use of
Accounting and Market Measures of Performance in Executive
Compensation Contracts." Journal of Accounting Research 25: pp.85-125.

Masulis, R., C. Wang, and F. Xie, 207, "Corporate Governance and Acquirer
Return," Journal of Finance 62: pp.1851-1889.
Milgrom, Paul R. and John Roberts., 1992. Economics, Organizations, and
Management. Englewood Cliffs, N.J.: Prentice-Hall, Inc.
Murphy, Kevin J., 1985. "Corporate Performance and Managerial Remuneration:
An Empirical Analysis." Journal of Accounting and Economics. 7: pp.11-42.
O'Reilly, Charles A. III, Brian G. Main, and Graef S. Crystal., 1988. "CEO
Compensation as Tournament and Social Comparison: A Tale of Two
Theories." Administrative Science Quarterly. 33: pp.257-274.
Rose, Nancy L. and Andrea Shepard., 1994. "Firm Diversification and CEO
Compensation: Managerial Ability or Executive Entrenchment?" NBER
Working Paper.
Rosen, Sherwin., 1992. "Contracts and the Market for Executives." In Lars
Wernin and Hans Wijkander, eds., Contract Economics. Oxford: Basil Black
well.
Schaefer, Scott., 1993. "The Dependence of CEO Pay-Performance Sensitivity on
the Value of the Firm." Mimeo, Graduate School of Business, Stanford
University.
Sloan, Richard G., 1993. "Accounting Earnings and Top Executive
Compensation." Journal of Accounting and Economics 16: pp.55-100.
Variable MeanStandard
DeviationMinimum Maximum
Salary & Bonus,
thousands of 2010 won799.17 580.05 93.37 15207.36
Total Comp., thousands
of 2010 won1251.41 2184.58 132.83 67780.39
Sales, millions of 2010
won5332.90 10496.23 22.24 158263.50
Book Assets, millions of
2010 won4288.14 9581.64 26.00 180432.00
Employees, thousands 38.04 59.14 0.07 13.66
Stock Market Rate of
Return0.12 0.39 -0.74 6.13
Median
Market Return -0.010 0.247 -0.358 0.641
Accounting Rate of
Return on Book Equity0.132 0.103 -1.193 1.440
Median Accounting
Return0.001 0.010 -0.106 0.103
Negative Earnings
Dummy0.36
Tenure as executive 6.42 4.33 2 46
Age at appointment 55.12 7.10 41 68
Outside Hire 0.250
Company Founder 0.508
Number of Firms 90
Number of executives 361
Table 1: Descriptive Statistics of Performance Sample
(3285 executive-years)
Variable (1) (2) (3) (4) (5) (6) (7)
ln(Sales) 0.253(0.006)
0.255(0.006)
0.256(0.006)
0.254(0.006)
0.254(0.006)
0.255(0.006)
0.258(0.006)
Market Return,
(2002-2005) 0.122(0.015)
0.080(0.020)
0.092(0.022)
0.068(0.023)
0.074(0.024)
Market Return,
(2006-2009)
0.146(0.020)
0.090(0.020)
0.107(0.021)
AccountingReturn,
(2002-2005) 0.755(0.052)
0.704(0.052)
0.560(0.114)
0.471(0.118)
0.371(0.151)
AccountingReturn,
(2006-2009)
0.803(0.057)
0.745(0.059)
0.570(0.073)
Market Return, t-l ,
(2002-2005)
0.053(0.024)
Market Return, t-l,
(2006-2009)
0.096(0.019)
Market Return, t-2,(2002-2005)
0.018(0.023)
Market Return, t-2,(2006-2009)
0.042(0.018)
AccountingReturn, t-l,
(2002-2005)
0.081(0.175)
AccountingReturns, t-1,
(2006-2009)
0.119(0.084)
AccountingReturns, t-2,
(2002-2005)
-0.040(0.166)
AccountingReturns, t-2,
(2006-2009)
0.027(0.080)
Adjusted R2 0.472 0.488 0.491 0.472 0.488 0.491 0.496
SSR 585.68 567.92 564.76 585.29 567.47 564.03 558.75
Table 2 : Determinants of ln ( Salary & Bonu s)
(N= 3285)
※ Standard errors are in parentheses.
All regressions include controls for executive characteristics, year effects, and industry fixed effects

(1) (2) (3) (4) (5) (6) (7)
Market Return level -- level level level level level
ln(Sales) 0.261(0.023)
0.189(0.023)
0.197(0.023)
0.212 (0.023)
0.162(0.023)
0.170(0.023)
0.156(0.023)
Market Return,
(2002-2005) 0.035(0.006)
0.025(0.010)
0.097(0.009)
0.056(0.013)
0.040(0.011)
0.051(0.014)
Market Return,
(2006-2009)
0.020(0.008)
0.093(0.010)
0.078(0.010)
0.082(0.012)
AccountingReturn,
(2002-2005) 0.518(0.034)
0.358(0.076)
0.313(0.078)
0.385(0.082)
0.369(0.084)
AccountingReturn,
(2006-2009)
0.532(0.038)
0.497(0.038)
0.573(0.041)
0.584(0.042)
Market Return, t-l ,
(2002-2005)
0.028(0.012)
-0.0003(0.014)
Market Return, t-l,
(2006-2009)
0.095(0.011)
0.023(0.011)
Market Return, t-2,(2002-2005)
0.009(0.008)
-0.008(0.013)
Market Return, t-2,(2006-2009)
0.042(0.009)
-0.049(0.010)
AccountingReturn, t-l,
(2002-2005)
0.178(0.087)
0.147(0.090)
AccountingReturns, t-1,
(2006-2009)
0.222(0.045)
0.229(0.046)
AccountingReturns, t-2,
(2002-2005)
0.127(0.087)
0.098(0.090)
AccountingReturns, t-2,
(2006-2009)
0.082(0.043)
0.089(0.044)
Adjusted R2 0.073 0.112 0.115 0.091 0.127 0.141 0.130
SSR 195.75 187.70 187.04 192.10 184.38 181.44 181.90
Table 3 : Determinants of ln ( Salary & Bonu s)
(N= 3285)
※ Standard errors are in parentheses.
All regressions include year and industry fixed effects.
Market returns are in levels or differences as specified in the column header.
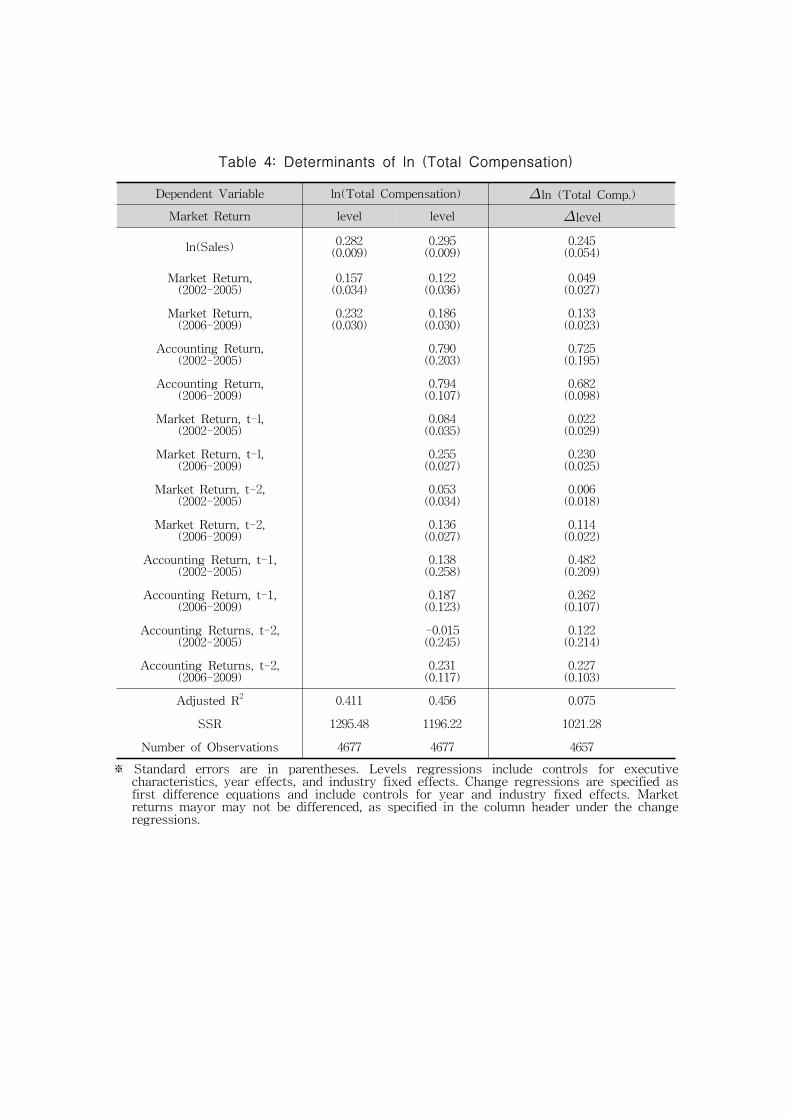
Dependent Variable ln(Total Compensation) ln (Total Comp.)
Market Return level level level
ln(Sales) 0.282(0.009)
0.295(0.009)
0.245(0.054)
Market Return, (2002-2005)
0.157(0.034)
0.122(0.036)
0.049(0.027)
Market Return,(2006-2009)
0.232(0.030)
0.186(0.030)
0.133(0.023)
Accounting Return,(2002-2005)
0.790(0.203)
0.725(0.195)
Accounting Return, (2006-2009)
0.794(0.107)
0.682(0.098)
Market Return, t-l,(2002-2005)
0.084(0.035)
0.022(0.029)
Market Return, t-l, (2006-2009)
0.255(0.027)
0.230(0.025)
Market Return, t-2,(2002-2005)
0.053(0.034)
0.006(0.018)
Market Return, t-2,(2006-2009)
0.136(0.027)
0.114(0.022)
Accounting Return, t-1,(2002-2005)
0.138(0.258)
0.482(0.209)
Accounting Return, t-1,(2006-2009)
0.187(0.123)
0.262(0.107)
Accounting Returns, t-2,(2002-2005)
-0.015(0.245)
0.122(0.214)
Accounting Returns, t-2,(2006-2009)
0.231(0.117)
0.227(0.103)
Adjusted R2 0.411 0.456 0.075
SSR 1295.48 1196.22 1021.28
Number of Observations 4677 4677 4657
Table 4: Determinants of ln ( Total Compensation)
※ Standard errors are in parentheses. Levels regressions include controls for executive characteristics, year effects, and industry fixed effects. Change regressions are specified as first difference equations and include controls for year and industry fixed effects. Market returns mayor may not be differenced, as specified in the column header under the change regressions.

(1) (2) (3)
Return coefficient differs by:
Singlecoefficient
Negativereturn
Positivereturn
Insidemedian band
Outsidemedian band
Market return, (2002-2005)
0.041(0.011)
0.062(0.021)
0.047(0.015)
0.019(0.030)
0.035(0.011)
Market return, (2006-2009)
0.079(0.009)
0.066(0.016)
0.096(0.015)
0.101(0.033)
0.077(0.010)
Accounting return,
(2002-2005)
0.327(0.091)
0.790(0.144)
0.063(0.118)
1.464(0.534)
0.379(0.082)
Accounting return,
(2006-2009)
0.423(0.047)
0.575(0.056)
0.556(0.073)
1.311(0.440)
0.572(0.041)
Negative Earnings dummy,
(2002-2005)
0.052(0.035)
Negative Earnings dummy,
(2006-2009)
-0.121(0.018)
Adjusted R2 0.150 0.147 0.13
SSR 179.64 180.31 179.69
Number of Observations 4697 4697 4677
Table 5 : Asy mmetries in Pay - for- Performance, ln( Salary & Bonu s)
※ Standard errors are in parentheses. All regressions include additional lagged first differences in returns, first differences in sales, and year and industry fixed effects. See text for additional description of this table.

(1) (2) (3)
Return coefficient differs by:
Singlecoefficient
Negativereturn
Positivereturn
Insidemedian band
Outsidemedian band
Market return, (2002-2005)
0.048(0.027)
0.014(0.052)
0.089(0.037)
0.005(0.073)
0.049(0.027)
Market return, (2006-2009)
0.134(0.023)
0.165(0.038)
0.113(0.035)
0.143(0.078)
0.133(0.023)
Accounting return,
(2002-2005)
0.754(0.220)
0.998(0.347)
0.543(0.283)
1.381(1.283)
0.715(0.196)
Accounting return,
(2006-2009)
0.511(0.112)
0.684(0.135)
0.661(0.174)
1.421(1.050)
0.676(0.099)
Negative Earnings dummy,
(2002-2005)
0.019(0.085)
Negative Earnings dummy,
(2006-2009)
0.019(0.085)
Adjusted R2 0.077 0.076 0.066
SSR 1019.00 1019.85 1018.34
Number of Observations 321 321 321
Table 6: Asy mmetries in Pay - far- Performance, ln ( Total Compensation)
※ Standard errors are in parentheses. All regressions include additional lagged first differences in returns, first differences in sales, and year and industry fixed effects. See text for additional description of this table.

Category Mean returnNumber of
observations
Market Returns:
Market return more than 0.20
below median mkt return-0.528 110
Market return within 0.20 of median mkt return
-0.027 152
Market return more than 0.20 above median mkt return
0.482 98
Accounting returns:
Accounting return more than 0.02 below median acc return
-0.092 91
Accounting return within 0.02 of median acc return
0.002 189
Accounting return more than 0.02
above median acc return0.084 81
Table 7: Distribu tion of Observations Below, Within, and Above Median Band of Retu rn
※ The median return is defined for each year over the full set of firms in the JRS dataset.
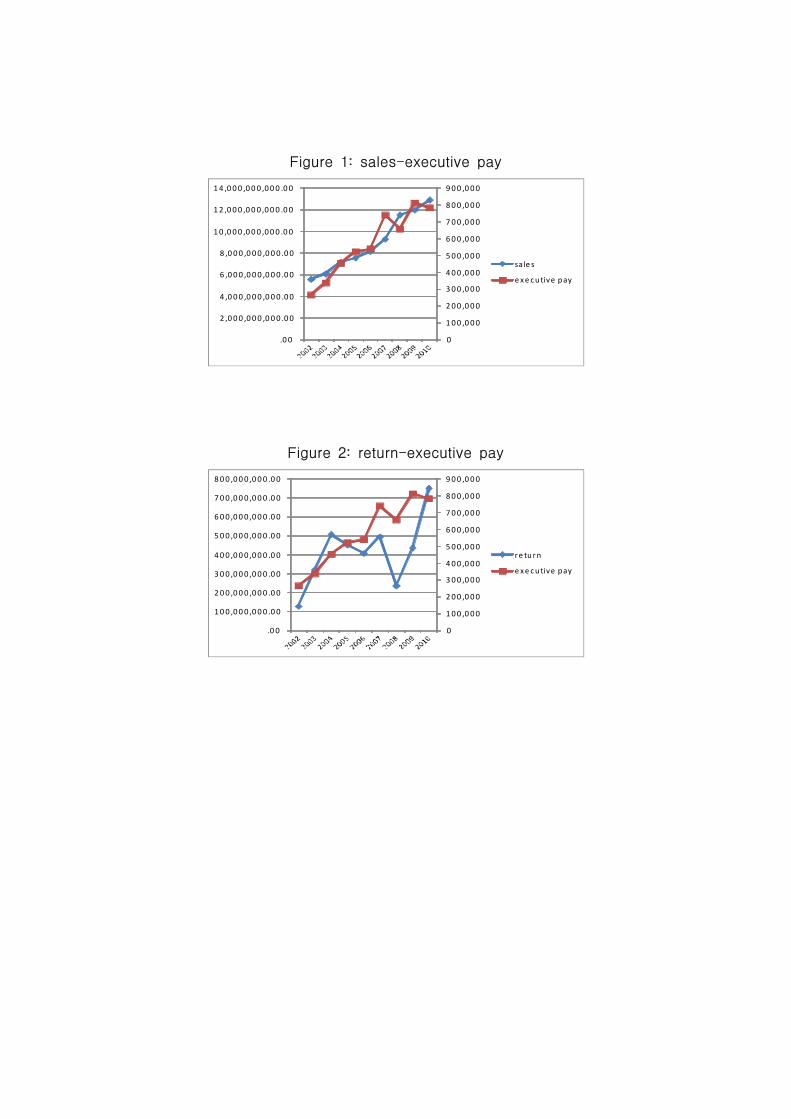
Figu re 1: sales- ex ecu tive pay
0
100 ,0 00
200 ,0 00
300 ,0 00
400 ,0 00
500 ,0 00
600 ,0 00
700 ,0 00
800 ,0 00
900 ,0 00
.0 0
2 ,0 00 ,0 00 ,0 00 .00
4 ,0 00 ,0 00 ,0 00 .00
6 ,0 00 ,0 00 ,0 00 .00
8 ,0 00 ,0 00 ,0 00 .00
10 ,0 00 ,0 00 ,000 .0 0
12 ,0 00 ,0 00 ,000 .0 0
14 ,0 00 ,0 00 ,000 .0 0
sale s
e xe cu tive pay
Figu re 2 : retu rn- ex ecu tive pay
0
100 ,0 00
200 ,0 00
300 ,0 00
400 ,0 00
500 ,0 00
600 ,0 00
700 ,0 00
800 ,0 00
900 ,0 00
.0 0
100 ,000 ,000 .0 0
200 ,000 ,000 .0 0
300 ,000 ,000 .0 0
400 ,000 ,000 .0 0
500 ,000 ,000 .0 0
600 ,000 ,000 .0 0
700 ,000 ,000 .0 0
800 ,000 ,000 .0 0
re tu rn
e xe cu tive pay