the plasma synthetic jet actuator, - aerospacelab … · issue 6 - june 01 - plasma synthetic jet...
TRANSCRIPT

Issue 6 - June 2013 - Plasma Synthetic Jet Actuator AL06-10 1
Flow Control: the Renewal of Aerodynamics?
The Plasma Synthetic Jet Actuator,Physics, Modeling and Flow Control
Application on Separation
D. Caruana, F. Rogier, G. Dufour, C. Gleyzes (Onera)
E-mail: [email protected]
Practical application of active flow control is dependent upon the development of robust actuators that are reliable, small, easy to integrate and have no or very small
delay. Onera is developing Plasma Synthetic Jet actuators, PSJ, in order to show the potential of such electrical devices to act on aerodynamic phenomena like separated flows. The characterization of the pulsed jet produced by a PSJ actuator is investiga-ted with experimental techniques, helping the validation of theoretical and numerical studies carried out in parallel. This article mainly describes the physics of PSJ actua-tors with numerical and experimental studies on the characterization of the PSJ device with and without flow and on the ability of PSJ actuators to reduce the separated flow region on a decelerating ramp and on an NACA-0015 airfoil. PSJ actuator efficiency has been quantified using the PIV technique, in order to estimate the decrease of the separated flow region induced by the actuation and consequently the drag reduction. The results show very promising effect with a separation almost completely cancelled.
Introduction
Flow control with active actuators requires efficient, robust, easy to integrate and low energy consumption devices. Inspired by the ”sparkjet” device, proposed by Grossman [1] from the Hopkins Uni-versity Applied Physics Laboratory, Onera, in cooperation with the CNRS/LAPLACE laboratory, is studying and developing a very pro-mising synthetic jet plasma generator, which can produce a high-ve-locity synthetic jet without any moving part and without any external fluid injection. In order to determine the operational characteristics of this actuator needed for flow control and to improve its concep-tion, several studies have been conducted within the framework of the PLASMAERO project funded by the European Community in a specific task that deals with showing that these devices are able to postpone the trailing edge separation phenomenon occurring in a high lift configuration (low velocity, high incidence angle).
Description and principle of the PSJ actuator
PSJ is a zero-net-mass-flux device mainly composed of 2 electrodes embedded in a cavity manufactured from a ceramic material, in connection with the external medium, with the help of a small dedi-cated orifice (figure 1). By applying a voltage difference greater than the disruptive voltage of the gas located inside the cavity (5 kV for Onera's actuators), an electrical arc is created between the 2 elec-trodes, leading to an increase in the internal energy. Since the air is
confined, the temperature and pressure increase very quickly inside the cavity. Fluid relaxation can be performed through a dedicated ori-fice, producing a pulsed air jet. At the end of this blowing phase, the cavity pressure drops below the external pressure value, activating a suction stage within the cavity. The actuator is ready for another cycle (figure 2).
Figure 1 - PSJ device ( 8mm), generated micro-jet
Figure 2 - Principle of PSJ functioning - (from [1])
Stage 1:Energy
Deposition
Stage 2:Discharge
Stage 3:Recovery

Issue 6 - June 2013 - Plasma Synthetic Jet Actuator AL06-10 2
Video 1 - PSJ micro-jet characterisation. Schlieren visualisationhttp://www.aerospacelab-journal.org/al6/plasma-synthetic-jet-actuator-physics-modeling-and-flow-control-application-on-separation
The characteristics of this device depend on the cavity geometry, the energy deposition and on the electrical parameters. In order to create the discharge, a high power supply is essential. Developed by the Laplace laboratory, the solution using a low voltage power supply associated with a high voltage transformer (m) and a transis-tor (IGBT) has been chosen, (figure 3) [2]. The IGBT can be easily controlled to adjust the frequency and the energy accumulated within the transformer.
Figure 3 - Capacitive power supply
This power supply can control the frequency, the phase and the ener-gy dissipated in the discharge for each device itself. The maximum frequency actuation is 2000 Hertz for a capacitor value of 20 nF and can be increased for lower capacitor values. The delay can be undepen-dably fixed for each PSJ (the precision is less than one micro-second).
Electrical characterization of the PSJ
The PSJ actuator is connected to the capacitor by means of a wire, which is modeled as an inductance of 2 μH and a resistance of 0.5 Ω. These considerations allow the calculation of the discharge voltage from the current and the measurement of the capacity voltage [2].
Figure 4 - Discharge and current voltage - C=15 nF
During the ignition time, the discharge voltage drops down to zero within a few nanoseconds (figure 4). Following ignition, the current
and the voltage discharge are sinusoidal and in phase. This sug-gests that plasma in the PSJ actuator behaves as a resistance. Calculations, not provided in this paper, show than the value of the resistance can amount to several Ohms [2]. Therefore, the plasma is very conductive. This explains why the temperature of the plasma is higher than 10,000 K. Furthermore, the maximum current is pro-portional to the breakdown voltage and in all cases higher than 100 A for a few nano-seconds.
The change in the discharge luminosity has been obtained using short exposure time photography, taken with an intensified CCD camera (figure 5).
Figure 5 - ICCD images of light emission for two different capacitances (5 nF and 15 nF)
The maximum luminosity is however three times more intense for 15 nF than for 5 nF. It is relevant that the luminosity of the discharge decreases with time; indeed, the current also diminishes with time. For both cases, the behavior is similar ; the discharge looks cylin-drical, since the luminosity is shared out symmetrically between the two electrodes. After ignition (t> 600 ns), the discharge is homoge-nous and the diameter of the discharge does not change. Further-more, the height of the discharge is wider for 15nF (and covers the electrodes) than for 5 nF. Consequently, the 15 nF discharge heats a larger volume of gas and for longer times than the 5 nF discharge does.
Aerodynamic characterization of the PSJ
The characteristics of the micro-jet produced by the PSJ actuator are closely connected to the electrical energy 'Ec' loaded in a capa-citor before being transferred to the device after the breakdown outbreak. This energy level depends on the breakdown voltage 'Vb' and the capacitor value 'C', according to the following formula: Ec=0.5CVb². For the geometrical and electrical configura-tion studied, the maximal jet velocity can reach 280 m.s−1, with a temperature level of about 400 K (figure 6-top), depending on the capacitor value and on the running frequency, which can be of up to 2000 Hz. For a given frequency, a saturation effect ap-pears on the velocity levels when the capacitor value is increased, because the heating of the device induces the dropping of the breakdown voltage and, consequently, a decrease in the electrical energy transferred during the spark discharge. The heating is also responsible for the velocity decrease induced when the running frequency is increased. Since the PSJ actuator produces a pul-sed jet with a quasi-constant duration of 150 s, the duty cycle increases linearly with the frequency, as can be observed in figure 6 – right [3] and [4].
m
4000
2000
0
-2000
-4000
300
200
100
0
-100
-200
Vs (V)Id (A)
Vs(V)Id (A)
R
0 3 x 10⁴ 6 x 10⁴
Time (second)
VCc S VS
IGBT
E
100%
t = 100 ns 520 ns 1.1 s 2.66 s
t = 100 ns 180 ns 2.52 s 4.5 s
C = 5nF
C = 15nF
0%

Issue 6 - June 2013 - Plasma Synthetic Jet Actuator AL06-10 3
Figure 6 - Micro-jet velocities and duty cycle versus PSJ running frequency
PSJ modeling and numerical parametric study
A full model of the PSJ actuator has been developed. It includes phy-sics insights (real gas effect, discharge modeling, etc...) and provides information on the gas within the cavity, as well as in the plume. The objective was to obtain a better understanding of the thermal energy transfer supplied by the arc discharge to the gas.
The model has been split into two coupled sub-models (figure 7). The first one deals with the energy deposition through electric arcing in the vicinity of the electrodes, in the absence of the cavity. It describes the plasma formation between both electrodes in an axisymmetrical configuration. This model is coupled with the RLC circuit equations describing the electrical supply by the external generator. The second sub-model focuses on the flow heating the cavity and the actuator operation It uses the energy distribution computed by the first sub-model as a source term and calculates the resulting effects on the actuator. It provides the flow mass rate, momentum and energy at the PSJ's exhaust versus time. To perform a full PSJ's simulation, both codes are running. A simulation of the arc is first performed and then the PSJ's simulation is performed.
Figure 7 - Scheme of the PSJ modeling
Real Gas thermodynamic and modeling assumptions
The modeling relies on a certain number of assumptions. First of all, the arc created in the PSJ cavity, which corresponds to the location of the energy deposit, is supposed to be elongated and characterized by an azimuthal symmetry. Because of the strong current and of the short gap between the electrodes, we assume that the arc is cylindrical as well.
In this case, the complexity of the problem can be reduced to solving a 2D axisymmetric problem where all of the variables only depend
on the radius r and on the height z (figure 8). Real configuration is genuinely 3D because of the way in which the electrodes are placed inside the cavity. The amount of heating provided by the arc discharge is so large that real gas properties must be taken into account in the description of the flow. The ionization and dissociation reactions at higher temperatures cause very strong non-linearities in the evolution of the thermodynamic coefficients. As a consequence, a "real gas" model is generally considered to compute transport and thermodyna-mic coefficients, which must be injected into the system. In this case, the "real gas" representation has been made using the coefficients that depend on pressure and temperature calculated by Capitelli et al. [7], over a range that extends from 300 to 60,000 K and from 0.01 to 100 atmospheres.
Figure 8 - Description of the geometry
Non-confined arc modeling
The arc geometry is still considered as a 2D axisymmetric problem. Moreover, the arc is considered to be in local thermal equilibrium (LTE) by looking at the high temperatures and pressures that generally cha-racterize this type of device. Therefore, there is no distinction between heavy particle and electron behavior. This assumption thus offers the possibility of taking into account a unique temperature, to represent the thermal behavior of all of the species as a global single fluid. Viscosity effects are neglected. Thus, the flow evolution is governed by the 2D inviscid Euler equations, with thermal diffusion and Joule heating. Ra-diative energy losses are also taken into account proportionally to the net emission coefficient (NEC), whose value is given by tables depen-ding on Temperature and Pressure provided by the LAPLACE CNRS laboratory. The plasma resistance results from the conductivity, which depends analytically on the temperature between the electrodes. The current I is then obtained by the RLC circuit equations and the electric field is obtained from the discharge current using Ohm's law.
The modeling does not describe the arc formation step during the first nanoseconds. It is assumed that the initial state is known after the first current pulse. Figure 9 shows the pressure wave resulting from the energy deposition by the electrical circuit at t=5 ns.
Figure 10 shows a comparison between the experimental and com-puted current discharge. It must be noted that, to obtain these results, it has been necessary to add a virtual resistance to represent the vol-tage drops occurring in the areas close to the electrodes and which cannot be solved by the modeling (presence of sheaths).
V jet (C=6 nF)
V jet (C=10 nF)
V jet (C=20 nF)
V jet (C=30 nF)
Duty cycle (C=6 nF)Duty cycle (C=10 nF)Duty cycle (C=20 nF)Duty cycle (C=30 nF)
300
250
200
150
100
50
0
0.14
0.12
0.1
0.08
0.06
0.04
0.02
0 0 100 1000 1500
Frequency (Hz) 0 100 1000 1500 2000
Frequency (Hz)
V (m/s)
Arcdischarge
External flow
PSj cavity
Arcdischarge
Solid boundary
Solid
bou
ndar
y&
ther
mal
flux
Sym
met
ry a
xis
0.5 mm
1 mm
4 mm
2 mm
Arc model Cavity model
Energydepositionin cavity
Jetformation

Issue 6 - June 2013 - Plasma Synthetic Jet Actuator AL06-10 4
Figure 9 - Pressure wave at t =5 ns (P x 105Pa)
Figure 10 - Discharge current versus time
Simulation of the Plasma Synthetic Jet
The simulation of the working PSJ is first performed using non-confi-ned arc modeling. An energy source distribution term is computed and introduced as input into the PSJ solver. Due to the geometry of the cavity, its cooling is only possible through convective heat trans-fers at the walls (the heat transfer at the electrodes is neglected). A thermal flux has been prescribed on the wall PSJ.
Figure 11 - Simulation of the PSJ – Micro-jet velocity (m/s) inside and outside the cavity
At this point, the arc discharge no longer delivers power and the fluid behavior is only governed by pressure and thermal gradients. This energy deposition generates an overpressure inside the cavity (of the order of 0.4 bar), which forces the high velocity flow outside the cavi-ty. This creates velocities as high as 700 m/s within the core of the jet
(figure 11), although the tip of the jet moves much slower (at around 160 m/s) between 0.5 and 1 cm outside the neck of the cavity ; this value corresponds to the measurements for a low frequency actua-tor). The high velocity jet assumes an arrow-shape which is visible.
Simulations of more than one discharge pulse led to the quasi-static periodic behavior of the actuator after approximately 25 pulses. The breakdown voltage depends on the initial gas state as an analytical function. Thus, after one pulse, the gas in the cavity is heated and the initial condition of the breakdown voltage will change. A simple breakdown voltage law is introduced in the model, to take into ac-count the modification of the gas properties after the pulse. The quasi-static behavior of the actuator is readily visible in 2D views of the flow. However, some graphs, such as the total mass contained and the mean fluid temperature within the cavity, show this periodicity even more clearly (figure 12). This simulation has been carried out for an actuator operating at a frequency of 1 kHz, using a 15 nF capacitor and a constant breakdown voltage of 2.7 kV. Once the quasi-static behavior is obtained, 7 mJ of electric energy are deposited in the fluid during each pulse. For these graphs, fluid in the nozzle has been taken into account as well. Quasi-static behavior is obtained after roughly 10 ms (or 10 pulses) for all represented graphs. As from this time, the jet is truly synthetic, as seen in figure 12 (i.e., its net mass flow is null over one period). Afterwards, the jet expels about 5.2 mg (8.5% of the PSJ's initial mass) during each pulse, at a mass flow rate of approximately 49 mg/s. The fluid inside the cavity becomes relatively hot with a stabilized temperature never falling below 900 K.
Figure 12 - Mass and mean temperature inside PSJ cavity for the 25 first pulses – f=1 KHz
Parametric study
A qualitatively study of the influence of several parameters on both energy deposition and cavity geometry is presented. These parame-ters were chosen around a reference actuator, composed of a 15 nF capacitor operating at 1 kHz, with a cavity ending in a 1 mm wide cylindrical neck. It should be kept in mind that, because of the inac-curacy of the energy deposition phases (energy loss in sheaths and constant breakdown voltage), only qualitative differences between the different configurations are presented.
Operating frequency
The behavior of the actuator for several operating frequencies seems physically correct (figure 13): qualitatively, we observe that the higher the frequency is, the hotter the cavity is and the less mass is expel-
2.22.061.961.841.72
1.61.481.361.241.12
1
0 0.002 0.004 0.006R (m)
-2.10-6 0 2.10-6 4.10-6 6.10-6 8.10-6 1.10-5 1.2.10-5
Time (s)
z (m)
Experimental data
EMHD arc modelling
Current (A)
P
0.04
0.02
0
250200150100
500
-50-100-150-200
-0.005 0 0.005
85075055045917070852
-10
V0.016
0.014
0.012
0.010
0.008
0.006
0.004
0.002
0 0.005 0.01 0.015 0.02Time(s)
1500
1000
500
0
Mas
s in
cav
ity (k
g)
Mea
m te
mpe
ratu
re in
cav
ity (K
)
Mass in cavity (kg)
Mean temperature in cavity (K)
6.10-8
5.10-8
4.10-8
3.10-8
2.10-8
1.10-8
0
Issue 6 - June 2013 - Plasma Synthetic Jet Actuator AL06-10 5
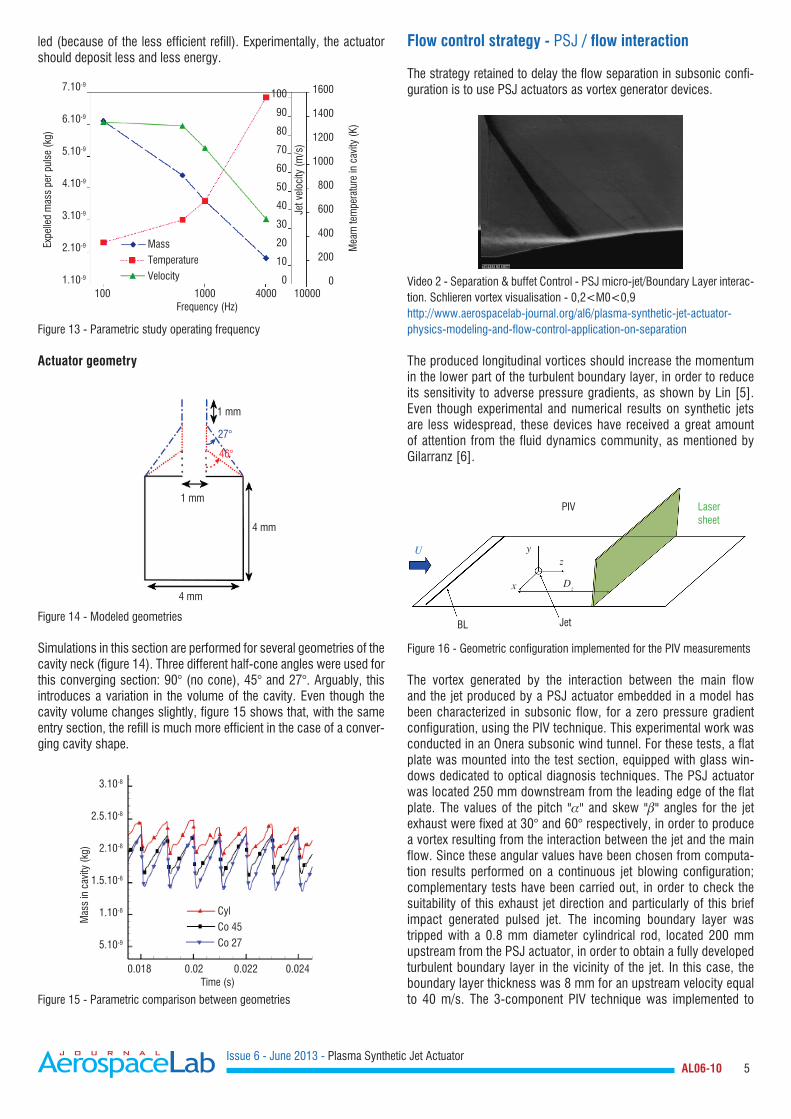
led (because of the less efficient refill). Experimentally, the actuator should deposit less and less energy.
Figure 13 - Parametric study operating frequency
Actuator geometry
Figure 14 - Modeled geometries
Simulations in this section are performed for several geometries of the cavity neck (figure 14). Three different half-cone angles were used for this converging section: 90° (no cone), 45° and 27°. Arguably, this introduces a variation in the volume of the cavity. Even though the cavity volume changes slightly, figure 15 shows that, with the same entry section, the refill is much more efficient in the case of a conver-ging cavity shape.
Figure 15 - Parametric comparison between geometries
Flow control strategy - PSJ / flow interaction
The strategy retained to delay the flow separation in subsonic confi-guration is to use PSJ actuators as vortex generator devices.
Video 2 - Separation & buffet Control - PSJ micro-jet/Boundary Layer interac-tion. Schlieren vortex visualisation - 0,2<M0<0,9http://www.aerospacelab-journal.org/al6/plasma-synthetic-jet-actuator-physics-modeling-and-flow-control-application-on-separation
The produced longitudinal vortices should increase the momentum in the lower part of the turbulent boundary layer, in order to reduce its sensitivity to adverse pressure gradients, as shown by Lin [5]. Even though experimental and numerical results on synthetic jets are less widespread, these devices have received a great amount of attention from the fluid dynamics community, as mentioned by Gilarranz [6].
Figure 16 - Geometric configuration implemented for the PIV measurements
The vortex generated by the interaction between the main flow and the jet produced by a PSJ actuator embedded in a model has been characterized in subsonic flow, for a zero pressure gradient configuration, using the PIV technique. This experimental work was conducted in an Onera subsonic wind tunnel. For these tests, a flat plate was mounted into the test section, equipped with glass win-dows dedicated to optical diagnosis techniques. The PSJ actuator was located 250 mm downstream from the leading edge of the flat plate. The values of the pitch "" and skew "" angles for the jet exhaust were fixed at 30° and 60° respectively, in order to produce a vortex resulting from the interaction between the jet and the main flow. Since these angular values have been chosen from computa-tion results performed on a continuous jet blowing configuration; complementary tests have been carried out, in order to check the suitability of this exhaust jet direction and particularly of this brief impact generated pulsed jet. The incoming boundary layer was tripped with a 0.8 mm diameter cylindrical rod, located 200 mm upstream from the PSJ actuator, in order to obtain a fully developed turbulent boundary layer in the vicinity of the jet. In this case, the boundary layer thickness was 8 mm for an upstream velocity equal to 40 m/s. The 3-component PIV technique was implemented to
100 1000 4000 10000Frequency (Hz)
1600
1400
1200
1000
800
600
400
200
0
100
90
80
70
60
50
40
30
20
10
0
Expe
lled
mas
s pe
r pul
se (k
g)
Mea
m te
mpe
ratu
re in
cav
ity (K
)
Jet v
eloc
ity (m
/s)
Mass
Temperature
Velocity
7.10-9
6.10-9
5.10-9
4.10-9
3.10-9
2.10-9
1.10-9
0.018 0.02 0.022 0.024Time (s)
Mas
s in
cav
ity (k
g)
Cyl
Co 45
Co 27
3.10-8
2.5.10-8
2.10-8
1.5.10-8
1.10-8
5.10-9
1 mm
PIV
U
Lasersheet
yz
Dz
JetBL
x
27°
46°
1 mm
4 mm
4 mm
Issue 6 - June 2013 - Plasma Synthetic Jet Actuator AL06-10 6
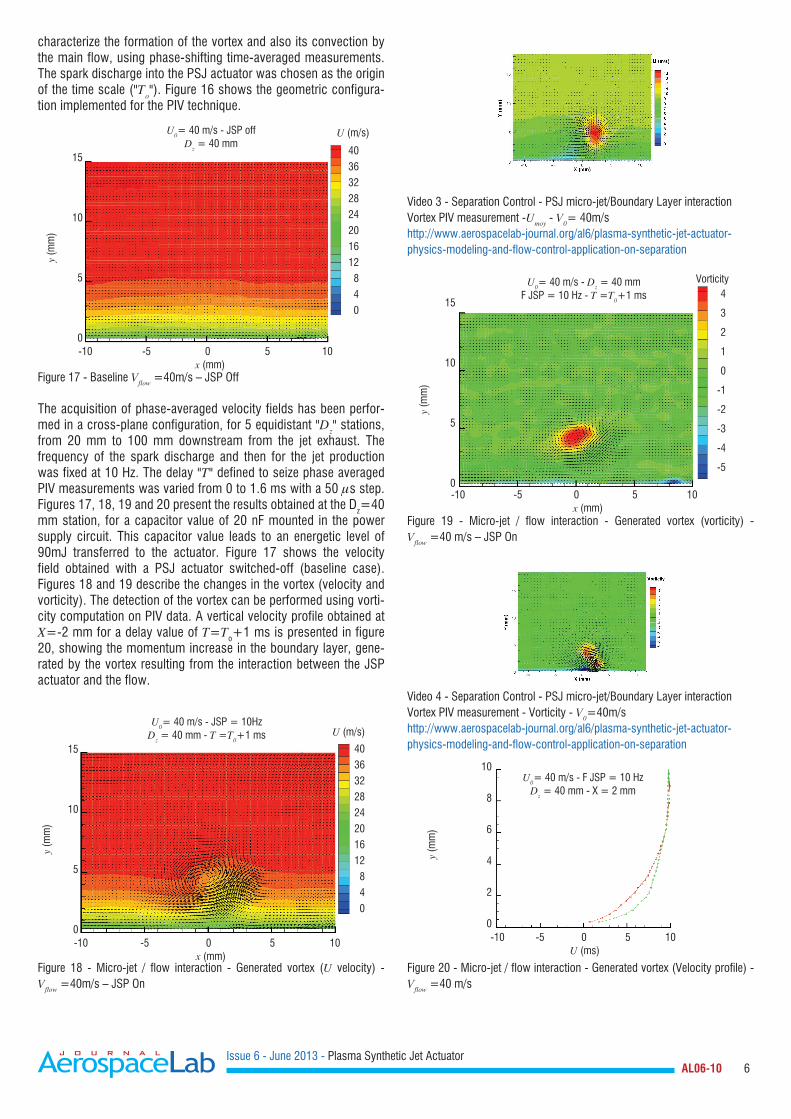
characterize the formation of the vortex and also its convection by the main flow, using phase-shifting time-averaged measurements. The spark discharge into the PSJ actuator was chosen as the origin of the time scale ("To"). Figure 16 shows the geometric configura-tion implemented for the PIV technique.
Figure 17 - Baseline Vflow =40m/s – JSP Off
The acquisition of phase-averaged velocity fields has been perfor-med in a cross-plane configuration, for 5 equidistant "Dz" stations, from 20 mm to 100 mm downstream from the jet exhaust. The frequency of the spark discharge and then for the jet production was fixed at 10 Hz. The delay "T" defined to seize phase averaged PIV measurements was varied from 0 to 1.6 ms with a 50 s step. Figures 17, 18, 19 and 20 present the results obtained at the Dz=40 mm station, for a capacitor value of 20 nF mounted in the power supply circuit. This capacitor value leads to an energetic level of 90mJ transferred to the actuator. Figure 17 shows the velocity field obtained with a PSJ actuator switched-off (baseline case). Figures 18 and 19 describe the changes in the vortex (velocity and vorticity). The detection of the vortex can be performed using vorti-city computation on PIV data. A vertical velocity profile obtained at X=-2 mm for a delay value of T=To+1 ms is presented in figure 20, showing the momentum increase in the boundary layer, gene-rated by the vortex resulting from the interaction between the JSP actuator and the flow.
Figure 18 - Micro-jet / flow interaction - Generated vortex (U velocity) - Vflow =40m/s – JSP On
Video 3 - Separation Control - PSJ micro-jet/Boundary Layer interactionVortex PIV measurement -Umoy - V0= 40m/shttp://www.aerospacelab-journal.org/al6/plasma-synthetic-jet-actuator-physics-modeling-and-flow-control-application-on-separation
Figure 19 - Micro-jet / flow interaction - Generated vortex (vorticity) - Vflow =40 m/s – JSP On
Video 4 - Separation Control - PSJ micro-jet/Boundary Layer interactionVortex PIV measurement - Vorticity - V0=40m/s http://www.aerospacelab-journal.org/al6/plasma-synthetic-jet-actuator-physics-modeling-and-flow-control-application-on-separation
Figure 20 - Micro-jet / flow interaction - Generated vortex (Velocity profile) - Vflow =40 m/s
-10 -5 0 5 10x (mm)
y (m
m)
U0= 40 m/s - JSP offDz = 40 mm
U (m/s)
40
36
32
28
24
20
16
12
8
4
0
15
10
5
0
-10 -5 0 5 10x (mm)
y (m
m)
U0= 40 m/s - JSP = 10HzDz = 40 mm - T =T0+1 ms U (m/s)
40
36
32
28
24
20
16
12
8
4
0
15
10
5
0
-10 -5 0 5 10x (mm)
y (m
m)
U0= 40 m/s - Dz = 40 mmF JSP = 10 Hz - T =T0+1 ms
Vorticity4
3
2
1
0
-1
-2
-3
-4
-5
15
10
5
0
-10 -5 0 5 10U (ms)
y (m
m)
U0= 40 m/s - F JSP = 10 HzDz = 40 mm - X = 2 mm
10
8
6
4
2
0
Issue 6 - June 2013 - Plasma Synthetic Jet Actuator AL06-10 7
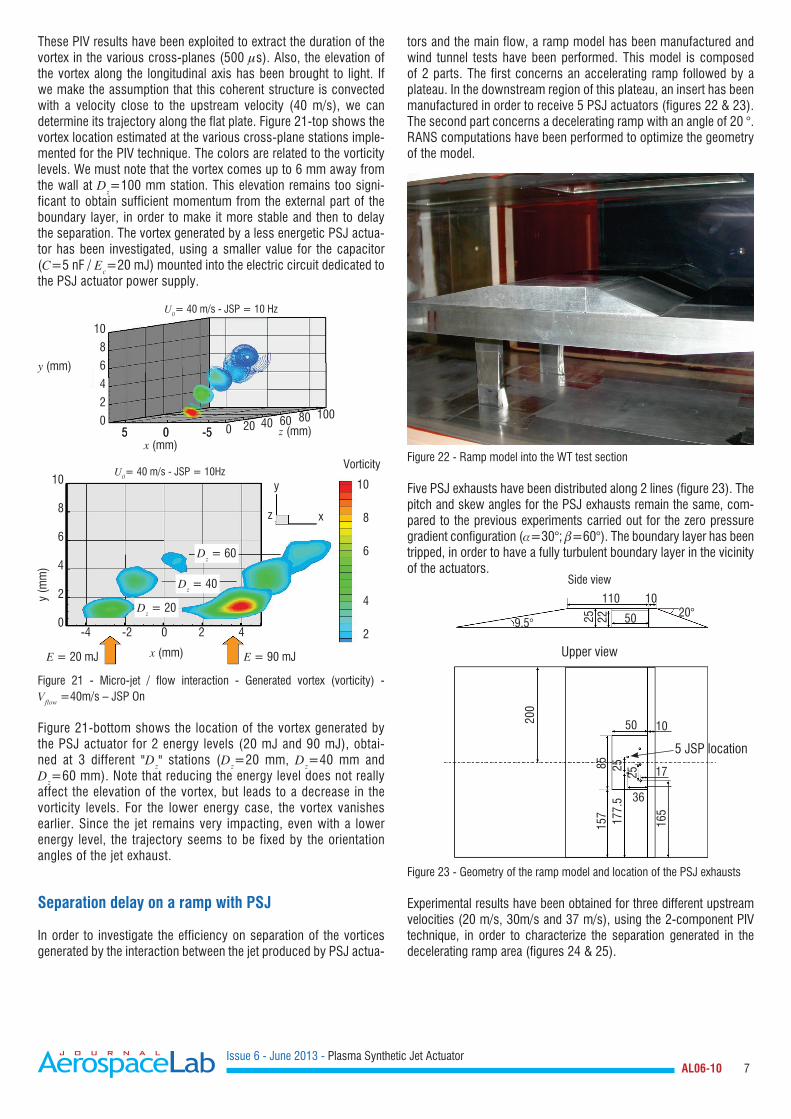
These PIV results have been exploited to extract the duration of the vortex in the various cross-planes (500 s). Also, the elevation of the vortex along the longitudinal axis has been brought to light. If we make the assumption that this coherent structure is convected with a velocity close to the upstream velocity (40 m/s), we can determine its trajectory along the flat plate. Figure 21-top shows the vortex location estimated at the various cross-plane stations imple-mented for the PIV technique. The colors are related to the vorticity levels. We must note that the vortex comes up to 6 mm away from the wall at Dz=100 mm station. This elevation remains too signi-ficant to obtain sufficient momentum from the external part of the boundary layer, in order to make it more stable and then to delay the separation. The vortex generated by a less energetic PSJ actua-tor has been investigated, using a smaller value for the capacitor (C=5 nF / Ec=20 mJ) mounted into the electric circuit dedicated to the PSJ actuator power supply.
Figure 21 - Micro-jet / flow interaction - Generated vortex (vorticity) - Vflow =40m/s – JSP On
Figure 21-bottom shows the location of the vortex generated by the PSJ actuator for 2 energy levels (20 mJ and 90 mJ), obtai-ned at 3 different "Dz" stations (Dz=20 mm, Dz=40 mm and Dz=60 mm). Note that reducing the energy level does not really affect the elevation of the vortex, but leads to a decrease in the vorticity levels. For the lower energy case, the vortex vanishes earlier. Since the jet remains very impacting, even with a lower energy level, the trajectory seems to be fixed by the orientation angles of the jet exhaust.
Separation delay on a ramp with PSJ
In order to investigate the efficiency on separation of the vortices generated by the interaction between the jet produced by PSJ actua-
tors and the main flow, a ramp model has been manufactured and wind tunnel tests have been performed. This model is composed of 2 parts. The first concerns an accelerating ramp followed by a plateau. In the downstream region of this plateau, an insert has been manufactured in order to receive 5 PSJ actuators (figures 22 & 23). The second part concerns a decelerating ramp with an angle of 20 °. RANS computations have been performed to optimize the geometry of the model.
Figure 22 - Ramp model into the WT test section
Five PSJ exhausts have been distributed along 2 lines (figure 23). The pitch and skew angles for the PSJ exhausts remain the same, com-pared to the previous experiments carried out for the zero pressure gradient configuration (=30°; =60°). The boundary layer has been tripped, in order to have a fully turbulent boundary layer in the vicinity of the actuators.
Figure 23 - Geometry of the ramp model and location of the PSJ exhausts
Experimental results have been obtained for three different upstream velocities (20 m/s, 30m/s and 37 m/s), using the 2-component PIV technique, in order to characterize the separation generated in the decelerating ramp area (figures 24 & 25).
Side view
10
8
6
4
2
0
10
8
6
4
2
0
10
8
6
4
2
5 0 -5 5 0 -5
-4 -2 0 2 4
0 z (mm)
y
x
110 1020°
9.5° 5025
200
8515
7 177.
5
165
25
50 10
36
1725
22
z
x (mm)
x (mm)
Vorticity
Dz = 60
Dz = 40
Dz = 20
E = 20 mJ E = 90 mJ
y (mm)
y (m
m)
20 40 60 80 100
Upper view
5 JSP location
U0= 40 m/s - JSP = 10 Hz
U0= 40 m/s - JSP = 10Hz
Issue 6 - June 2013 - Plasma Synthetic Jet Actuator AL06-10 8
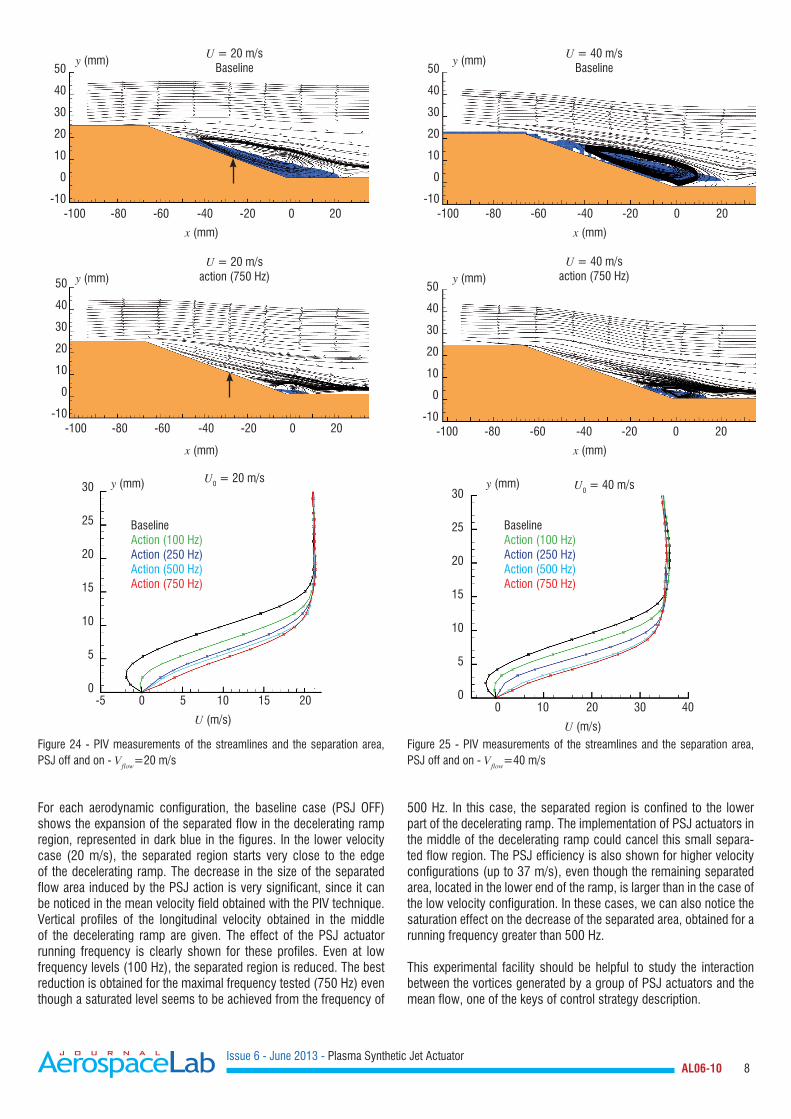
For each aerodynamic configuration, the baseline case (PSJ OFF) shows the expansion of the separated flow in the decelerating ramp region, represented in dark blue in the figures. In the lower velocity case (20 m/s), the separated region starts very close to the edge of the decelerating ramp. The decrease in the size of the separated flow area induced by the PSJ action is very significant, since it can be noticed in the mean velocity field obtained with the PIV technique. Vertical profiles of the longitudinal velocity obtained in the middle of the decelerating ramp are given. The effect of the PSJ actuator running frequency is clearly shown for these profiles. Even at low frequency levels (100 Hz), the separated region is reduced. The best reduction is obtained for the maximal frequency tested (750 Hz) even though a saturated level seems to be achieved from the frequency of
500 Hz. In this case, the separated region is confined to the lower part of the decelerating ramp. The implementation of PSJ actuators in the middle of the decelerating ramp could cancel this small separa-ted flow region. The PSJ efficiency is also shown for higher velocity configurations (up to 37 m/s), even though the remaining separated area, located in the lower end of the ramp, is larger than in the case of the low velocity configuration. In these cases, we can also notice the saturation effect on the decrease of the separated area, obtained for a running frequency greater than 500 Hz.
This experimental facility should be helpful to study the interaction between the vortices generated by a group of PSJ actuators and the mean flow, one of the keys of control strategy description.
Figure 24 - PIV measurements of the streamlines and the separation area, PSJ off and on - Vflow=20 m/s
Figure 25 - PIV measurements of the streamlines and the separation area, PSJ off and on - Vflow=40 m/s
50
40
30
20
10
0
-10 -100 -80 -60 -40 -20 0 20
x (mm) x (mm)
x (mm)x (mm)
U = 20 m/sBaseline
U = 20 m/saction (750 Hz)
U0 = 20 m/s U0 = 40 m/s
U = 40 m/saction (750 Hz)
U = 40 m/sBaseline
y (mm) y (mm)
y (mm)y (mm)
y (mm)
BaselineAction (100 Hz)Action (250 Hz)Action (500 Hz)Action (750 Hz)
BaselineAction (100 Hz)Action (250 Hz)Action (500 Hz)Action (750 Hz)
y (mm)
50
40
30
20
10
0
-10
30
25
20
15
10
5
0
30
25
20
15
10
5
0
-100 -80 -60 -40 -20 0 20
-5 0 5 10 15 20 0 10 20 30 40U (m/s) U (m/s)
50
40
30
20
10
0
-10 -100 -80 -60 -40 -20 0 20
50
40
30
20
10
0
-10 -100 -80 -60 -40 -20 0 20
Issue 6 - June 2013 - Plasma Synthetic Jet Actuator AL06-10 9
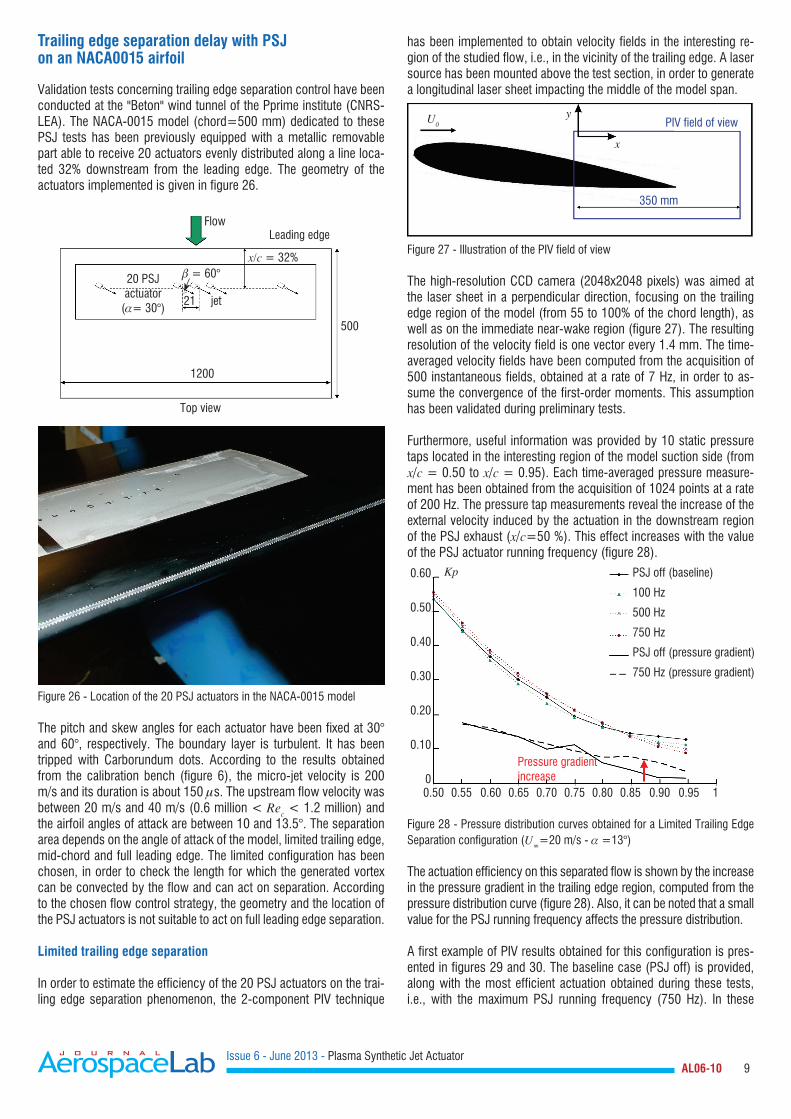
Trailing edge separation delay with PSJ on an NACA0015 airfoil
Validation tests concerning trailing edge separation control have been conducted at the "Beton" wind tunnel of the Pprime institute (CNRS-LEA). The NACA-0015 model (chord=500 mm) dedicated to these PSJ tests has been previously equipped with a metallic removable part able to receive 20 actuators evenly distributed along a line loca-ted 32% downstream from the leading edge. The geometry of the actuators implemented is given in figure 26.
Figure 26 - Location of the 20 PSJ actuators in the NACA-0015 model
The pitch and skew angles for each actuator have been fixed at 30° and 60°, respectively. The boundary layer is turbulent. It has been tripped with Carborundum dots. According to the results obtained from the calibration bench (figure 6), the micro-jet velocity is 200 m/s and its duration is about 150 s. The upstream flow velocity was between 20 m/s and 40 m/s (0.6 million < Rec < 1.2 million) and the airfoil angles of attack are between 10 and 13.5°. The separation area depends on the angle of attack of the model, limited trailing edge, mid-chord and full leading edge. The limited configuration has been chosen, in order to check the length for which the generated vortex can be convected by the flow and can act on separation. According to the chosen flow control strategy, the geometry and the location of the PSJ actuators is not suitable to act on full leading edge separation.
Limited trailing edge separation
In order to estimate the efficiency of the 20 PSJ actuators on the trai-ling edge separation phenomenon, the 2-component PIV technique
has been implemented to obtain velocity fields in the interesting re-gion of the studied flow, i.e., in the vicinity of the trailing edge. A laser source has been mounted above the test section, in order to generate a longitudinal laser sheet impacting the middle of the model span.
Figure 27 - Illustration of the PIV field of view
The high-resolution CCD camera (2048x2048 pixels) was aimed at the laser sheet in a perpendicular direction, focusing on the trailing edge region of the model (from 55 to 100% of the chord length), as well as on the immediate near-wake region (figure 27). The resulting resolution of the velocity field is one vector every 1.4 mm. The time-averaged velocity fields have been computed from the acquisition of 500 instantaneous fields, obtained at a rate of 7 Hz, in order to as-sume the convergence of the first-order moments. This assumption has been validated during preliminary tests.
Furthermore, useful information was provided by 10 static pressure taps located in the interesting region of the model suction side (from x/c = 0.50 to x/c = 0.95). Each time-averaged pressure measure-ment has been obtained from the acquisition of 1024 points at a rate of 200 Hz. The pressure tap measurements reveal the increase of the external velocity induced by the actuation in the downstream region of the PSJ exhaust (x/c=50 %). This effect increases with the value of the PSJ actuator running frequency (figure 28).
Figure 28 - Pressure distribution curves obtained for a Limited Trailing Edge Separation configuration (U
=20 m/s - =13°)
The actuation efficiency on this separated flow is shown by the increase in the pressure gradient in the trailing edge region, computed from the pressure distribution curve (figure 28). Also, it can be noted that a small value for the PSJ running frequency affects the pressure distribution.
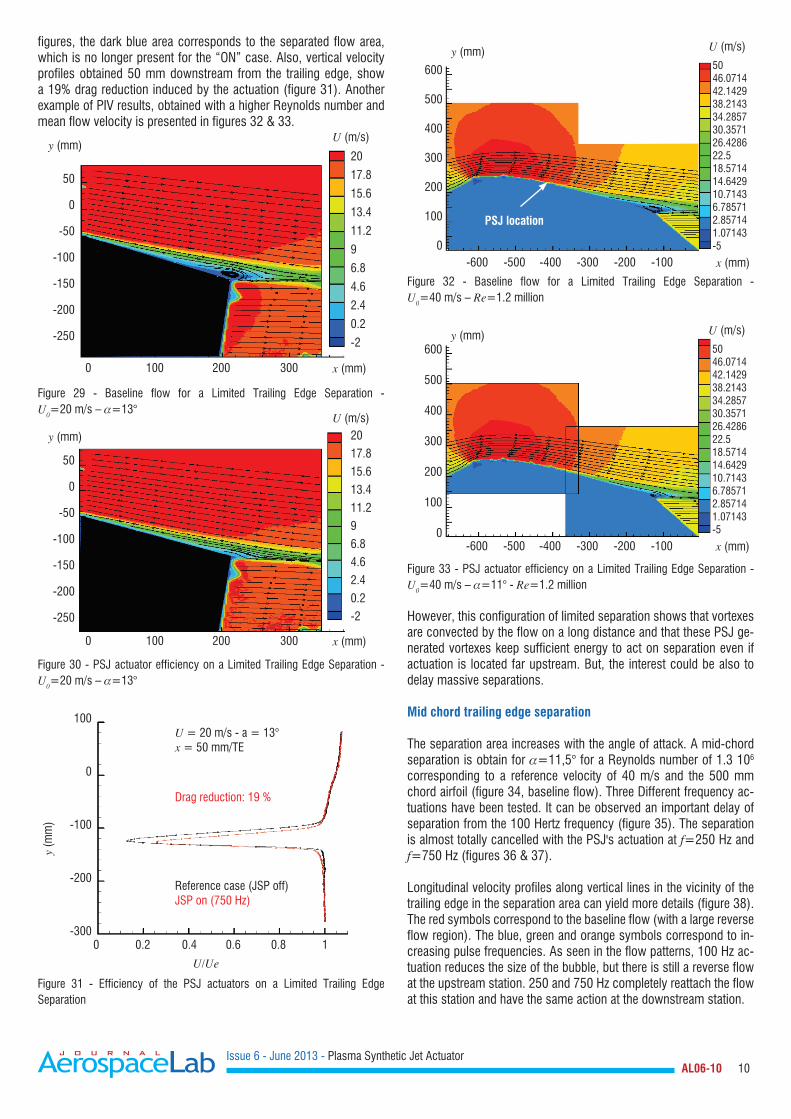
A first example of PIV results obtained for this configuration is pres-ented in figures 29 and 30. The baseline case (PSJ off) is provided, along with the most efficient actuation obtained during these tests, i.e., with the maximum PSJ running frequency (750 Hz). In these
FlowLeading edge
1200
350 mm
y
x
U0 PIV field of view
21 jet
= 60°
500
x/c = 32%
20 PSJactuator
(= 30°)
Top view
0.60
0.50
0.40
0.30
0.20
0.10
0 0.50 0.55 0.60 0.65 0.70 0.75 0.80 0.85 0.90 0.95 1
PSJ off (baseline)
100 Hz
500 Hz
750 Hz
PSJ off (pressure gradient)
750 Hz (pressure gradient)
Pressure gradientincrease
Kp
Issue 6 - June 2013 - Plasma Synthetic Jet Actuator AL06-10 10
figures, the dark blue area corresponds to the separated flow area, which is no longer present for the “ON” case. Also, vertical velocity profiles obtained 50 mm downstream from the trailing edge, show a 19% drag reduction induced by the actuation (figure 31). Another example of PIV results, obtained with a higher Reynolds number and mean flow velocity is presented in figures 32 & 33.
Figure 29 - Baseline flow for a Limited Trailing Edge Separation - U0=20 m/s – =13°
Figure 30 - PSJ actuator efficiency on a Limited Trailing Edge Separation - U0=20 m/s – =13°
Figure 31 - Efficiency of the PSJ actuators on a Limited Trailing Edge Separation
Figure 32 - Baseline flow for a Limited Trailing Edge Separation - U0=40 m/s – Re=1.2 million
Figure 33 - PSJ actuator efficiency on a Limited Trailing Edge Separation - U0=40 m/s – =11° - Re=1.2 million
However, this configuration of limited separation shows that vortexes are convected by the flow on a long distance and that these PSJ ge-nerated vortexes keep sufficient energy to act on separation even if actuation is located far upstream. But, the interest could be also to delay massive separations.
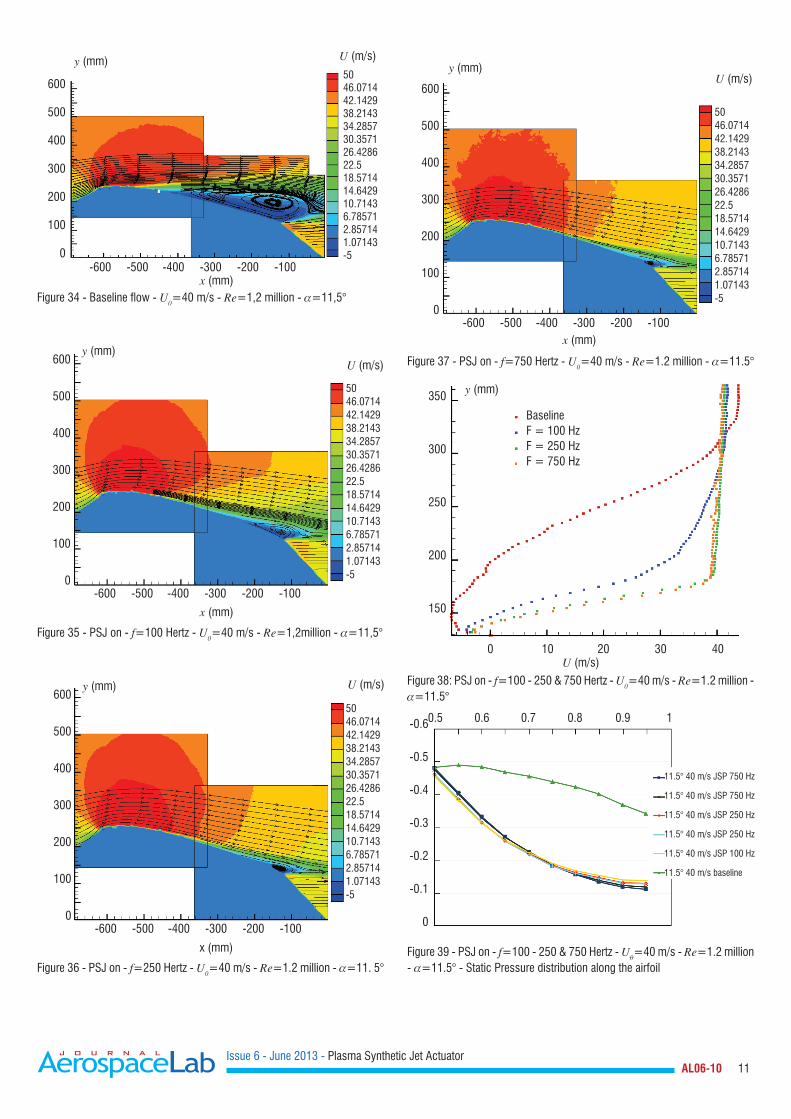
Mid chord trailing edge separation
The separation area increases with the angle of attack. A mid-chord separation is obtain for =11,5° for a Reynolds number of 1.3 106 corresponding to a reference velocity of 40 m/s and the 500 mm chord airfoil (figure 34, baseline flow). Three Different frequency ac-tuations have been tested. It can be observed an important delay of separation from the 100 Hertz frequency (figure 35). The separation is almost totally cancelled with the PSJ's actuation at f=250 Hz and f=750 Hz (figures 36 & 37). Longitudinal velocity profiles along vertical lines in the vicinity of the trailing edge in the separation area can yield more details (figure 38). The red symbols correspond to the baseline flow (with a large reverse flow region). The blue, green and orange symbols correspond to in-creasing pulse frequencies. As seen in the flow patterns, 100 Hz ac-tuation reduces the size of the bubble, but there is still a reverse flow at the upstream station. 250 and 750 Hz completely reattach the flow at this station and have the same action at the downstream station.
50
0
-50
-100
-150
-200
-250
600
500
400
300
200
100
0
50
0
-50
-100
-150
-200
-250
100
0
-100
-200
-300
0 100 200 300
-600 -500 -400 -300 -200 -100
0 100 200 300
0 0.2 0.4 0.6 0.8 1
U (m/s)
U (m/s)
20
17.8
15.6
13.4
11.2
9
6.8
4.6
2.4
0.2
-2
5046.071442.142938.214334.285730.357126.428622.518.571414.642910.71436.785712.857141.07143-5
20
17.8
15.6
13.4
11.2
9
6.8
4.6
2.4
0.2
-2
U (m/s)
y (mm)
y (m
m)
y (mm)
y (mm)
x (mm)
x (mm)
PSJ location
x (mm)
U = 20 m/s - a = 13°x = 50 mm/TE
Drag reduction: 19 %
Reference case (JSP off)JSP on (750 Hz)
U/Ue
600
500
400
300
200
100
0 -600 -500 -400 -300 -200 -100
U (m/s)
5046.071442.142938.214334.285730.357126.428622.518.571414.642910.71436.785712.857141.07143-5
y (mm)
x (mm)
Issue 6 - June 2013 - Plasma Synthetic Jet Actuator AL06-10 11
Figure 34 - Baseline flow - U0=40 m/s - Re=1,2 million - =11,5°
Figure 35 - PSJ on - f=100 Hertz - U0=40 m/s - Re=1,2million - =11,5°
Figure 36 - PSJ on - f=250 Hertz - U0=40 m/s - Re=1.2 million - =11. 5°
Figure 37 - PSJ on - f=750 Hertz - U0=40 m/s - Re=1.2 million - =11.5°
Figure 38: PSJ on - f=100 - 250 & 750 Hertz - U0=40 m/s - Re=1.2 million - =11.5°
Figure 39 - PSJ on - f=100 - 250 & 750 Hertz - U0=40 m/s - Re=1.2 million - =11.5° - Static Pressure distribution along the airfoil
600
500
400
300
200
100
0 -600 -500 -400 -300 -200 -100
U (m/s)
5046.071442.142938.214334.285730.357126.428622.518.571414.642910.71436.785712.857141.07143-5
y (mm)
x (mm)
600
500
400
300
200
100
0 -600 -500 -400 -300 -200 -100
U (m/s)
5046.071442.142938.214334.285730.357126.428622.518.571414.642910.71436.785712.857141.07143-5
y (mm)
x (mm)
600
500
400
300
200
100
0 -600 -500 -400 -300 -200 -100
U (m/s)y (mm)
x (mm)
5046.071442.142938.214334.285730.357126.428622.518.571414.642910.71436.785712.857141.07143-5
600
500
400
300
200
100
0 -600 -500 -400 -300 -200 -100
U (m/s)y (mm)
y (mm)
BaselineF = 100 HzF = 250 HzF = 750 Hz
x (mm)
U (m/s)
5046.071442.142938.214334.285730.357126.428622.518.571414.642910.71436.785712.857141.07143-5
350
300
250
200
150
0 10 20 30 40
11.5° 40 m/s JSP 750 Hz
11.5° 40 m/s JSP 750 Hz
11.5° 40 m/s JSP 250 Hz
11.5° 40 m/s JSP 250 Hz
11.5° 40 m/s JSP 100 Hz
11.5° 40 m/s baseline
-0.6
-0.5
-0.4
-0.3
-0.2
-0.1
0
0.5 0.6 0.7 0.8 0.9 1
Issue 6 - June 2013 - Plasma Synthetic Jet Actuator AL06-10 12
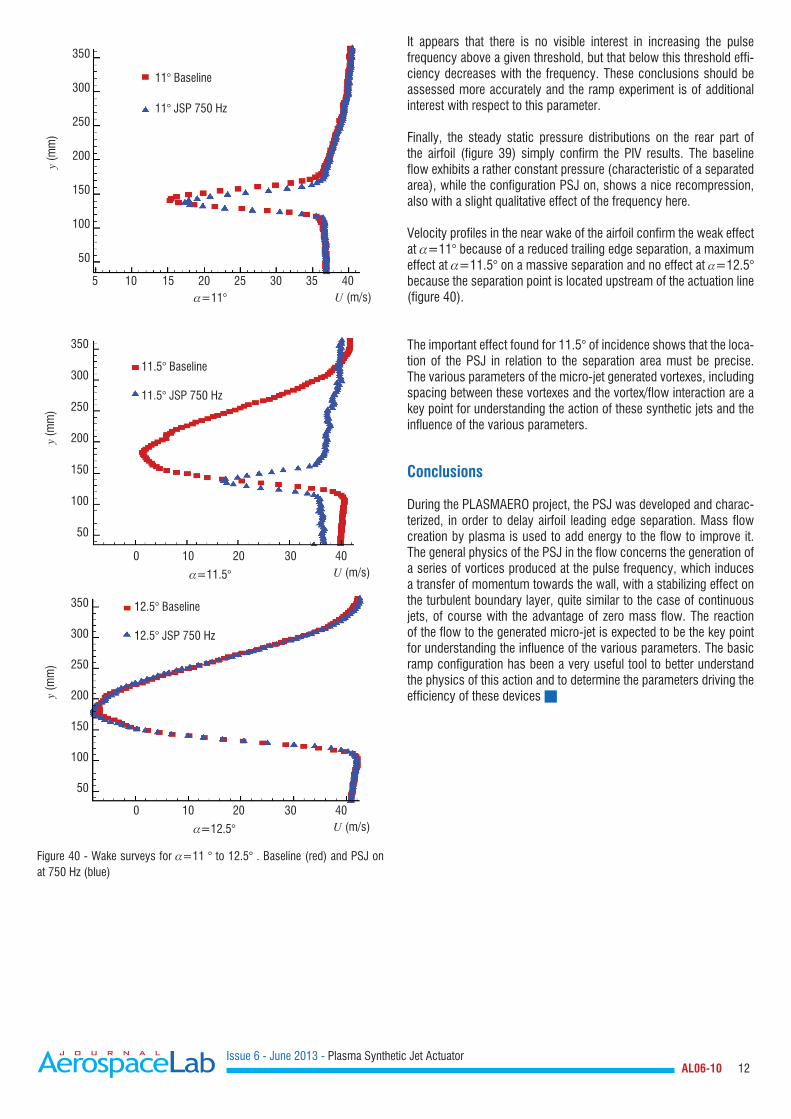
Figure 40 - Wake surveys for =11 ° to 12.5° . Baseline (red) and PSJ on at 750 Hz (blue)
It appears that there is no visible interest in increasing the pulse frequency above a given threshold, but that below this threshold effi-ciency decreases with the frequency. These conclusions should be assessed more accurately and the ramp experiment is of additional interest with respect to this parameter.
Finally, the steady static pressure distributions on the rear part of the airfoil (figure 39) simply confirm the PIV results. The baseline flow exhibits a rather constant pressure (characteristic of a separated area), while the configuration PSJ on, shows a nice recompression, also with a slight qualitative effect of the frequency here.
Velocity profiles in the near wake of the airfoil confirm the weak effect at =11° because of a reduced trailing edge separation, a maximum effect at =11.5° on a massive separation and no effect at =12.5° because the separation point is located upstream of the actuation line (figure 40).
The important effect found for 11.5° of incidence shows that the loca-tion of the PSJ in relation to the separation area must be precise. The various parameters of the micro-jet generated vortexes, including spacing between these vortexes and the vortex/flow interaction are a key point for understanding the action of these synthetic jets and the influence of the various parameters.
Conclusions
During the PLASMAERO project, the PSJ was developed and charac-terized, in order to delay airfoil leading edge separation. Mass flow creation by plasma is used to add energy to the flow to improve it. The general physics of the PSJ in the flow concerns the generation of a series of vortices produced at the pulse frequency, which induces a transfer of momentum towards the wall, with a stabilizing effect on the turbulent boundary layer, quite similar to the case of continuous jets, of course with the advantage of zero mass flow. The reaction of the flow to the generated micro-jet is expected to be the key point for understanding the influence of the various parameters. The basic ramp configuration has been a very useful tool to better understand the physics of this action and to determine the parameters driving the efficiency of these devices
y (m
m)
11° Baseline
11° JSP 750 Hz
U (m/s)
350
300
250
200
150
100
50
5 10 15 20 25 30 35 40
y (m
m)
11.5° Baseline
11.5° JSP 750 Hz
U (m/s)
350
300
250
200
150
100
50
0 10 20 30 40
y (m
m)
12.5° Baseline
12.5° JSP 750 Hz
U (m/s)
350
300
250
200
150
100
50
0 10 20 30 40
=11°
=11.5°
=12.5°

Issue 6 - June 2013 - Plasma Synthetic Jet Actuator AL06-10 13
Acknowledgements
We would like to thank Jean-Pascal Cambronne and Antoine Belinger (Laplace laboratory, Toulouse University) for the definition and realization of the PSJ power supply and for their important support on plasma physics and characterization. We would like to thank Eric Moreau & Antoine Debien (Pprime laboratory, Poitiers University) for providing us with a very good environment for the NACA0015 tests. This work has been performed within the fra-mework of the PlasmAero project (www.plasmaero.eu) funded by the European Community’s Seventh Framework Program FP7/2007-2013 under grant agreement N°.234201.
References
[1] K.R. OSSMAN, B.Z. CYBYK, D.M.V.WIE - SparkJet Actuators for Flow Control. AIAA 2003-0057.[2] A. BELINGER & al.- Influence of the Energy Dissipation Rate in the Discharge of a Plasma Synthetic Jet Actuator. J.Phys.D : Appl. Phys. 44[3] D. CARUANA & al. - The "Plasma Synthetic Jet" Actuator – Aero-Thermodynamic Characterization and First Flow Control Application. AIAA-2009-1307[4] P. HARDY & al. - Plasma Synthetic Jet for Flow Control. AIAA-2010-5103[5] J.C. LIN - Control of Turbulent Boundary-Layer Separation using Micro-Vortex Generator. AIAA 99-3404[6] J.L. GILARRANZ & al, - A New Class of Synthetic Jet Actuators. Journal of Fluids Engineering, March 2005, Vol. 127 /377-387.[7] M. CAPITELLI & al, -Transport Properties of High Temperature Air in Local Thermodynamic Equilibrium. The European Physical Journal D - Atomic, Molecular, Optical and Plasma Physics, 11:279#28
Nomenclature
C Capacity of the power supply capacitorE, Ec Energy transferred to the Plasma Synthetic JetIGBT Insulated-gate bipolar transistorF Frequency of the discharge (Hertz)M0, U0 Free stream Mach number, velocity (m/s)T Temperature (K)V Plasma jet velocity (m/s)Vb Voltage breakdown of the air gap (Volt)
Acronyms
PLASMAERO (PLASMas for AEROdynamic control , (www.plasmaero.eu))PSJ (Plasma Synthetic Jet)IGBT (Insulated Gate Bipolar Transistor)CCD (Charge Coupled Device (camera))PIV (Particle Image Velocimetry)
AUTHORS
Daniel CARUANA is a graduate of the C.N.A.M. (Conservatoire National des Arts et Métiers) and currently a Senior Research Engineer at Onera. He is in charge of plasmas for flow control and also involved in many aeronautics studies for aerodynamic and aero-acoustic control, flow physics, actuators definition
and design, control technique. His current research activities focus on flow physics and control (separation, buffeting, jet noise, etc.), plasma physics, actuators (fluidic vortex generator, synthetic jet, plasmas, Trailing Edge De-vices), and flow control methods. He has been the coordinator of the PLAS-MAERO European project (2009 – 2012).
François ROGIER, Engineer of Ecole Centrale de Paris and PhD in Applied Mathematics from Pierre et Marie Curie University, is a Senior Research Engineer at Onera. He is responsible of the UNIT research M2SN (Modelling Mathematics and Numerical Simulation). His current research activities is focused on mo-
delling of plasma flow interactions for subsonic and supersonic applications.
Guillaume DUFOUR received his PhD in Applied Mathematics in 2005 from the University of Toulouse, France. Currently, he is a Research Engineer in the Department of Models and Infor-mation Processing at Onera. His research interests include Multi-scale and Numerical Modelling applied to Plasma Di-scharges.
Christian GLEYZES is a graduate of "Ecole Nationale Supé-rieure des Techniques Avancées" and is a Senior Research Engineer at Onera. His principal researches were on flow turbu-lence modelling. Since 2009, his activities focused on flow control by plasma. He is now retired.