plasma jet simulation cfd
DESCRIPTION
Jet simulationTRANSCRIPT
Chemically Reacting Plasma Jet Expansion Simulation
for Application to Electrothermal Chemical Guns
Andrew J. Porwitzky∗, Leonardo C. Scalabrin†, Michael Keidar‡, and Iain D. Boyd§
Department of Aerospace Engineering, University of Michigan, Ann Arbor, MI 48109
A computational fluid dynamics simulation of an expanding capillary plasma jet for elec-trothermal chemical (ETC) gun application is presented. A chemical model is developedfor the plasma-air interaction that uses 26 species and 60 reactions in an implicit CFDcode. Time accurate results are obtained for two plasma jet experiments, one with wallimpingement with pressure sensor data from multiple locations, and another that deceler-ated the plasma through a plasma holding chamber, which greatly effected the chemicalspecies present. Conclusions are drawn from the results that speak to the importance ofthe plasma-air interaction in actual ETC implementation. This work is part of a completebeginning-to-end model of the plasma propellant interaction currently being developed.
Nomenclature
T Temperature in KelvinTe Electron temperature in eVu Flow speed in m/sρ Mass density in kg/m3
n Number density in m−3
P Pressure in Pa, ρRTPatm Pressure in atmospheres, P/(101325 Pa)Xm Mole fraction of species m
M Mach number, u/√
1.4P/ρ
I. Introduction
There has been much interest in recent years in the design and implementation of electrothermal chemical(ETC) guns. An ETC gun is a solid propellant based artillery piece in which the conventional ignition
system has been replaced with a capillary plasma source. Among the enhancements encountered in plasmabased ignition systems are reduced ignition delay time, highly repeatable ignition time, and enhanced burningand combustion of the solid propellant.1,2
Previous work by the authors has looked at the capillary plasma source3 and the interaction of the plasmawith the propellant grain.4 In order to perform accurate modeling of the plasma-propellant interaction (PPI)it is necessary to know which species are reaching the propellant surface. In both experimental setups andfinal implementation there is the possibility for some plasma-air interaction before the resulting species reachthe propellant surface, introducing the possibility that the species coming from the plasma capillary andthose interacting with the propellant are not the same. The present study develops a model to determinethe effect plasma-air chemistry can have on chemical composition of the plasma.
The LeMANS chemically reacting, parallelized, implicit Navier-Stokes CFD code, developed at the Uni-versity of Michigan, is used in the present work. LeMANS uses a modified Steger-Warming Flux Vector
∗Graduate Student, Student Member AIAA. Email: [email protected]†Graduate Student, Student Member AIAA. Email: [email protected]‡Assistant Research Scientist, Senior Member AIAA. Email: [email protected]§Professor, Associate Fellow AIAA. Email: [email protected]
1 of 17
American Institute of Aeronautics and Astronautics
38th AIAA Plasmadynamics and Lasers Conference<br> In conjunction with the<br> 16th25 - 28 June 2007, Miami, FL
AIAA 2007-4600
Copyright © 2007 by Andrew J. Porwitzky, Leonardo C. Scalabrin, Michael Keidar, and Iain D. Boyd. Published by the American Institute of Aeronautics and Astronautics, Inc., with permission.
Splitting scheme for calculation of inviscid fluxes between mesh volumes, is second order accurate in space,and for the purposes of this work time integration is performed using a point implicit method. Furtherdetails of the models employed in LeMANS are outlined elsewhere.5,6 The code was modified to allow fortime varying boundary conditions, namely the capillary plasma inflow. This work represents the first timeLeMANS has been used for time accurate or internal flows. The temporal accuracy of LeMANS was verifiedby simulation of shock tube cases and comparison to an exact Riemann Solver.
Previous work modeling the plasma-air interaction was conducted at the Army Research Laboratory(ARL). In one such simulation and matching experiment7 a high pressure plasma jet was fired at a stagnationpressure probe 15 cm from the capillary inflow. Pressure versus time data were obtained and compared tothe simulation. Although accurate pressure probe results were obtained, there are some problems with theseprevious simulations. The ARL model simulated 38 chemical species, including 16 ionic species. However,a detailed look at the chemistry model8 shows that in the 57 reactions there are 12 species that are notincluded, 10 of which are ionic species. Data was provided for species concentrations at locations betweenthe capillary inflow and the pressure probe. A careful analysis of the species concentrations at the pressureprobe shows that there is a strong deviation from quasi-neutrality. The most likely reason for this is thatthe electrons diffused away at high speed in the simulation. However, since the ARL model contains noelectromagnetic terms in the equations governing the fluid calculations, this deviation from quasi-neutralityshould not have an effect on the ion flow. The missing electrons will have an effect on the recombinationrates at the pressure probe, since there will not be enough electrons to allow ions to recombine. LeMANSis designed to simulate quasi-neutral plasma flows, with an electron diffusion model that maintains quasi-neutrality.9 In all the simulations presented here the deviation from quasi-neutrality was less than 0.01%everywhere. Since the ARL study is the previous major effort in this field, we felt that for the above reasonsthat this problem warranted a second look.
Recent experiments of Li et al.11,12 have investigated the plasma-air chemistry and the plasma jet insome detail. These experiments include stagnation pressure probe results for a range of capillary-probedistances, propellant sample analysis at a range of capillary-sample distances, sequential photographs of theplasma jet interaction for these cases, and sampling the chemical species present in the jet. The conditionsof these recent experiments serve as the basis for the two simulations contained herein.
In Section II we present a short overview of the capillary model in use to generate the plasma inflow. Thechemistry model developed is outlined in Section III. Section IV contains an overview of the experiments andhow they are adapted to simulation. Section V contains results and discussions, including analysis of eachsimulation, as well as ways the chemistry model can be reduced to save computational time, and what thesimulations indicate about the plasma-air interaction in practical ETC application. We conclude in SectionVI.
II. Capillary Model Inflow
The plasma inflow is generated via the previously developed capillary model.3,10 Both experiments11,12
simulated here use the same size capillary (1.6 mm internal radius, 26 mm length) with similar currentprofiles and peak energy supplied to the plasma generator in each case. The current profile11 represents adischarge time of 220 µs with a peak current of nearly 10 kA occurring at roughly 85 µs. The current profilewas extracted from the publication of Li et al.11 via a data stripping code. The electric current input to thecapillary model can therefore be considered exact. Figure 1 shows the data points for current obtained bythe stripping code.
The one dimensional capillary code solves an ablation model at the polyethylene surface and couplesthis to a hydrodynamic model to determine capillary exit velocity, density, pressure and temperature. TheSaha equation is solved at every cell in the capillary to give the individual densities of hydrogen and carbonions and atoms, with the electron density determined by the quasi-neutrality condition. Figure 1 showsthe polynomial fits to the capillary model results that are input into LeMANS as the inflow pressure andtemperature. All species exit the capillary at the electron temperature, which is mostly time invariant at 1.5eV, or approximately 12,000 Kelvin. The exit boundary condition for the capillary model is sonic flow, withthe velocity inflow of LeMANS determined as
√γP/ρ, with γ=1.4 assumed. The simulation is not sensitive
to this condition, as the jet is a pressure driven flow.The capillary model output is fit to ninth order polynomials for input into LeMANS. Some of these
polynomials give inaccurate values at early times, so a 5 µs offset is used. This 5 µs is added back into the
2 of 17
American Institute of Aeronautics and Astronautics

CFD simulation in post processing in order for the start times to more fully agree with the experiments.
Figure 1. Capillary data.
III. Chemistry Model
The chemistry model implemented here is built upon previous work, both theoretical and experimental,on plasma-air chemistry. LeMANS was originally designed for simulating hypersonic flow around reentryvehicles, and uses Park’s Model13 for nitrogen-oxygen chemistry, the same model used by NASA.6 Due to thewide use of this model, it is used for all nitrogen-oxygen chemistry. Additional species are chosen based onthe abundances from the ARL simulations,7 species with high abundances are chosen first. Due to a desireto compare with the recent measurements of Li et al. on plasma species present in the jet,12 many of themore abundant detected species are added. As a last step, species are added that are needed for extendedchemical mechanisms. For instance, to go from H to H2O the species OH should be added to the model toallow for another reaction path. The total number of species is kept to a minimum to decrease computationalexpense as the needed resources and computational time can rapidly go beyond practical limits.
The final model arrived at contains 26 chemical species and 60 reactions. The first eleven species arefrom Park’s Model, namely N2, O2, NO, N, O, NO+, N2
+, O2+, N+, O+, and electrons (e). The remaining
species are OH, CO, CO2, H2O, C2H2, C2H3, CH, CH2, HCO, NH, H2, C, C+, H, and H+. The CxHy
species are added because the experiments detected a significant amount of these species.12
The reaction rate data is obtained from the GRI-Mech project for all non-Park’s Model and non-ionchemistry.14 The GRI-Mech data is used in several commercially available hydrocarbon chemistry softwarepackages, including the CHEMKIN software. For the hydrogen and carbon ionization reactions the workof Chang and Ordonez15,16 was employed. Table 1 presents a complete list of all reactions used in thesimulation. Some of the third body reactions, indicated by the presence of species M, have different reactionrates for a certain M. These species specific rates are also incorporated into LeMANS. All the reactions usedhave accompanying backward reactions.
Chemical data for each species, such as specific heat, enthalpy of formation, etc, are obtained from GRI-Mech or Field and Franklin.17 Viscosity data for each species are obtained from McBride and Gordon.18
Although LeMANS is capable of accommodating a two temperature model, representing translation andvibration, sufficient information could not be found for all chemical species to use this approach. More im-portantly, due to the high temperatures involved in these flows the translational and vibrational temperaturesare nearly equilibrated, rendering a two temperature model unnecessary.
IV. Simulation Methodology
Two experiments are simulated in the present work. In each experiment, an identical plasma capillarywith nearly identical current load was used. Identical capillaries and current loads allow us to use onecapillary input for each simulation, thus the main difference between the two simulations is the geometry.
3 of 17
American Institute of Aeronautics and Astronautics
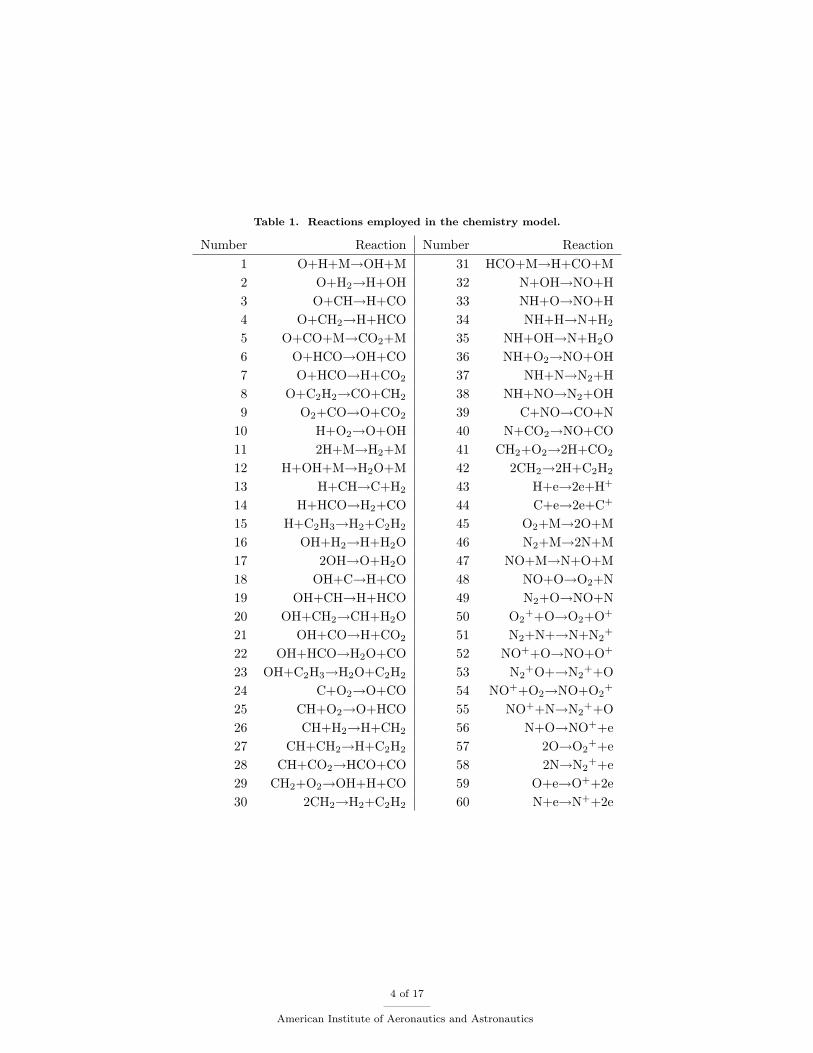
Table 1. Reactions employed in the chemistry model.
Number Reaction Number Reaction1 O+H+M→OH+M 31 HCO+M→H+CO+M2 O+H2→H+OH 32 N+OH→NO+H3 O+CH→H+CO 33 NH+O→NO+H4 O+CH2→H+HCO 34 NH+H→N+H2
5 O+CO+M→CO2+M 35 NH+OH→N+H2O6 O+HCO→OH+CO 36 NH+O2→NO+OH7 O+HCO→H+CO2 37 NH+N→N2+H8 O+C2H2→CO+CH2 38 NH+NO→N2+OH9 O2+CO→O+CO2 39 C+NO→CO+N
10 H+O2→O+OH 40 N+CO2→NO+CO11 2H+M→H2+M 41 CH2+O2→2H+CO2
12 H+OH+M→H2O+M 42 2CH2→2H+C2H2
13 H+CH→C+H2 43 H+e→2e+H+
14 H+HCO→H2+CO 44 C+e→2e+C+
15 H+C2H3→H2+C2H2 45 O2+M→2O+M16 OH+H2→H+H2O 46 N2+M→2N+M17 2OH→O+H2O 47 NO+M→N+O+M18 OH+C→H+CO 48 NO+O→O2+N19 OH+CH→H+HCO 49 N2+O→NO+N20 OH+CH2→CH+H2O 50 O2
++O→O2+O+
21 OH+CO→H+CO2 51 N2+N+→N+N2+
22 OH+HCO→H2O+CO 52 NO++O→NO+O+
23 OH+C2H3→H2O+C2H2 53 N2+O+→N2
++O24 C+O2→O+CO 54 NO++O2→NO+O2
+
25 CH+O2→O+HCO 55 NO++N→N2++O
26 CH+H2→H+CH2 56 N+O→NO++e27 CH+CH2→H+C2H2 57 2O→O2
++e28 CH+CO2→HCO+CO 58 2N→N2
++e29 CH2+O2→OH+H+CO 59 O+e→O++2e30 2CH2→H2+C2H2 60 N+e→N++2e
4 of 17
American Institute of Aeronautics and Astronautics
The first experiment11 fires the plasma into an open chamber at 1 atm pressure. Five pressure sensorsare implanted at 9.5 mm intervals in a wall 40 mm away, oriented parallel to the exit plane of the capillary.The first pressure sensor is aligned with the capillary exit at the stagnation line, this sensor is labeled P0.Each subsequent sensor is labeled P1-P4, with P4’s center being 38 mm above the capillary center.
Before entering the chamber the capillary plasma travels through a cylindrical nozzle 1.6 mm in radiusand 13 mm in length.11 Since the flow variables could change in this distance, the nozzle is also simulated.The simulation uses an axisymmetric geometry, with the outflow at y=50 mm, and walls at x=13 mm andx=53 mm. The latter wall contains the five pressure sensors. Pressure versus time data are output at thefive “pressure sensors” in the simulation. The P0 sensor is the first wall cell above the symmetry plane, withP1-P4 from wall cells at position y=9.5 mm, 19 mm, 28.5 mm, and 38 mm, respectively. This simulation islabeled below as Case S1.
In the second experiment12 the capillary plasma is injected into a cylindrical plasma holding chamber ofradius 9.4 mm and 129.5 mm length.19 Gas escaped the plasma holding chamber through a 0.5 mm radiusnozzle into a 10x10x10 cm chamber that housed a mass spectrometer probe to measure the species presentin the plasma.12 The plasma holding chamber was employed in the experiment because the plasma jetwashed over the probe too rapidly for any measurements to be made, thus the flow had to be slowed down.Abundances, in terms of arbitrary intensity units, of some species were measured. These arbitrary unitsmake it difficult for exact comparisons to be made, however qualitative comparisons are possible that yieldmuch insight. The simulation of this flow, labeled below as Case S2, has the geometry listed above, withthe change that the expansion chamber after the secondary nozzle is not encumbered by the measurementapparatus. This allows for a more direct comparison of the jets in Case S1 and Case S2.
It must be noted that in an attempt to decrease heat loss to the walls the holding chamber in theexperiment was lined with polyethylene. However, there is evidence that this liner ablated as far as 50 mmfrom the primary nozzle with a total mass loss three to five times that of the mass loss from the capillary. Tosee what effect this had, the experimenters replaced the polyethylene liner with one of identical dimensionsmade of aluminum. Their results show that only CO intensity could be accurately measured, with all otherchemical species being within the noise level of the measurement.12 Essentially, by using a polyethyleneliner, the same compound that is ablating in the capillary to form the plasma, the experimenters created amuch larger capillary. The higher mass loss due to this wall ablation increases the abundance of carbon andhydrogen in the plasma holding chamber, allowing new reaction mechanisms to occur. This may explain thehigh abundance of CxHy detected in the experiment. The present simulation does not include this ablatingholding chamber, and can be thought of as the case with the aluminum liner.
These two simulations allow for some key comparisons to be made concerning the chemistry of theplasma-air interaction. Since the capillary is identical in both experiments, and hence in both simulations,we can compare the chemistry of the primary jet of Case S1 to that of the secondary jet of Case S2, to seethe full effect that the holding chamber had. Also, simulating the secondary jet without wall ablation allowsus to see how the polyethylene liner skewed the results of the mass spectrometer data. This comparison ofthe primary and secondary jet chemistry is the main result of the present study.
V. Results & Discussion
A. Analysis of Case S1
Due to the large computational expense of running a 26 species, chemically reacting CFD simulation, gridconvergence was found first for a single species non-chemically reacting flow. This single species had thesame inflow temperature, velocity and pressure profile as the full simulation. Grid convergence is based onthe arrival time of the pressure pulse at P0, the value of the peak pressure, and the behavior of the pressureprofile just beyond the peak. Case S1 uses rectangular cells with a uniform cell spacing of ∆x=0.1 mm,which results in 202,080 cells. Case S1 ran on thirty 2 Ghz processors with a timestep of ∆t=2.5x10⁻⁹ s,having a total runtime of 296 hours to simulate 70 µs of real time.
Snapshots of Mach number contours for Case S1 are shown in Fig. 2, where t=0 µs is at the start ofthe current profile in Fig. 1. For detailed examination of the chemistry we will refer to the data from t=35µs. At this time the jet is fully developed, the precursor shock can clearly be seen, and the jet has not yetbegun interacting with the wall. Evaluating the chemistry at this time will allow for a much more directcomparison with the secondary jet chemistry of Case S2.
Pressure versus time data are shown in Fig. 3. Experimental data indicates that the precursor shock
5 of 17
American Institute of Aeronautics and Astronautics
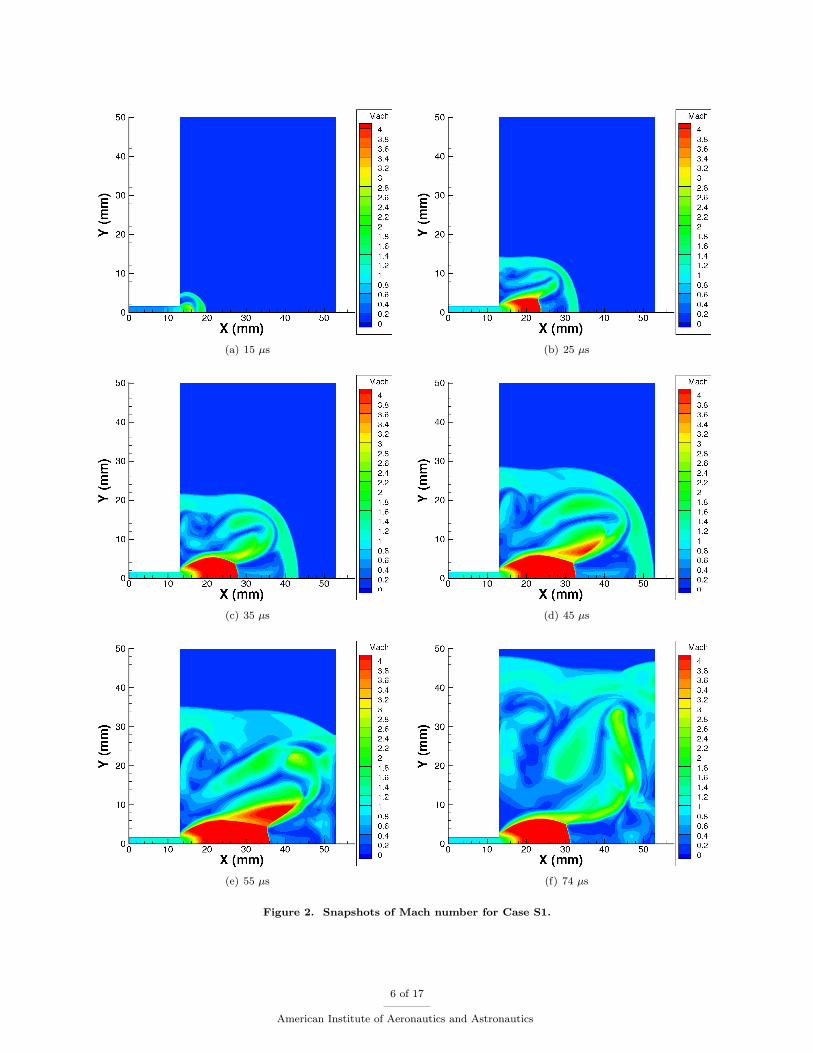
(a) 15 µs (b) 25 µs
(c) 35 µs (d) 45 µs
(e) 55 µs (f) 74 µs
Figure 2. Snapshots of Mach number for Case S1.
6 of 17
American Institute of Aeronautics and Astronautics
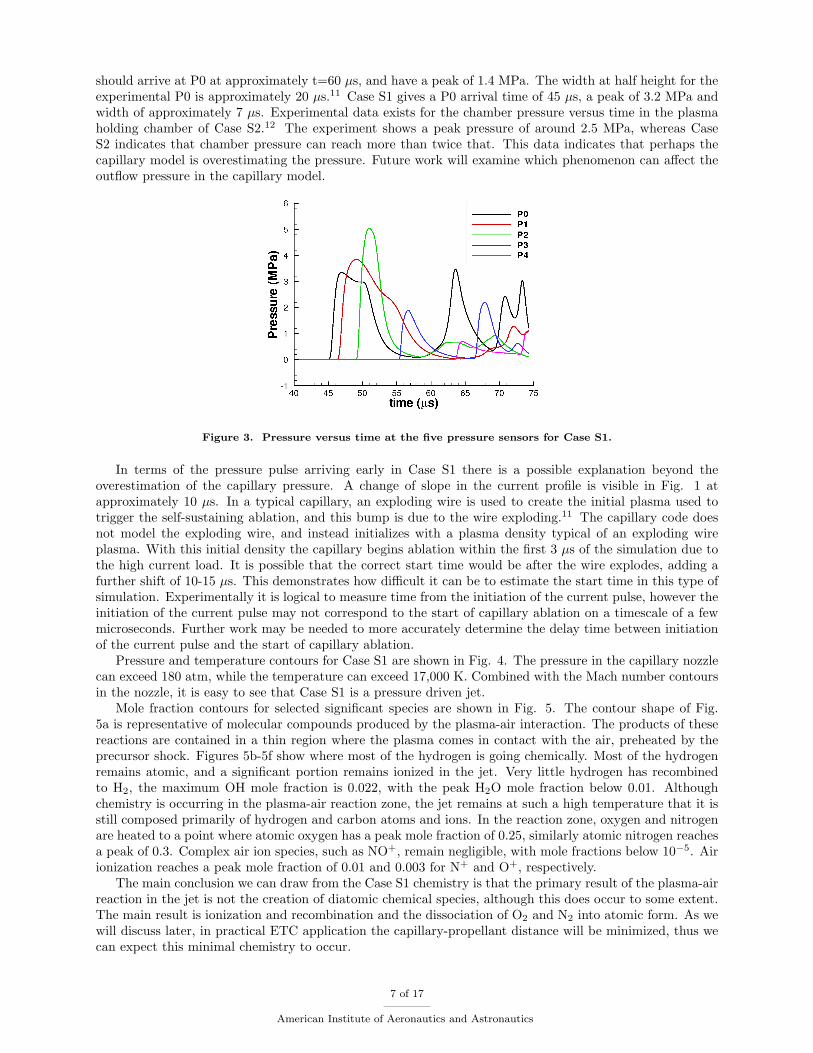
should arrive at P0 at approximately t=60 µs, and have a peak of 1.4 MPa. The width at half height for theexperimental P0 is approximately 20 µs.11 Case S1 gives a P0 arrival time of 45 µs, a peak of 3.2 MPa andwidth of approximately 7 µs. Experimental data exists for the chamber pressure versus time in the plasmaholding chamber of Case S2.12 The experiment shows a peak pressure of around 2.5 MPa, whereas CaseS2 indicates that chamber pressure can reach more than twice that. This data indicates that perhaps thecapillary model is overestimating the pressure. Future work will examine which phenomenon can affect theoutflow pressure in the capillary model.
Figure 3. Pressure versus time at the five pressure sensors for Case S1.
In terms of the pressure pulse arriving early in Case S1 there is a possible explanation beyond theoverestimation of the capillary pressure. A change of slope in the current profile is visible in Fig. 1 atapproximately 10 µs. In a typical capillary, an exploding wire is used to create the initial plasma used totrigger the self-sustaining ablation, and this bump is due to the wire exploding.11 The capillary code doesnot model the exploding wire, and instead initializes with a plasma density typical of an exploding wireplasma. With this initial density the capillary begins ablation within the first 3 µs of the simulation due tothe high current load. It is possible that the correct start time would be after the wire explodes, adding afurther shift of 10-15 µs. This demonstrates how difficult it can be to estimate the start time in this type ofsimulation. Experimentally it is logical to measure time from the initiation of the current pulse, however theinitiation of the current pulse may not correspond to the start of capillary ablation on a timescale of a fewmicroseconds. Further work may be needed to more accurately determine the delay time between initiationof the current pulse and the start of capillary ablation.
Pressure and temperature contours for Case S1 are shown in Fig. 4. The pressure in the capillary nozzlecan exceed 180 atm, while the temperature can exceed 17,000 K. Combined with the Mach number contoursin the nozzle, it is easy to see that Case S1 is a pressure driven jet.
Mole fraction contours for selected significant species are shown in Fig. 5. The contour shape of Fig.5a is representative of molecular compounds produced by the plasma-air interaction. The products of thesereactions are contained in a thin region where the plasma comes in contact with the air, preheated by theprecursor shock. Figures 5b-5f show where most of the hydrogen is going chemically. Most of the hydrogenremains atomic, and a significant portion remains ionized in the jet. Very little hydrogen has recombinedto H2, the maximum OH mole fraction is 0.022, with the peak H2O mole fraction below 0.01. Althoughchemistry is occurring in the plasma-air reaction zone, the jet remains at such a high temperature that it isstill composed primarily of hydrogen and carbon atoms and ions. In the reaction zone, oxygen and nitrogenare heated to a point where atomic oxygen has a peak mole fraction of 0.25, similarly atomic nitrogen reachesa peak of 0.3. Complex air ion species, such as NO+, remain negligible, with mole fractions below 10−5. Airionization reaches a peak mole fraction of 0.01 and 0.003 for N+ and O+, respectively.
The main conclusion we can draw from the Case S1 chemistry is that the primary result of the plasma-airreaction in the jet is not the creation of diatomic chemical species, although this does occur to some extent.The main result is ionization and recombination and the dissociation of O2 and N2 into atomic form. As wewill discuss later, in practical ETC application the capillary-propellant distance will be minimized, thus wecan expect this minimal chemistry to occur.
7 of 17
American Institute of Aeronautics and Astronautics
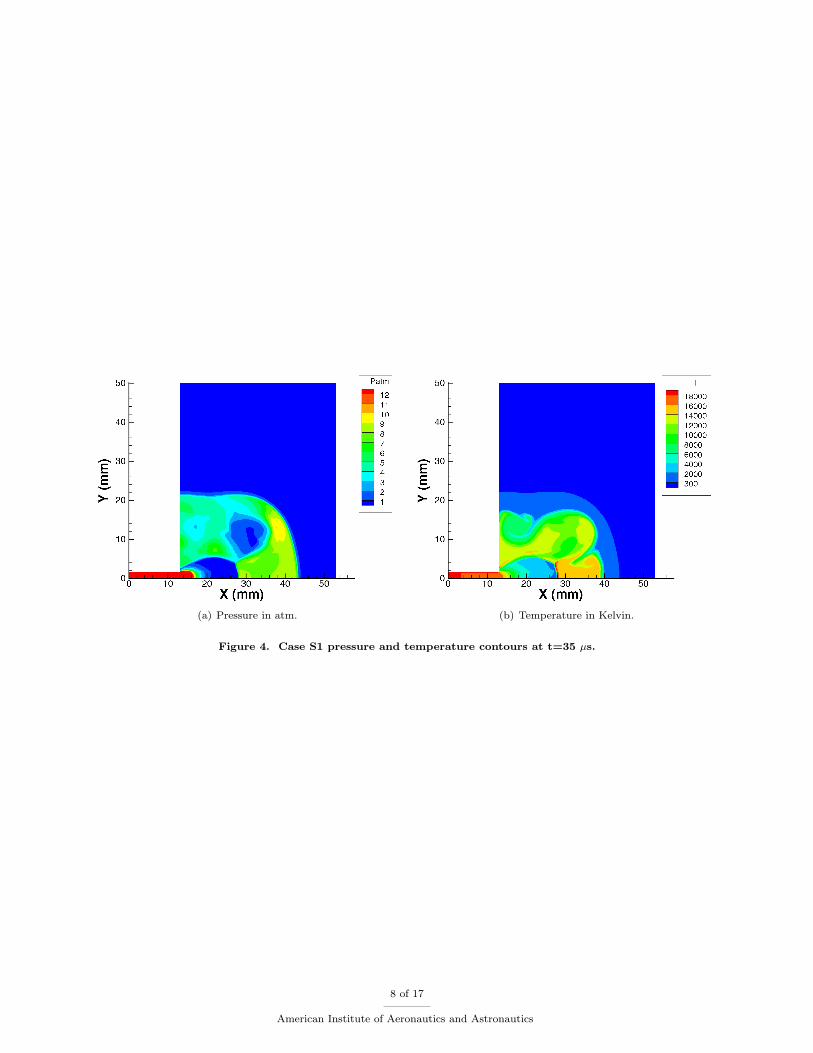
(a) Pressure in atm. (b) Temperature in Kelvin.
Figure 4. Case S1 pressure and temperature contours at t=35 µs.
8 of 17
American Institute of Aeronautics and Astronautics
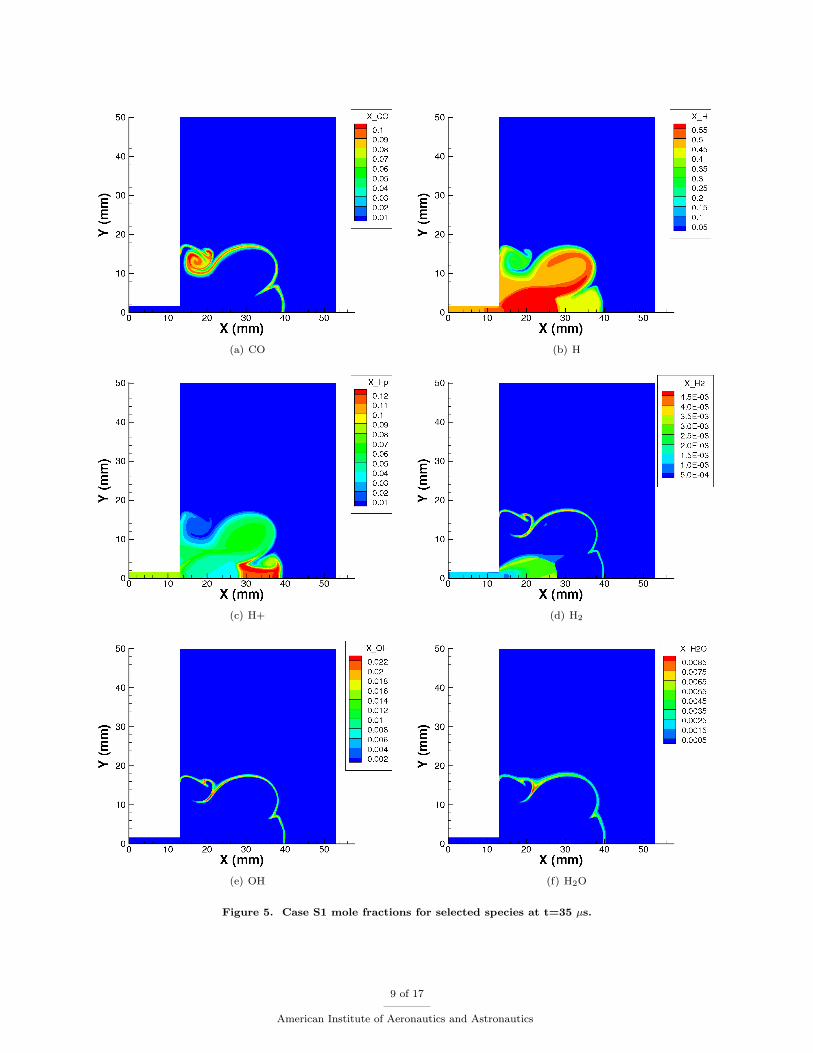
(a) CO (b) H
(c) H+ (d) H2
(e) OH (f) H2O
Figure 5. Case S1 mole fractions for selected species at t=35 µs.
9 of 17
American Institute of Aeronautics and Astronautics
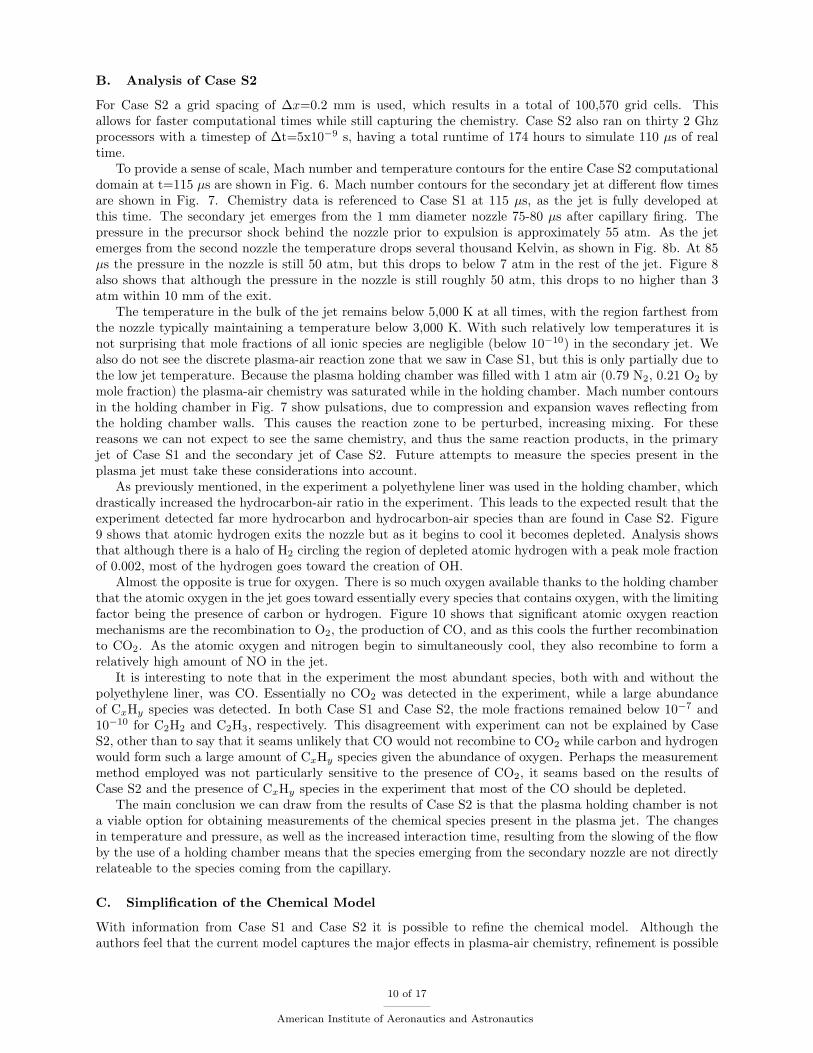
B. Analysis of Case S2
For Case S2 a grid spacing of ∆x=0.2 mm is used, which results in a total of 100,570 grid cells. Thisallows for faster computational times while still capturing the chemistry. Case S2 also ran on thirty 2 Ghzprocessors with a timestep of ∆t=5x10⁻⁹ s, having a total runtime of 174 hours to simulate 110 µs of realtime.
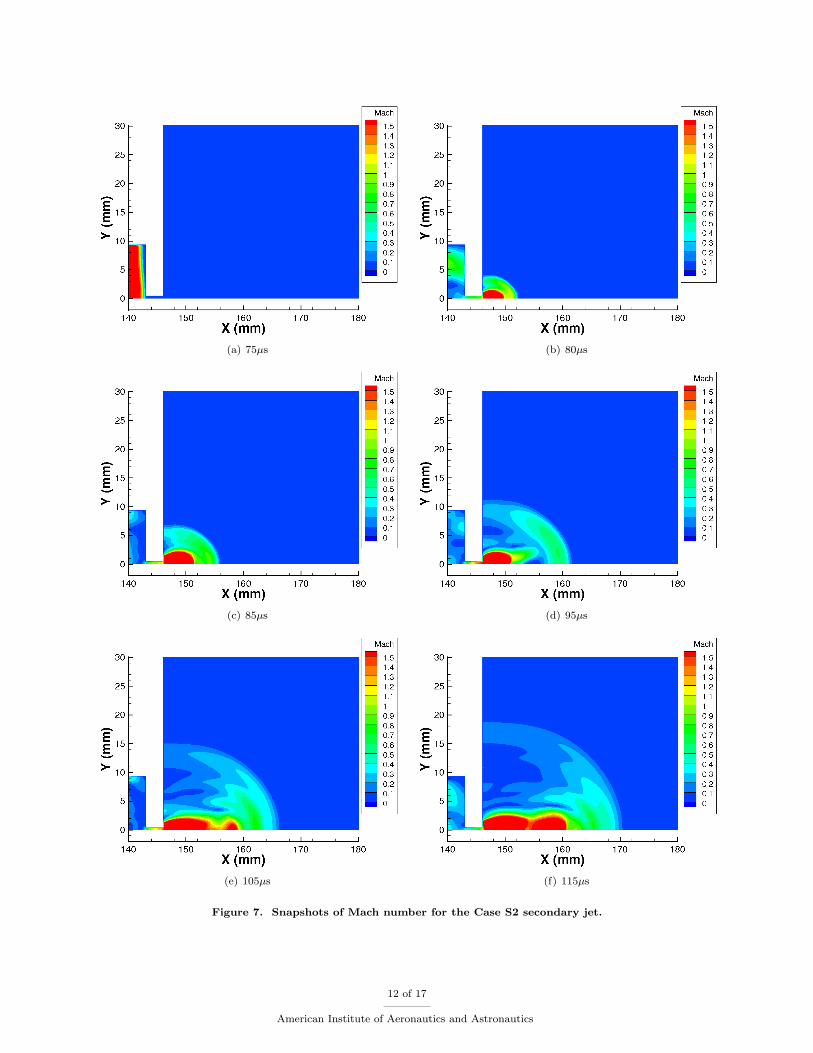
To provide a sense of scale, Mach number and temperature contours for the entire Case S2 computationaldomain at t=115 µs are shown in Fig. 6. Mach number contours for the secondary jet at different flow timesare shown in Fig. 7. Chemistry data is referenced to Case S1 at 115 µs, as the jet is fully developed atthis time. The secondary jet emerges from the 1 mm diameter nozzle 75-80 µs after capillary firing. Thepressure in the precursor shock behind the nozzle prior to expulsion is approximately 55 atm. As the jetemerges from the second nozzle the temperature drops several thousand Kelvin, as shown in Fig. 8b. At 85µs the pressure in the nozzle is still 50 atm, but this drops to below 7 atm in the rest of the jet. Figure 8also shows that although the pressure in the nozzle is still roughly 50 atm, this drops to no higher than 3atm within 10 mm of the exit.
The temperature in the bulk of the jet remains below 5,000 K at all times, with the region farthest fromthe nozzle typically maintaining a temperature below 3,000 K. With such relatively low temperatures it isnot surprising that mole fractions of all ionic species are negligible (below 10−10) in the secondary jet. Wealso do not see the discrete plasma-air reaction zone that we saw in Case S1, but this is only partially due tothe low jet temperature. Because the plasma holding chamber was filled with 1 atm air (0.79 N2, 0.21 O2 bymole fraction) the plasma-air chemistry was saturated while in the holding chamber. Mach number contoursin the holding chamber in Fig. 7 show pulsations, due to compression and expansion waves reflecting fromthe holding chamber walls. This causes the reaction zone to be perturbed, increasing mixing. For thesereasons we can not expect to see the same chemistry, and thus the same reaction products, in the primaryjet of Case S1 and the secondary jet of Case S2. Future attempts to measure the species present in theplasma jet must take these considerations into account.
As previously mentioned, in the experiment a polyethylene liner was used in the holding chamber, whichdrastically increased the hydrocarbon-air ratio in the experiment. This leads to the expected result that theexperiment detected far more hydrocarbon and hydrocarbon-air species than are found in Case S2. Figure9 shows that atomic hydrogen exits the nozzle but as it begins to cool it becomes depleted. Analysis showsthat although there is a halo of H2 circling the region of depleted atomic hydrogen with a peak mole fractionof 0.002, most of the hydrogen goes toward the creation of OH.
Almost the opposite is true for oxygen. There is so much oxygen available thanks to the holding chamberthat the atomic oxygen in the jet goes toward essentially every species that contains oxygen, with the limitingfactor being the presence of carbon or hydrogen. Figure 10 shows that significant atomic oxygen reactionmechanisms are the recombination to O2, the production of CO, and as this cools the further recombinationto CO2. As the atomic oxygen and nitrogen begin to simultaneously cool, they also recombine to form arelatively high amount of NO in the jet.
It is interesting to note that in the experiment the most abundant species, both with and without thepolyethylene liner, was CO. Essentially no CO2 was detected in the experiment, while a large abundanceof CxHy species was detected. In both Case S1 and Case S2, the mole fractions remained below 10−7 and10−10 for C2H2 and C2H3, respectively. This disagreement with experiment can not be explained by CaseS2, other than to say that it seams unlikely that CO would not recombine to CO2 while carbon and hydrogenwould form such a large amount of CxHy species given the abundance of oxygen. Perhaps the measurementmethod employed was not particularly sensitive to the presence of CO2, it seams based on the results ofCase S2 and the presence of CxHy species in the experiment that most of the CO should be depleted.
The main conclusion we can draw from the results of Case S2 is that the plasma holding chamber is nota viable option for obtaining measurements of the chemical species present in the plasma jet. The changesin temperature and pressure, as well as the increased interaction time, resulting from the slowing of the flowby the use of a holding chamber means that the species emerging from the secondary nozzle are not directlyrelateable to the species coming from the capillary.
C. Simplification of the Chemical Model
With information from Case S1 and Case S2 it is possible to refine the chemical model. Although theauthors feel that the current model captures the major effects in plasma-air chemistry, refinement is possible
10 of 17
American Institute of Aeronautics and Astronautics
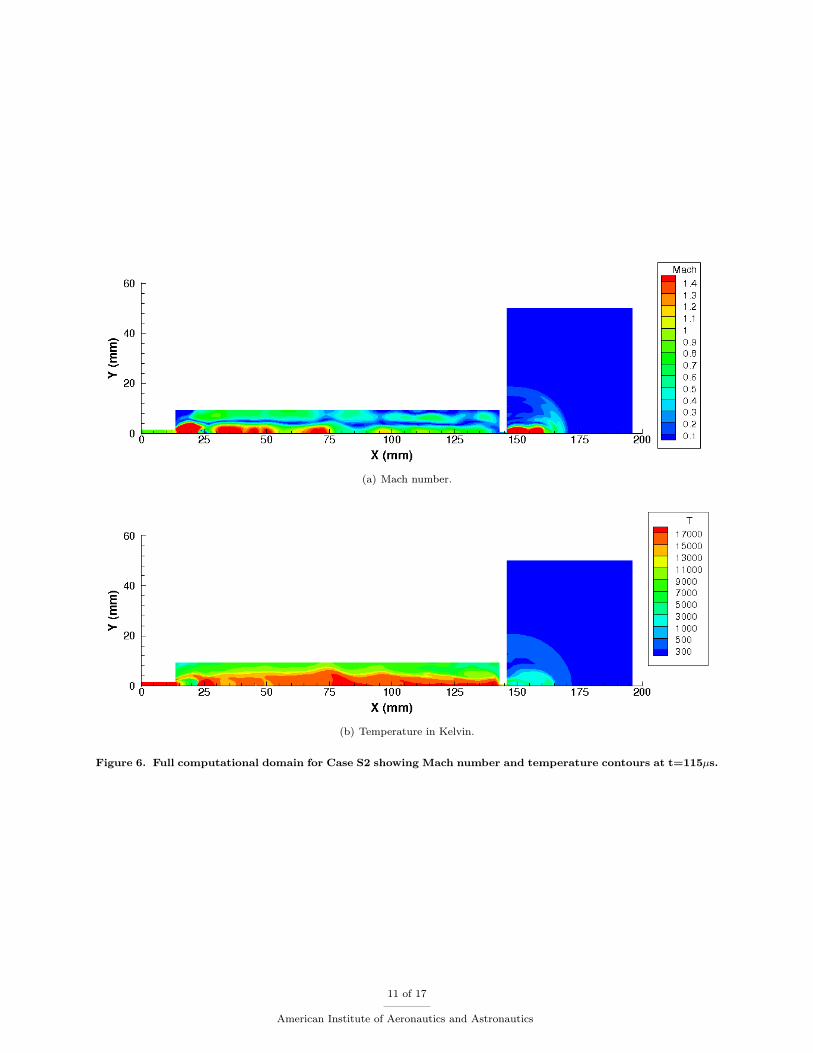
(a) Mach number.
(b) Temperature in Kelvin.
Figure 6. Full computational domain for Case S2 showing Mach number and temperature contours at t=115µs.
11 of 17
American Institute of Aeronautics and Astronautics
(a) 75µs (b) 80µs
(c) 85µs (d) 95µs
(e) 105µs (f) 115µs
Figure 7. Snapshots of Mach number for the Case S2 secondary jet.
12 of 17
American Institute of Aeronautics and Astronautics
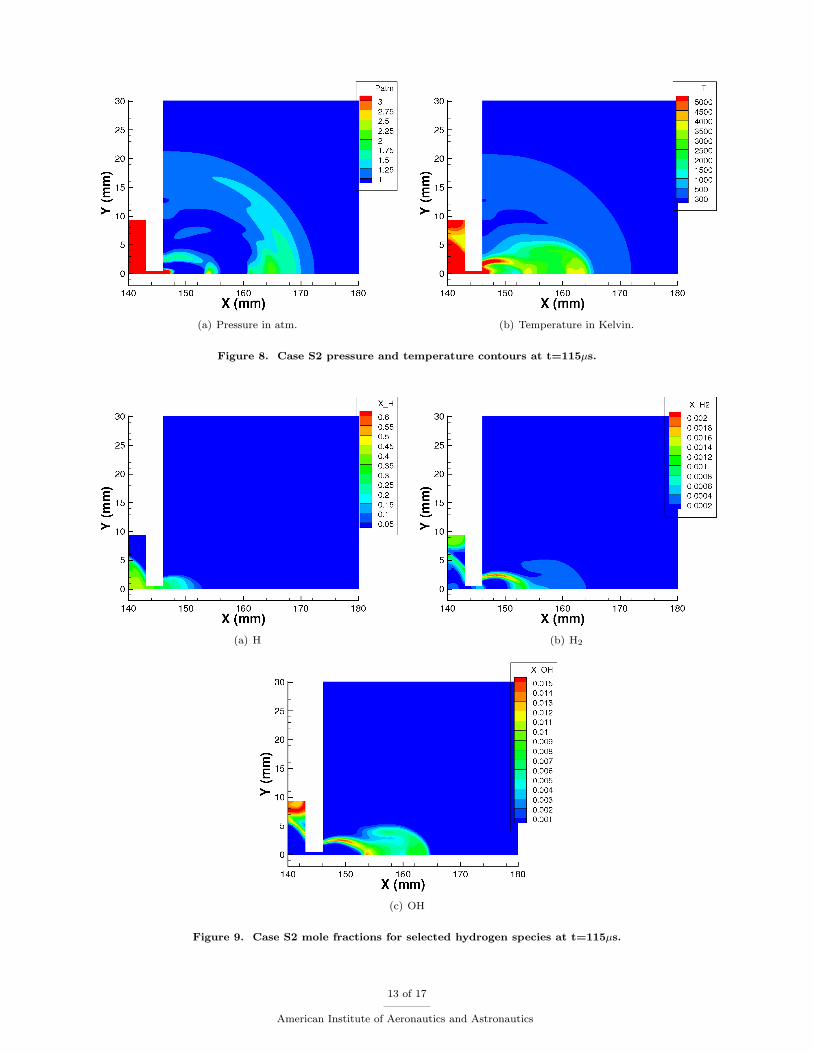
(a) Pressure in atm. (b) Temperature in Kelvin.
Figure 8. Case S2 pressure and temperature contours at t=115µs.
(a) H (b) H2
(c) OH
Figure 9. Case S2 mole fractions for selected hydrogen species at t=115µs.
13 of 17
American Institute of Aeronautics and Astronautics
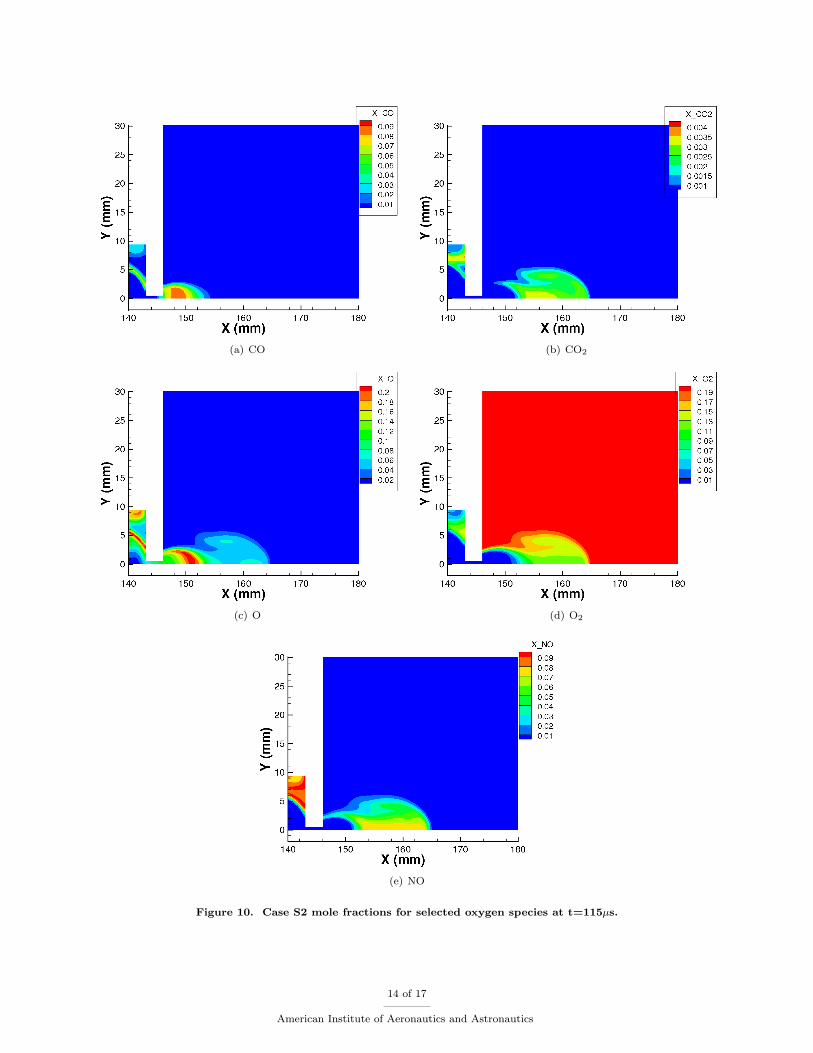
(a) CO (b) CO2
(c) O (d) O2
(e) NO
Figure 10. Case S2 mole fractions for selected oxygen species at t=115µs.
14 of 17
American Institute of Aeronautics and Astronautics
by simply eliminating species that do not contribute significantly to the plasma-air interaction, thus allowingfor a great increase in computational speed. Here we present what could be considered a minimalist modelfor the chemistry of the plasma-air interaction.
The simulations clearly indicate that all CxHy species can be eliminated, as they never present in abun-dance. Although CH does not present in the jet, it does appear in significant quantities in the capillary nozzle(0 mm ≤ x ≤ 13 mm). However, CH2 does not present significantly even in the nozzle, so could be eliminated.Some of Park’s Model can be neglected for ETC application. Although their atomic forms are prevalent,O2
+, N2+, and NO+ do not present significantly. The reason for this being that when temperatures are high
enough these molecular species tend to dissociate rather than ionize under these conditions.For 26 chemical species the implicit method has a 29x29 matrix to solve at every grid point, where 29
comes from 26 species plus two velocities plus energy. The elimination of six species reduces the implicitsubmatrix to 23x23, a reduction of 312 elements, or a reduction of 60%. Of course all chemical reactionsincluding these species would also be eliminated, resulting in a further increase. The reactions eliminatedfrom Table 1 are 4, 8, 15, 20, 23, 26, 27, 29, 30, 41, 42, 50, and 52-58, leaving a total of 41 reactions. Thisrepresents a significant speedup for the code.
D. Plasma-Air Chemistry in Practical ETC Application
All previous work on the expansion of the plasma jet and plasma-air chemistry for ETC application has hada major aspect in common: relatively large capillary-wall, or capillary-propellant, spacings. In the case ofcapillary-propellant spacing, there is typically a desire to inspect the propellant surface after it has beenexposed to the plasma as this is highly informative.20 It has been found in experiments, however, that forsmall capillary-propellant distances the propellant is cracked or shattered by the initial pressure wave fromthe capillary firing,21 leading to typical experimental capillary-propellant distances greater than 20 mm.When a large capillary-wall distance is used it is typically because there are pressure sensors located in thewall, as in Case S1, which are easily damaged by the high temperature, velocity and pressure of the jet nearthe capillary exit,21 again leading to larger sample distances.
In real ETC application, the geometry of the plasma jet expansion region is much different. There are anumber of different propellant packing options, but they primarily reduce to one of two choices. The first isto pack the chamber with different shape solid propellant blocks or loose propellant grain, leaving crevassesfor the ignition plasma to flow through. This packing can leave a small air pocket just outside the capillaryexit, or can be right up to the capillary itself.2 In fact there are results indicating that for most efficientETC ignition the capillary-propellant distance should be minimized.22
The second method is to have a central channel for plasma to flow through, resulting in a smallerinteraction region but a more uniform burn.22 This method is similar to the ignition method of solid rocketmotors.
With the first method, it is easy to see that plasma-air chemistry will have little effect, as there is littleair present in the regions between the tightly packed propellant blocks. The primary chemical mechanismwill be the interaction between the capillary plasma and the propellant surface and ablated propellant gasesand particulates. A similar conclusion is not so straight forward for the second method. As the plasmaadvances down the tube the plasma-air reaction zone will be pushed with it, which should severely limit thehigh temperature air-propellant reaction zone.
Evaluation of Case S1 at t=15 µs indicates that if the capillary-propellant distance is small (< 10mm), then there will be little to no plasma-air chemistry before the plasma-propellant interaction begins.Furthermore, any ionized, or otherwise affected, air species that are present will be transient, as the reactionzone will sweep past the propellant surface followed by the capillary plasma jet. The above information forpractical ETC application, along with the results for plasma-air reaction rates from Case S1, suggest thatin real ETC application the plasma-air interaction is perhaps completely negligible.
To test the importance of the plasma-air interaction in the second propellant packing option a simulationis conducted using the reduced chemistry model outlined above. The geometry for this simulation, labeledbelow as Case S3, is taken from Beyer et al.22 The capillary inflow is the same used as in Case S1 and CaseS2. In the experiment a tube (6.3 mm diameter, 152 mm length) was inserted into the cylindrical propellantgrain. The tube had eight sets of four holes to allow hot ignition gases to escape. Gas flows into the tubefrom the capillary and exits out the 32 vent holes.
To simulate this geometry the eight sets of holes are converted to eight axisymmetric slits of equal surfacearea, giving an individual slit width of 0.4 mm. A cell spacing of ∆x=0.05 mm is used due to the small size
15 of 17
American Institute of Aeronautics and Astronautics
of the outflow slits. A time step of ∆t=5x10⁻⁹ s is used. In the experiment there was no capillary nozzle,thus the simulation geometry is simply an axisymmetric rectangle 3.15 mm by 152 mm with outflow slitsevery 16.9 mm, with the capillary inflow at x=0 mm.
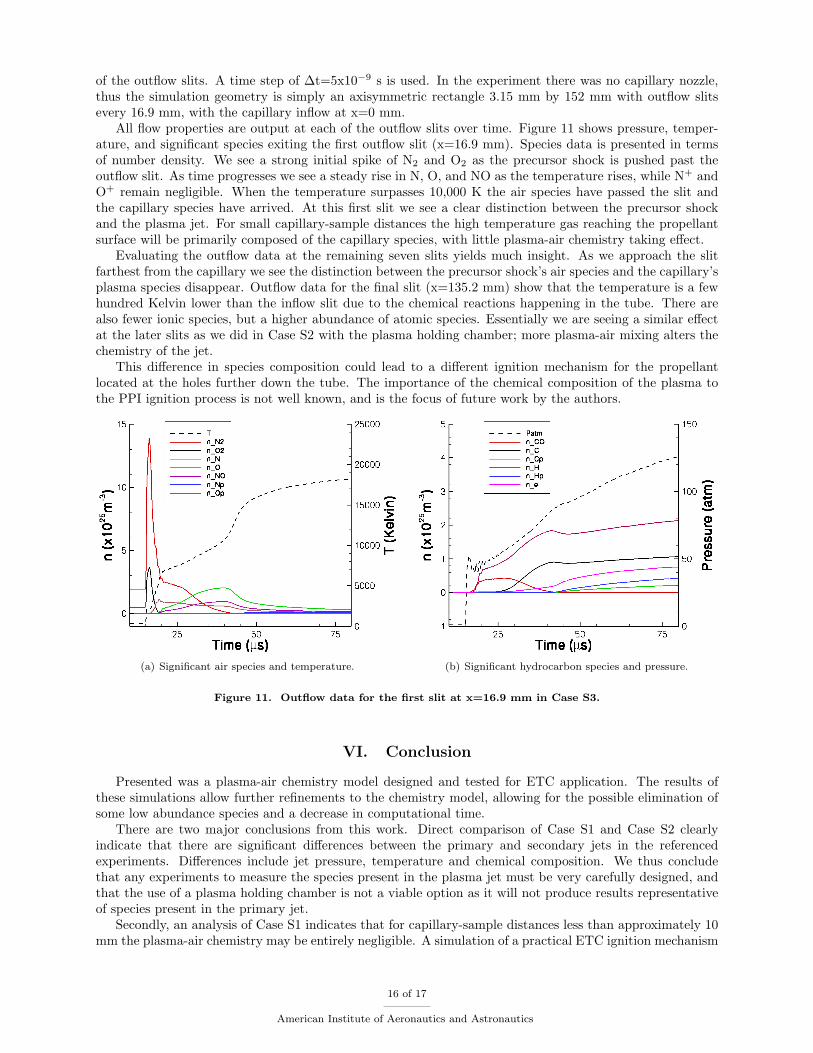
All flow properties are output at each of the outflow slits over time. Figure 11 shows pressure, temper-ature, and significant species exiting the first outflow slit (x=16.9 mm). Species data is presented in termsof number density. We see a strong initial spike of N2 and O2 as the precursor shock is pushed past theoutflow slit. As time progresses we see a steady rise in N, O, and NO as the temperature rises, while N+ andO+ remain negligible. When the temperature surpasses 10,000 K the air species have passed the slit andthe capillary species have arrived. At this first slit we see a clear distinction between the precursor shockand the plasma jet. For small capillary-sample distances the high temperature gas reaching the propellantsurface will be primarily composed of the capillary species, with little plasma-air chemistry taking effect.
Evaluating the outflow data at the remaining seven slits yields much insight. As we approach the slitfarthest from the capillary we see the distinction between the precursor shock’s air species and the capillary’splasma species disappear. Outflow data for the final slit (x=135.2 mm) show that the temperature is a fewhundred Kelvin lower than the inflow slit due to the chemical reactions happening in the tube. There arealso fewer ionic species, but a higher abundance of atomic species. Essentially we are seeing a similar effectat the later slits as we did in Case S2 with the plasma holding chamber; more plasma-air mixing alters thechemistry of the jet.
This difference in species composition could lead to a different ignition mechanism for the propellantlocated at the holes further down the tube. The importance of the chemical composition of the plasma tothe PPI ignition process is not well known, and is the focus of future work by the authors.
(a) Significant air species and temperature. (b) Significant hydrocarbon species and pressure.
Figure 11. Outflow data for the first slit at x=16.9 mm in Case S3.
VI. Conclusion
Presented was a plasma-air chemistry model designed and tested for ETC application. The results ofthese simulations allow further refinements to the chemistry model, allowing for the possible elimination ofsome low abundance species and a decrease in computational time.
There are two major conclusions from this work. Direct comparison of Case S1 and Case S2 clearlyindicate that there are significant differences between the primary and secondary jets in the referencedexperiments. Differences include jet pressure, temperature and chemical composition. We thus concludethat any experiments to measure the species present in the plasma jet must be very carefully designed, andthat the use of a plasma holding chamber is not a viable option as it will not produce results representativeof species present in the primary jet.
Secondly, an analysis of Case S1 indicates that for capillary-sample distances less than approximately 10mm the plasma-air chemistry may be entirely negligible. A simulation of a practical ETC ignition mechanism
16 of 17
American Institute of Aeronautics and Astronautics
was conducted to evaluate this hypothesis.This work is part of a larger attempt to model and study the plasma-propellant interaction. The results
of these simulations and others using the model developed will allow for better estimates of the plasmacomposition in the plasma-propellant interaction, and thus better model results.
Acknowledgments
The authors gratefully acknowledge the financial support by the Army Research Office, Grant No.W911NF-04-1-0251 (Dr. Ralph Anthenien, technical monitor). This work is also supported by the Francois-Xavier Bagnound Foundation. Porwitzky would also like to thank Tom Schwartzentruber for many helpfuldiscussions and suggestions regarding CFD techniques, as well as David Berger for the data stripping code.
References
1Koleczko, A., Ehrhardt, W., Kelzenberg, S., and Eisenreich, N., “Plasma ignition and combustion”, Prop. Explos.Pyrotech., vol. 26, pp. 75-83, 2001.
2Dyvik, J., Herbig, J., Appleton, R., O’Reilly, J., and Shin, J., “Recent Activities in Electrothermal Chemical LauncherTechnologies at BAE Systems”, IEEE Trans. on Magnetics. vol. 43, no. 1, pp. 303-307, January 2007.
3Keidar, M., and Boyd, I. D., “Ablation study in the capillary discharge of an electrothermal gun”, Journal of AppliedPhysics, vol. 99, 053301, 2005.
4Porwitzky, A. J., Keidar, M., and Boyd, I. D., “Modeling of the Plasma-Propellant Interaction”, IEEE Trans. onMagnetics. vol. 43, no. 1, pp. 313-317, January 2007
5Scalabrin, L. C., and Boyd, I. D., “Development of an Unstructured Navier-Stokes Solver For Hypersonic NonequilibriumAerothermodynamics”, 38th AIAA Thermophysics Conference, 6-9 June 2005, Toronto, Canada.
6Scalabrin, L. C., and Boyd, I. D., “Numerical Simulation of Weakly Ionized Hypersonic Flow for Reentry Configuations”,9th AIAA/ASME Joint Thermophysics and Heat Transfer Conference, 5-8 June 2006, San Francisco, California.
7Nusca, M. J., Anderson, W. R., and McQuaid, M. J., “Multispecies Reacting Flow Model for the Plasma Efflux of anETC Ignited–Application to an Open-Air Plasma Jet Impinging on an Instrumented Probe,” ARL-TR-3227, July 2004.
8Nusca, M. J., McQuaid, M. J., and Anderson, W. R., “Numerical Simulation of an Open-Air Plasma Jet Using a Multi-Species Reacting Flow CFD Code”, 31st AIAA Plasmadynamics and Lasers Conference, 19-22 June 2000, Denver, Colorado.
9Sutton, K., and Gnoffo, P. A., “Multi-Component Diffusion with Application to Computational Aerothermodynamics”,7th AIAA/ASME Joint Thermophysics and Heat Transfer Conference, June 15-18, 1998, Albuquerque, New Mexico.
10Keidar, M., Boyd, I. D., Williams, A., and Beyer, R., “Ablation Study in a Capillary Sustained Discharge”, IEEETransactions on Magnetics, vol. 43, no. 1, pp. 308-312, January 2007.
11Li J., Litzinger, T. A., Das, M., and Thynell, S. T., “Study of Plasma-Propellant Interaction During Normal Impinge-ment”, Journal of Propulsion and Power, Vol. 22, No. 5, September-October 2006.
12Li J., Litzinger, T. A., Das, M., and Thynell, S. T., “Recombination of Electrothermal Plasma and Decomposition ofPlasma-Exposed Propellants”, Journal of Propulsion and Power, Vol. 22, No. 6, November-December 2006.
13Gupta, R. N., Yos, J. M., Thompson, R. A., Lee, K., “A Review of Reaction Rates and Thermodynamic and TransportProperties for an 11-Species Air Model for Chemical and Thermal Nonequilibrium Calculations to 30000K,” NASA ReferencePublication 1232, 1990.
14“GRI-Mech Home Page”, http://www.me.berkeley.edu/gri mech/.15Chang, Y., and Ordonez, C. A., “Semi-Empirical Ionization and Excitation Rate Coefficients for Hydrogen, Helium, and
Oxygen Atoms and Ions in Plasmas”, AIP Conference Proceedings, 10 June 1999, vol. 475, pp. 887-890.16Chang, Y., and Ordonez, C. A., “Generalization of the Arrhenius relation and ionization reaction rates for carbon atoms
and ions in plasmas”, Chemical Physics, vol. 231, pp. 27-30, 1998.17Field, F. H., and Franklin, J. L., “Electron Impact Phenomena and the Properties of Gaseous Ions,” Academic Press,
New York, Revised Edition, 1970.18McBride, B. J., and Gordon, S., “Computer Program for Calculation of Complex Chemical Equilibrium Compositions
and Applications; II. Users Manual and Program Description,” NASA Reference Publication 1311, June 1996.19Li, J., private communication, 29 March 2007.20Pesce-Rodriguez, R. A., and Beyer, R. A., “A Theory of Plasma-Propellant Interactions”, ARL-TR-3286, September
2004.21Li J., Litzinger, T. A., and Thynell, S. T., “Interaction of Capillary Plasma with Double-Base and Composite Propellants”,
Journal of Propulsion and Power, Vol. 20, No. 4, July-August 2004.22Beyer, R., Brant, A. L., “Plasma Ignition in a 30-mm Cannon”, IEEE Transactions on Magnetics, vol. 43, no. 1, pp.
294-298, January 2007.
17 of 17
American Institute of Aeronautics and Astronautics