the organization of economists in regulatory · the organization of economists in regulatory ....
TRANSCRIPT


The Organization of Economists in Regulatory Agencies: Does Structure Matter?
Jerry Ellig and
Catherine Konieczny
OEA Working Paper 48 Office of Economics and Analytics
Federal Communications Commission Washington, DC 20554
April 2019
These working papers are intended to stimulate discussion and critical comment within the FCC, as well as outside the agency, on issues that may affect communications policy. The analyses and conclusions set forth are those of the authors and do not necessarily reflect the view of the FCC, other Commission staff members, or any Commissioner. Given the preliminary character of some titles, it is advisable to check with the authors before quoting or referencing these working papers in other publications. All titles are available on the FCC website at https://www.fcc.gov/reports-research/working-papers/.

ii
OEA Working Paper 48
Abstract The Federal Communications Commission (FCC) has voted to reorganize most of its economists into an Office of Economics and Analytics in an effort to improve the quality and use of economic analysis. A classic question in organization theory is whether an organization can better utilize the expertise of specialized professionals by grouping them together in a functional organization or mixing them with other professionals in multiple divisional organizations that focus on different topics, technologies, customer segments, or geographical regions.
This paper performs an empirical assessment of organization strategy, employing two different data sets that measure the quality and influence of economic analysis accompanying economically significant regulations from executive branch agencies. It finds that the quality of regulatory impact analysis is better when economists who work on regulations are organized into a separate unit managed by other economists, or when the regulations and analysis are reviewed by economists in a unit separate from the program office that wrote the regulations. Functional organization of economists is not associated with a reduction in economists’ influence on decisions.

The Organization of Economists in Regulatory Agencies: Does Structure Matter?
Jerry Ellig and Catherine Konieczny1
1. Introduction High-quality economic analysis can promote welfare-enhancing regulatory decisions.
Airline deregulation, for example – which Alfred Kahn pursued incrementally as chairman of the Civil Aeronautics Board before the Airline Deregulation Act of 1978 – was motivated in part by an extensive body of academic research (Hazlett 2011, 2-3). The Reagan administration’s regulations that sped up the removal of lead from gasoline were prompted by research showing that the benefits to human health were large and a lead allowance trading system could significantly reduce the overall cost of achieving the goal (Hahn and Tetlock 2008, 68-70).
In his case study of a 2004 Environmental Protection Agency regulation requiring power plants to design cooling water intake structures that minimize harm to marine organisms, Farrow (2009, 182) concluded, “EPA clearly chose an approach that imposed a considerably lighter burden on society … The record provides substantial evidence that the agency considered a lower-cost alternative to meeting a standard with the potential to save approximately $3 billion in annualized dollars or approximately $40 billion in present value.” In a generally pessimistic assessment of the effects of regulatory impact analysis on federal regulations, Hahn and Tetlock (2008, 80) nevertheless state, “We think, but we cannot prove definitively, that many regulatory proposals have their net benefits improved by at least a billion dollars annually as a result of analysis and evaluation.” (For other examples, see Graham 2008, McGarity 1991, Morgenstern 1997.)
The desire to improve regulation through better economic analysis has fueled interest in the question of whether organizational structure could affect the quality of economic analysis or the influence of economists on decisions. Scholars have previously analyzed functional organization of economists employing organization theory, case studies, and interviews (Froeb, 1 Jerry Ellig is a Former Chief Economist of the Federal Communications Commission and a Research Professor at the Regulatory Studies Center, George Washington University. He can be reached at [email protected]. Catherine Konieczny is a Former Intern, Office of Strategic Plans and Policy, Federal Communications Commission, and an Economist at the Standards Evaluation & Analysis Division, United States Coast Guard. The analyses and conclusions set forth in this paper are those of the authors and do not necessarily reflect the view of the FCC, other Commission staff members, or any Commissioner, nor are they intended as comment on the organization of the U.S. Coast Guard.
The authors thank Stuart Shapiro for graciously sharing data from his and John Morrall’s evaluations of regulatory impact analysis. We received numerous helpful comments from Octavian Carare, Thomas Hazlett, Paul Lafontaine, Wayne Leighton, Jay Schwarz, Patrick Sun, Tracy Waldon, Bruce Yandle, Aleks Yankelevich, participants at the Public Choice Society meetings in 2018, and numerous other colleagues who participated in a brown bag workshop presentation at the FCC.
2
OEA Working Paper 48
Pautler, and Röller 2008; Nou 2015; Shapiro 2016; Shapiro 2017). A consistent conclusion is that organization of economists (or other specialized analysts) into a separate functional division has the potential to improve the quality of economic analysis and gives analysts greater freedom to offer frank recommendations based on their analysis.
On the other hand, functional organization has the potential to decrease the influence of economic analysis by increasing the cost of coordinating economists’ analysis with the work of the regulation-writers, raising the odds that the economists will simply be ignored (Brennan 2017). Finally, the literature suggests some strategies for mitigating tradeoffs, such as involving economists on cross-functional teams at the outset and allowing the economics division to make its own, independent recommendations to decision-makers (Froeb, Pautler, and Röller 2008, 18; Hazlett 2011, 7-10; and Shapiro 2017, 692-93).
As Shapiro (2017, 689) notes, “Conducting a large-scale study with sufficient sample size to produce statistically significant results would be exceptionally challenging.” This paper takes up that challenge by offering the first quantitative exploration of these issues. We employ two different data sets on the quality and use of regulatory impact analysis to explore whether functional organization of economists is associated with higher-quality economic analysis of regulations or reduced influence of economists on decisions. We find that functional organization of economists is associated with higher-quality analysis, but not with a reduction in the measurable influence of analysis on decisions. This suggests that executive branch agencies employing functional organization of economists have found ways to achieve the potential benefits of this organizational form while avoiding its potential costs.
Research on this topic is timely as leadership debates the organization and role of economists in regulatory agencies. In 2012 the Securities and Exchange Commission expanded its economics division and made the chief economist a direct report to the commission chair, instead of having the chief economist report through an attorney. In January 2018, the Federal Communications Commission (FCC) voted to create an Office of Economics and Analytics, which consolidated into one unit economists who previously were dispersed among the FCC’s operating bureaus. A decade earlier, the Swedish Competition Authority dissolved its Department of Economic Analysis and moved its economists into the various operating bureaus; the Center for American Progress advised the Obama administration to do the same with the Federal Trade Commission’s Bureau of Economics (Froeb, Pautler, and Röller 2008, 1-4). Our statistical results suggest, consistent with prior case study research, that functional organization of economists has the potential to improve the quality of economic analysis in regulatory agencies without diminishing economists’ influence on decisions.
2. Functional vs. Divisional Organization Management practices in industrial organization have experienced waves of popularity.
In recent years use of specialized workers has taken a turn in the spotlight. An important concern is how to organize and manage these workers. Specialized workers include lawyers, risk assessors, risk managers, engineers, and sometimes even economists, whose input is sought to develop options to address a problem and assess the consequences. These specialized workers provide analysis that in some way informs decisions. The analysis may provide the structure of a project, or check the quality of work already produced by others. Kept separate from a project
3
OEA Working Paper 48
team, the specialist can add fresh perspective and independence when brought on, but working regularly with a team may allow the specialist to provide insight throughout the project.
Should specialists be integrated into each office so that they continually contribute to and monitor projects throughout their development, or should they be organized and managed in their own functional unit and assigned to projects as needed? The field of risk analysis has asked this sort of question before; should risk assessors and risk managers be kept separate? (Williams and Thompson 2004). Fields that make use of attorneys grapple with having attorneys manage other workers or simply provide legal advice as needed (Markham, 2003). Engineers too debate whether it is sufficient to review a project developed by designers or if the engineers themselves should produce all the designs (Quinnell 2017).
The placement and management of these specialists changes who oversees their work, the culture they operate in, and even what information they have access to (Shapiro and Stanley 2016). When kept in an independent functional unit, scientists are managed by other scientists who share their specialized training. We call this arrangement “functional organization.” Goal-setting and monitoring rewards work that scientists see as valuable, which may differ from the priorities set by non-scientists. Put into context, if asked to evaluate a project, the way in which the analysis is conducted might change if the quality of that analysis is judged by the manager of the project or an independent reviewer. A manager with a vested interest in a project being approved is likely to favor an analysis that supports approval, perhaps at the cost of analytic accuracy. The analyst then faces pressure from his or her supervisors to produce analysis that supports decisions already made, rather than producing more objective analysis that may challenge the managers’ decisions.
There have even been instances in which non-economist managers altered the economic analysis to support positions they wanted the agency to take (see Williams 2008 for examples). One economist interviewed by Shapiro (2017, 691) noted, “It’s very difficult to conduct a BCA [benefit-cost analysis] if your boss wrote what you are analyzing.” The potential impact on the quality of both analysis and decisions makes the organization of scientists an important organizational decision.
The organization of economists in executive branch regulatory agencies presents a unique opportunity to assess the effects of organizational structure on the quality of analysis produced by specialists and their influence on decisions. Economists as specialized scientists are critical inputs to the output of regulations produced by agencies. Executive Order 12866 requires each Executive Branch agency to produce an assessment of the benefits and costs of major proposed regulations and their alternatives. For agency heads who direct the promulgation of rules, how to organize economists that produce impact analyses becomes an essential decision.
Froeb, Pautler, and Röller (2008) provide a straightforward theoretical foundation for comparing the benefits and costs of functional organization, where economists are grouped together into one office, versus divisional organization, where economists are divided among program offices. Their paper uses organization theory to frame the tradeoffs that organizations make when choosing one structure over another (Froeb, Pautler, and Röller, 2008, 9, 15).
Functional organization encourages development of analytical capacity by making it easier for the organization to exploit economies of scale, facilitates better quality control of the economists’ work, makes it easier to identify and reward economic expertise, encourages

4
OEA Working Paper 48
development of a common framework for analysis, and encourages economists to share and develop ideas on new analytical methods. Giving economists a degree of autonomy creates incentives for them to supply more objective analysis of policies, because such work enhances their standing in the economics profession (Hazlett 2011, 6). On the other hand, functional organization can also lead to less communication and coordination between economists and other professionals (primarily attorneys) whose decisions they seek to inform.
Citing examples of functional organization like the FTC and the European Commission’s Competition Directorate, Froeb, Pautler, and Röller (2008, 18) conclude that functional organization produces better economic analysis but also makes integration of that analysis into decisions more difficult. They suggest the latter problem can be solved by increasing horizontal linkages at various points in the functional hierarchies – such as involving economists on cross-disciplinary teams when investigations are initiated, and weekly meetings between mid-level managers to coordinate the attorneys’ and economists’ work on cases. Similarly, Hazlett (2011, 7-10) notes that although the US antitrust agencies have economics offices managed by economists, economists are also integrated into the agencies’ hierarchies and workflow.
2.1 Functional organization of economists in regulatory agencies Organization of economists in federal regulatory agencies takes two different forms. In
some agencies, the economists who help develop and analyze regulations are functionally organized into their own office reporting to other economists rather than the program office that writes regulations. The National Highway Traffic Safety Administration, for example, has a regulatory analysis and evaluation division in its National Center for Statistics and Analysis, which is separate from the rulemaking division (NHTSA organization chart, 2018).
In other agencies, economists may be dispersed throughout the program offices that write regulations. In either functional or divisional organizations there may also be a structure of peer review, where a second group of economists located elsewhere in the organization reviews regulatory analyses (Nou 2015, 453). The Environmental Protection Agency’s National Center for Environmental Economics, for example, reviews regulations and regulatory analyses produced by economists that write specific types of regulations in the EPA’s various program offices.
Peer review is not limited to academics. Many fields not directly supported by the production of journal articles nevertheless rely heavily on scientifically reviewed analysis. For example, engineering firms seek peer review on design plans to check errors that only a fresh set of eyes could capture and which risk the project failing to meet quality standards (NASA Systems Engineering Handbook, 2007). Put simply, peer review provides an additional incentive for an initial producer of analysis to do good work, knowing that the work will be judged by someone else with similar professional qualifications.
These differences in organization change how the analysis supporting regulatory action is produced and reviewed. We use two different samples of regulations to examine whether structural differences are correlated with the quality of analysis produced and the influence of economists on decisions. Appendix 1 lists all of the regulations, along with the department and agency within the department issuing each regulation. In the empirical discussion that follows, we use the term “department” to refer to the Cabinet department that issued the regulation, and

5
OEA Working Paper 48
the term “agency” to refer to the agency, office, division, or other entity within the department that actually wrote the regulation.
The first column of Table 1 lists the agencies producing the regulations in our sample that organize the economists who analyze regulations functionally. In three cases of our sample (NHTSA, FDA, and OCC), just one agency in a department organizes economists who work on regulations functionally; the rest of the agencies in those departments do not. In the Department of Labor, all of the agencies in our sample organize economists who work on regulations functionally. The second column lists the four departments that employ a second set of economists within the department to review regulations and the accompanying analysis.
Table 1: Functional Organization and Independent Economist Review
Functional Organization of Economists Review by Economists in a Separate Office
Department of Health and Human Services – Food and Drug Administration
Department of Agriculture
Department of Labor Department of Health and Human Services Department of Transportation – National Highway Traffic Safety Administration
Department of Homeland Security
Department of the Treasury – Office of Comptroller of the Currency
Environmental Protection Agency
2.2 Prior literature on functional organization of economists Prior literature on functional organization of economists consists primarily of case studies
and interviews. Both types of research generally conclude that functional organization can improve the quality of analysis but may reduce economists’ influence on decisions if they are not involved in regulatory planning at the early stages of the process.
The Economic Policy Office of the Antitrust Division within the Department of Justice, established in 1974, is an early example of centralized organization of economists. The goal of the new office was to integrate economists into analysis and improve input on investigations. The structure as an independent office was expected to solve four problems, 1) other staff were skeptical of economic analysis (and thus economists) 2) analysis after an investigation was already started only avoided bad mistakes but little else, 3) analysis was inconsistent and 4) the office struggled to attract competent professionals (Kauper 1984, 119-21). Ten years later, the role of economists within the DOJ expanded and the initial goals were achieved, so that antitrust cases were evaluated with economic analysis and were not filed in court if the analysis did not support action (Kauper, 1984, 128).
The FTC also has experience with functional organization of economists, who are located in a separate Bureau of Economics. A 2015 evaluation by the FTC’s Office of Inspector General noted, “Virtually all stakeholders interviewed recognized the importance of the BE’s purpose in providing unbiased and sound economic analysis to support decision-making – a function that is facilitated by its existence as a separate organization.” (FTC 2015, 9) This structure has helped
6
OEA Working Paper 48
the economists remain an independent voice as administrations have changed. The influence of economics at the FTC is widely acknowledged to be both pervasive and difficult to measure (Pautler 2015, 115-17).
In contrast to many regulatory agencies, a great deal of the FTC’s workload – and hence a great deal of its economic analysis – focuses on enforcement cases under the antitrust and consumer protection laws, rather than actual writing of regulations. An empirical study found that Bureau of Economics recommendations have a statistically significant effect on FTC decisions on merger cases, but not as large of an effect as the Bureau of Competition’s recommendations (Coate 2000). Jonathan Baker, who served as director of the FTC’s Bureau of Economics during the Clinton administration, argues that institutionalizing the bureau’s role in commission decisions has created “continuous regulatory reform,” in the form of routine application of benefit-cost analysis in decision-making (Baker 1997, 868-69).
In a set of interviews with 16 economists and 16 environmental assessors at federal regulatory agencies, Shapiro finds that independence presents a trade-off, with economists citing the importance of independence more often than environmental analysts. Greater independence gives economists greater ability to challenge decisions. To a large extent this occurs for the simplest of reasons: if economists are not evaluated by the decision-makers whose proposals they analyze, they have greater freedom to be critical (Shapiro 2017, 691). On the other hand, being placed outside the program office also creates the risk that the economists will be brought into the process after key decisions have already been made. “Analysts in free-standing organizational units have to fight more to be brought into decisions while the decisions are still ripe to be changed.” (Shapiro 2017, 685) Most of the economists Shapiro interviewed seem willing to accept this tradeoff, preferring to have the opportunity to provide decision-makers with independent advice even if they are often brought into the process later. Environmental assessors also preferred independence, and they noted more frequently than the economists that their agencies kept them involved early in the process by including them on cross-functional teams. This mirrors the experience of economists at the federal antitrust agencies, which also include the economists on cross-functional teams. For high-profile decisions, though, the environmental assessors’ experience was more like that of the economists; they were more likely to be brought into the process after major decisions were already made (Shapiro 2017, 692-93).
In other work, Shapiro (2016) tracks the history of how analysis has been used in the regulatory process and where benefit-cost analysis and impact analysis have the greatest correlation with quality. He argues that the use of such analysis depends in part on how well economists have been integrated into the regulatory structure introduced by executive orders and Circular A4, the Office of Management and Budget’s (OMB’s) guidance to executive branch agencies on how to conduct regulatory impact analysis.
An earlier survey of economists at federal health and safety regulatory agencies sought to determine what made economists feel their work was influential, and if they felt they had enough influence within their agencies (Williams 2008). The survey shows that economists feel they should have more influence in the development of regulations, but their impact is difficult to measure. On a scale of 1-10, on average the economists believed that they should have influence at a level of about 7.5. In contrast, the average level of influence they perceived they had was

7
OEA Working Paper 48
about 5 (Williams 2008, 4). When asked what factors reduced their influence, economists cited the prevalence of “group think,” pressures to continue with initial proposals rather than examine a range of options, and perverse incentives faced by leadership (Williams 2008, 11). They also noted organizational factors, such as whether economists are located in the same office responsible for developing regulations, and whether they are managed by other economists (Williams 2008, 6-12).
The effects of internal peer review on the quality of the regulatory agency’s decisions have also been studied (Noah 2000). The first clear use of an independent review board was in an application of the Endangered Species Act in 2001, where the “Klamath Committee” reviewed two competing agency proposals (Ruhl and Salzman 2006). Wagner (1995) contends that the committee’s review would scrutinize the reasoning supporting the competing proposals to reveal scientific uncertainty underlying an agency decision and reveal instances where data were misused to justify a decision. Review applies additional scrutiny to statistical design, data methodology and presentation, which are key measures of quality of analysis (OMB 2003). Knowing that any analysis will be reviewed by an independent group, the producers have an incentive to produce higher quality analysis that will be accepted by those peers. The key to that incentive is that the reviewing group can level critiques without being punished and has no incentive tied to the outcome of the analysis.
3. Econometric Analysis Based on the foregoing theory and case studies, we hypothesize that functionally
organized economists will produce higher quality analysis, and that analysis reviewed by a group of other economists will be better than un-reviewed analysis. We predict that the potential effect of functional organization on economists’ influence is ambiguous, depending on whether agencies successfully mitigated tradeoffs of functional organization. This study uses two different data sets that evaluate the quality of regulatory impact analyses and indicate whether economists are likely to have influenced regulatory decisions.
3.1 Data 3.1.1 Dependent variables
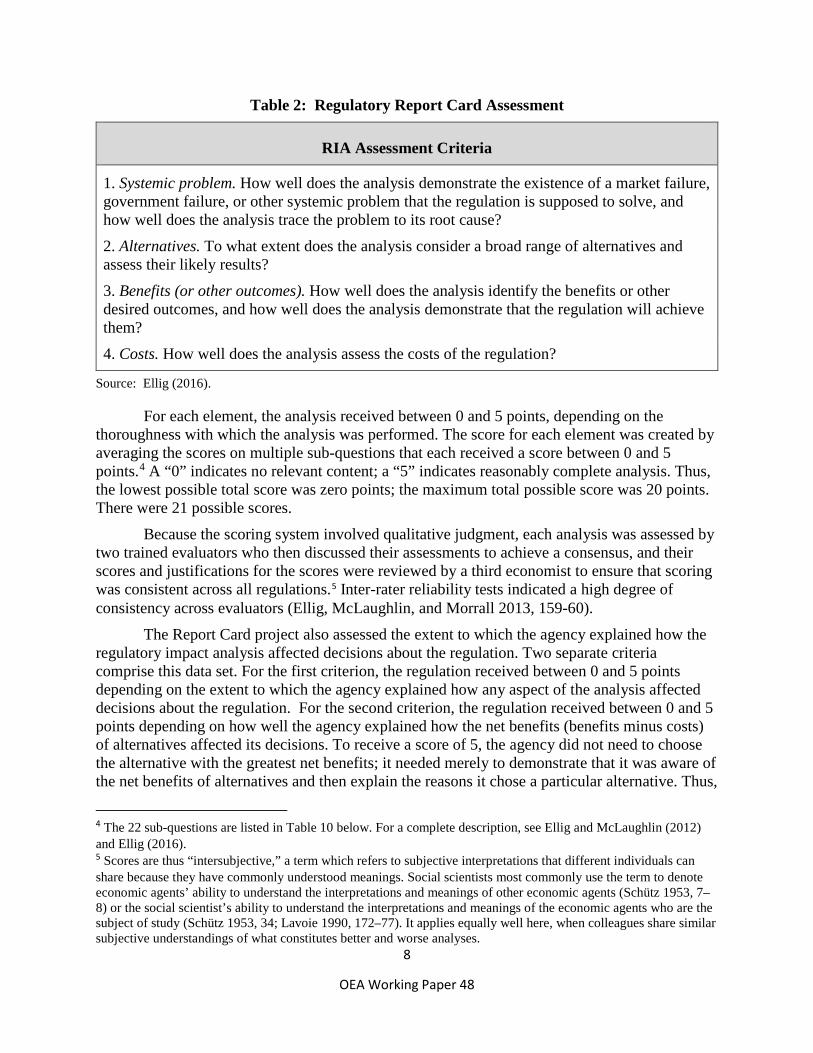
The first data set measuring the quality of economic analysis was developed as part of the Regulatory Report Card project at the Mercatus Center at George Mason University (Ellig and McLaughlin 2012; Ellig 2016). This project evaluated the economic analysis accompanying the 130 prescriptive, economically significant, proposed regulations that cleared OIRA review between 2008 and 2013.2 The Report Card project assessed the quality of the agency’s analysis for the four key elements of regulatory impact analysis listed in Table 2.3
2 “Economically significant” regulations are those that have costs or other economic effects exceeding $100 million annually or that meet other criteria specified in section 3(f)(1) of Executive Order 12866. “Prescriptive” regulations contain mandates or prohibitions. They are distinct from budget regulations, which implement federal spending programs or revenue-collection measures. 3 These four elements are widely recognized as the key elements of a regulatory impact analysis. See, e.g., OMB (2003); GAO (2014, 3).
8
OEA Working Paper 48
Table 2: Regulatory Report Card Assessment
RIA Assessment Criteria
1. Systemic problem. How well does the analysis demonstrate the existence of a market failure, government failure, or other systemic problem that the regulation is supposed to solve, and how well does the analysis trace the problem to its root cause? 2. Alternatives. To what extent does the analysis consider a broad range of alternatives and assess their likely results? 3. Benefits (or other outcomes). How well does the analysis identify the benefits or other desired outcomes, and how well does the analysis demonstrate that the regulation will achieve them? 4. Costs. How well does the analysis assess the costs of the regulation?
Source: Ellig (2016).
For each element, the analysis received between 0 and 5 points, depending on the thoroughness with which the analysis was performed. The score for each element was created by averaging the scores on multiple sub-questions that each received a score between 0 and 5 points.4 A “0” indicates no relevant content; a “5” indicates reasonably complete analysis. Thus, the lowest possible total score was zero points; the maximum total possible score was 20 points. There were 21 possible scores.
Because the scoring system involved qualitative judgment, each analysis was assessed by two trained evaluators who then discussed their assessments to achieve a consensus, and their scores and justifications for the scores were reviewed by a third economist to ensure that scoring was consistent across all regulations.5 Inter-rater reliability tests indicated a high degree of consistency across evaluators (Ellig, McLaughlin, and Morrall 2013, 159-60). The Report Card project also assessed the extent to which the agency explained how the regulatory impact analysis affected decisions about the regulation. Two separate criteria comprise this data set. For the first criterion, the regulation received between 0 and 5 points depending on the extent to which the agency explained how any aspect of the analysis affected decisions about the regulation. For the second criterion, the regulation received between 0 and 5 points depending on how well the agency explained how the net benefits (benefits minus costs) of alternatives affected its decisions. To receive a score of 5, the agency did not need to choose the alternative with the greatest net benefits; it needed merely to demonstrate that it was aware of the net benefits of alternatives and then explain the reasons it chose a particular alternative. Thus,
4 The 22 sub-questions are listed in Table 10 below. For a complete description, see Ellig and McLaughlin (2012) and Ellig (2016). 5 Scores are thus “intersubjective,” a term which refers to subjective interpretations that different individuals can share because they have commonly understood meanings. Social scientists most commonly use the term to denote economic agents’ ability to understand the interpretations and meanings of other economic agents (Schütz 1953, 7–8) or the social scientist’s ability to understand the interpretations and meanings of the economic agents who are the subject of study (Schütz 1953, 34; Lavoie 1990, 172–77). It applies equally well here, when colleagues share similar subjective understandings of what constitutes better and worse analyses.

9
OEA Working Paper 48
the score evaluates the extent to which the agency was cognizant of net benefits when it made its decisions. In the econometric analysis below, we use the scores on these two criteria as indicators of economists’ influence on the decisions. Even if the agency did not always choose the regulatory strategy that maximized economic efficiency, a more thorough explanation of how regulatory decisions are related to economic analysis provides an indication that the decision-makers at least had to consider the implications of the analysis. We can infer, but not directly observe, that economists may have been involved earlier or more extensively in decisions if the scores on either of these criteria are higher.
The second data set measuring the quality of agency economic analysis was developed by Shapiro and Morrall (2012), who evaluated the economic analysis accompanying 100 economically significant final rules issued by executive branch agencies between October 2000 and September 2009 for which the agencies provided monetized estimates of both benefits and costs. Shapiro and Morrall used a six-point scale, based on a checklist developed by OIRA, to assess whether the agency’s analysis covered six significant elements of regulatory impact analysis. Table 3 lists the criteria.
Table 3: Shapiro-Morrall Assessment
RIA Assessment Criteria
1. Does the analysis include a statement of need for federal regulation, including market failure or other compelling public purpose? 2. Does the analysis identify and examine a sufficient number of reasonable alternative approaches? 3. Does the analysis quantify and monetize benefits and costs of proposed action? 4. Does the analysis quantify and monetize benefits and costs of main alternative approaches? 5. Does the analysis discount future benefit and cost streams at three percent and seven percent? 6. Are uncertainties in estimates clearly presented? Does the analysis contain a formal uncertainty analysis if the rulemaking has more than a $1 billion cost or benefit in any year?
Source: Shapiro and Morrall (2012).
An analysis received one point for each item in the checklist it contained, for a maximum possible total of six points. Half-points were sometimes awarded to grant partial credit. Thus, the minimum possible score was zero points; the maximum possible score was 6 points. Because half-point increments could be awarded, there were 11 possible scores. Both sets of evaluation scores measure the quality of the regulatory agency’s economic analysis, not the quality of the regulation. Common sense suggests that in the absence of reliable information about the nature and significance of the problem and the benefits and costs of alternatives, agencies may adopt regulations that fail to solve real problems or overlook more effective or less costly alternatives. Case studies confirm this conjecture (see Farrow 2009, Graham 2008, McGarity 1991, Morgenstern 1997), but we are aware of no data analysis that
10
OEA Working Paper 48
assesses the relationship between the quality of the ex-ante analysis and the quality of the regulation. The Report Card is more of a qualitative evaluation than the Shapiro-Morrall evaluation. Consequently, the two data sets cannot be pooled. The econometric analysis below employs separate regressions for each of the two data sets.
3.1.2 Explanatory variables Scholars have hypothesized that the quality of economic analysis and its influence in decisions are affected by several distinct types of constraints: institutional, political, and legal (Arbuckle 2011, Brito and DeRugy 2009, Dudley 2009; Ellig, McLaughlin, and Morrall 2013; Kagan 2001, McLaughlin 2011; Shamoun and Yandle 2016, Shapiro 2016, Shapiro and Morrall 2012, Shapiro and Wright 2011; Williams 2008). Organizational structure is the key institutional issue of interest for this study, but the full econometric model includes control variables for the other types of constraints as well. Institutional constraints. Our model includes two types of institutional constraints: constraints that are characteristics of the agency issuing the regulation, and external constraints associated with the individual regulation.
Two variables indicate how economists involved in regulatory analysis and review are organized in the agency and in the department that issued the regulation. The variable Functional organization indicates whether the economists who performed the economic analysis of the regulation are organized in a functional unit where they are managed and supervised by other economists rather than the program staff who develop the regulations. Thus, this variable indicates whether the economists who conduct the regulatory analysis enjoy a degree of independence from the agency staff who write regulations. In the other agencies, economists are either in the program office that writes regulations, or the program office employs outside economic consultants.
The variable Economist review indicates whether the regulation and accompanying analysis are reviewed by a second set of economists located elsewhere in the department, such as the secretary’s office, the departmental policy office, or the office of a departmental chief economist. Thus, this variable provides a different perspective on economist independence by indicating whether the department has an economics office that performs a review function independent of the offices that write regulations.
The primary published source for coding agencies is provided by Shapiro and Stanley (2016), which is based in part on interviews with agency economists conducted by Shapiro (2016). This source classifies agencies that produce most of the regulatory impact analyses that have quantified estimates of benefits and costs used in Shapiro and Morrall (2012). To cross-check Shapiro and Stanley’s categorizations and classify agencies they did not consider, we consulted agency organization charts online and conducted interviews with knowledgeable federal regulatory officials who were promised anonymity. Table 1 lists the agencies and departments that organize their economists functionally at the agency level or utilize department-level peer review for regulatory analyses. This list expands on the three categories listed by Shapiro and Stanley by considering the correlation of review and functional organization with quality separately, which allows for four possible combinations of the two variables, illustrated

11
OEA Working Paper 48
in Table 4. The list of regulations in Appendix 1 indicates how each regulation was coded for Functional organization and Economist review.6
Table 4: Examples of Functional Organization and Economist Review
Functional Organization Divisional Organization
Review by economists in a separate office
Food and Drug Administration (HHS)
Environmental Protection Agency
No review by economists in a separate office
National Highway Traffic Safety Administration (DOT)
Department of Labor
Departmental organization is relatively stable, and we are aware of no changes in the organization of economists in the agencies and departments in our sample during the time period of our analysis. Therefore, a difference-in-difference econometric approach is not feasible. To test the robustness of our results, we also ran regressions using alternative specifications of the organizational variables when classification of some agencies was subject to ambiguity (discussed in Appendix 3).
Other potential agency-specific institutional constraints are the size of each agency’s economist labor force and the size of its regulatory workload. For the 2000-2013 time period covered by this study, the Office of Personnel Management (OPM) reports the number of economists (series 0110) in each department annually, but not for agencies within departments.7 The OPM data allow us to construct a rough measure of the department’s economist capacity, assuming that economists could be transferred or borrowed between agencies within the department to meet demand. We adjust this figure by subtracting the number of economists in several large statistical organizations that are obviously not involved in producing regulations.8 We measure the size of the regulatory workload as the number of regulations in the sample published in the Federal Register by that department in the same year. Including the number of regulations in the regression allows us to control for economies of scale and/or learning by doing in agencies that produce a larger volume of rules. The economist and workload figures allow us to calculate the number of economists per regulation, a rough measure of analytical capacity.
Departmental culture is another institutional constraint that could lead a department to place greater or less emphasis on economic analysis. Economic analysis may simply be a greater part of the customary and accepted part of the regulation-writing process in some departments than in others. Skeptics of regulatory impact analysis argue that it is biased against regulation
6 When multiple agencies were listed as promulgating a regulation, we coded the regulation as produced by an agency with economists functionally organized or subject to department-level review by economists if any agency involved with the regulation had that characteristic. 7 Unfortunately, OPM does not consistently report the number of economists in individual agencies within departments. Nor does OPM consistently report the number of economists by education level in each department, which would have allowed us to construct a crude quality measure. 8 These are the Bureau of Labor Statistics (Department of Labor), Bureau of Economic Analysis (Department of Commerce), and Economic Research Service (Department of Agriculture).

12
OEA Working Paper 48
(Ackerman and Heinzerling 2004). If so, departments with a more “conservative” policy orientation may be more skeptical of regulation and hence more open to using economic analysis to assess regulation’s effects. To control for this aspect of agency culture, we employ a measure of department policy preferences on a “conservative-liberal” spectrum developed by Clinton and Lewis (2008). They asked academics, journalists, and policy experts to rate federal entities’ policy views on the basis of “law, practice, culture, or tradition.” Thus, the Clinton–Lewis approach can be thought of as an attempt to measure departments’ more permanent institutional policy preferences, rather than the policy preferences of a particular administration. Numerical values included in their model range from −2.07 (Action—an agency overseeing government-sponsored volunteer efforts—most liberal) to 2.40 (Department of the Navy, most conservative).
OIRA review of regulations is an external institutional constraint that may vary based on the individual regulation. All regulations in both samples were subject to OIRA review, but several variables allow us to assess whether variations in OIRA review are correlated with variations in the quality or claimed use of analysis. The length of OIRA’s review has been found to be positively correlated with the quality of analysis (Ellig and Fike 2016). In addition, the time span of the Shapiro-Morrall sample of regulations permits us to include a variable indicating whether OIRA review concluded after OMB’s Circular A4 became effective for final regulations on January 1, 2005 (OMB 2005, 7). Circular A4 (OMB 2003) is an extensive guidance document on best practices in regulatory impact analysis developed by OMB. It includes several new requirements that regulatory impact analyses should include, such as estimates of net benefits employing discount rates of both 3 percent and 7 percent, an analysis of cost-effectiveness analysis for major rulemakings affecting health and safety, and a formal quantitative analysis of uncertainty for regulations with annual benefits or costs exceeding $1 billion. Thus, the A4 variable may help indicate whether Circular A4 achieved its goal of improving the quality of regulatory impact analysis. Political constraints. Several variables control for political influences on the quality and use of economic analysis. The simplest are dummy variables controlling for the administration that issued the regulation. Additional dummy variables control for whether the regulation is a “midnight” regulation finalized between Election Day at the end of a presidential term and Inauguration Day; past research has demonstrated that midnight regulations often receive less thorough economic analysis (Ellig and Fike 2016; Ellig, McLaughlin, and Morrall 2013; Ellig and McLaughlin 2012).9 Another variable indicates OIRA’s relative political clout by indicating whether OIRA review of the regulation concluded under an acting administrator rather than a presidential appointee (Ellig, McLaughlin, and Morrall 2013; Ellig and Fike 2016). An acting administrator is a career civil servant who temporarily heads the office until the president can get a nominee confirmed or make a recess appointment. A final political variable, Impact exceeds $1 billion, indicates whether the regulation has benefits or costs exceeding $1 billion annually, as these very large regulations may attract significant political attention. Statutory and judicial constraints. Interviews with agency economists indicate that they often take a “value of information” approach, focusing their effort on aspects of the analysis that affect decisions the agency has discretion to make (Williams 2008, 14). Shapiro (2017, 693) notes that environmental assessment has likely permeated agencies more thoroughly than 9 Empirical research indicates that a surge of midnight regulations usually occurs at the end of every presidential term but is higher when a president is leaving office. See de Rugy and Davies (2009) and Cochran (2001).
13
OEA Working Paper 48
benefit-cost analysis because environmental assessment is required by statute. But in some cases, the statute authorizing a regulation does provide specific instructions regarding the role of economic analysis. Two of our explanatory variables identify especially stark cases of statutory provisions that either prohibit or require certain aspects of the regulatory impact analysis from influencing decisions; these are labeled Cost consideration prohibited and EPCA. For EPA NAAQS regulations, courts have determined that the Clean Air Act prohibits the EPA from considering costs. Conversely, the Energy Policy and Conservation Act (EPCA) lists specific benefits and costs the Department of Energy must consider when issuing appliance energy efficiency standards.
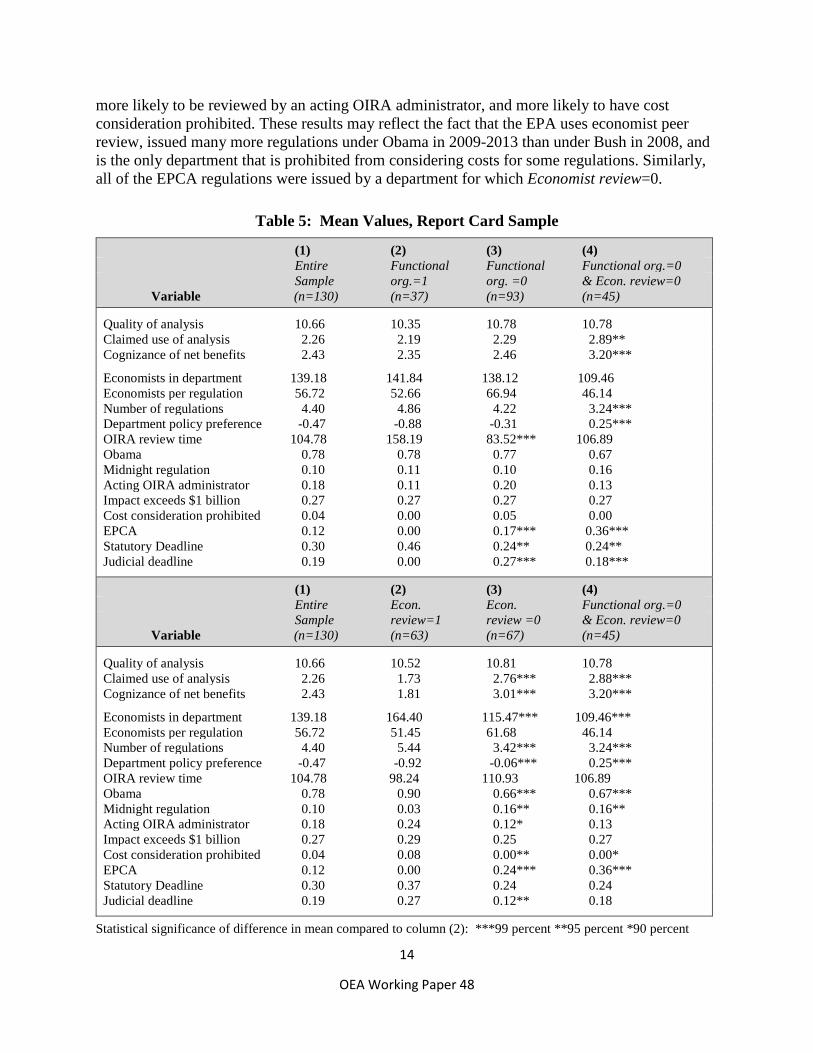
Two more variables indicate whether the regulation was issued subject to a statutory or judicial deadline. Such deadlines may reduce the quality of economic analysis by imposing a time constraint or prompting the agency to give the analysis less weight in its decisions (Abbott 1987a, 1987b; Gersen and O’Connell 2008, 933-36; Graham and Liu 2014, 443-44). Table 5 presents mean values for the Report Card data and control variables used in regressions involving the Report Card data. Column (1) shows mean values for the entire sample. Column (2) shows mean values when Functional organization (top panel) or Economist review (bottom panel) equals 1. Column (3) shows mean values when Functional organization or Economist review equals 0. Column (4) shows mean values when Functional organization or Economist review both equal 0. Columns (3) and (4) use asterisks to indicate when the difference between the value in that column and the value in column (2) is statistically significant. The average score for quality of analysis is about the same regardless of whether the agency organizes its economists functionally or employs internal peer review. Average scores for the two dependent variables indicating how the agency claimed to use the analysis in decisions – Any claimed use of analysis and Cognizance of net benefits – differ little based on Functional organization but are actually higher in the absence of economist peer review. The mean values for the control variables in columns (2) and (3) of the top panel suggest that agencies with functional organization of economists are in many ways comparable with agencies that do not have functional organization of economists. OIRA reviews regulations from agencies that lack functional organization for about 75 fewer days – perhaps because regulations from these agencies are also much more likely to have statutory or judicial deadlines. Interestingly, the policy preference variable is not significantly different when Functional organization equals 0 or 1, which implies that our hypothesized preference of conservative departments for economic analysis is not associated with an organizational structure reflecting that preference. None of the EPCA regulations are from entities with functional organization because these regulations are all from the Department of Energy.10 Columns (2) and (3) of the bottom panel show that many of the other explanatory variables have means significantly different depending on whether Economist review=1. Departments with economist peer review have significantly more economists, but they also issue an average of two more regulations in the sample per year, and so they have approximately the same number of economists per regulation as the departments without peer review. Regulations that underwent departmental peer review are more likely to come from departments that are more liberal, more likely to be issued during the Obama administration, less likely to be Bush midnight regulations, 10 To ensure that the EPCA regulations are not the main drivers of the econometric results, we omit this variable in a robustness test discussed in Appendix 3.
14
OEA Working Paper 48
more likely to be reviewed by an acting OIRA administrator, and more likely to have cost consideration prohibited. These results may reflect the fact that the EPA uses economist peer review, issued many more regulations under Obama in 2009-2013 than under Bush in 2008, and is the only department that is prohibited from considering costs for some regulations. Similarly, all of the EPCA regulations were issued by a department for which Economist review=0.
Table 5: Mean Values, Report Card Sample
(1) (2) (3) (4) Entire Functional Functional Functional org.=0 Sample org.=1 org. =0 & Econ. review=0
Variable (n=130) (n=37) (n=93) (n=45)
Quality of analysis 10.66 10.35 10.78 10.78 Claimed use of analysis 2.26 2.19 2.29 2.89** Cognizance of net benefits 2.43 2.35 2.46 3.20***
Economists in department 139.18 141.84 138.12 109.46 Economists per regulation 56.72 52.66 66.94 46.14 Number of regulations 4.40 4.86 4.22 3.24*** Department policy preference -0.47 -0.88 -0.31 0.25*** OIRA review time 104.78 158.19 83.52*** 106.89 Obama 0.78 0.78 0.77 0.67 Midnight regulation 0.10 0.11 0.10 0.16 Acting OIRA administrator 0.18 0.11 0.20 0.13 Impact exceeds $1 billion 0.27 0.27 0.27 0.27 Cost consideration prohibited 0.04 0.00 0.05 0.00 EPCA 0.12 0.00 0.17*** 0.36*** Statutory Deadline 0.30 0.46 0.24** 0.24** Judicial deadline 0.19 0.00 0.27*** 0.18***
(1) (2) (3) (4) Entire Econ. Econ. Functional org.=0 Sample review=1 review =0 & Econ. review=0
Variable (n=130) (n=63) (n=67) (n=45)
Quality of analysis 10.66 10.52 10.81 10.78 Claimed use of analysis 2.26 1.73 2.76*** 2.88*** Cognizance of net benefits 2.43 1.81 3.01*** 3.20***
Economists in department 139.18 164.40 115.47*** 109.46*** Economists per regulation 56.72 51.45 61.68 46.14 Number of regulations 4.40 5.44 3.42*** 3.24*** Department policy preference -0.47 -0.92 -0.06*** 0.25*** OIRA review time 104.78 98.24 110.93 106.89 Obama 0.78 0.90 0.66*** 0.67*** Midnight regulation 0.10 0.03 0.16** 0.16** Acting OIRA administrator 0.18 0.24 0.12* 0.13 Impact exceeds $1 billion 0.27 0.29 0.25 0.27 Cost consideration prohibited 0.04 0.08 0.00** 0.00* EPCA 0.12 0.00 0.24*** 0.36*** Statutory Deadline 0.30 0.37 0.24 0.24 Judicial deadline 0.19 0.27 0.12** 0.18
Statistical significance of difference in mean compared to column (2): ***99 percent **95 percent *90 percent
15
OEA Working Paper 48
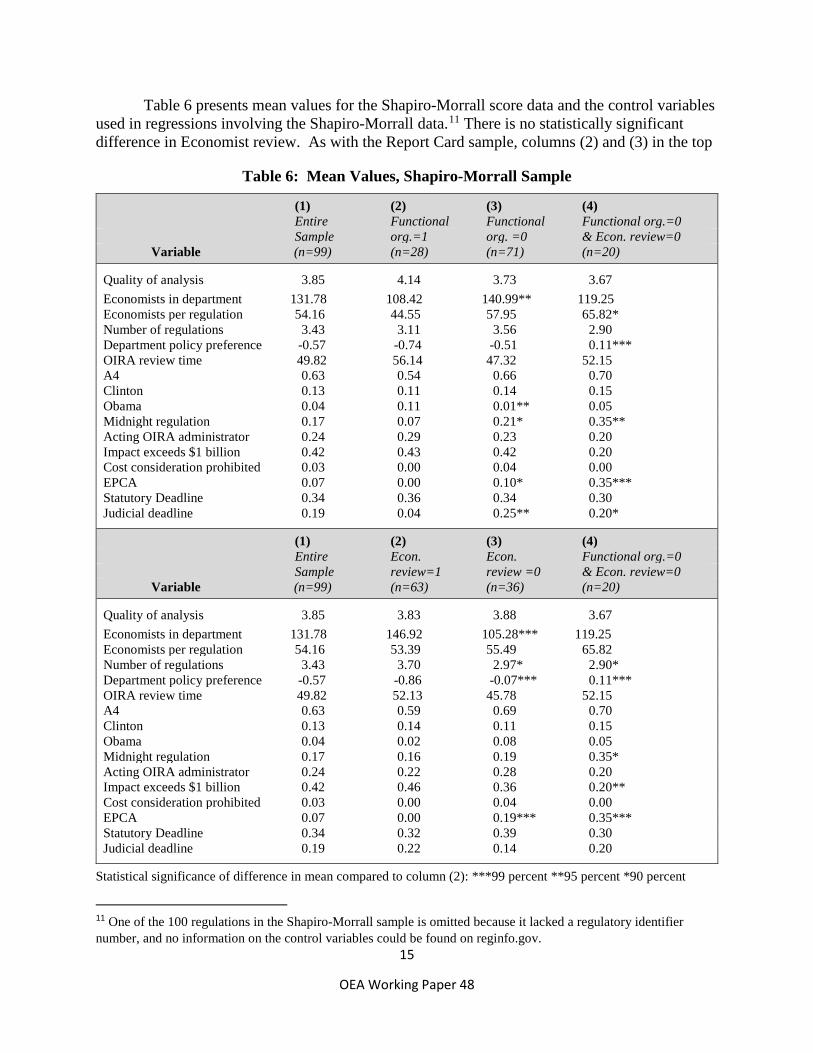
Table 6 presents mean values for the Shapiro-Morrall score data and the control variables used in regressions involving the Shapiro-Morrall data.11 There is no statistically significant difference in Economist review. As with the Report Card sample, columns (2) and (3) in the top
Table 6: Mean Values, Shapiro-Morrall Sample
Statistical significance of difference in mean compared to column (2): ***99 percent **95 percent *90 percent
11 One of the 100 regulations in the Shapiro-Morrall sample is omitted because it lacked a regulatory identifier number, and no information on the control variables could be found on reginfo.gov.
(1) (2) (3) (4) Entire Functional Functional Functional org.=0 Sample org.=1 org. =0 & Econ. review=0
Variable (n=99) (n=28) (n=71) (n=20)
Quality of analysis 3.85 4.14 3.73 3.67 Economists in department 131.78 108.42 140.99** 119.25 Economists per regulation 54.16 44.55 57.95 65.82* Number of regulations 3.43 3.11 3.56 2.90 Department policy preference -0.57 -0.74 -0.51 0.11*** OIRA review time 49.82 56.14 47.32 52.15 A4 0.63 0.54 0.66 0.70 Clinton 0.13 0.11 0.14 0.15 Obama 0.04 0.11 0.01** 0.05 Midnight regulation 0.17 0.07 0.21* 0.35** Acting OIRA administrator 0.24 0.29 0.23 0.20 Impact exceeds $1 billion 0.42 0.43 0.42 0.20 Cost consideration prohibited 0.03 0.00 0.04 0.00 EPCA 0.07 0.00 0.10* 0.35*** Statutory Deadline 0.34 0.36 0.34 0.30 Judicial deadline 0.19 0.04 0.25** 0.20*
(1) (2) (3) (4) Entire Econ. Econ. Functional org.=0 Sample review=1 review =0 & Econ. review=0
Variable (n=99) (n=63) (n=36) (n=20)
Quality of analysis 3.85 3.83 3.88 3.67 Economists in department 131.78 146.92 105.28*** 119.25 Economists per regulation 54.16 53.39 55.49 65.82 Number of regulations 3.43 3.70 2.97* 2.90* Department policy preference -0.57 -0.86 -0.07*** 0.11*** OIRA review time 49.82 52.13 45.78 52.15 A4 0.63 0.59 0.69 0.70 Clinton 0.13 0.14 0.11 0.15 Obama 0.04 0.02 0.08 0.05 Midnight regulation 0.17 0.16 0.19 0.35* Acting OIRA administrator 0.24 0.22 0.28 0.20 Impact exceeds $1 billion 0.42 0.46 0.36 0.20** Cost consideration prohibited 0.03 0.00 0.04 0.00 EPCA 0.07 0.00 0.19*** 0.35*** Statutory Deadline 0.34 0.32 0.39 0.30 Judicial deadline 0.19 0.22 0.14 0.20
16
OEA Working Paper 48
panel suggest that agencies with functional organization of economists are in many ways comparable with agencies that do not have functional organization of economists. In this sample, departments without functional organization have more economists, but since they issue a slightly larger number of regulations, the number of economists per regulation is similar. There are also fewer differences between values in columns (2) and (3) in the bottom panel. Departments that utilize economist review have more economists but also issue more regulations, so Economists per regulation is similar regardless of whether Economist review equals 0 or 1. Departments with functional organization of economists tend to be more liberal, and the EPCA regulations are all issued by a department that lacks functional organization.
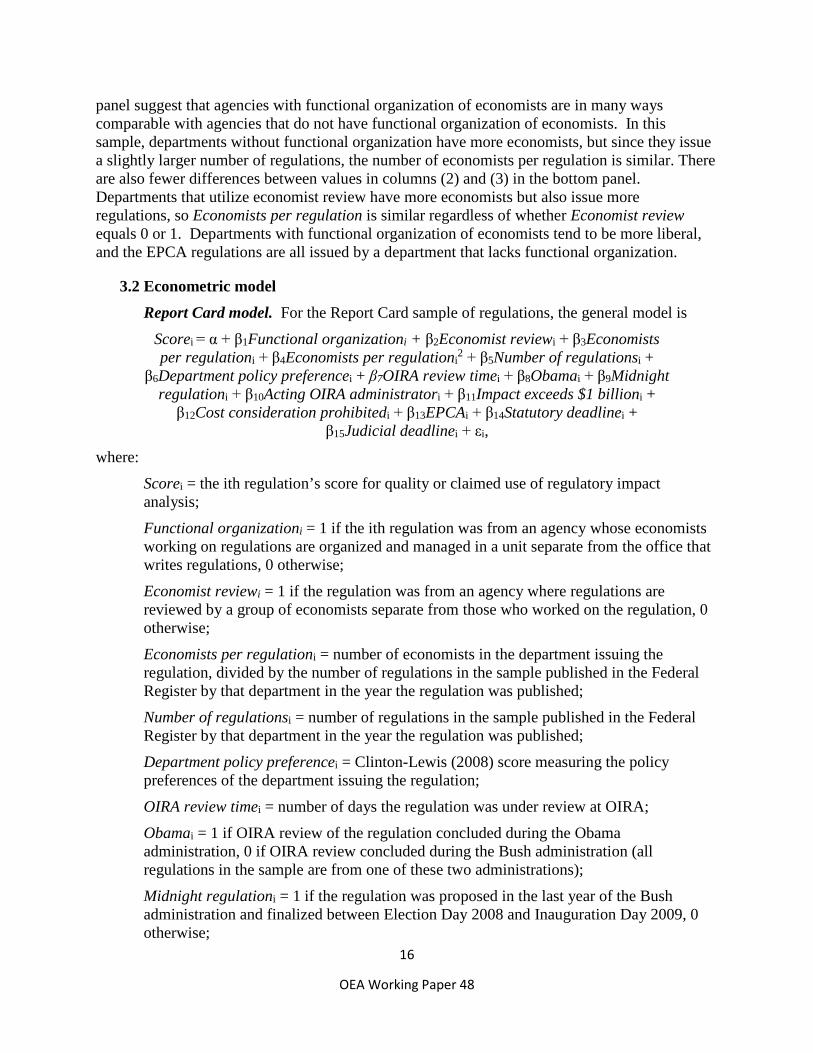
3.2 Econometric model Report Card model. For the Report Card sample of regulations, the general model is
Scorei = α + β1Functional organizationi + β2Economist reviewi + β3Economists per regulationi + β4Economists per regulationi
2 + β5Number of regulationsi + β6Department policy preferencei + β7OIRA review timei + β8Obamai + β9Midnight
regulationi + β10Acting OIRA administratori + β11Impact exceeds $1 billioni + β12Cost consideration prohibitedi + β13EPCAi + β14Statutory deadlinei +
β15Judicial deadlinei + εi, where:
Scorei = the ith regulation’s score for quality or claimed use of regulatory impact analysis; Functional organizationi = 1 if the ith regulation was from an agency whose economists working on regulations are organized and managed in a unit separate from the office that writes regulations, 0 otherwise; Economist reviewi = 1 if the regulation was from an agency where regulations are reviewed by a group of economists separate from those who worked on the regulation, 0 otherwise; Economists per regulationi = number of economists in the department issuing the regulation, divided by the number of regulations in the sample published in the Federal Register by that department in the year the regulation was published; Number of regulationsi = number of regulations in the sample published in the Federal Register by that department in the year the regulation was published; Department policy preferencei = Clinton-Lewis (2008) score measuring the policy preferences of the department issuing the regulation; OIRA review timei = number of days the regulation was under review at OIRA; Obamai = 1 if OIRA review of the regulation concluded during the Obama administration, 0 if OIRA review concluded during the Bush administration (all regulations in the sample are from one of these two administrations); Midnight regulationi = 1 if the regulation was proposed in the last year of the Bush administration and finalized between Election Day 2008 and Inauguration Day 2009, 0 otherwise;
17
OEA Working Paper 48
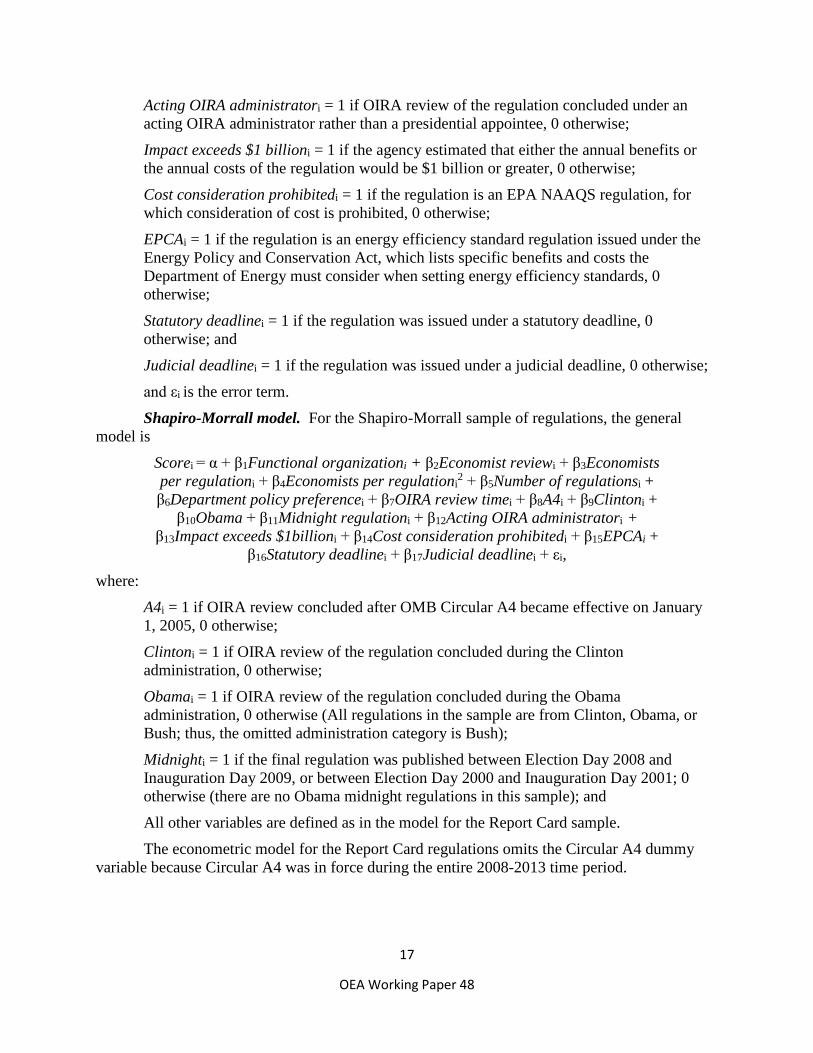
Acting OIRA administratori = 1 if OIRA review of the regulation concluded under an acting OIRA administrator rather than a presidential appointee, 0 otherwise; Impact exceeds $1 billioni = 1 if the agency estimated that either the annual benefits or the annual costs of the regulation would be $1 billion or greater, 0 otherwise; Cost consideration prohibitedi = 1 if the regulation is an EPA NAAQS regulation, for which consideration of cost is prohibited, 0 otherwise; EPCAi = 1 if the regulation is an energy efficiency standard regulation issued under the Energy Policy and Conservation Act, which lists specific benefits and costs the Department of Energy must consider when setting energy efficiency standards, 0 otherwise; Statutory deadlinei = 1 if the regulation was issued under a statutory deadline, 0 otherwise; and Judicial deadlinei = 1 if the regulation was issued under a judicial deadline, 0 otherwise; and εi is the error term.
Shapiro-Morrall model. For the Shapiro-Morrall sample of regulations, the general model is
Scorei = α + β1Functional organizationi + β2Economist reviewi + β3Economists per regulationi + β4Economists per regulationi
2 + β5Number of regulationsi + β6Department policy preferencei + β7OIRA review timei + β8A4i + β9Clintoni +
β10Obama + β11Midnight regulationi + β12Acting OIRA administratori + β13Impact exceeds $1billioni + β14Cost consideration prohibitedi + β15EPCAi +
β16Statutory deadlinei + β17Judicial deadlinei + εi, where:
A4i = 1 if OIRA review concluded after OMB Circular A4 became effective on January 1, 2005, 0 otherwise; Clintoni = 1 if OIRA review of the regulation concluded during the Clinton administration, 0 otherwise; Obamai = 1 if OIRA review of the regulation concluded during the Obama administration, 0 otherwise (All regulations in the sample are from Clinton, Obama, or Bush; thus, the omitted administration category is Bush); Midnighti = 1 if the final regulation was published between Election Day 2008 and Inauguration Day 2009, or between Election Day 2000 and Inauguration Day 2001; 0 otherwise (there are no Obama midnight regulations in this sample); and All other variables are defined as in the model for the Report Card sample. The econometric model for the Report Card regulations omits the Circular A4 dummy
variable because Circular A4 was in force during the entire 2008-2013 time period.

18
OEA Working Paper 48
We tested for collinearity by examining correlation coefficients (Farrar and Glauber 1967), variance inflation factors, and the condition index (Belsley, Kuh, and Welch 1980). These standard collinearity diagnostics revealed no significant collinearity problems.12
It would have been desirable to control for several other factors, but relevant data were not available for all agencies during the time period of our samples. These include:
Quality of economists. OPM data do not indicate the quality of each department’s economists. Even the number of economists who hold PhDs is available only for a few agencies for a few years. However, Froeb, Pautler, and Röller (2008, 10-11) and Hazlett (2011, 6-7) have suggested that agencies which organize their economists functionally are more likely to attract higher-quality economists, so this may simply be another effect of functional organization that we need not control for separately.
Number of economists working on regulation. The OPM data do not indicate how many of an agency’s economists actually work on regulations. We have removed from the totals several groups of economists in statistical organizations that do not write regulations (such as the Census Bureau and Bureau of Labor Statistics). Thus, our economist count measures the size of the economist labor force potentially available to work on regulations, not the actual number who worked on regulations or any individual regulation. The mean value of approximately 55 economists per regulation reported in Tables 5 and 6 seems high, but it is not based on a count of all the department’s regulations. The Report Card sample omits budget regulations, the Shapiro-Morrall sample omits regulations that lacked monetary estimates of benefits and costs, and both samples are confined to economically significant regulations. Nevertheless, it is still highly likely that a large number of these economists are not working on analysis for regulations.
Quality and quantity of economic consultants. Some agencies use external consultants either instead of or as a supplement to in-house economists. We know from the OPM data which agencies have no economists, but we do not know how many external consultants worked on any particular regulation. Since external consultants are likely to be directed by the program office issuing the regulation, this omission likely means we are treating agencies that use consultants as similar to agencies whose in-house economists are directed by the program office.
Extent of discretionary rulemaking authority. The regressions do not control for whether the agency had discretion to issue the rule or the extent of the agency’s authority to determine the type, stringency, or coverage of the rule. However, prior research using the Report Card data finds that these factors are not correlated with the quality of analysis (Ellig & Conover 2014; Ellig 2016).
Importance of economic analysis to the agency’s political leadership. In theory this could be a significant factor, but it is not even clear how this could be measured in different agencies across multiple administrations.
12 Correlation coefficients between explanatory variables were nearly always below 0.51 and mostly below 0.3 (with the obvious exception of the square of Economists per regulation. Omitting the squared term from the calculations, the mean variance inflation factor was below 1.75 and the condition index was below 16 in both samples.
19
OEA Working Paper 48
3.3 Estimation methods The primary estimation method we use for dependent variables measuring the total quality of analysis is ordinary least squares (OLS). Our score variables are based on a Likert scale, and we treat the total scores as interval data. “Likert scales, consisting of sums across many items, will be interval.” (Norman 2010, 629). For Quality of analysis, there are more than a few categories of responses and the scores are not clustered around a few values, making OLS a reasonable method.13 Thus, we employ OLS when the total score for Quality of analysis is the dependent variable. OLS has the added virtue of offering a straightforward numerical interpretation of the coefficients.
Prior research using Report Card data has found that OLS and ordered logit produce similar results (Ellig and Fike 2016), which is consistent with research showing that parametric tests are robust with respect to skewness and non-normality (Norman 2010, 629-30). For comparison, we also present the results of ordered logit regressions, which produce essentially the same results for our organizational variables of interest. When the dependent variable has a small number of categories (Claimed use of analysis, Cognizance of net benefits, and various robustness tests checks involving individual score criteria that range from 0-5), we report ordered logit results. We take two steps to account for the possibility that our model does not control for effects that are correlated within departments or individual agencies. First, the standard errors calculated for the OLS regressions are robust standard errors clustered by agency. This allows for the possibility that the observations are not independent within agencies (Stata 2015, 2775). Second, we also estimate a regression with agency-specific random effects and report the results of the random effects regression if the relevant statistical test indicates that random effects are present. It is not feasible to use a fixed effects model in this paper, because the organization of economists is a characteristic of each agency that would be perfectly correlated with agency fixed effects.
3.3 Results Table 7 shows the OLS results using the Report Card Quality of analysis score as the dependent variable. Model (1) includes only Functional organization, and Economist review. Model (2) adds control variables associated with individual regulations. Model (3) adds three department-specific control variables: Economists per regulation, Number of regulations, and Department policy preference. Model (4) is the full model that includes the square of Economists per regulation to control for diminishing marginal returns. Functional organization is positive and statistically significant in the two most fully specified models. Economist review is marginally significant in Models (2) and (4) and significant in Model (3).
The organization variables appear to be quantitatively significant as well. The standard deviation of the Report Card Quality of analysis score is 2.83 points. In Model (4), Functional organization is associated with a 1.73 point increase in this score, or about three-fifths of a standard deviation. When Economist review is most significant, in Model (3), it is associated with a similar increase in the Report Card Quality of analysis score. 13 Histograms are available from the authors.

20
OEA Working Paper 48
Table 7: Organization and Quality of Analysis – Report Card Sample (OLS)
Model
Variable (1) (2) (3) (4)
Functional organization -0.41 (0.568) 0.76 (0.199) 1.31 (0.046)** 1.73 (0.008)*** Economist review 0.25 (0.761) 1.34 (0.060)* 1.87 (0.013)** 1.19 (0.091)* Economists per regulation -0.004 (0.467) 0.03 (0.059)* Economists per regulation squared -0.0001 (0.015)*** Number of regulations -0.01 (0.948) 0.26 (0.066)** Department policy preference 0.62 (0.149) 0.85 (0.053)* OIRA review time -0.001 (0.756) -0.001 (0.657) -0.001 (0.665) Obama -1.67 (0.022)** -1.46 (0.029)** -1.59 (0.016)** Midnight regulation -1.21 (0.129) -0.84 (0.097)* -0.89 (0.305) Acting OIRA administrator -0.61 (0.308) -0.64 (0.297) -0.78 (0.170) Impact exceeds $1 billion 2.55 (0.000)*** 2.54 (0.000)*** 2.52 (0.000)*** Cost consideration prohibited 1.91 (0.000)*** 2.06 (0.000)*** 1.95 (0.000)*** EPCA 3.53 (0.001)*** 3.48 (0.001)*** 2.63 (0.005)*** Statutory deadline -0.92 (0.234) -1.08 (0.126) -1.07 (0.111) Judicial deadline 0.44 (0.588) 0.53 (0.484) 0.64 (0.385) Constant 10.66 (0.000)*** 10.38 (0.000)*** 10.40 (0.000)*** 8.49 (0.000)*** Adj. R-squared 0.01 0.35 0.36 0.41 N 130 130 130 130
Statistical significance: ***99 percent **95 percent *90 percent. Robust standard errors are clustered by agency (38 clusters). Table 8 shows OLS results using the Shapiro-Morrall Quality of analysis score as the dependent variable. As in Table 7, Models (1) – (4) add progressively more explanatory variables. Functional organization is positive and significant in all models except Model (1); Economist review is not. The standard deviation of the Shapiro-Morrall Quality of analysis score is 1.5 points. In Model (4), Functional organization is associated with a 1.12 point increase in this score, or three-quarters of a standard deviation. In both tables, many of the other control variables have the signs one might reasonably expect. Economists per regulation has a positive sign when the control for diminishing marginal returns is included. Number of regulations is positive and significant, suggesting that agencies with more economically significant regulations also produce better analysis. Department policy preference is positive and marginally significant. In the Shapiro-Morrall regression, OIRA review time is positive and significant, and A4 is positive and marginally significant.
There are three surprising results. One explanatory variable – Cost consideration prohibited – is positive and highly significant in both regressions. One might expect this variable would be negatively correlated with Quality of analysis. Regressions reported in Table 10 below, which use individual evaluation questions as the dependent variables, resolve this puzzle. In these regressions, Cost consideration prohibited is negatively correlated with scores on most questions related to evaluation of costs, but positively correlated with scores on several questions related to analysis of the problem or benefits. The net effect is a positive correlation with the total quality of analysis score. The other surprising results are that statutory and judicial deadlines are not correlated with the quality of analysis. This seems counter-intuitive but is consistent with results of previous research (Ellig and Conover 2014).

21
OEA Working Paper 48
Table 8: Organization and Quality of Analysis – Shapiro-Morrall Sample (OLS)
Model
Variable (1) (2) (3) (4) Functional organization 0.43 (0.114) 0.60 (0.058)* 1.08 (0.006)*** 1.12 (0.005)*** Economist review 0.07 (0.833) 0.18 (0.636) 0.49 (0.166) 0.60 (0.118) Economists per regulation -0.001 (0.649) 0.02 (0.205) Economists per regulation squared -0.00005 (0.131) Number of regulations 0.24 (0.038)*** 0.35 (0.017)** Department policy preference 0.44 (0.185) 0.62 (0.079)* OIRA review time 0.01 (0.018)** 0.01 (0.010)*** 0.009 (0.021)** A4 0.56 (0.097)* 0.58 (0.063)* 0.54 (0.071)* Clinton -0.10 (0.877) -0.15 (0.797) -0.07 (0.905) Obama 0.29 (0.736) -0.54 (0.615) -0.57 (0.597) Midnight regulation -0.26 (0.679) -0.08 (0.865) -0.075 (0.916) Acting OIRA administrator -0.04 (0.914) -0.06 (0.886) 0.16 (0.691) Impact exceeds $1 billion 0.24 (0.409) 0.22 (0.447) 0.14 (0.619) Cost consideration prohibited 1.15 (0.000)*** 1.24 (0.000)*** 1.24 (0.000)*** EPCA 0.73 (0.089)* 1.24 (0.002)*** 0.64 (0.242) Statutory deadline 0.33 (0.270) 0.21 (0.520) 0.19 (0.579) Judicial deadline 0.43 (0.218) 0.65 (0.153) 0.59 (0.231) Constant 3.68 (0.000)*** 2.47 (0.000)*** 1.54 (0.024)** 0.65 (0.448) Adj. R-squared 0.00 0.04 0.11 0.13 N 99 99 99 99
Statistical significance: ***99 percent **95 percent *90 percent. Robust standard errors are clustered by agency (26 clusters).
We employ two additional estimation methods as robustness checks on the OLS results. First, we use an ordered logit model for the total quality of analysis scores. As Table 9 shows, Functional organization remains positive and statistically significant. Economist review remains positive and marginally significant for the Report Card scores. (Regression coefficients in an ordered logit model are the log of the odds ratio, so they should not be interpreted as marginal effects similar to OLS coefficients.)
Second, we estimate an ordered logit model for each of the 22 individual sub-questions evaluating the quality of analysis in the Report Card sample and each of the six criteria evaluating the quality of analysis in the Shapiro-Morrall sample. The results of these estimations, reported in Tables 10 and 11, are also consistent with the OLS results. In addition, the estimates for individual questions identify the specific aspects of the analysis that Functional organization and Economist review are correlated with.

22
OEA Working Paper 48
Table 9: Organization and Quality of Analysis – Ordered Logit
Dependent Variable
Report Card quality Shapiro-Morrall quality of analysis score, 2008-13 of analysis score, 2000-09
Variable (min=2, max=18) (min=0 max=6) Functional organization 1.58 (0.002)*** 1.41 (0.008)*** Economist review 0.95 (0.075)* 0.70 (0.197) Economists per regulation 0.03 (0.006)*** 0.03 (0.069)* Economists per regulation squared -0.00007 (0.001)*** -0.00008 (0.52)* Number of regulations 0.21 (0.045)** 0.51 (0.003)*** Department policy preference 0.65 (0.048)** 0.76 (0.029)** OIRA review time -0.001 (0.353) 0.01 (0.025)** A4 NA 0.94 (0.062)* Obama -1.61 (0.003)*** -0.83 (0.472) Clinton NA -0.13 (0.865) Midnight -1.27 (0.070)* 0.01 (0.991) Acting OIRA administrator -0.76 (0.110) 0.07 (0.885) Impact exceeds $1 billion 2.39 (0.000)*** 0.06 (0.903) Cost consideration prohibited 1.78 (0.033)** 1.73 (0.149) EPCA 2.31 (0.002)*** 0.56 (0.579) Statutory deadline -0.75 (0.106) 0.45 (0.320) Judicial deadline 0.61 (0.231) 0.67 (0.243) LR chi-squared 89.07 (0.000)*** 31.23 (0.019)** Pseudo R-squared 0.14 0.07 N 130 99
Ordered logit regressions. P-values in parenthesis. Statistical significance: ***99 percent **95 percent *90 percent.
Tables 10 and 11 report results for Functional organization and Economist review, our organizational variables of interest, for ordered logit regressions that use scores on individual questions as the dependent variable. For the Report Card sample, Functional organization is positively and significantly correlated with scores on multiple questions related to evaluation of alternatives, benefits, and costs. Economist review is also positively correlated with scores for assessment of uncertainty about the problem, several questions related to alternatives and benefits, and identification of expenditures likely to arise from the regulation.
For the Shapiro-Morrall sample, Functional organization is positively correlated with scores for analysis of alternatives, discounting of future benefits and costs, and analysis of uncertainties. Economist review is positively correlated with discounting and analysis of uncertainty. In only one case is an organizational variable negatively and significantly correlated with the quality of analysis; Functional organization is negatively correlated with the score for assessment of the incidence of costs in the Report Card sample.

23
OEA Working Paper 48
Table 10: Results for Individual Criteria -- Report Card Sample
Functional Economist Dependent Variable Organization Review
Problem Does the analysis identify a market failure or other systemic problem?† 0.22 (0.713) -0.13 (0.897) Does the analysis outline a coherent theory explaining the problem?† 0.13 (0.820) -0.29 (0.724) Does the analysis present credible empirical support for the theory? 0.37 (0.454) -0.59 (0.305) Does the analysis adequately address the baseline? 0.04 (0.934) -0.34 (0.501) Does the analysis adequately assess uncertainty about the existence 0.40 (0.422) 1.15 (0.037)** or size of the problem?
Alternatives Does the analysis enumerate other alternatives to address the problem? 0.54 (0.290) 0.87 (0.096)* Is the range of alternatives narrow or broad? 0.47 (0.359) 0.22 (0.675) Does the analysis evaluate the benefits/outcomes achieved by the alternatives? 0.55 (0.264) 0.28 (0.582) Does the analysis identify incremental costs of alternatives? 1.29 (0.009)*** 1.41 (0.006)*** Does the analysis identify the alternative that maximizes net benefits? 0.78 (0.123) -0.28 (0.586) Does the analysis identify the most cost-effective alternative? 2.26 (0.000)*** 1.10 (0.040)**
Benefits Does the analysis clearly identify ultimate outcomes? 0.78 (0.148) 0.55 (0.346) Does the analysis identify how these outcomes are to be measured? 0.88 (0.088)* -1.16 (0.030)*** Does the analysis provide a clear theory showing how the regulation 1.15 (0.024)** 1.07 (0.042)** is likely to produce the benefits or other desired outcomes? Does the analysis provide credible empirical support for the theory? 0.34 (0.501) -0.68 (0.229) Does the analysis adequately assess uncertainty about the benefits/outcomes?† 0.26 (0.638) 0.63 (0.413) Does the analysis assess the incidence of benefits? 0.04 (0.939) 0.74 (0.163)
Costs Does the analysis identify all expenditures likely to arise from the regulation? 1.39 (0.007)*** 1.60 (0.004)*** Does the analysis identify how the regulation would affect prices of 0.01 (0.982) 1.14 (0.233) goods and services?† Does the analysis examine costs that stem from changes in behavior? 0.26 (0.596) 0.56 (0.297) Does the analysis adequately assess uncertainty about costs?† 1.90 (0.002)*** 1.33 (0.145) Does the analysis assess the incidence of costs? -1.35 (0.010)*** 0.29 (0.595)
Ordered logit regressions. P-values in parenthesis. Statistical significance: ***99 percent **95 percent *90 percent. †Results for model assuming department random effects are reported because a likelihood ratio test indicates that random effects are present.
A potential disadvantage of functional organization is that the economists may have less influence on decisions. Table 12 addresses whether the agency’s claimed use of the analysis is correlated with the organizational variables. The first regression in Table 12 shows that neither functional organization nor independent economist review is correlated with the extent of the agency’s explanation of how the analysis affected decisions.
If organizational forms that give economists more independence diminish economists’ influence, this is not apparent from agencies’ explanations of how the RIA influenced their decisions. Other factors – such as whether the regulation is a midnight regulation, whether the regulation’s impact is greater than $1 billion, whether consideration of costs is prohibited, and whether it is an EPCA regulation – are more clearly correlated with the agency’s claimed use of analysis.

24
OEA Working Paper 48
Table 11: Results for Individual Criteria -- Shapiro-Morrall Sample
Functional Economist Dependent Variable Organization Review
Does the analysis include a statement of need for federal regulation? -0.88 (0.187) -0.02 (0.975) Does the analysis identify and examine reasonable alternative approaches? 1.78 (0.034)** 0.43 (0.524) Does the analysis quantify and monetize benefits and costs of proposed action? 0.85 (0.221) -0.69 (0.300) Does the analysis quantify and monetize benefits and costs of alternatives? 0.62 (0.272) -.02 (0.981) Does the analysis discount future benefits and costs at 3 percent and 7 percent? 2.36 (0.002)*** 2.68 (0.001)*** Are uncertainties clearly presented, including a formal uncertainty analysis if 1.95 (0.011)** 1.18 (0.088)* the rulemaking has more than a $1 billion cost or benefit in any one year?
Ordered logit regressions. P-values in parenthesis. Statistical significance: ***99 percent **95 percent *90 percent.
Table 12 also shows that Functional organization is positively correlated with the extent to which the agency demonstrated it was cognizant of the net benefits of alternatives. This suggests that placing economists in their own organization gives them more influence – not less influence – on the agency’s explanation of whether or how net benefits factored into its decisions.
In addition to the OLS and ordered logit regressions discussed above, we subjected the data to a battery of other robustness tests described in Appendix 3. In the vast majority of alternative specifications tried, Functional organization remained positive and statistically significant. In some of the alternative specifications using the Report Card sample, Economist review became statistically significant. In no case where these variables are positive and significant in Tables 7, 8, and 9 did their signs change in an alternative specification.
Table 12: Claimed Use of Analysis and Cognizance of Net Benefits -- Report Card Data
Dependent Variable
Variable Any claimed use of analysis Cognizance of net benefits
Functional organization 0.03 (0.952) 0.70 (0.040)** Economist review -0.50 (0.261) -0.39 (0.336) Economists per regulation 0.003 (0.560) 0.01 (0.063)* Economists per regulation squared -8.52 e-06 (0.372) -0.00002 (0.020)** Number of regulations 0.01 (0.814) 0.10 (0.058)* Department policy preference 0.17 (0.353) 0.53 (0.014)** OIRA review time 0.0001 (0.916) -0.001 (0.350) Obama -0.82 (0.008)*** -0.73 (0.032)** Midnight -0.87 (0.020)** -0.50 (0.162) Acting OIRA administrator -0.51 (0.057)* -0.053 (0.018)** Impact exceeds $1 billion 1.01 (0.010)*** 0.77 (0.125) Cost consideration prohibited -0.86 (0.000)*** 0.20 (0.377) EPCA 1.10 (0.048)** 1.70 (0.001)*** Statutory deadline 0.28 (0.256) -0.28 (0.296) Judicial deadline -0.19 (0.502) -0.18 (0.510) Adj. R-squared 0.38 0.41
Ordered logit regressions. P-values in parenthesis. Statistical significance: ***99 percent **95 percent *90 percent.
25
OEA Working Paper 48
4. Conclusion Prior research employing organization theory, case studies, and interviews concludes that functional organization of economists in a regulatory agency can improve the quality of economic analysis. However, this literature warns that higher quality analysis may come at the price of reduced influence for economists, unless the agency takes explicit steps to preserve economists’ involvement in decisions. Our statistical investigation confirms that functional organization of economists is associated with higher-quality regulatory impact analysis. We find no evidence, however, that functional organization has reduced economists’ influence on regulatory decisions. There is no correlation between functional organization and the thoroughness of the agency’s explanations of how the regulatory impact analysis affected its decisions. Moreover, after controlling for other factors, we find that when economists are placed in a functional organization, agencies provide more extensive explanations of how net benefits influenced their decisions. We caution that our measure of the influence of economic analysis on decisions – self-reporting by agencies in the preambles to their Notices of Proposed Rulemaking and Final Rules – likely fails to measure a great deal of economists’ behind-the-scenes influence. Key regulatory decisions are often made before the Notice of Proposed Rulemaking is written. Having an economist in “the room where it happens” can stop a bad decision or improve a good one. Baker (1997, 871) recounts that this is how economists routinely affect decisions at the FTC; attorneys are reluctant to move forward with proposals that fail a benefit-cost test. Similarly, Kraus (2015, 296-303) notes that since the SEC adopted new economic analysis guidance, economists are included on rulemaking teams and have furnished data and analysis during the rule-development process that significantly improved decisions. This kind of influence is for the most part unobservable. As Williams (2008, 5) notes, “[I]t is likely to be impossible to ascertain, by external observation, how much of an impact federal economists have on regulation, internal agency deliberations, and decision changes on regulatory options, which are influenced by economic analysis and are not made available for public review nor likely to be so anytime in the near future.” Based on these results, we offer two broader conclusions for the economics of organization: (1) The way professionals are organized does indeed affect the quality of their intellectual output. As prior case study research suggests, functional organization of economists is associated with higher-quality economic analysis of regulations. (2) Functional organization does not necessarily diminish the influence of specialists on decisions by allowing others to ignore the information they produce, and it may even augment their influence. Identifying how federal agencies have avoided this potential cost of functional organization is a topic ripe for further research.
26
OEA Working Paper 48
References Abbott, Alden F. 1987a. “Case Studies on the Costs of Federal Statutory and Judicial Deadlines,”
Administrative Law Review 39 (4): 467–87. ———. 1987b. “The Case against Federal Statutory and Judicial Deadlines: A Cost-Benefit
Appraisal,” Administrative Law Review 39 (2): 171–204. Arbuckle, Donald R. 2011. “The Role of Analysis on the 17 Most Political Acres on the Face of
the Earth,” Risk Analysis 31 (6): 884–92. Baker, Jonathan B. 1997. “’Continuous’” Regulatory Reform at the Federal Trade Commission,”
Administrative Law Review 49 (4): 859-74. Belsley, David A., Edwin Kuh, and Roy E. Welsch (1980) Regression Diagnostics: Identifying
Influential Data and Sources of Collinearity, New York: John Wiley & Sons. Brennan, Tim. 2017. “Bolstering Economics at the FCC: Will a Separate Office Help?,”
Technology Policy Institute (September 18), available at https://techpolicyinstitute.org/2017/09/18/bolstering-economics-at-the-fcc-will-a-separate-office-help/.
Brito, Jerry, and Veronique de Rugy. 2009. “Midnight Regulations and Regulatory Review,” Administrative Law Review 61 (1): 163–96.
Carifio, James, and Rocco J. Perla. 2007. “Ten Common Misunderstandings, Misconceptions, Persistent Myths, and Urban Legends and Likert Scales and Likert Response Formats and their Antidotes, Journal of Social Sciences 3 (3): 106-116.
Clinton, Joshua D., and David E. Lewis. 2008. “Expert Opinion, Agency Characteristics, and Agency Preferences,” Political Analysis 16 (1): 3–20.
Cochran, Jay. 2001. “The Cinderella Constraint: Why Regulations Increase Significantly during Post-election Quarters,” Working Paper, Mercatus Center at George Mason University, Arlington, VA.
Coate, Malcolm B. 2000. “Merger Enforcement at the Federal Trade Commission in Three Presidential Administrations,” Antitrust Bulletin 45 (2): 323-47.
De Rugy, Veronique, and Antony Davies. 2009. “Midnight Regulations and the Cinderella Effect,” Journal of Socio-Economics 38 (6): 886–90.
Dudley, Susan E. 2009. “Lessons Learned, Challenges Ahead,” Regulation 32 (2): 6–11. Ellig, Jerry. 2016. “Evaluating the Quality and Use of Regulatory Impact Analysis: The
Mercatus Center’s Regulatory Report Card, 2008-2013,” Working Paper, Mercatus Center at George Mason University (July).
Ellig, Jerry, and Christopher J. Conover. 2014. “Presidential Priorities, Congressional Control, and the Quality of Regulatory Analysis: An Application to Healthcare and Homeland Security,” Public Choice 161 (3): 305–20.
Ellig, Jerry, and Rosemarie Fike. 2016. “Regulatory Process, Regulatory Reform, and the Quality of Regulatory Impact Analysis,” Journal of Benefit-Cost Analysis 7 (3): 523-59.

27
OEA Working Paper 48
Ellig, Jerry, and Patrick A. McLaughlin. 2012. “The Quality and Use of Regulatory Analysis in 2008,” Risk Analysis 32 (5): 855–80.
Ellig, Jerry, Patrick A. McLaughlin, and John F. Morrall III. 2013. “Continuity, Change, and Priorities: The Quality and Use of Regulatory Analysis across US Administrations,” Regulation & Governance 7 (2): 153–73.
Exec. Order No. 12,866, 58 Fed. Reg. 51,735 (Oct. 4, 1993). Farrar, Donald E. and Robert R. Glauber. 1967. “Multicollinearity in Regression Analysis: The
Problem Revisited,” 49:1 Review of Economics and Statistics 92. Farrow, Scott. 1997. “Improving the CWIS Rule Regulatory Analysis: What Does An Economist
Want?,” in Richard D. Morgenstern (Ed.), Economic Analyses at EPA: Assessing Regulatory Impact. Washington, DC: Resources for the Future.
Federal Trade Commission, Office of Inspector General. 2015. Evaluation of the Federal Trade Commission’s Bureau of Economics (June 30).
Fraas, Art, and Randall Lutter. 2011. “On the Economic Analysis of Regulations at Independent Regulatory Commissions.” Administrative Law Review 63: 213–41.
Froeb, Luke, Paul A. Pautler, and Lars-Hendrik Röller. 2008. “The Economics of Organizing Economists,” Vanderbilt University Law School Law and Economics Working Paper No. 08-18.
Kauper, Thomas E. 1984. “The Role of Economic Analysis in the Antitrust Division Before and After the Establishment of the Economic Policy Office: A Lawyer’s View,” Antitrust Bulletin 29 (Spring): 111-132.
Gersen, Jacob E., and Anne Joseph O’Connell. 2008. “Deadlines in Administrative Law,” University of Pennsylvania Law Review 156 (4): 923–90.
Government Accountability Office (GAO). 2014. Federal Rulemaking: Agencies Included Key Elements of Cost-Benefit Analysis, but Explanations of Regulations’ Significance Could Be More Transparent, Report No. GAO-14-714 (September).
Graham, John D. 2008. “Saving Lives through Administrative Law and Economics.” University of Pennsylvania Law Review 157: 395-540.
Graham, John D., and Cory R. Liu. 2014. “Regulatory and Quasi-Regulatory Activity without OMB and Cost-Benefit Review,” Harvard Journal of Law & Public Policy 37 (2): 425–45.
Hahn, Robert W., and Paul C. Tetlock. 2008. “Has Economic Analysis Improved Regulatory Decisions?,” Journal of Economic Perspectives 22:1 (Winter): 67-84.
Hazlett, Thomas W. 2011. “Economic Analysis at the Federal Communications Commission: A Simple Proposal to Atone for Past Sins,” Resources for the Future Discussion Paper 11-23 (May).
Kagan, Elena. 2001. “Presidential Administration,” Harvard Law Review 114: 2245–385. Kraus, Bruce R. 2015. “Economists in the Room and the SEC,” The Yale Law Journal Forum
(January 22): 280-304.
28
OEA Working Paper 48
Lavoie, Don. 1990. “Hermeneutics, Subjectivity, and the Lester/Machlup Debate: Toward a More Anthropological Approach to Empirical Economics,” in Economics as Discourse: An Analysis of the Language of Economists, edited by Warren J. Samuels, 167–87. Dordrecht, Netherlands: Springer.
Markham, Jesse. 2003. “Remarks for Bureau of Economics Contributions to Law Enforcement, Research and Economic Knowledge and Policy: Bureau of Economics Contribution to Antitrust Enforcement,” (September 4), available at http://www.ftc.gov/be/workshops/directorsconference/docs/directorstableGOOD.pdf.
McGarity, Thomas O. 1991. Reinventing Rationality: The Role of Regulatory Analysis in the Federal Bureaucracy. New York: Cambridge University Press.
McLaughlin, Patrick A. 2011. “The Consequences of Midnight Regulations and Other Surges in Regulatory Activity,” Public Choice 147 (3): 395–412.
Morgenstern, Richard D. 1997. Economic Analyses at EPA: Assessing Regulatory Impact. Washington, DC: Resources for the Future.
Norman, Geoff. 2010. “Likert Scales, Levels of Measurement and the ‘Laws’ of Statistics,” Advances in Health Science Education 15: 625-32.
OMB (Office of Management and Budget). 2005. Validating Regulatory Analysis: 2005 Report to Congress on the Costs and Benefits of Federal Regulations and Unfunded Mandates on State, Local, and Tribal Entities.
________. 2003. “Circular A-4, Regulatory Analysis.” OMB, Washington, DC, available at https://www.whitehouse.gov/omb/information-for-agencies/circulars/.
Pautler, Paul A. 2015. “A History of the FTC’s Bureau of Economics,” available at SSRN: https://ssrn.com/abstract=2657330 or http://dx.doi.org/10.2139/ssrn.2657330.
Quinnell, Richard, 2017. “Maker vs. Designer vs. Engineer: What’s the Difference?,” Electronic Products, available at https://www.electronicproducts.com/Education/Career/Maker_vs_designer_vs_engineer_what_s_the_difference.aspx.
Schütz, Alfred. 1953. “Common-Sense and Scientific Interpretation of Human Action,” Philosophy and Phenomenological Research 14 (1): 1–38.
Shamoun, Dima Yazji, and Bruce Yandle. 2016. “Asserting Presidential Preferences in a Regulatory Review Bureaucracy,” Public Choice 166: 87-111.
Shapiro, Sidney A., and Ronald F. Wright. 2011. “The Future of the Administrative Presidency: Turning Administrative Law Inside-Out,” University of Miami Law Review 65 (2): 577–611.
Shapiro, Stuart. 2017. “Structure and Process: Examining the Interaction Between Bureaucratic Organization and Analytical Requirements,” Review of Policy Research 34 (5) (2017): 682-99.
________. 2016. Analysis and Public Policy: Successes, Failures, and Directions for Reform. Cheltenham, UK: Edward Elgar Publishing.

29
OEA Working Paper 48
Shapiro, Stuart, and John F. Morrall III. 2012. “The Triumph of Regulatory Politics: Benefit-Cost Analysis and Political Salience,” Regulation & Governance 6 (2): 189–206.
Shapiro, Stuart, and Laura Stanley. 2016. “Economists in the Bureaucracy: A Question of Autonomy,” Mercatus on Policy (May).
Stata. 2015. Stata Base Reference Manual, Release 14. (College Station, TX: Stata Press). Viscusi, W. Kip, Josepch E. Harrington, and John M. Vernon. 2005. Economics of Regulation
and Antitrust, 4th ed. Cambridge, MA; MIT Press. Williams, Richard. 2008. “The Influence of Regulatory Economists in Federal Health and Safety
Agencies,” Working Paper No. 08-15, Mercatus Center at George Mason University, Arlington, VA.
Williams, Richard A., and Kimberly M. Thompson. 2004. “Integrated Analysis: Combining Risk and Economic Assessments While Preserving the Separation of Powers,” Risk Analysis 24 (6): 1613-23.

30
OEA Working Paper 48
Appendix 1: List of Regulations
Report Card Sample
Proposed Rule RIN Dept Year Functional
Organization Economist
Review Car and Light Truck Corporate Average Fuel Economy 2011-2015 2127-AK29 DOT 2008 1 0 National Ambient Air Quality Standards for Lead 2060-AN83 EPA 2008 0 1 Real Estate Settlement Procedures Act 2502-AI61 HUD 2008 0 0 Class Exemption for Provision of Investment Advice, Proposed Rule 1210-AB13 Labor 2008 1 0 Congestion Management Rule for LaGuardia Airport 2120-AI70 DOT 2008 0 0 Large Aircraft Security Program 1652-AA53 DHS 2008 0 1 US VISIT Biometric Exist System 1601-AA34 DHS 2008 0 1 Fiduciary Requirements for Disclosure in Participant-Directed Plans 1210-AB07 Labor 2008 1 0 Notice of Class Exemption for Provision of Investment Advice 1210-ZA14 Labor 2008 1 0 Effluent Limitations Guidelines and Standards for Construction 2040-AE91 EPA 2008 0 1 Electronic Prescriptions for Controlled Substances 1117-AA61 DOJ 2008 0 0 Migratory Bird Hunting 1018-AV62 Interior 2008 0 0 Nondiscrimination in State/Local Government Services 1190-AA46 DOJ 2008 0 0 Nondiscrimination by Public/Commercial Facilities 1190-AA44 DOJ 2008 0 0 Energy Conservation for Commercial Freezers and Refrigerators 1904-AB59 DOE 2008 0 0 Railroad Tank Car Transportation of Hazardous Materials 2130-AB69 DOT 2008 0 0 Family and Medical Leave Act of 1993 1215-AB35 Labor 2008 1 0 Congestion Mgt. for John F. Kennedy Airport and Newark Airport 2120-AJ28 DOT 2008 0 0 Cranes and Derricks in Construction 1218-AC01 Labor 2008 1 0 Refuge Alternatives for Underground Coal Mines 1219-AB58 Labor 2008 1 0 Integrity Management Program for Gas Distribution Pipelines 2137-AE15 DOT 2008 0 0 State-Specific Inventoried Roadless Area Management 0596-AC74 USDA 2008 0 1 Energy Conservation Standards for Fluorescent Lamps 1904-AA92 DOE 2008 0 0 Alternative Energy Production on the OCS 1010-AD30 Interior 2008 0 0

31
OEA Working Paper 48
Standardized Risk-Based Capital Rules (Basel II) 1557-AD07 Treasury 2008 1 0 Oil Shale Management - General 1004-AD90 Interior 2008 0 0 HIPAA Electronic Transaction Standards 0938-AM50 HHS 2008 0 1 Employment Eligibility Verification 9000-AK91 FAR 2008 0 0 Maximum Operating Pressure for Gas Transmission Pipelines 2137-AE25 DOT 2008 0 0 Greenhouse Gases from Light-Duty Vehicles 2060-AP58 EPADOT 2009 1 1 Energy Conservation: Small Electric Motors 1904-AB70 DOE 2009 0 0 Energy Efficiency Standards for Commercial Clothes Washers 1904-AB93 DOE 2009 0 0 Energy Efficiency Standards for Pool Heaters etc. 1904-AA90 DOE 2009 0 0 Living Organisms in Ships' Ballast Water Discharged in U.S. Waters 1625-AA32 DHS 2009 0 1 Nutrition Labeling of Single-Ingredient Products 0583-AC60 USDA 2009 0 1 Title V Greenhouse Gas Tailoring Rule 2060-AP86 EPA 2009 0 1 Emissions From New Marine Compression-Ignition Engines 2060-AO38 EPA 2009 0 1 Portland Cement NESHAP 2060-AO15 EPA 2009 0 1 Greenhouse Gas Mandatory Reporting Rule 2060-AO79 EPA 2009 0 1
Migratory Bird Hunting 1018-AW31 Interior 2009 0 0
Emission Standards, Reciprocating Internal Combustion Engines 2060-AP36 EPA 2009 0 1 Lead; Opt-out and Recordkeeping Provisions 2070-AJ55 EPA 2009 0 1 Primary National Ambient Air Quality Standard for Nitrogen Dioxide 2060-AO19 EPA 2009 0 1 Motor Vehicle Safety Standards, Ejection Mitigation 2127-AK23 DOT 2009 1 0 Primary National Ambient Air Quality Standard for Sulfur Dioxide 2060-AO48 EPA 2009 0 1 Medical Examination of Aliens 0920-AA26 HHS 2009 0 1 Positive Train Control 2130-AC03 DOT 2009 0 0 Hazard Communications Standard 1218-AC20 DOL 2009 1 0 Renewable Fuels Program 2060-A081 EPA 2009 0 1 Greenhouse Gas & Fuel Efficiency for Medium/Heavy Duty Vehicles 2127-AK74 DOT/EPA 2010 1 1 Migratory Bird Hunting 1018-AX06 DOI 2010 0 0 Reconsideration of the 2008 Ozone NAAQS 2060-AP98 EPA 2010 0 1

32
OEA Working Paper 48
Risk-Based Capital Standards: Market Risk 1557-AC99 TREAS 2010 1 0 Lowering Miners' Exposure to Coal Mine Dust 1219-AB64 DOL 2010 1 0 Federal Motor Vehicle Safety Standard, Rearview Mirrors 2127-AK43 DOT 2010 1 0 Modifications to the HIPAA Privacy, Security, and Enforcement Rules 0991-AB57 HHS 2010 0 1 Seat Belts on Motorcoaches 2127-AK56 DOT 2010 1 0 NSPS/Emission Guidelines for Sewage Sludge Incinerators 2060-AP90 EPA 2010 0 1 Definition of Fiduciary 1210-AB32 DOL 2010 1 0 Lead; Clearance and Clearance Testing Requirements for Renovation 2070-AJ57 EPA 2010 0 1 Flight and Duty Time Limitations and Rest Requirements 2120-AJ58 DOT 2010 0 0 Wage Methodology for Temp. Non-Agricultural Employment H-2B 1205-AB61 DOL 2010 0 0 Cigarette Warning Label Statements 0910-AG41 HHS 2010 1 1 Prohibited Transaction Exemption for Provision of Investment Advice 1210-AB35 DOL 2010 1 0 Walking Working Surfaces and Personal Fall Protection Systems 1218-AB80 DOL 2010 1 0 Energy Efficiency Standards for Residential Refrigerators and Freezers 1904-AB79 DOE 2010 0 0 Hours of Service 2126-AB26 DOT 2010 0 0 Industrial, Commercial, and Institutional Boilers and Process Heaters 2060-AM44 EPA 2010 0 1 Transport Rule (CAIR Replacement Rule) 2060-AP50 EPA 2010 0 1 NESHAP: Mercury Cell Chlor-Alkali Plants, Amendments 2060-AN99 EPA 2010 0 1 Coal Combustion Residuals from Commercial Electric Power Producers 2050-AE81 EPA 2010 0 1 Oil and Natural Gas Sector--New Source Performance Standards and National Emission Standards for Hazardous Air Pollutants 2060-AP76 EPA 2011 0 1 Revising Underground Storage Tank Regulations 2050-AG46 EPA 2011 0 1 Transparency Reports and Reporting of Physician Ownership of Investment Interests 0938-AR33 HHS 2011 0 1 Mandatory Inspection of Catfish and Catfish Products 0583-AD36 USDA 2011 0 1 State-Specific Inventoried Roadless Area Management: Colorado 0596-AC74 USDA 2011 0 1

33
OEA Working Paper 48
Food Labeling: Calorie Labeling in Vending Machines 0910-AG56 HHS 2011 1 1 Food Labeling: Nutrition Labeling of Standard Menu Items in Restaurants and Similar Retail Food Establishments 0910-AG57 HHS 2011 1 1 Requirements To Implement American Health Benefit Exchanges and Other Provisions of the Affordable Care Act 0938-AQ67 HHS 2011 0 1 Exchange Functions in the Individual Market: Eligibility Determinations; Standards for Verification of Employer-Sponsored Health Coverage, Employer Appeals, and Employer SHOP Participation 0938-AR25 HHS 2011 0 1 Migratory Bird Hunting; 2011-12 Migratory Game Bird Hunting Regulations 1018-AX34 DOI 2011 0 0 National Standards to Prevent, Detect, and Respond to Prison Rape 1105-AB34 DOJ 2011 0 0 Application of the Fair Labor Standards Act to Domestic Service 1235-AA05 DOL 2011 1 0 Secure Handling of Ammonium Nitrate Program 1601-AA52 DHS 2011 0 1 Energy Efficiency Standards for Fluorescent Lamp Ballasts 1904-AB50 DOE 2011 0 0 Energy Efficiency Standards for Residential Furnace, Central Air Conditioners and Heat Pumps 1904-AC06 DOE 2011 0 0 Electronic On-Board Recorders and Hours of Service Supporting Documents 2126-AB20 DOT 2011 0 0 Passenger Car and Light Truck Corporate Average Fuel Economy Standards MYs 2017 and Beyond
2127-AK79,
2060-AQ54 DOT/EPA 2011 1 1 Positive Train Control Systems Amendments 2130-AC27 DOT 2011 0 0 Credit Risk Retention--Definition of Qualified Residential Mortgage 2501-AD53 TREAS 2011 1 0 National Organic Program: Sunset Review for Nutrient Vitamins and Minerals 0581-AD17 USDA 2011 0 1 National Emission Standards for Hazardous Air Pollutants for Coal- and Oil-Fired Electric Utility Steam Generating Units 2060-AP52 EPA 2011 0 1 Criteria and Standards for Cooling Water Intake Structures 2040-AE95 EPA 2011 0 1

34
OEA Working Paper 48
National Emission Standards for Hazardous Air Pollutants for Major Sources: Industrial, Commercial, and Institutional Boilers and Process Heaters; Proposed Reconsideration 2060-AR13 EPA 2011 0 1 New Poultry Slaughter Inspection 0583-AD32 USDA 2012 0 1 Energy Efficiency Standards Determination for Distribution Transformers 1904-AC04 DOE 2012 0 0 Energy Efficiency Standards for Microwave Ovens (Standby and Off Mode) 1904-AC07 DOE 2012 0 0 Energy Conservation Program: Energy Conservation Standards for Battery Chargers and External Power Supplies 1904-AB57 DOE 2012 0 0 Administrative Simplification: Standard Unique Identifier for Health Plans 0938-AQ13 HHS 2012 0 1 Migratory Bird Hunting; 2012-13 Migratory Game Bird Hunting Regulations 1018-AX97 DOI 2012 0 0 Electronic Stability Control Systems for Heavy Vehicles 2127-AK97 DOT 2012 1 0 Reconsideration of Final National Emission Standards for Hazardous Air Pollutants for Reciprocating Internal Combustion Engines 2060-AQ58 EPA 2012 0 1 National Ambient Air Quality Standards for Particulate Matter; Proposed Rule 2060-AO47 EPA 2012 0 1 Unique Device Identification 0910-AG31 HHS 2012 1 1 Exchanges Part II--Standards Related to Essential Health Benefits 0938-AR03 HHS 2012 0 1 Notice of Benefit and Payment Parameters 0938-AR51 HHS 2012 0 1 Patient Protection and Affordable Care Act; Health Insurance Market Rules 0938-AR40 HHS 2012 0 1 Multi-State Exchanges; Implementations for Affordable Care Act Provisions 3206-AM47 OPM 2012 0 0 Current Good Manufacturing Practice and Hazard Analysis and Risk-Based Preventive Controls for Human Food 0910-AG36 HHS 2013 1 1 Standards for the Growing, Harvesting, Packing, and Holding of Produce for Food Consumption 0910-AG35 HHS 2013 1 1 Sound for Hybrid and Electric Vehicles 2127-AK93 DOT 2013 1 0 Passenger Screening Using Advanced Imaging Technology 1652-AA67 DHS 2013 0 1
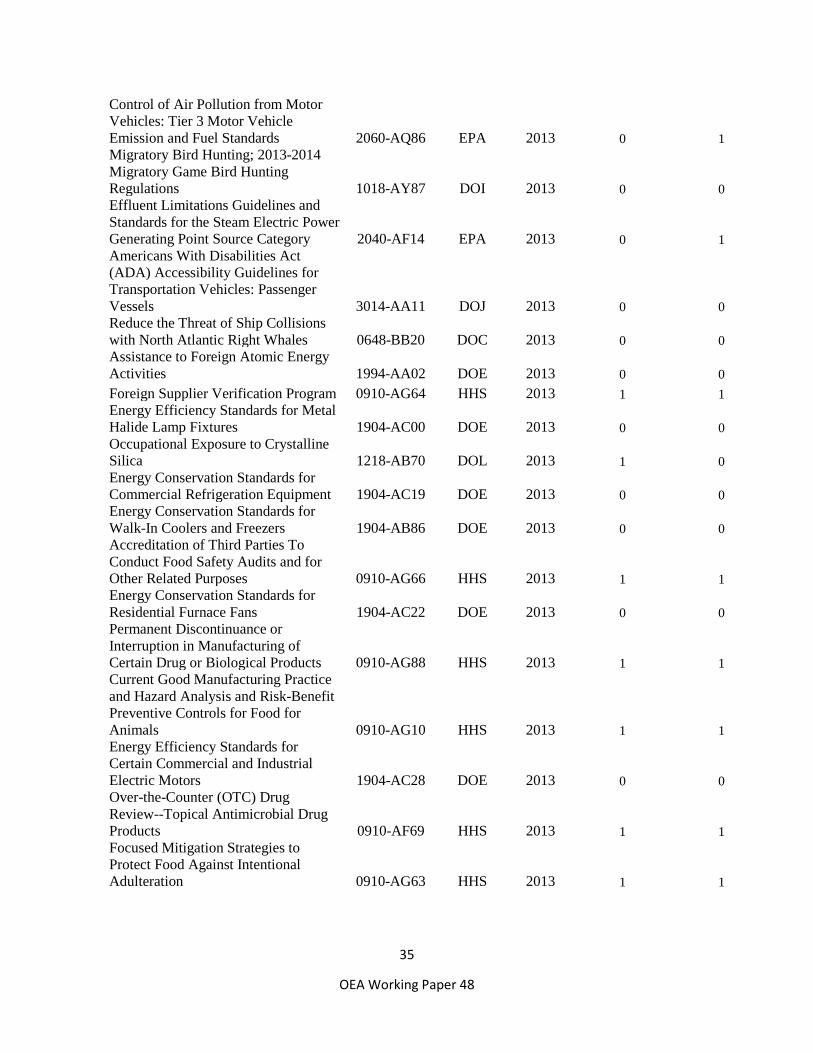
35
OEA Working Paper 48
Control of Air Pollution from Motor Vehicles: Tier 3 Motor Vehicle Emission and Fuel Standards 2060-AQ86 EPA 2013 0 1 Migratory Bird Hunting; 2013-2014 Migratory Game Bird Hunting Regulations 1018-AY87 DOI 2013 0 0 Effluent Limitations Guidelines and Standards for the Steam Electric Power Generating Point Source Category 2040-AF14 EPA 2013 0 1 Americans With Disabilities Act (ADA) Accessibility Guidelines for Transportation Vehicles: Passenger Vessels 3014-AA11 DOJ 2013 0 0 Reduce the Threat of Ship Collisions with North Atlantic Right Whales 0648-BB20 DOC 2013 0 0 Assistance to Foreign Atomic Energy Activities 1994-AA02 DOE 2013 0 0 Foreign Supplier Verification Program 0910-AG64 HHS 2013 1 1 Energy Efficiency Standards for Metal Halide Lamp Fixtures 1904-AC00 DOE 2013 0 0 Occupational Exposure to Crystalline Silica 1218-AB70 DOL 2013 1 0 Energy Conservation Standards for Commercial Refrigeration Equipment 1904-AC19 DOE 2013 0 0 Energy Conservation Standards for Walk-In Coolers and Freezers 1904-AB86 DOE 2013 0 0 Accreditation of Third Parties To Conduct Food Safety Audits and for Other Related Purposes 0910-AG66 HHS 2013 1 1 Energy Conservation Standards for Residential Furnace Fans 1904-AC22 DOE 2013 0 0 Permanent Discontinuance or Interruption in Manufacturing of Certain Drug or Biological Products 0910-AG88 HHS 2013 1 1 Current Good Manufacturing Practice and Hazard Analysis and Risk-Benefit Preventive Controls for Food for Animals 0910-AG10 HHS 2013 1 1 Energy Efficiency Standards for Certain Commercial and Industrial Electric Motors 1904-AC28 DOE 2013 0 0 Over-the-Counter (OTC) Drug Review--Topical Antimicrobial Drug Products 0910-AF69 HHS 2013 1 1 Focused Mitigation Strategies to Protect Food Against Intentional Adulteration 0910-AG63 HHS 2013 1 1

36
OEA Working Paper 48
Shapiro-Morrall Sample
Regulation RIN Dept Year Functional
Organization Economist
Review Advanced Airbags 2127-G70 DOT 2000 1.0 0.0 Roadless Area Conservation 0596-ab77 USDA 2000 0.0 1.0 Arsenic and Clarifications to Compliance and New Source Contaminants Monitoring 2040-ab75 EPA 2001 0.0 1.0 Safe and Sanitary Processing and Importing of Juice 0910-aa43 HHS 2000 1.0 1.0 Energy Conservation Standards for Water Heaters 1904-aa76 DOE 2000 0.0 0.0 Energy Conservation Standards for Fluorescent Lamp Ballasts 1904-AA75 DOE 2000 0.0 0.0 Labeling of Shell Eggs 0910-ab30 HHS 2000 1.0 1.0 National Emission Standards for Hazardous Air Pollutants for Chemical Recovery Combustion Sources 2060-AI34 EPA 2001 0.0 1.0 Standards for Privacy of Individually Identifiable Heath Information 0991-ab08 HHS 2000 0.0 1.0 Energy Conservation Standards for Clothes Washers 1904-AA67 DOE 2001 0.0 0.0 Identification of Dangerous Levels of Lead 2070-AC63 EPA 2001 0.0 1.0 Health Insurance Reform: Standards for Electronic Transactions 0938-AI58 HHS 2000 0.0 1.0 Control of emissions of air pollution from 2004 and later model year highway heavy-duty engines; 2060-AI12 EPA 2001 0.0 1.0 Tire Pressure Monitoring Systems 2127-ai33 DOT 2002 1.0 0.0 Control of Emissions From Nonroad Large Spark-Ignition Engines, and Recreational Engines 2060-ai11 EPA 2001 0.0 1.0 Truck Driver Hours of Service 2126-aa23 DOT 2003 0.0 0.0 National Pollutant Discharge Permits and Standards for Concentrated Animal Feeding Operations (CAFOs) 2040-ad19 EPA 2003 0.0 1.0 Light Truck CAFE for Model Years 2005-2007 2127-ai70 DOT 2002 1.0 0.0 Patent Listing Requirements and Application of 30 Month Stays of Abbreviated New Drug Applications (Generics) 0910-AC48 HHS 2003 1.0 1.0 Trans fat Labeling 0910-AB66 HHS 2003 1.0 1.0

37
OEA Working Paper 48
Establishing Location, Design, Construction, and Capacity Standards for Cooling Water Intake Structures at Large Existing Power Plants 2040-AD62 EPA 2004 0.0 1.0 Prior Notice of Imported Food Under the Public Health Security and Bioterrorism Preparedness and Response Act of 2002 0910-AC41 HHS 2005 1.0 1.0 Registration of Food Facilities Under the Public Health Security and Bioterrorism Preparedness and Response Act of 2002 0910-AC40 HHS 2004 1.0 1.0 Pipeline Integrity Management in High Consequence Areas (Gas Transmission Pipelines) 2137-AD54 DOT 2004 0.0 0.0 Area Maritime Security 1625-AA43 DHS 2004 0.0 1.0 Effluent Guidelines and Standards for the Meat and Poultry Products Point Source Category (Revisions) 2040-AD56 EPA 2004 0.0 1.0 Final Rule Declaring Dietary Supplements Containing Ephedrine Alkaloids Adulterated Because They Present an Unreasonable Risk 0910-AF19 HHS 2004 1.0 1.0 Standard Unique Health Care Provider Identifier 0938-AH99 HHS 2004 0.0 1.0 Reduced Vertical Separation Minimum in Domestic US Airspace 2120-AH68 DOT 2003 0.0 0.0 National Emission Standards for Hazardous Air Pollutants: Stationary Reciprocating Internal Combustion Engines. 2060-AG63 EPA 2003 0.0 1.0 National Emission Standards for Hazardous Air Pollutants: Plywood and Composite Wood Products 2060-AG52 EPA 2003 0.0 1.0 National Primary Drinking Water Regulations: Long Term 2 Enhanced Surface Water Treatment Rule 2040-AD37 EPA 2004 0.0 1.0 National Emission Standards for Hazardous Air Pollutants: Industrial/ Commercial/ Institutional Boilers and Process Heaters 2060-AG69 EPA 2003 0.0 1.0 Control of Emissions of Air Pollution From Nonroad Diesel Engines and Fuel 2060-AK27 EPA 2003 0.0 1.0 Clean Air Mercury Rule--Electric Utility Steam Generating Units 2060-AJ65 EPA 2005 0.0 1.0 Air Cargo Security Requirements 1652-AA23 DHS 2004 0.0 1.0 Electronic Transmission of Passenger and Crew Manifests for Vessels and Aircraft 1651-AA37 DHS 2004 0.0 1.0

38
OEA Working Paper 48
Establishment and Maintenance of Records Pursuant to the Public Health Security and Bioterrorism Preparedness and Response Act of 2002 0910-AC39 HHS 2005 1.0 1.0 Tire Pressure Monitoring Systems 2127-AJ23 DOT 2006 1.0 0.0 Bovine Spongiform Encephalopathy: Minimal Risk Regions and Importation of Commodities 0579-AB73 USDA 2005 0.0 1.0 Occupant Crash Protection: Rear Center Lap/Shoulder Belt Requirement--Standard 208 2127-AI91 DOT 2005 1.0 0.0 Upgrade of Head Restraints 2127-AH09 DOT 2004 1.0 0.0 Electronic Orders for Schedule I and II Controlled Substances 1117-AA60 DOJ 2005 0.0 0.0 Hours of Service of Drivers 2126-AA90 DOT 2005 0.0 0.0 Amendments to the Performance Standard for Diagnostic X-Ray Systems and Their Major Components 0910-AC34 HHS 2005 1.0 1.0 Clean Air Visibility Rule: Best Available Retrofit Technology (BART) 2060-AJ31 EPA 2004 0.0 1.0 Immunization Standard for Long Term Care Facilities 0938-AN95 HHS 2005 0.0 1.0 Clean Air Interstate Rule 2060-AL76 EPA 2003 0.0 1.0 Congestion and Delay Reduction at Chicago O’Hare International Airport 2010-AI51 DOT 2006 0.0 0.0 Occupational Exposure to Hexavalent Chromium 1218-AB45 DOL 2005 1.0 0.0 Light Truck Average Fuel Economy Standards, Model Years 2008-2011 2127-AJ61 DOT 2006 1.0 0.0 Electronic Prescribing Standards 0938-AN49 HHS 2006 0.0 1.0 Standards of Performance for Stationary Compression Ignition Internal Combustion Engines 2060-AM82 EPA 2006 0.0 1.0 National Primary Drinking Water Regulations: Stage 2 Disinfection Byproducts Rule 2040-AD38 EPA 2006 0.0 1.0 Review of the National Ambient Air Quality Standards (NAAQS) for Particulate Matter 2060-AI44 EPA 2005 0.0 1.0 Chemical Facilities 1601-AA41 DHS 2007 0.0 1.0 Documents for Travel WH 1651-AA66 DHS 2006 0.0 1.0 Trans Worker ID cards Maritime 1652-AA41 DHS 2007 0.0 1.0 BSE prevention Specified risk materials 0583-AC88 USDA 2007 0.0 1.0 CGMP Dietary Supplements 0910-AB88 HHS 2007 1.0 1.0 Passenger Manifest 1651-AA62 DHS 2007 0.0 1.0 Mine Evacuation 1219-AB46 DOL 2007 1.0 0.0 CGMP Blood Supply 0910-AB76 HHS 2007 1.0 1.0
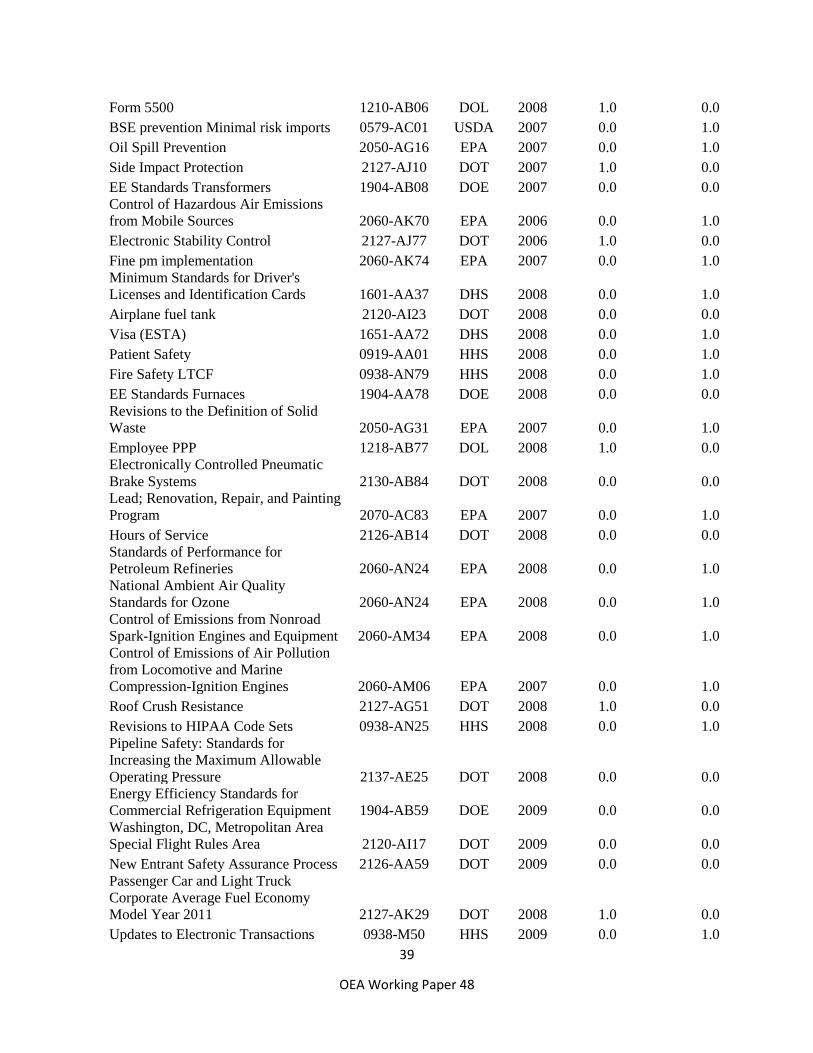
39
OEA Working Paper 48
Form 5500 1210-AB06 DOL 2008 1.0 0.0 BSE prevention Minimal risk imports 0579-AC01 USDA 2007 0.0 1.0 Oil Spill Prevention 2050-AG16 EPA 2007 0.0 1.0 Side Impact Protection 2127-AJ10 DOT 2007 1.0 0.0 EE Standards Transformers 1904-AB08 DOE 2007 0.0 0.0 Control of Hazardous Air Emissions from Mobile Sources 2060-AK70 EPA 2006 0.0 1.0 Electronic Stability Control 2127-AJ77 DOT 2006 1.0 0.0 Fine pm implementation 2060-AK74 EPA 2007 0.0 1.0 Minimum Standards for Driver's Licenses and Identification Cards 1601-AA37 DHS 2008 0.0 1.0 Airplane fuel tank 2120-AI23 DOT 2008 0.0 0.0 Visa (ESTA) 1651-AA72 DHS 2008 0.0 1.0 Patient Safety 0919-AA01 HHS 2008 0.0 1.0 Fire Safety LTCF 0938-AN79 HHS 2008 0.0 1.0 EE Standards Furnaces 1904-AA78 DOE 2008 0.0 0.0 Revisions to the Definition of Solid Waste 2050-AG31 EPA 2007 0.0 1.0 Employee PPP 1218-AB77 DOL 2008 1.0 0.0 Electronically Controlled Pneumatic Brake Systems 2130-AB84 DOT 2008 0.0 0.0 Lead; Renovation, Repair, and Painting Program 2070-AC83 EPA 2007 0.0 1.0 Hours of Service 2126-AB14 DOT 2008 0.0 0.0 Standards of Performance for Petroleum Refineries 2060-AN24 EPA 2008 0.0 1.0 National Ambient Air Quality Standards for Ozone 2060-AN24 EPA 2008 0.0 1.0 Control of Emissions from Nonroad Spark-Ignition Engines and Equipment 2060-AM34 EPA 2008 0.0 1.0 Control of Emissions of Air Pollution from Locomotive and Marine Compression-Ignition Engines 2060-AM06 EPA 2007 0.0 1.0 Roof Crush Resistance 2127-AG51 DOT 2008 1.0 0.0 Revisions to HIPAA Code Sets 0938-AN25 HHS 2008 0.0 1.0 Pipeline Safety: Standards for Increasing the Maximum Allowable Operating Pressure 2137-AE25 DOT 2008 0.0 0.0 Energy Efficiency Standards for Commercial Refrigeration Equipment 1904-AB59 DOE 2009 0.0 0.0 Washington, DC, Metropolitan Area Special Flight Rules Area 2120-AI17 DOT 2009 0.0 0.0 New Entrant Safety Assurance Process 2126-AA59 DOT 2009 0.0 0.0 Passenger Car and Light Truck Corporate Average Fuel Economy Model Year 2011 2127-AK29 DOT 2008 1.0 0.0 Updates to Electronic Transactions 0938-M50 HHS 2009 0.0 1.0

40
OEA Working Paper 48
Reduced Stopping Distance Requirements for Truck Tractors 2127-AJ37 DOT 2008 1.0 0.0 Prevention of Salmonella Enteritidis in Shell Eggs 0910-AC14 HHS 2008 1.0 1.0 Real Estate Settlement Procedures Act (RESPA) 2502-AI61 HUD 2009 0.0 0.0 Energy Efficiency Standards for General Service Fluorescent Lamps and Incandescent Lamps 1904-AA92 DOE 2009 0.0 0.0 Review of the National Ambient Air Quality Standards for Lead 2060-AN83 EPA 2008 0.0 1.0
41
OEA Working Paper 48
Appendix 2: Data Sources Report Card scores for Quality of analysis, Any use claimed, and Cognizance of net benefits: These scores were assigned as part of the Mercatus Center at George Mason University’s Regulatory Report Card project, described in Ellig (2016). Score data are available from the authors. Shapiro-Morrall scores for Quality of analysis: These scores were assigned as part of the research project described in Shapiro and Morrall (2012), and Stuart Shapiro graciously shared them with us. Functional organization and Economist review: Coding method described in text. Economists per regulation: Number of economists for each agency annually was retrieved from https://www.fedscope.opm.gov/employment.asp. Number of regulations: An annual count of the number of regulations for each agency in the sample. Department policy preference: Clinton and Lewis (2008). OIRA review time, Clinton, Obama, Acting OIRA administrator, A4: Dates to calculate these variables are from OIRA regulatory review records at www.reginfo.gov. Midnight: Classification as a midnight regulation is based on the final regulation’s publication date in the Federal Register. Impact exceeds $1 billion: Classification based on benefit and cost figures reported in the Regulatory Impact Analysis for each regulation. Cost consideration prohibited, EPCA: Classification based on the legislative authority cited in the preamble to each regulation. Statutory deadline, Judicial deadline: www.reginfo.gov.

42
OEA Working Paper 48
Appendix 3: Robustness Checks This appendix describes the results of additional regressions run using the full model to ensure that the results for the two organizational variables of interest, Functional organization and Economist review, are robust across alternative specifications of the model. Regression results are available from the authors. Factor analysis for Quality of analysis
Factor analysis was applied to the four Report Card and the six Shapiro-Morrall evaluation criteria to assess whether a smaller number of underlying latent factors are correlated with those criteria. In both cases, the analysis revealed one overwhelmingly dominant factor underlying the individual criteria. When the values of this factor were predicted and used as the dependent variable in OLS regressions, the results were very similar to those reported in Tables 6 and 7. Alternative specifications of organizational variables
Regressions were run using several alternative specifications of Functional organization and Economist review when classification of some agencies was subject to ambiguity. The alternative specification of Functional organization classified several additional agencies as having functional organization when sources indicated that the economists in the program office had some independence because there were several management layers before the economists and regulation-writers in the program office reported to the same manager, or because the economists in the program office had an ethos of functioning independently of the attorneys. An alternative specification of Economist review added one department that had a centralized internal review function that was sometimes but not always staffed by economists. Another alternative specification omitted departments for which sources indicated that the review function was sometimes bypassed or rarely resulted in changes to the analysis. These alternative specifications produced results similar to those in Tables 6, 7 and 11. Single organizational variable
Instead of using Functional organization and Economist review as separate explanatory variables, we created a single dummy variable equal to 1 if either of these variables was equal to 1. This combined variable was positive and statistically significant when Quality of analysis was the dependent variable and not significant when Any claimed use of analysis or Cognizance of net benefits was the dependent variable. Three organizational variables The full model from Tables 6-7 and 11 was run using three organizational dummy variables: Functional organization without economist review, Economist review without functional organization, and Functional organization with economist review. (The latter interactive variable covers only regulations from the FDA and three regulations issued jointly by the EPA and DOT in the Report Card sample, and only regulations from the FDA in the Shapiro-Morrall sample.) When Quality of analysis was the dependent variable, both variables indicating functional organization were positive and significant. Economist review without functional organization was not significant. When Any claimed use of analysis was the dependent variable, none of the organizational variables were significant. When Cognizance of net benefits was the

43
OEA Working Paper 48
dependent variable, only Functional organization without economist review was positive and significant. Multinomial logit
The regressions in Tables 9-11 were also run as multinomial logit regressions. A few failed to converge or were accompanied by warnings that some observations were completely determined. The majority produced results for Functional organization and Economist review consistent with those in Tables 9-11. Economists per regulation The full model in Tables 6, 7, and 11 used a quadratic specification of Economists per regulation. Regressions were run using several alternative specifications of Economists per regulation: logarithmic, linear with a dummy variable if Economists per regulation exceeded its mean value or one standard deviation above the mean, and splines with a knot at the mean or at one standard deviation above the mean. These regressions all produced results for Economist review similar to those in Tables 6, 7, and 11. In the Report Card Quality of analysis regression, Economist review became positive and significant for almost all of these specifications. Number of economists in department The variable Number of economists in department was added to the regressions as an additional explanatory variable. For the Report Card Quality of Analysis regression, Functional organization remained positive and significant, and Economist review remained positive and became significant at the 99 percent level. For the Shapiro-Morrall sample, results for Quality of analysis were similar to Table 7. Results for Any claimed use of analysis and Cognizance of net benefits were similar to Table 11.
Number of economists in department was also substituted for Economists per regulation using multiple different specifications – logarithmic, quadratic, linear with a dummy variable if Number of economists in department exceeded its mean value or one standard deviation above the mean, and splines with a knot at the mean or at one standard deviation above the mean. These regressions all produced results for Economist review similar to those in Tables 6, 7, and 11. In the Report Card Quality of analysis regression, Economist review became positive and significant at the 99 percent level for almost all of these specifications. Number of regulations
The full model in Tables 6, 7, and 11 used a linear specification of Number of regulations. Regressions were run using several alternative specifications of Number of regulations: logarithmic, quadratic, linear with a dummy variable if Number of regulations exceeded its mean value or one standard deviation above the mean, and splines with a knot at the mean or at one standard deviation above the mean. These regressions all produced results for Economist review similar to those in Tables 6, 7, and 11. In the Report Card Quality of analysis regression, Economist review became positive and marginally for almost all of these specifications.

44
OEA Working Paper 48
Year dummy variables The full model from Tables 6, 7, and 11 was run with year dummy variables instead of
administration dummy variables. Results were similar to the results reported in Tables 6, 7 and 11. Omit ECPA
The full model from Tables 6, 7, and 11 was run omitting the variable EPCA, which equals 1 for all but one of the Department of Energy regulations. For the Report Card sample, the statistical significance of Functional organization in the Quality of analysis regression fell to the 95 percent level, and Economist review was no longer marginally significant. In the Any claimed use of analysis regression, Functional organization remained insignificant and Economist review became negative and significant at the 95 percent level. In the Cognizance of net benefits regression, Functional organization’s statistical significance fell to just under the 95 percent level, and Economist review became negative and significant at the 95 percent level. For the Shapiro-Morrall sample, Functional organization remained significant at the 99 percent level.