ellig govt broadband 2005
TRANSCRIPT

A Dynamic Perspective on Government Broadband
Initiatives
Jerry ElligSenior Research Fellow

Municipal electricity, gas, water
Slow technological change Necessities Monopolies
Not characteristics of broadband!
Creative Destruction
“competition from the new commodity, the new technology, the new source of supply, the new type of organization – competition which commands a decisive cost or quality advantage and strikes not at the margins of the profits and the output of existing firms, but at their foundations and their very lives.”
-- Joseph Schumpeter

Dynamic competition ≠ Static monopoly Competition Performance competition Continuous improvement Lock-in Obsolescence Risk Uncertainty

Competition = lower penetration rate Muni plans assume 22-55% penetration
(implies extremely high market share)
Private penetration rates, 2004 Cable modem 18% (60% market share) DSL 14% (37% market share)
Some munis achieve 40% penetration, while making big losses

Performance competition
How fast? Does high traffic slow speeds? How safe from hackers? Can communications be intercepted? Effective parental controls? Copyright protection? Tech support? Wired or wireless? Wireless reception? Good enough to support VoIP?
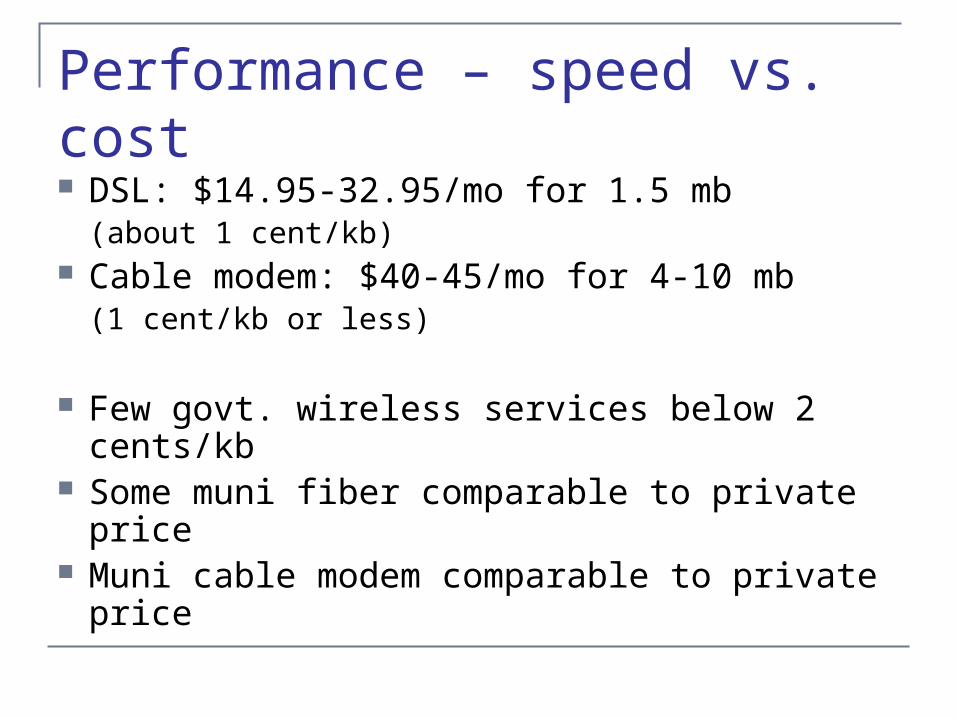
Performance – speed vs. cost
DSL: $14.95-32.95/mo for 1.5 mb (about 1 cent/kb)
Cable modem: $40-45/mo for 4-10 mb(1 cent/kb or less)
Few govt. wireless services below 2 cents/kb Some muni fiber comparable to private price Muni cable modem comparable to private
price

Continuous improvement
Real CPI for Internet service fell 23% since 1997
Real CPI for wireless fell 48% since 1997
DSL prices fell 25% or more 2004-05
Monthly price for wireless PC card fell 25% 2004-05
Cable modem speeds increased 25-200% 2004-05

Continuous improvement
Real Consumer Price Indices
0.00
20.00
40.00
60.00
80.00
100.00
120.00
140.00
1997 1998 1999 2000 2001 2002 2003 2004 2005
Long Distance
Wireless Phone
Internet
Tel Equipment
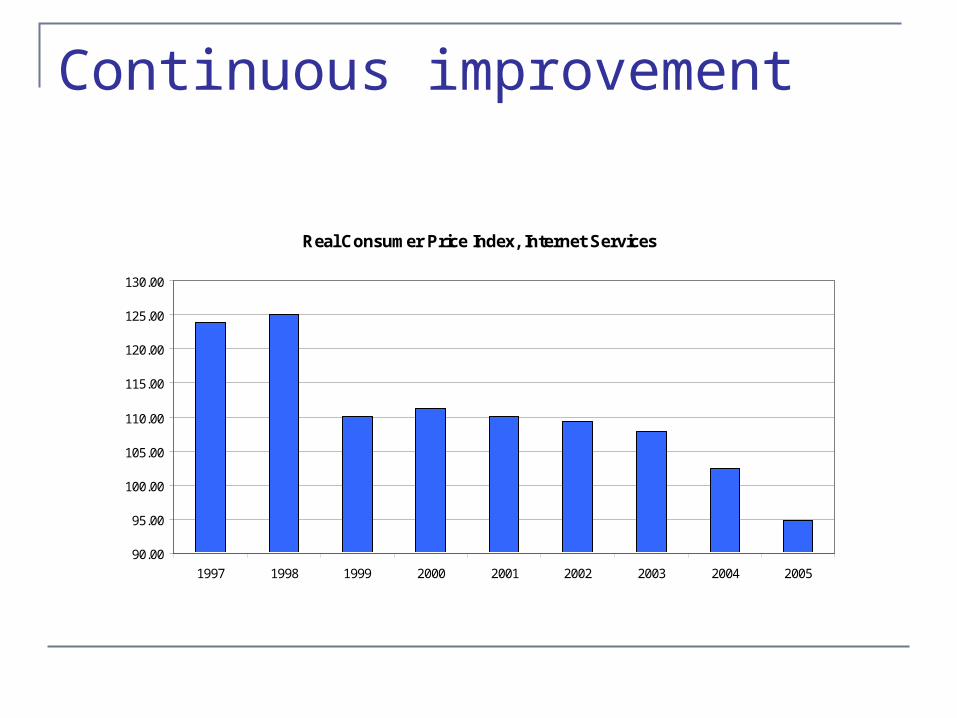
Continuous improvement
Real Consumer Price Index, Internet Services
90.00
95.00
100.00
105.00
110.00
115.00
120.00
125.00
130.00
1997 1998 1999 2000 2001 2002 2003 2004 2005

Lock-in
Concept: Inferior technology with higher initial but lower long-term payoff gets entrenched due to network effects or increasing returns
Will policymaking choose best technology? Interest group influence Short political time horizons (election cycle) Policy bundling reduces competitive pressures Limits on decisionmakers’ ability to profit personally Subsidies exacerbate lock-in
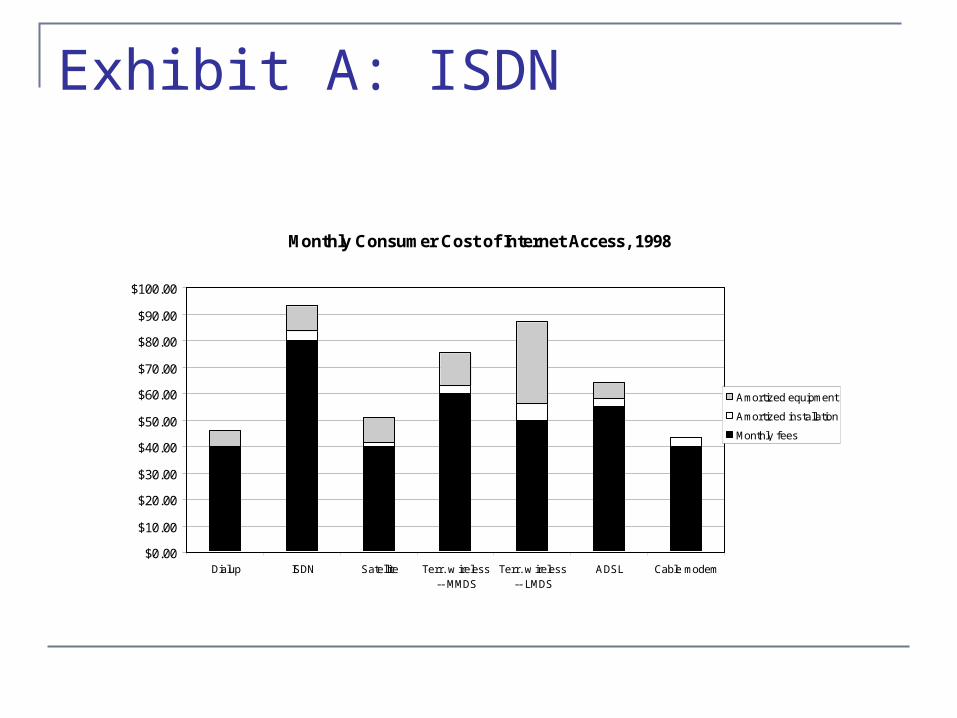
Exhibit A: ISDN
Monthly Consumer Cost of Internet Access, 1998
$0.00
$10.00
$20.00
$30.00
$40.00
$50.00
$60.00
$70.00
$80.00
$90.00
$100.00
Dialup ISDN Satellite Terr. w ireless-- MMDS
Terr. w ireless-- LMDS
ADSL Cable modem
Amortized equipment
Amortized installation
Monthly fees

ISDN speed: 128 k
Residential Internet Speeds Available in 1998 (kilobytes per second)
0
500
1000
1500
2000
2500
3000
3500
Dialup ISDN Satellite Terr. w ireless --MMDS
Terr. w ireless --LMDS
DSL Cable modem

On the technology menu …
Wi-Fi Increased cable modem speed/decreased
congestion Increased DSL speed Fiber to the home EDO wireless 400-800 kb Broadband over powerlines Reduced cost of satellite WiMAX

Obsolescence
Long depreciation schedules impractical
Prices must be higher to recover capital costs before competition erodes profit margins
Eg, Balhoff & Rowe estimate 3-5 years to recover capital cost of Wi-Fi

Comparative Risks
Low Risk Avg. Beta High Risk Avg. Beta
Elec Utility 0.72-0.79 Cable TV 1.75
Gas Dist. 0.65 Telecom
Services
1.32
Water Utility 0.60 Wireless
Networking
2.38

Realistic risk premiums?
Spencer, IA City elec utility borrows at 5.75% and makes 4.5% loan to muni comm utility $11.7 million worth of comm infrastructure allocated to electric utility
Cedar Falls, IA 5% on $6 million loan from city elec utility
Lebanon, OH cable 3-5.26% interest rates on bonds
Bristol, VA 3.77-5.99% loans from muni electric affiliate $2 million tobacco grant
Utah 14-city UTOPIA project assumes 6% over 20 years
Balhoff & Rowe estimate true capital costs are 10-13%

Uncertainty vs. risk
Risk: Outcome is unknown, but possibilities and probabilities are known
Uncertainty: Not all possibilities or probabilities are known
Risk can be insured or diversified away, but uncertainty can’t
Shareholders bear uncertainty and must select directors/monitors/managers with good judgment

Can market accountability be replicated? Corporatization with commitment to privatize Public, audited financial statements Transparent disclosure and quantification of
subsidies Clear articulation of expected public benefits Outcome-oriented performance measures Performance and public benefit data as valid
as financial data

Beware of Geeks Bearing Gifts Nothing inherently wrong with advertiser
support or other private subsidies Exclusive access to right-of-way or poles? Right-of-way access is significant barrier to
broadband deployment Assess potential distortion in markets where
firms sell outputs, not just broadband market

Conclusions
Muni broadband may or may not be a good idea
Broadband is subject to dynamic competition
Any sound muni plan should include strategies for dealing with dynamic concerns