7 th annual performance report scorecard by maurice mctigue, henry wray, and jerry ellig a genda...
TRANSCRIPT

7th Annual Performance Report Scorecard by Maurice McTigue, Henry Wray, and Jerry Ellig
AGENDA
Welcome Hon. Maurice McTigue
Study Results Dr. Jerry Ellig
Remarks and Awards Hon. Maurice McTigue and
Hon. David Walker
Q&A Hon. Maurice McTigue

How we score the reports 1-5 rating scale
3 Categories
Transparency
Public Benefits
Leadership
4 criteria in each category
5 Sets a standard for best practice
4 Shows innovation and creativity
3 Satisfactory
2 Partially complete
1 Fails to meet expectations

A caveat …
This Scorecard evaluates only the quality of This Scorecard evaluates only the quality of agency reports, not the quality of the results agency reports, not the quality of the results they produced for the public. Actual agency they produced for the public. Actual agency performance may or may not be correlated performance may or may not be correlated with report rankings in this Scorecard.with report rankings in this Scorecard.
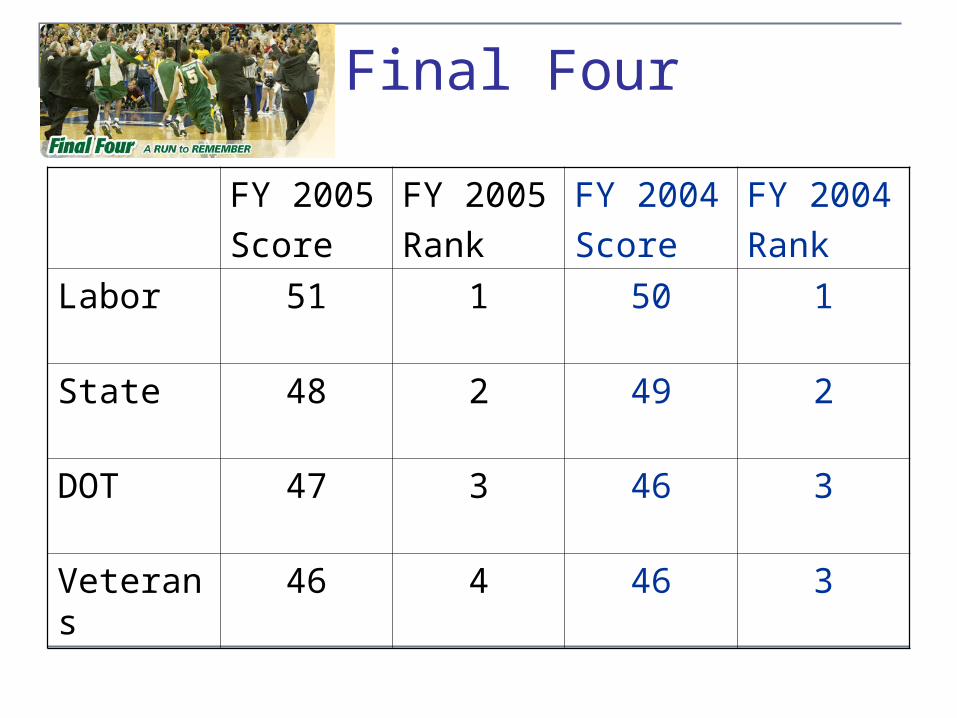
Final Four
FY 2005
Score
FY 2005
Rank
FY 2004
Score
FY 2004
Rank
Labor 51 1 50 1
State 48 2 49 2
DOT 47 3 46 3
Veterans 46 4 46 3

15% of budget covered by satisfactory disclosure

Overall state of accountabilityAgencies’ non-interest net cost of operationsAgencies’ non-interest net cost of operations $2.45 trillion$2.45 trillion
Estimated tax expendituresEstimated tax expenditures $777 billion$777 billion
Cost of regulationCost of regulation $1.1 trillion$1.1 trillion
TotalTotal $4.3 trillion$4.3 trillion
Amount of spending in reports scoring 36+Amount of spending in reports scoring 36+ $374 billion$374 billion
(8.7% of total)(8.7% of total)
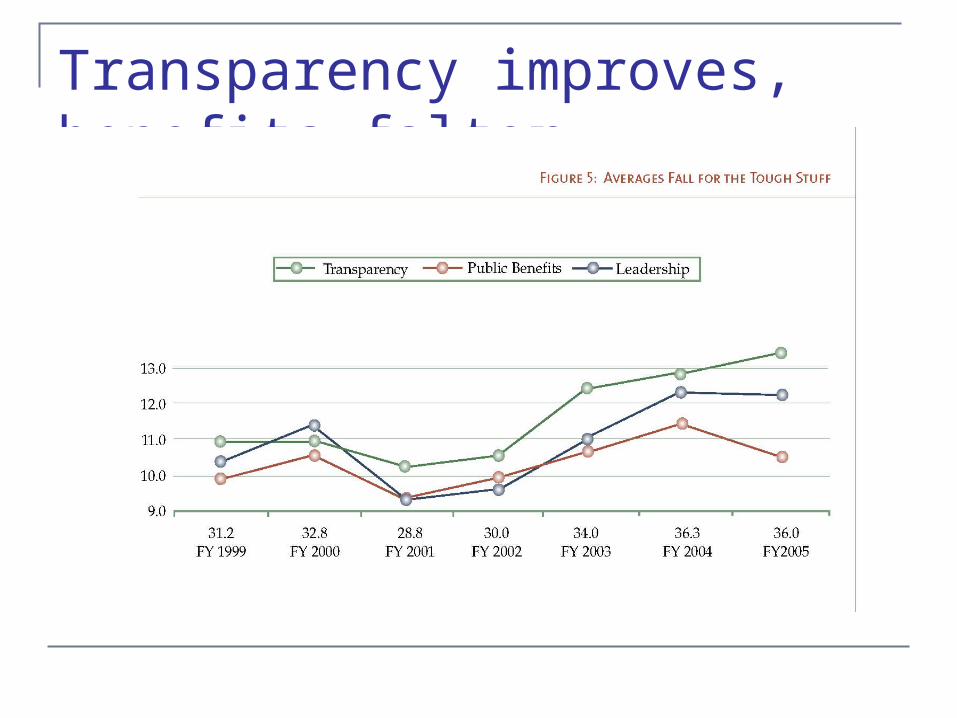
Transparency improves, benefits falter

Big movements
Most improved criterion: Accessibility (#1)
Most deteriorated criterion: Linkage of results to costs (# 8)
Biggest improvers: Treasury, Defense, Ag
Biggest drops: Justice, NSF, Social Security

Biggest challenges
Average scoreAverage score
8. Link results with costs8. Link results with costs 1.881.88
6. Outcome-oriented measures6. Outcome-oriented measures 2.632.63
3. Ensure data quality3. Ensure data quality 2.672.67
7. Demonstrate causality7. Demonstrate causality 2.792.79
10. Explain failures to achieve goals10. Explain failures to achieve goals 2.752.75
11. Major management challenges11. Major management challenges 2.832.83

New this year
Scorecard vs. OMB’s PART
Budget-weighted scores
Guidance for fiscal 2006

Scorecard vs. PART
75% of spending covered by reports scoring below 8 on Public Benefits
10% of PARTed spending is “results not demonstrated”

Budget-weighted scores sometimes differ
For more information
Mercatus guidance for fiscal 2006 reports:www.governmentaccountability.org/scorecard/guidelines
Detailed scoring notes for each report:www.governmentaccountability.org/scorecard/agencies
New Mercatus analysis of PART:www.governmentaccountability.org/PART2007