the natural environment and people chapter 3: … natural environment and people chapter 3:...
TRANSCRIPT

Ch
apte
r 3:
Haz
ardo
us e
nviro
nmen
ts
64
Section A: The natural environment and people
Chapter 3: Hazardous environments
3.1 Different types of hazardA hazard is defined as an event that threatens, or actually causes damage and destruction to people, their property and settlements. A natural hazard is one produced by environmental processes and involves events such as storms, floods, earthquakes and volcanic eruptions. There are also hazards that are created by people. These range from industrial explosions to nuclear warfare, from air and road crashes to fire and the collapse of buildings. Most of these are the outcome of mishaps to do with human technology. The important point to remember with is that, if there were no people, there would be no hazards because hazards in this context means hazards to people.
Geological Climatic Biological Technological
Earthquakes Storms Fires Nuclear explosion
Volcanic eruptions Floods Pests Accidents
Landslides Drought Diseases Pollution
Table 3.1: Four major categories of hazard with examples
Table 3.1 above classifies hazards into four main categories based on their causes and gives some examples of each. This may look neat and tidy, but we need to realise that some hazards have more than one cause and therefore do not fit easily into this classification. For example, floods are not only caused by heavy rainfall. A stream of volcanic lava running down into a valley can easily block the flow of a
Figure 3.1: Malnourished children in a desertified area
IntroductionThis chapter is about three different natural hazards that threaten people in many parts of the world. They are earthquakes, volcanic eruptions and tropical revolving storms (hurricanes and typhoons). They have the power to cause great damage to settlements and to injure and kill many people. Is it possible to predict when and where they will occur? What can be done to minimise their destructive impacts, both before and immediately after the event?
For information about another hazard not covered in this chapter – flooding – see Chapter 1.8.
M03_GEOG_SB_IGCSE_6951_CH03.indd 64 11/8/10 16:31:16

65
Ch
apte
r 3:
Haz
ardo
us e
nviro
nmen
ts
river and cause flooding upstream. Floods in coastal areas can be caused by the tidal waves (tsunamis) associated with earthquakes. Coastal flooding also results from storm surges caused by low atmospheric pressures and not from heavy rainfall.
Another point is that some natural events only become hazards in an indirect ways. For example, drought mainly becomes a hazard because of its effect on food production. Crops and livestock lacking water will not yield so much food. Food shortages mean malnutrition and possibly death by starvation (Figure 3.1).
Diseases are an interesting group of hazards. Are diseases natural events or are they caused by humans? Some are certainly natural hazards. For example, malaria is a ‘vector’ or biological hazard carried from one human to the next by a mosquito. In contrast, there are many contagious diseases associated with human pollution of the environment. Typhoid and cholera are just two examples. An interesting aspect of all diseases is that the hazard threat is very focused on people. The outcomes are illness and death for people.
In this chapter, we are going to focus on three natural hazards: tropical storms, earthquakes and volcanic eruptions (Figure 3.2). Tropical storms are a climatic hazard in which two weather elements, wind and rain, threaten human life and property. Earthquakes and volcanic eruptions are geological hazards.
Before we look more closely at these three hazards, a point needs to be made about hazards in general. An important aspect of all hazards is risk. Risk is about the probability of a particular event happening and the scale of its possible damage. Risk is also what people take knowing that they are ‘exposed’ to a natural event that might prove hazardous. The greater the probability of a natural event occurring in a particular location and causing damage, the greater is the risk that people are taking. This is particularly so if they remain in that location or do not take evasive (preventative)or precautionary actions, known as adjustment or mitigation.
So it is important to remember these three aspects of hazards:
● distribution – where do they occur on the Earth’s surface?
● frequency – do they occur regularly?
● scale – do the events vary in their hazardousness?
To these, we might add a fourth and important question about prediction. Can we predict when these events will occur and their likely scale of damage?
Figure 3.2: Three natural hazards: tropical storms, earthquakes and volcanic eruptions
M03_GEOG_SB_IGCSE_6951_CH03.indd 65 11/8/10 16:31:22

66
Ch
apte
r 3:
Haz
ardo
us e
nviro
nmen
ts
Destructive margin
Collision margin
Constructive margin
Conservative margin
PacificPlate
PacificPlate
Indo-AustralianPlate
African Plate
Arabian
PhilippinesPlate
NazcaPlate
South AmericanPlate
North AmericanPlate
Eurasian Plate
CaribbeanPlate
Plate
Antarctic Plate
Direction ofplate movement
Figure 3.3: The world’s tectonic plates and their margins
3.2 Earthquakes and volcanic eruptionsIn this part of the chapter, we look at three aspects of two tectonic (tectonic means pertaining to the structure and movement of the earth’s crust) hazards, earthquakes and volcanic eruptions:
● their global distributions
● their causes
● their hazard characteristics.
Since earthquakes and volcanic eruptions both result from plate tectonics, they are closely linked in terms of both their distributions and causes. They differ, however, in terms of the sort of damage they do.
Tectonic plates
The crust of the Earth is made up of a number of tectonic plates which are the rigid blocks that make up the surface of the earth (Figure 3.3). These plates move over the surface of the globe. Their movements create four different types of plate margin.
When two plates are moving apart, for example in the oceans, the margin between them is called a constructive or divergent plate margin. It is called this because magma (molten rock) rises to the crust to fill the gap and create new crust through submarine volcanoes. This is happening, for example, along the mid-ocean ridge in the Atlantic Ocean.
The tectonic plates shown in Figure 3.3 are constantly moving. But they do so at a rate that is almost imperceptible on a human time scale.
M03_GEOG_SB_IGCSE_6951_CH03.indd 66 11/8/10 16:31:22

67
Ch
apte
r 3:
Haz
ardo
us e
nviro
nmen
ts
When two plates are moving towards each other, like the Nazca plate and the South American plate, the margin between them is called a destructive or convergent plate margin. The edge of one plate margin is being destroyed as it plunges beneath the other plate it is meeting head on. This is known as subduction. Molten rocks rises to the surface to form volcanoes. The friction between the two plates creates earthquakes.
A collision plate margin occurs where two plates meet head on and are of equal density and strength. The sediments between the two plates are squeezed upwards. The result is the formation of fold mountains, such as the Himalayas that were created by the collision between the Eurasian and Indo-Australian plates. Earthquakes are created by the pressure and friction.
There is a fourth type of plate margin referred to as a conservative plate margin. This occurs where two plates are sliding past each other. Since there is neither rising magma here nor subduction, there are no volcanoes. Instead the friction gives rise to earthquakes as in California between the Pacific and North American plates.
Tectonic plates shape the landscape by creating new rocks and forming mountains and rift valleys. They do this by the processes of volcanic activity, folding and faulting. These are the most powerful natural forces on the planet. It is not surprising that they should give rise to the most awesome natural hazards.
Distribution
Figure 3.4: Global distribution of earthquakes
Make a list of the different types of plate margin and write brief notes about what is happening at each of them.
M03_GEOG_SB_IGCSE_6951_CH03.indd 67 11/8/10 16:31:23

68
Ch
apte
r 3:
Haz
ardo
us e
nviro
nmen
ts
The distributions of earthquakes and volcanoes are similar in that they occur along tectonic plate boundaries. A comparison of Figure 3.4 and Figure 3.5 shows how similar the distributions are. There is an impressive density of earthquakes along the destructive plate margins that fringe the Pacific Ocean (Figure 3.4). The occurrence of earthquakes under the Atlantic, Indian and Pacific Oceans should be noted. When it comes to the distribution of volcanoes, again the concentration around the shores of the Pacific Ocean is noticeable (Figure 3.5). Another concentration occurs along the African Rift Valley formed by a constructive plate margin.
Characteristics
Although their distributions and causes are similar, earthquakes and volcanoes are very different hazards. Their hazard characteristics are not at all alike.
Earthquakes
An earthquake is a sudden and brief period of intense ground-shaking. The movement of the ground can be both vertical and horizontal. Two different scales are used to measure the strength of earthquakes. The Richter Scale measures an earthquake’s strength according to the amount of energy that is released during the event. That energy is measured by a seismograph. The Richter scale runs from 2.4 or less to over 8.0. It is a logarithmic scale which means that one point up on the scale represents a 30 times increase in released energy. The Mercalli Scale is quite different. It is based on what people experience and the amount of damage done (Figure 3.6).
Figure 3.5: Global distribution of volcanoes
Underwater volcanic eruptions can cause tidal waves (tsunamis). See page 69.
M03_GEOG_SB_IGCSE_6951_CH03.indd 68 11/8/10 16:31:24

69
Ch
apte
r 3:
Haz
ardo
us e
nviro
nmen
ts
Figure 3.7 shows what happens during an earthquake, depending on the strength of the shockwaves as measured on the Richter Scale. The centre of the earthquake underground is called the focus. Shock waves travel outwards from the focus. These are strongest close to the epicentre (the point on the surface directly above the focus). The amount of damage caused depends on the depth of the focus and the type of rock. The worst damage occurs where the focus is closest to the surface and where rocks are soft. Shock waves ‘liquefy’ soft rocks so that they have like a liquid. This means that such rocks lose their load-bearing ability. The foundations of buildings and bridges simply collapse.
The hazard threat of earthquakes lies in their ability to shake buildings so vigorously that they fall apart and collapse. Often this damage is worse than it should be because of poor building design. There is a saying that ‘earthquakes do not kill people, buildings do!’ It is falling masonry that traps, crushes and kills people. Earthquakes rupture gas pipes and break electricity cables. It is not surprising therefore that fire is another aspect of the earthquake hazard.
Another after effect of an earthquake is the tidal wave or tsunami. Earthquakes with epicentres under the sea can generate particularly large and destructive tidal waves. The Asian tsunami of 2004 had its epicentre just off the west coast of Sumatra and generated a huge tidal wave up to 30 m high. It caused immense
MercalliScale 2 4 5 7 10–12Events
Reaction ofpeople andbuildings
Not felt generally.Just recordableby seismometer
Sleeping personswake. Hanging
items swing
Felt by nearly everyone. Thingsindoors fall over
Many houses suffer damage e.g. chimneys
and walls fall
Houses collapse.There are landslides
and the ground cracks
Figure 3.6: Some examples from the Mercalli Scale
Figure 3.7: A cross section through an earthquake, and the Richter Scale
littledamage
littledamage
moderatedamage
moderatedamage
earth-tremor force declines withdistance from the epicentre
The Richter Scale
over 854 5 4
FOCUS
EPICENTREmuch damage
shock waves shock waves
The strength of the shock waves is measured by the Richter Scale. This scale, shown above, is used to determine the likely damage caused by an earthquake.
Which of the two earthquake scales do you prefer? Give your reasons.
M03_GEOG_SB_IGCSE_6951_CH03.indd 69 11/8/10 16:31:25

70
Ch
apte
r 3:
Haz
ardo
us e
nviro
nmen
ts
damage in the coastal areas of those countries bordering the Indian Ocean. The casualty list amounted to nearly 300 000. The majority of these victims were drowned. It was one of the deadliest natural disasters in recorded history.
Volcanic eruptions
There are several different hazards associated with volcanic eruptions (Figure 3.8):
● lava flows – since few lava flows reach much beyond 10 km from the volcanic crater, they do not cause as much death and destruction as you might think. Lava flows may destroy farmland, buildings and lines of transport, but lives are rarely lost
● ash – ash may be thrown into the air during a violent eruption. Often this is carried in the wind and therefore can affect quite a large area. This happened over much of Europe in 2010 when a volcano in Iceland erupted. The ash cloud brought air travel to a halt. The further away from the volcano, the thinner will be the deposits of ash. Ash can cause much damage by simply blanketing everything, from crops to roads. Roofs of buildings will collapse if the weight of the deposited ash is great. Air thick with ash can asphyxiate humans and animals
● gas emissions – sulphur is not the only gas to be emitted during an eruption. Other gases emitted, notably carbon dioxide and cyanide, can kill. Being dense, they keep close to the ground
Volcanic eruptions can also generate tsunamis. The huge eruption of Krakatoa in 1883 created waves up to 35 m high. These waves drowned over 36 000 people.
3.3 Tropical storms In this part of the chapter, we focus on a third and very different natural hazard – the tropical storm. As in Part 3.2, the same three aspects will be investigated, namely distribution, causes and hazard characteristics.
Pyroclasticflows
Volcanic dust
Volcanic bombs
FloodsForest fires
Ash
Steam
Gas clouds
Lava flowsLahars
Figure 3.8: Hazards associated with volcanic eruptions
Under the heading of gas emissions, remember to include pyroclastic flows (see page 84).
M03_GEOG_SB_IGCSE_6951_CH03.indd 70 11/8/10 16:31:26

71
Ch
apte
r 3:
Haz
ardo
us e
nviro
nmen
ts
Distribution
Tropical storms or cyclones are large areas of low air pressure. They bring torrential (fast and heavy) rain and very strong winds to tropical regions. Figure 3.9 shows their distribution and what they are called in different parts of the world. For example, severe tropical storms are called hurricanes in North and Central America and the North Atlantic. Depending on the location, there may be from six to over 20 each year, but most occur between mid-summer and early autumn when the sea is warmest.
Causes
Tropical storms need warm water over 27ºC to form. The water heats the air above it, (Figure 3.10), creating an area of very low pressure in the centre or ‘eye’. In the northern hemisphere, the storm winds rotate anti-clockwise; in the southern hemisphere they rotate clockwise. The rising air quickly cools down, forming thick, dense cumulo-nimbus clouds which bring very heavy rainfall.
This area of rotating low pressure (wind) can be over 100 km wide and travel at up to 50 kph. Inside wind speeds can reach over 250 km/h around the edges of the central eye. The eye itself is calm. Figure 3.11 is a satellite image showing the swirling mass of cloud and the clear ‘eye’ at the centre of a hurricane in the Atlantic Ocean off Florida in the USA. Tropical storms need warm water for energy – once they reach land they quickly lose power.
Figure 3.9: Global distribution of tropical storms
Figure 3.10: Cross-section through a tropical storm
hurricanes hurricanes
cyclones
typhoons
wild-willies
Key
warm tropical oceans
very lowpressure;clearer skies;temperatureswarmer;calm
dense cloud;violent wind in gusts;thunderstormtorrential rain
pressure andtemperaturehigher; less cloud, wind and rain
dense cloud;violent wind in gusts;thunderstorm;torrential rain
pressure andtemperaturehigher;less cloud,wind and rain
edge of storm vortex eye vortex edge of storm
air spiralsupwards
toweringcumulo-nimbusclouds
HO
T
AIR
ocean strong windsmoves at 25 kmper hour
Look closely at Figure 3.9. What do you notice about the limits to tropical storms in the two hemispheres?
M03_GEOG_SB_IGCSE_6951_CH03.indd 71 11/8/10 16:31:27

72
Ch
apte
r 3:
Haz
ardo
us e
nviro
nmen
ts
Catergory Wind speed (kph) Pressure (mb) Storm surge (m) Damage
1 119–153 <980 1.0–1.7 Minor – trees, mobile homes
2 154–177 979–965 1.8–2.6 Roofs and windows of buildings Small boats broken from moorings Flooding
3 178–209 964–945 2.7–3.8 Structural damage to buildings Flooding over a metre up to 10 km inland
4 210–249 944–920 3.9–5.6 Major – destroys buildings, beaches and floods up to 10 km inland
5 <250 >920 Over 5.7 Catastrophic – destruction up to 5 metres above sea level Mass evacuation needed
Note that tropical storms have wind speeds between 55 and 118 km/h.
Figure 3.12: The Saffir-Simpson classification of tropical storms
Once wind speed in a tropical storm reaches 119 km/h, it is classified as a hurricane, measured on the five-point Saffir-Simpson scale (Figure 3.12). The critical features that cause the most damage are the wind speeds and the scale of the storm surges.
Tropical storms are given names by meteorologists. These are from alphabetical lists, with alternate male and female first names over a six-year cycle. There are different lists (and names) for different parts of the world. Names help to identify and track individual storms, especially as there may be more than one happening at a time.
Characteristics
The average length of a tropical storm or hurricane is 10 days, but the biggest can last for up to four weeks. They cause three main types of damage – wind, storm surges (in coastal areas) and floods. Winds can destroy trees, crops, buildings, transport, power and communications. Storm surges along coastal areas can be devastating as huge waves hit the land (Figure 3.13). Torrential rainfall can last for several hours or several days, causing widespread flooding inland. This can cause potentially deadly landslides and mudslides.
Figure 3.11: Satellite view of a tropical storm
Storm surges are sudden rises in sea level resulting from the passing of a very deep low pressure weather system. The low pressure allows the sea to ‘expand’. See page 78 for an example.
M03_GEOG_SB_IGCSE_6951_CH03.indd 72 11/8/10 16:31:29

73
Ch
apte
r 3:
Haz
ardo
us e
nviro
nmen
ts
The long-term impact of a tropical storm or hurricane often depends not just on its ferocity, but whether it hits an HIC or LIC. Damage cannot be prevented. However, people in wealthier HICs can board-up properties and be evacuated in time. Warnings are broadcast in advance of approaching storms being monitored via satellite. People are also more able to cope with clearing up the damage and restoring business and economic activities after the event. LICs can be devastated by the effects of a tropical storm. With buildings and farmland ruined and little money available to rebuild, it can take years for the people and economy to recover. Even then, an LIC may often be dependent on international aid both for emergency help and long-term rebuilding.
The three hazards looked at in this chapter all have one thing in common. The scale of their damage and destruction is related to where they occur. Death tolls and damage are almost invariably higher in densely populated areas.
Measuring and recording weather conditions
Since tropical storms are a moving hazard, it is important that they are tracked and forecasts made of their future progress. This is the work of meteorologists. If meteorologists are able to measure how they are developing, then they will be able to warn people in the predicted path of the storm. This should give those people some time in which to prepare for the storm. Precautionary actions might include moving to higher ground or to an emergency shelter. Homes can be made ready by boarding up windows, moving furniture upstairs. The media (TV, radio, the Internet) have an important role to play in keeping the general public updated about the storm and where it is expected to go.
Hurricane Mitch passed over Central America in October 1998. It proved to be a particularly tricky hurricane. First, the meteorologists could not be sure where the storm would come ashore. Another challenge was predicting the storm’s speed of movement. In the event, it moved much slower than most storms. This at least gave areas in the predicted path more time to prepare for the storm. However, those areas beneath the slow-moving storm received much more heavy rainfall than normal (see Part 3.4).
How do meteorologists track and predict the movement of tropical storms? The data they work on comes from a number of different sources.
Storm surge a few metres abovesea level destroys coastal areas.
Coastal village huts
Low-lying coastline of Bangladeshonly a few metres above the high tide
Cyclone shelter
High tide
Low tide
Figure 3.13: The effects of a storm surge
Remember:
• HIC=high-incomecountry
• MIC=middle-incomecountry
• LIC=low-incomecountry
See the Case study of Hurricane Mitch on page 75.
M03_GEOG_SB_IGCSE_6951_CH03.indd 73 11/8/10 16:31:29

74
Ch
apte
r 3:
Haz
ardo
us e
nviro
nmen
ts
Weather stations
There is a global network of weather stations that track the movement of tropical storms. Some are manned; others are automatic. Some monitor the weather all the time; others just at set hours during the day and night. Once all this information about pressure, temperature, humidity, winds and so on is collected and put together, it can be used to predict what will happen to the storm. Will it deepen, with an increase in rainfall and wind speeds or will the storm begin to weaken and fizzle out?
Weather satellites
For viewing large weather systems on a worldwide scale, weather satellites are invaluable (Figure 3.14). They show cloud formations, large weather events such as hurricanes, and other global weather systems. With satellites, forecasters can see weather systems such as tropical storms. On each satellite, there are two types of sensor (Figure 3.15). One is a visible light sensor called the imager. This works like a camera in space and helps gather information on cloud movements and patterns. This sensor can only be used during daylight hours, since it works by capturing reflected light to create images.
The second sensor is called the sounder. It is an infrared sensor that reads temperatures. The higher the temperature of the object, the more energy it emits. This sensor allows satellites to measure the amount of energy radiated by the Earth's surface, clouds, oceans, air and so on. Infrared sensors can be used at night which is helpful for forecasters, considering that the images can only pick up data during daylight hours.
Radar
Doppler radar is another important meteorological tool. Radar works a little differently from satellite sensors. Instead of reading reflected light or energy, radar measures reflected sound waves. When sound waves are broadcast from a radar mast and come into contact with a moving object, such as a rain cloud, radar will give information about the direction and speed of the object’s movement. By using radar and getting a ‘picture’ of precipitation (water falling to the ground) on the radar screen, meteorologists are able to track a storm’s progress over time.
Figure 3.14: Superimposed satellite images showing the progress of a hurricane from right to left
Figure 3.15: A weather satellite
M03_GEOG_SB_IGCSE_6951_CH03.indd 74 11/8/10 16:31:32

75
Ch
apte
r 3:
Haz
ardo
us e
nviro
nmen
ts
3.4 The impacts of natural disastersThe amount of damage and destruction caused by a particular natural disaster depends on a whole range of factors. These include:
● the scale of the event in terms of its energy, the area affected and how long it lasts
● the degree to which people are warned in advance of the event. This is one reason why earthquakes are often so devastating. They occur almost anywhere near a plate margin without warning
● the density of human settlement in the area affected. The more people and economic activities there are in a disaster area, the greater will be the potential damage
● the degree to which people are prepared for a possible natural hazard. Are there emergency shelters? Have people been educated in what should be done in an emergency? Are houses, factories and businesses located in areas of low risk? Have buildings been constructed in such a way that they may be able to withstand the hazard?
● the ability of a country to cope with the aftermath of a hazard, both immediately and in the longer term.
It is with respect to the last two points that a basic contrast is so often seen. The contrast is between LICs and HICs in terms of their ability to prepare for hazards and their ability to cope with the damage caused. The next two cases illustrate these two different ‘hazard worlds’.
Case study: Hurricane Mitch hits Central America
Figure 3.16: The path of Hurricane Mitch through Central America (1998)
A lack of capital and technology also helps to explain why natural hazards often have a more devastating impact onLICs.
M03_GEOG_SB_IGCSE_6951_CH03.indd 75 11/8/10 16:31:33

76
Ch
apte
r 3:
Haz
ardo
us e
nviro
nmen
ts
Reference has already been made in Part 3.3 to Hurricane Mitch which passed overCentralAmericainOctober1998.ItspathisshowninFigure3.16.Itwasthe most destructive tropical storm for 200 years. Mitch began as tropical depression on 21 October to the south of the Caribbean. A day later it became, first, a tropical storm and then a hurricane as wind speeds increased rapidly. By 26 October it had become a category 5 hurricane with speeds of over 250 km/h, moving west across the Caribbean.
Whilst meteorologists could track Mitch via satellite, they could not accurately predict which direction it might eventually take. Even had they known where it would make landfall, very little could be done to protect the area. Nor could people be evacuated in time easily. By 28 October, Mitch had started to move south-westtowardsHonduras(Figure3.16).Althoughwindspeedsinsidethehurricane were still high, they had started to fall. The main problem for Honduras and neighbouring Nicaragua and El Salvador was the relatively slow movement of the whole system. As a result of this, rainfall was intense and 180 cm fell in just three days.
The huge volume of water created widespread flooding, destroying buildings, roads,bridges,cropsandlive-stock.Italsocausedmanymudslideswhichclaimed a large number of victims. By the time Mitch turned north to Mexico, at least 10 000 people had lost their lives. Even then it had not finished as winds increased again before it reached Florida in the USA.
IntheendHurricaneMitchenteredtherecordbooks.Itwas:
● thesecondlongest-lastingcategory5hurricane(33hours)
● the third longest period of continuous high winds (15 hours)
● the fourth strongest hurricane on record (winds of 249 km/h)
● the fourth lowest air pressure every measured (905 mb).
Figure 3.17: Damage caused by mudslides
Check back to Table 3.12 on page 72 to remind you of the features of a Category 5 hurricane.
Look back at page 74 to remind you how meteorologists would have tracked Hurricane Mitch.
M03_GEOG_SB_IGCSE_6951_CH03.indd 76 11/8/10 16:31:35

77
Ch
apte
r 3:
Haz
ardo
us e
nviro
nmen
ts
Country Dead or missing Homeless or evacuated
Honduras 14 000 2 million homeless
Nicaragua 3000 0.75 million homeless
Costa Rica 7 3000 evacuated
El Salvador 400 50 000 homeless
Guatemala 200 80 000 evacuated
Belize 0 10 000 evacuated
Mexico 6 Unknown number evacuated
Table 3.2: The human impact of Hurricane Mitch
For most of the countries hit by Mitch, there was neither much warning nor anywhere to go for shelter. Two million people in Nicaragua were affected by Mitch (Table 3.2). Mudslides triggered by torrential rain destroyed villages, schools, health facilities and farms (Figure 3.17). The final death toll is thought tohavebeenabout20000–butmanybodieshaveneverbeenfound.InHonduras, even optimistic estimates think it will be at least 2015 before the country will have repaired all the damage caused by a disaster which made 2 million of its 5 million population homeless. The overall cost of damage caused by Mitch was an estimated $10 billion.
AfterMitchhitCentralAmerica,short-termemergency aid in the form of medicines, food, water and shelter came from governments and non−governmental organisations (NGOs) across the world. However, its effects are still being felt today by its peoples, economies and environments. MostofthecountriesinCentralAmericaarerelativelypoorLICs,witheconomies based primarily on farming. The money needed to repair the damage is simply not available within the region.
Longer term, much of the funding needed to rebuild homes and infrastructure has come from international aid, agencies or organisations like the World Bank. Much of this was organised via a new Central America Emergency Trust Fund andincludedmoneyforaroad-rebuildingprojectandrepairstoschoolsandclinics. Some of these projects also created jobs for local people.
TheimpactofnaturaldisasterslikeHurricaneMitchinLICsisfargreaterthaninHICs.Long-termrecoveryisoftendependentuponaidoutsideoftheregion affected. Some experts believe that Hurricane Mitch caused so much damage that it set back development in Honduras and Nicaragua by 30 years.
Case study: Hurricane Floyd hits the USA
Hurricane Floyd hit the east coast of the USA in September 1999. Heavy rain caused flooding across 13 states and led to the evacuation of 4 million people – a million from Florida alone. Over 70 people were killed, the highest death toll in the USA from a hurricane since 1972. The final bill for damage was estimated at $6 billion.
Floyd started life on 2 September 1999 as a tropical wave off the West African coast. Five days later it had become a tropical depression and was 1500 km east of the Caribbean (Figure 3.18). A day later it had become a tropical storm.
Why has it taken the Central American countries so long to fully recover from the damage caused by Hurricane Mitch?
M03_GEOG_SB_IGCSE_6951_CH03.indd 77 11/8/10 16:31:35

78
Ch
apte
r 3:
Haz
ardo
us e
nviro
nmen
ts
Bythetimeitwas400kmfromtheLeewardIslands,ithadbeenupgradedtohurricanestatus.Asitturnednorth-west,thewindsstartedtodrop.Turningwest once more, it quickly gained strength until winds reached 230 km/h and pressure dropped to 921 mbs (the air pressure of hurricanes is measured in millibars – mbs) . Floyd was now a category 4 hurricane, causing widespread damage to the Bahamas as it passed through on 13–14 September.
Still uncertain as to where along the USA coast Floyd would make landfall, the south-easternstatesbegantoevacuatecoastalresidentsinland–DisneyWorldin Florida was shut down for the first time ever. However, Floyd started to movenorthuptheAtlanticcoastline,missingFlorida.IthitlandinNorthCarolina on 16 September. Wind speeds had dropped as Floyd became a category 2 hurricane. However, it was the rain which did most of the damage, partly because Floyd was a very wide hurricane. Between 16 and 17 September almost 50 cm of rain fell on ground which was still saturated by heavy rain from Hurricane Dennis two weeks earlier.
Storm surges along the coast, up to 3 m high, and exceptionally heavy rainfall caused extensive flooding across 13 states. All were declared major disaster areas, with North Carolina the worst hit. Rivers peaked at over 7 m above normal levels, 51 people were drowned and 7000 homes were completely destroyed. Tens of thousands of homes were damaged and 10 000 inhabitants forced into temporary accommodation. Roads were destroyed and damaged and hundreds of thousands of cattle, pigs and poultry were drowned. Electricity supplies were badly affected.
Despite extensive damage to property and land, the quality and timing of early warning systems and subsequent organised evacuation saved many lives. Nationalagenciesmonitorandtrackhurricanesviaplanesandsatellites.Ifastorm is approaching, a ‘Hurricane Watch’ is announced 36 hours ahead. A ‘Hurricane Warning’ is issued 24 hours before expected arrival, usually leading to evacuation orders.
Althoughittookmanymonthsbeforeeveryonewasre-housedanddamagerepaired, over $2 billion of government aid was made available by the US
Figure 3.18: The track taken by Hurricane Floyd
Check back to page 72 for more information on storm surges.
M03_GEOG_SB_IGCSE_6951_CH03.indd 78 11/8/10 16:31:36

79
Ch
apte
r 3:
Haz
ardo
us e
nviro
nmen
ts
3.5 Reasons for living in high-risk areasHistory tells us where in the world specific types of natural hazard are likely to occur. We have a fairly good idea of where the high-risk areas are. Figures 3.4 (page 67) and 3.9 (page 71) show the global distributions of two natural hazards (earthquakes and tropical storms) that cause the greatest number of deaths and the largest amount of damage. Compare those maps with the map showing the global distribution of major cities and therefore areas with high population densities (Figure 3.20). What we find may be quite surprising. Many of those cities and areas of high population density are located within the risk areas of earthquakes and tropical storms. Why do so many people continue to live and work in what are clearly hazardous areas?
There are a number of possible explanations.
● A lack of education and information may mean that residents are unaware of the real risks, particularly if the hazards occur only infrequently. This can be the case particularly in poor undeveloped areas
● People may be aware of the risks but decide to live in the area anyway. Perhaps the area offers some tempting benefits (see below)
● It may be that people are unable to move away from hazardous areas, owing to a lack of money or they are concerned about not being able to find a job elsewhere
Congress.Individualstates,insurancecompaniesandbusinessfundingalsohelped recovery. With sophisticated warning systems in place and the ready availability of emergency funds, the impact of tropical storms in a wealthy HICliketheUSAwillalmostalwaysbefarlessdestructivethaninpoorerLICs.
Figure 3.19: The evacuation of almost 4 million people under way
Ithasbeenestimatedthatbetween2000and 2010 close to 1 million people were killed by earthquakes. This is not surprising because there are billions of people living in the world’s earthquake zones.
Compare Figure 3.4 (page 67) with Figure 3.20 (page 80).
Why were most people evacuated by road rather than by air or sea?
M03_GEOG_SB_IGCSE_6951_CH03.indd 79 11/8/10 16:31:37

80
Ch
apte
r 3:
Haz
ardo
us e
nviro
nmen
ts
● Human nature is such that many people are optimists and think that they will never be a natural disaster victim. Alternatively they may be resigned to their fate – if they are to be victims, there is nothing they can do about it
● Perhaps the biggest factor is that the areas of high population density have gradually grown up over many centuries. As a result, they have a sort of momentum which keeps them going no matter how many hazards occur. So for millions of people, these high-risk areas are home and as a result have a number of attractions. For example, this is where their family has lived for generations. This is where many of their relatives and friends are living today. This is where they work. This is where, despite the hazards, they feel comfortable
● The cities in these high-risk areas represent centuries of investment − of money and human effort. No human society is rich enough that it can afford to throw away all this investment and abandon these cities.
Unlike earthquakes and tropical storms which are probably the most vicious and costly natural hazards, volcanoes do offer some benefits:
● minerals – volcanoes bring valuable mineral resources to the surface. These include diamonds, gold and copper
● fertile soils – volcanic ash often contains minerals that enrich the soil. Fine dust is quickly mixed into the soil like an artificial fertiliser
● geothermal energy – water running through the Earth’s crust is heated by volcanic rock at or near a plate margin. This hot water emerges as hot springs and can be used to heat homes, factories and business premises
cities with populationsgreater than 5 million
Figure 3.20: Global distribution of major cities
Itiswrongtothinkthatallvolcanoesgiverise to fertile soils.
M03_GEOG_SB_IGCSE_6951_CH03.indd 80 11/8/10 16:31:38

81
Ch
apte
r 3:
Haz
ardo
us e
nviro
nmen
ts
● tourism – volcanoes are features that interest many people and do attract tourists. Mount Vesuvius in Sicily (Italy) is a classic example, drawing hundreds of thousands of tourists each year (Figure 3.21). The hot springs found in volcanic areas around the world also attract visitors.
Finally, you should note that dense populations are also found in the high-risk areas of other natural hazards. Obvious examples are those river valleys and delta areas that suffer from regular and severe flooding. For example, the Ganges, Brahmaputra and Meghna delta where some 90 million people live (see Part 1.8). Here, as with volcanoes, there are some benefits, such as fertile soils replenished by the regular flooding.
3.6 Managing natural hazardsWhat is meant by ‘managing’ natural hazards can be put in another and better way. It really means learning to live with natural hazards and knowing what’s best to do in times when the hazard is actively taking place. There are at least six major steps here (Figure 3.22):
● Risk assessment − determining the probability of a particular hazard happening and the scale of its possible damage
● Prediction – putting in place monitoring systems that might given warning about an imminent hazard
● Preparation (adjustment) – finding ways of reducing the possible death toll and the scale of damage of property. Educating people about the hazards of the areas in which they live and what to do in case of an emergency is important here
● Hazard event – the natural hazard that has been anticipated and planned for happens
● Recovery – first emergency aid and then repairing the damage
identify natural hazard threatsin particular location
risk assesment
prediction
preparation (adjustment)
HAZARD EVENT
recovery
appraisal
Figure 3.21: Mount Vesuvius crater: a tourist attraction
Figure 3.22: Steps for managing natural hazards
Why do you think tourists like to visit volcanoes?
M03_GEOG_SB_IGCSE_6951_CH03.indd 81 11/8/10 16:31:40

82
Ch
apte
r 3:
Haz
ardo
us e
nviro
nmen
ts
● Appraisal – an examination of what happened after the event with many questions to be asked and answered. Were there emergency plans ready to put into action? How effective were the preparations that had been made before the event? What should be done to make them better in future?
We have already looked at two case studies in Part 3.4 that illustrate the damage done by tropical storms, as well as the general management of those events. In this part of the chapter, we will consider another two case studies but of different hazards – an earthquake in an HIC and a volcanic eruption in a LIC. The focus will be more on management than damage.
00_00_J7649EdExcel Geography SBHL Studios
If your home doesn’t have hurricane shutters, cover your windows with half-inch-thick plywood.
Drill holes for screws 18 inches apart.
Remove outdoor antennas.
Only stay if your home has been properly protected from wind damage and flooding. If you evacuate your home, pack food and water, cooking utensils, toiletries, medicines, blankets, important papers, valuables, a rope, flashlight and radio.
If you live along the Atlantic Ocean or Gulf of Mexico coasts you should be prepared for hurricanes before they threaten. With common materials, you can easily protect your home from hurricane-force winds.
Bring in lawn furniture, outdoor cooking equipment, toys and garden tools that could become missiles during hurricane-force winds.
Store drinking water indoors in clean bathtubs or in jugs and bottles.
1
2
3
4
5
Preparing your home for a hurricane
12 inch
18 inches
Figure 3.23: A hurricane preparation leaflet distributed in the USA
Case study: Kobe earthquake, 1995
Early in the morning of Tuesday, 17 January 1995 the shock waves of a huge earthquake roared through the port city of Kobe in Japan. Measuring 7.2 on the Richter Scale, it was the worst earthquake to hit Japan for 50 years.
● 6432 people were killed.
● Over 100 000 buildings were destroyed.
● 300 000 people were made homeless.
● Rail links, bridges, the main expressways, docks and port area were badly damaged.
● The cost of the damage was estimated at $200 billion.
● Over 300 fires broke out destroying 7000 homes and responsible for 500 deaths devastating an area of 100 km2 in central Kobe.
Look at an atlas map of Japan and find the location of Kobe.
M03_GEOG_SB_IGCSE_6951_CH03.indd 82 11/8/10 16:31:40

83
Ch
apte
r 3:
Haz
ardo
us e
nviro
nmen
ts
TheepicentreoftheearthquakewasnearAwajiIsland.Here only buildings were destroyed (Figure 3.24). The greatest destruction was where most people lived – in the cities of Kobe, Akashi and Ashiya. The famous bullet train tracks, motorways and bridges were all badly damaged (Figure 3.25). Broken gas pipes and electricity linescausedfirestoragethroughoutthebuilt-upareas– especially among the many wooden houses.
The scale of the damage and the size of the death toll surprised many people. Japan experiences over 1000 earthquakes every year. Fortunately most are quite minor tremors, or occur deep underground or under the sea, and have little impact. However, the Japanese have long been very aware of the danger that major earthquakes bring. They take the earthquake threat very seriously. They have to in such a densely populated country. Their risk assessments are thorough. They spend a considerable amount of time, effort and money designing buildings and transport links to withstand earthquakes.
Japanese earthquake preparations also include holding regular earthquake drills in schools and places of work. Every year armed forces and emergency services are involvedinafull-scalepractice.Itisavitalpartofearthquake preparation that everyone should know what to do in such an emergency. The response time is particularly critical in order to rescue trapped and injured people.
No one would doubt that the Japanese are well prepared to face the earthquake hazard. The problem with all earthquakes is not knowing where and when exactly they willoccur.ItisgenerallyagreedthattheKobeearthquakewas well ‘managed’, but what lessons were learnt? Were there any things that might have been done before the event that would have reduced the death toll and damage?
The worst damage of the earthquake occurred in the old parts of Kobe where many of the buildings were erected beforemodernanti-earthquakebuildingregulationscame into effect. Lessons were learnt about the construction of raised expressways (Figure 3.25). Many lengths were badly damaged. The tracks of the bullet train were designed to be able to withstand earthquakes. However, these were broken in no less than nine places. Overall though, it was felt that the emergency arrangements worked quite well.
Kobe
epicentre
Osaka Bay
Awaji
train stationdestroyed
500 m sectionof motorwaytoppled over
motorwaybroken up
bridgecollapsed
bullet train tracksbroken and fallen
Osaka
Ashiya
0 10 km
Key
major fires and collapsed buildings
other major damage
railway
bullet train track
edge of tectonic plates (inset map)
Island
N
buildingsdestroyed
Akashi
Sea ofJapan
Paci
fic
Oce
an
CHINA
RUSSIA
JA
PA
N
Pacificplate
Kobearea
Philippineplate
Eurasianplate
Figure 3.24: Cause and effects of the Kobe earthquake
Figure 3.25: Some of the earthquake destruction
M03_GEOG_SB_IGCSE_6951_CH03.indd 83 11/8/10 16:31:43
84
Ch
apte
r 3:
Haz
ardo
us e
nviro
nmen
ts
Case study: The eruption of Mount Pinatubo
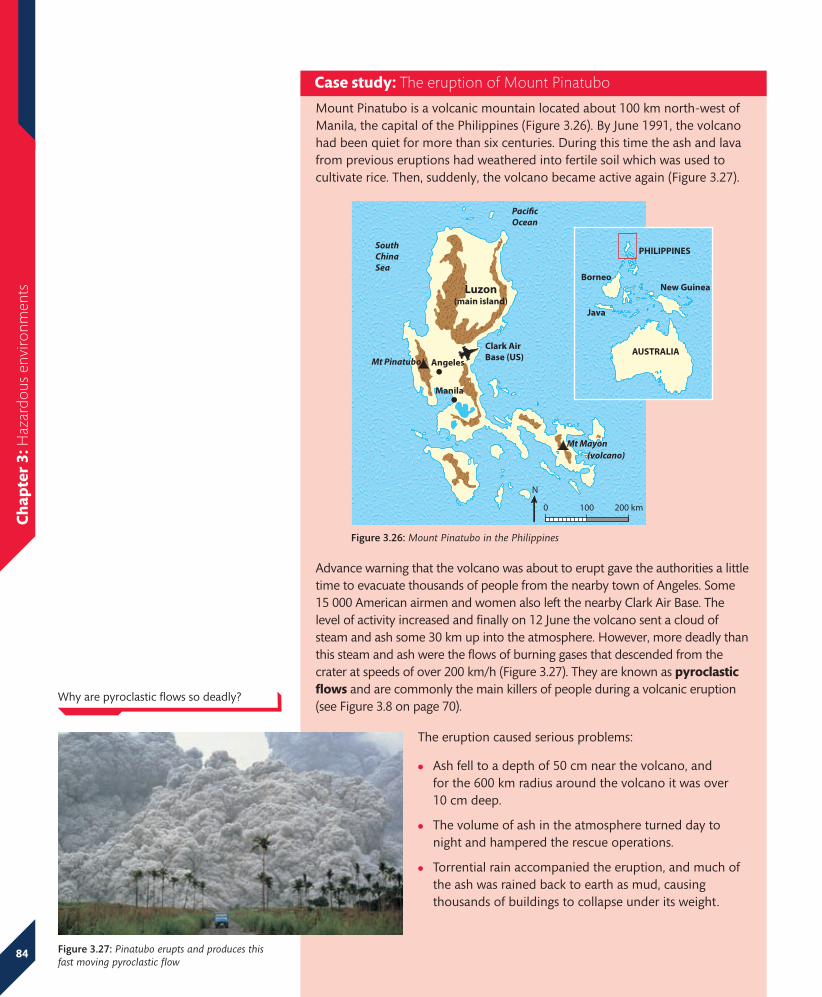
MountPinatuboisavolcanicmountainlocatedabout100kmnorth-westofManila, the capital of the Philippines (Figure 3.26). By June 1991, the volcano had been quiet for more than six centuries. During this time the ash and lava from previous eruptions had weathered into fertile soil which was used to cultivate rice. Then, suddenly, the volcano became active again (Figure 3.27).
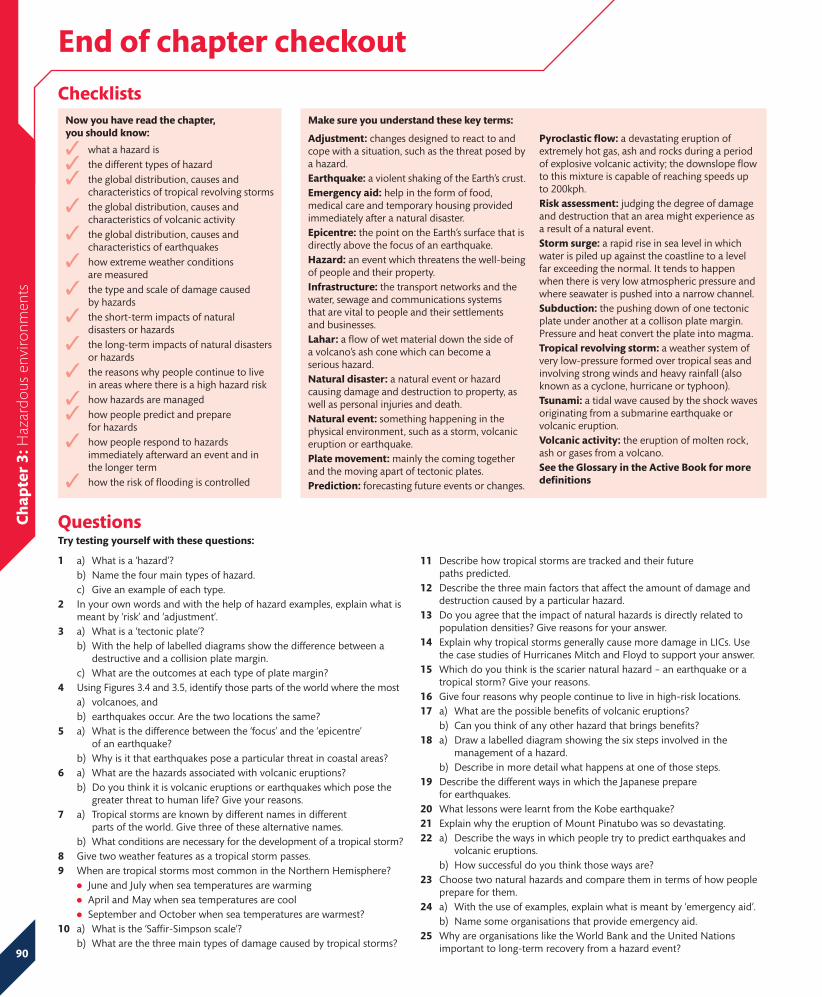
Advance warning that the volcano was about to erupt gave the authorities a little time to evacuate thousands of people from the nearby town of Angeles. Some 15 000 American airmen and women also left the nearby Clark Air Base. The level of activity increased and finally on 12 June the volcano sent a cloud of steam and ash some 30 km up into the atmosphere. However, more deadly than this steam and ash were the flows of burning gases that descended from the crater at speeds of over 200 km/h (Figure 3.27). They are known as pyroclastic flows and are commonly the main killers of people during a volcanic eruption (see Figure 3.8 on page 70).
The eruption caused serious problems:
● Ash fell to a depth of 50 cm near the volcano, and for the 600 km radius around the volcano it was over 10 cm deep.
● The volume of ash in the atmosphere turned day to night and hampered the rescue operations.
● Torrential rain accompanied the eruption, and much of the ash was rained back to earth as mud, causing thousands of buildings to collapse under its weight.
Angeles
Clark AirBase (US)
Manila
Luzon(main island)
200 km1000
Mt Mayon
Mt Pinatubo
PacificOcean
SouthChinaSea
(volcano)
N
PHILIPPINES
AUSTRALIA
New GuineaBorneo
Java
Figure 3.26: Mount Pinatubo in the Philippines
Figure 3.27: Pinatubo erupts and produces this fast moving pyroclastic flow
Why are pyroclastic flows so deadly?
M03_GEOG_SB_IGCSE_6951_CH03.indd 84 11/8/10 16:31:45

85
Ch
apte
r 3:
Haz
ardo
us e
nviro
nmen
tsThese two case studies show that there are ‘two worlds’ when it comes to natural disasters. The need for adequate preparation in areas where there are hazards was underlined in 2010 with two severe earthquakes. The one in Haiti measured 7.0 on the Richter scale and hit the capital city of Port au Prince. It killed around 250 000 people. The second one was well over 8 on the Richter scale and reckoned to one of the biggest ever recorded. It hit the well-populated central area of Chile and killed up to 1000 people. The casualty difference was partly explained by the fact that Chile had used its previous experience of earthquakes to be better prepared for the one in 2010.
● Power supplies were cut and roads and bridges were left unusable, as was the water supply which was quickly contaminated.
● Some 350 people were killed, mostly by pyroclastic flows.
However, the trail of destruction did not end there. When a volcano erupts, much cinder, ash and lava falls on the slopes around the crater. The lava solidifies, and the cinder and ash remain in a loose and unstable condition on the upper slopes. This is what happened after the 1991 eruption. Some years later, after people had returned to their former homes, heavy rain washed this loose material down the volcano sides. This occurred after typhoons hit the Philippines in 1993 and 1995. The local people were inundated by mud avalanches known as lahars.InSeptember1995,65000peoplewereforcedto flee from their homes. One lahar was nearly 3 m high. Bacolor, a town of 20 000 people, was turned into a wasteland by mud and ash. Helicopters had to be called in to rescue people trapped by the lahars (Figure 3.28).
The effects of the 1991 eruption were thus felt long after the volcano became dormant again. Thousands of people found themselves living in refugee camps for the second time in four years. Malaria and diarrhoea quickly spread in those camps. The cost to the Philippines was immense. Crops, roads and railways, business and personal property were destroyed, amounting to over $450 million.
ThePhilippinesisaLICandhadlittlemoneytospendonrebuilding the part of Luzon devastated by the eruption. As a result of reviewing the hazard event, the authorities of Central Luzon decided to focus on:
● protecting against further lahars and flash flood damage by building dykes and dams
● establishing new work for the farmers and other workers well away from the danger area
● creating new towns and villages away from the disaster area.
The great cost of these adjustments could not be borne by the people of Luzon alone. The area benefited from two types of international aid:
● emergency aid after both the eruption and the lahars
● development aid to assist with the three objectives listed above.
Figure 3.28: Filipinos flee the lahar, September, 1995
Research the 2010 Haiti and Central Chile earthquakes to compare, in more detail, the damage they caused.
Which is the correct description of a lahar:
• atypeofrivererosion
• aformofmassmovement
• atypeofvolcaniceruption?
M03_GEOG_SB_IGCSE_6951_CH03.indd 85 11/8/10 16:31:47

86
Ch
apte
r 3:
Haz
ardo
us e
nviro
nmen
ts
3.7 Predicting and preparing for hazards
Predict hazards
Prediction is a key activity when it comes to preparing to cope with (manage) natural hazards (see Figure 3.22 on page 81). It sounds a simple task, but in reality it still lies virtually impossible. We know where earthquakes are most likely to occur. However, those plate margins occupy a large area of the world. We have little idea of where exactly along them the next earthquake is going to take place. Volcanic eruptions are a little easier. We know where most of the world’s active volcanoes are located. However, we do not really know which one of them is likely to become the next major volcanic disaster. As for tropical storms, we know where they are most likely to occur and at what time of the year. Once they have been detected, they can, as we saw in Part 3.4, be tracked and their likely future course plotted.
Let us look a little more closely at predicting the two tectonic hazards. For tropical storms, look back at Part 3.3.
Volcanic eruptions
We think we know where most of the world’s active volcanoes are located (see Figure 3.5 on page 68). However, the problem here is that some volcanoes may erupt only after hundreds or thousands of years of being quiet (dormant). So it is very difficult to predict eruptions. However, sometimes there are warning signs. Near the time of an eruption, the magma beneath the volcano comes close to the surface. This will cause:
● the escape of gases, particularly sulphur dioxide, which can be monitored with special equipment
● an increase in the number of small earthquakes in the locality which can be measured with special equipment
● a swelling of the sides of the volcano.
The problem is that monitoring equipment is very expensive and could be in place for generations without detecting any signs. Perhaps the best way is for people living near volcanoes to keep a regular watch for any changes which may possibly indicate a coming eruption.
Earthquakes
Scientists know where earthquakes will strike – along the active plate margins (see Figure 3.4 on page 67). They find it much more difficult to say when they will happen. Before some earthquakes, the land may be seen to rise or tilt. Sometimes the water level in wells is seen to fall. If local people notice these changes they can alert everyone to reach places of safety, well away from buildings.
If these changes do not occur, or are not seen, there is very little chance of predicting an earthquake. There have been recent improvements in detecting changes in electrical signals and in registering radioactive emissions. In order to register such changes many more scientific stations or satellites capable of recording these indicators are needed.
Rank the three hazards in terms of human ability to predict them.
Although hazard prediction may be a science, it is still very much in its infancy. Those who benefit most are probably people who live in the hazardous environmentsofHICs.Itistheseareasthat have the technology and can afford the equipment that is needed.
M03_GEOG_SB_IGCSE_6951_CH03.indd 86 11/8/10 16:31:47

87
Ch
apte
r 3:
Haz
ardo
us e
nviro
nmen
ts
Preparing for hazards
If scientists were able to predict when earthquakes are shortly to happen, many lives would be saved. Even if earthquakes could be predicted accurately, they would still damage buildings. Recent earthquakes in different parts of the world, together with laboratory testing, have allowed engineers and architects to develop buildings that can cope with all but the most powerful earthquakes.
Figure 3.29 shows how different building materials respond to shock waves:
● wooden houses may burn in the aftermath of an earthquake, as they did in Kobe
● bricks fall out of buildings, so they are not good building materials in earthquake zones
● concrete is much better as long as it is reinforced by strong, flexible steel bars
● high-rise buildings with flexible steel frames do survive, but falling glass and bricks can cause injury and death.
Earthquakes may be the most difficult hazard to predict, but at least they are a hazard that does allow some adjustment or preparation.
With volcanoes, a certain amount can be done on the day to control lava flows by erecting barriers and cooling lava fronts with water. An obvious adjustment is to ensure that all buildings have sloping roofs to prevent the accumulation of ash. With tropical storms, it is important that walls are built to protect coastal areas against storm surges. Buildings constructed of concrete reinforced by steel bars are most likely to withstand the very strong winds. Cyclone shelters built in this way are increasingly being provided in LICs.
With two of the hazards – volcanoes and tropical storms – putting in place early warning systems gives people a chance to make sure they are ready to do what is necessary. With all hazards, education plays an important role in making people aware of emergency procedures – what to do during the actual event and in the immediate aftermath when panic and chaos often prevail.
3.8 Responding to hazardsHazard response works on two time scales. There is the matter of what is done immediately after a natural hazard has struck – the emergency response. Later, there is a review response in which the whole natural hazard event is looked at. What happened this time? What needs to be done to restore the disaster area? What needs to be done so that next time the damage is less and death toll lower?
Figure 3.29: Building to survive earthquakes
What advantages do old wooden houses have in earthquake situations? What is their downside?
M03_GEOG_SB_IGCSE_6951_CH03.indd 87 11/8/10 16:31:49

88
Ch
apte
r 3:
Haz
ardo
us e
nviro
nmen
ts
Figure 3.30 shows the sequence of events immediately following a hazard. First of all, it is important that emergency services are able to identify quickly the worst hit areas and to access those areas. Time is critical if injured and trapped people are to be rescued. Different types of emergency services will be involved. There will be teams specialising in:
● releasing people and bodies trapped in collapsed buildings (Figure 3.31)
● using lifting gear and diggers to clear away rubble
● restoring basic services such as water, sewage, gas, electricity and communications
● providing medical help and counselling victims
● organising the distribution of emergency rations of food, water and clothing
● providing transport for emergency supplies – this is often done by the armed forces.
The important thing here is that all these services and others are well coordinated. This is often where emergency relief breaks down. If the disaster is a major one, it is likely to attract relief from international organisations, such as UN agencies, and voluntary organisations such as Oxfam and the Red Cross. A lack of coordination was one of the criticisms made following the Haiti earthquake (2010). However, the situation there was made more difficult by the damage done to the main airport and the seaport, by a weak government and by the great poverty of the people affected.
After the emergency has been dealt with, the next stage of recovery (see Figure 3.22 on page 81) involves deciding what needs to be done to restore the disaster area back to normal – if it is decided that that is the right thing to do (Figure 3.32). It is possible that the area is believed to be too high risk and that it should be abandoned. This is where organisations such as the World Bank can play an important part in the recovery phase providing loans to rebuild infrastructure.
hazardevent
disruption
disaster
pre-hazard rescueand
relief
temporaryimprovement
(days to weeks)
permanentreconstruction
(weeks to years)
reaction and time period
recovery
returningto normality
normal
leve
l of q
ualit
y of
life
,an
d ec
onom
ic a
ctiv
ity
low
Figure 3.30 Sequence of events following a hazard
Explain how and why each of the following would hinder emergency aid:
• airportandseaportdamage
• weakgovernment
• widespreadpoverty
• littlecoordination.
Inyourownwords,brieflydefinetheseterms that appear in Figure 3.30:
• disruption
• disaster
• recovery.
M03_GEOG_SB_IGCSE_6951_CH03.indd 88 11/8/10 16:31:50

89
Ch
apte
r 3:
Haz
ardo
us e
nviro
nmen
ts
The final stage is appraisal (see Figure 3.22 on page 81). This is the ‘inquest’, looking back at the disaster and first assessing how well or otherwise the emergency operations worked. Then the appraisal should consider whether there is anything more that could be done to reduce the impact if a similar event were to occur again. Attention will focus on the adjustments, by raising a range of questions. Can buildings in the area be made more hazard proof? Should areas be given greater protection, perhaps in the form of strengthened sea walls? Should settlements be relocated? Should the layout of urban areas be changed? This is where the United Nations International Strategy for Disaster Reduction (UNISDR) can help. It is able offer sound technical advice.
The human spirit is rather optimistic when it comes to natural hazards. First, there is often widespread feeling that the ‘lightning will never strike here’. Secondly, there is the widespread belief that ‘lightning never strikes the same place twice’. Without that optimism, people would find it difficult to live with the brutal truth that natural hazards can:
● strike at any time
● occur in virtually any place
● be more devastating than the one before.
Surprise is one of the nastier aspects of natural hazards!
Figure 3.31: Emergency services in operation Figure 3.32: A restored disaster area that was badly hit by the 2004 tsunami
Iftherewasnosuchoptimism,doyouthink people would still live in hazardous environments? Give your reasons.
M03_GEOG_SB_IGCSE_6951_CH03.indd 89 11/8/10 16:31:53
90
Ch
apte
r 3:
Haz
ardo
us e
nviro
nmen
ts
End of chapter checkout
Now you have read the chapter, you should know:
what a hazard is ✓the different types of hazard✓the global distribution, causes and ✓characteristics of tropical revolving stormsthe global distribution, causes and ✓characteristics of volcanic activitythe global distribution, causes and ✓characteristics of earthquakeshow extreme weather conditions ✓are measuredthe type and scale of damage caused ✓by hazardstheshort-termimpactsofnatural✓disasters or hazardsthelong-termimpactsofnaturaldisasters✓or hazardsthe reasons why people continue to live ✓in areas where there is a high hazard riskhow hazards are managed✓how people predict and prepare ✓for hazardshow people respond to hazards ✓immediately afterward an event and in the longer termhow the risk of flooding is controlled✓
Make sure you understand these key terms:
Adjustment: changes designed to react to and cope with a situation, such as the threat posed by a hazard.Earthquake: a violent shaking of the Earth’s crust.Emergency aid: help in the form of food, medical care and temporary housing provided immediately after a natural disaster.Epicentre: the point on the Earth’s surface that is directly above the focus of an earthquake.Hazard:aneventwhichthreatensthewell-beingof people and their property.Infrastructure: the transport networks and the water, sewage and communications systems that are vital to people and their settlements and businesses.Lahar: a flow of wet material down the side of a volcano’s ash cone which can become a serious hazard.Natural disaster: a natural event or hazard causing damage and destruction to property, as well as personal injuries and death. Natural event: something happening in the physical environment, such as a storm, volcanic eruption or earthquake.Plate movement: mainly the coming together and the moving apart of tectonic plates.Prediction: forecasting future events or changes.
Pyroclastic flow: a devastating eruption of extremely hot gas, ash and rocks during a period of explosive volcanic activity; the downslope flow to this mixture is capable of reaching speeds up to 200kph.Risk assessment: judging the degree of damage and destruction that an area might experience as a result of a natural event.Storm surge: a rapid rise in sea level in which water is piled up against the coastline to a level farexceedingthenormal.Ittendstohappenwhen there is very low atmospheric pressure and where seawater is pushed into a narrow channel.Subduction: the pushing down of one tectonic plate under another at a collison plate margin. Pressure and heat convert the plate into magma.Tropical revolving storm: a weather system of verylow-pressureformedovertropicalseasandinvolving strong winds and heavy rainfall (also known as a cyclone, hurricane or typhoon).Tsunami: a tidal wave caused by the shock waves originating from a submarine earthquake or volcanic eruption.Volcanic activity: the eruption of molten rock, ash or gases from a volcano.See the Glossary in the Active Book for more definitions
1 a) What is a ‘hazard’? b) Name the four main types of hazard. c) Give an example of each type.2 Inyourownwordsandwiththehelpofhazardexamples,explainwhatis
meant by ‘risk’ and ‘adjustment’.3 a) What is a ‘tectonic plate’? b) With the help of labelled diagrams show the difference between a
destructive and a collision plate margin. c) What are the outcomes at each type of plate margin?4 Using Figures 3.4 and 3.5, identify those parts of the world where the most a) volcanoes, and b) earthquakes occur. Are the two locations the same?5 a) What is the difference between the ‘focus’ and the ‘epicentre’
of an earthquake? b) Why is it that earthquakes pose a particular threat in coastal areas? 6 a) What are the hazards associated with volcanic eruptions? b) Do you think it is volcanic eruptions or earthquakes which pose the
greater threat to human life? Give your reasons.7 a) Tropical storms are known by different names in different
parts of the world. Give three of these alternative names. b) What conditions are necessary for the development of a tropical storm?8 Give two weather features as a tropical storm passes.9 When are tropical storms most common in the Northern Hemisphere?
● June and July when sea temperatures are warming● April and May when sea temperatures are cool● September and October when sea temperatures are warmest?
10 a) Whatisthe‘Saffir-Simpsonscale’? b) What are the three main types of damage caused by tropical storms?
11 Describe how tropical storms are tracked and their future paths predicted.
12 Describe the three main factors that affect the amount of damage and destruction caused by a particular hazard.
13 Do you agree that the impact of natural hazards is directly related to population densities? Give reasons for your answer.
14 ExplainwhytropicalstormsgenerallycausemoredamageinLICs.Usethe case studies of Hurricanes Mitch and Floyd to support your answer.
15 Which do you think is the scarier natural hazard – an earthquake or a tropical storm? Give your reasons.
16 Givefourreasonswhypeoplecontinuetoliveinhigh-risklocations.17 a) What are the possible benefits of volcanic eruptions? b) Can you think of any other hazard that brings benefits?18 a) Draw a labelled diagram showing the six steps involved in the
management of a hazard. b) Describe in more detail what happens at one of those steps. 19 Describe the different ways in which the Japanese prepare
for earthquakes.20 What lessons were learnt from the Kobe earthquake?21 Explain why the eruption of Mount Pinatubo was so devastating.22 a) Describe the ways in which people try to predict earthquakes and
volcanic eruptions. b) How successful do you think those ways are?23 Choose two natural hazards and compare them in terms of how people
prepare for them.24 a) With the use of examples, explain what is meant by ‘emergency aid’. b) Name some organisations that provide emergency aid.25 Why are organisations like the World Bank and the United Nations
importanttolong-termrecoveryfromahazardevent?
Try testing yourself with these questions:
Checklists
Questions
M03_GEOG_SB_IGCSE_6951_CH03.indd 90 11/8/10 16:31:53