oxford research encyclopedia of natural hazard science
TRANSCRIPT

Heavy Rainfall and Flash Flooding
Page 1 of 42
PRINTED FROM the OXFORD RESEARCH ENCYCLOPEDIA, NATURAL HAZARD SCIENCE (oxfordre.com/naturalhazardscience). (c) Oxford University Press USA, 2018. All Rights Reserved. Personal use only; commercial use is strictly prohibited (for details see Privacy Policy and Legal Notice).
date: 13 December 2018
Summary and Keywords
Heavy precipitation, which in many contexts is welcomed because it provides the water necessary for agriculture and human use, in other situations is responsible for deadly and destructive flash flooding. Over the 30-year period from 1986 to 2015, floods were responsible for more fatalities in the United States than any other convective weather hazard (www.nws.noaa.gov/om/hazstats.shtml), and similar findings are true in other regions of the world. Although scientific understanding of the processes responsible for heavy rainfall continues to advance, there are still many challenges associated with predicting where, when, and how much precipitation will occur. Common ingredients are required for heavy rainfall to occur, but there are vastly different ways in which the atmosphere brings the ingredients together in different parts of the world. Heavy precipitation often occurs on very small spatial scales in association with deep convection (thunderstorms), factors that limit the ability of numerical models to represent or predict the location and intensity of rainfall. Furthermore, because flash floods are dependent not only on precipitation but also on the characteristics of the underlying land surface, there are fundamental difficulties in accurately representing these coupled processes. Areas of active current research on heavy rainfall and flash flooding include investigating the storm-scale atmospheric processes that promote extreme precipitation, analyzing the reasons that some rainfall predictions are very accurate while others fail, improving the understanding and prediction of the flooding response to heavy precipitation, and determining how heavy rainfall and floods have changed and may continue to change in a changing climate.
Keywords: precipitation, rainfall, flash floods, extreme weather, atmospheric convection, predictability, weather prediction, hydrology
Heavy Rainfall and Flash Flooding Russ S. SchumacherSubject: Floods, Convective Storms Online Publication Date: May 2017DOI: 10.1093/acrefore/9780199389407.013.132
Oxford Research Encyclopedia of Natural Hazard Science
Heavy Rainfall and Flash Flooding
Page 2 of 42
PRINTED FROM the OXFORD RESEARCH ENCYCLOPEDIA, NATURAL HAZARD SCIENCE (oxfordre.com/naturalhazardscience). (c) Oxford University Press USA, 2018. All Rights Reserved. Personal use only; commercial use is strictly prohibited (for details see Privacy Policy and Legal Notice).
date: 13 December 2018
IntroductionExtreme precipitation is a hazard in nearly all parts of the world, but the amount of rain that might be considered “extreme” varies widely. Similarly, the topography, characteristics of the land surface, and human changes to the landscape—all of which influence whether a flood occurs with a given amount of rain—are highly variable, even over a limited geographic region. Although many advances have been made in understanding both the meteorology and hydrology of flash floods, they remain very difficult to predict. In part, this stems from the fact that flash-flood-producing rainfall often occurs on small spatial scales (say, less than 100 km) and over relatively short periods of time (12 h or less), and, in general, the smaller the scale of motion, the less predictability there is for a phenomenon in the atmosphere. Hydrologic predictions are highly sensitive to rainfall predictions, and therefore the challenge is compounded. Nonetheless, greater understanding, improved numerical models, and enhanced computing power have made highly accurate predictions possible in at least some heavy-rainfall situations.
An assessment of the factors that produce heavy rainfall across atmospheric scales must consider the large-scale conditions that set the stage for extreme rainfall in different parts of the world, the mesoscale processes that are responsible for organizing the heavily raining storms, and the storm-scale processes that determine the production and efficiency of excessive rainfall. A full understanding of these factors will include insights obtained from observations and numerical models of the atmosphere, as well as some of the reasons that predictive skill remains limited for heavy rainfall, along with advances in understanding and prediction of the hydrologic and societal aspects of flash floods. Finally, many questions remain about whether heavy precipitation has changed, and will continue to change, in a changing climate, and some of the current research directions on this topic are summarized.
1
Heavy Rainfall and Flash Flooding
Page 3 of 42
PRINTED FROM the OXFORD RESEARCH ENCYCLOPEDIA, NATURAL HAZARD SCIENCE (oxfordre.com/naturalhazardscience). (c) Oxford University Press USA, 2018. All Rights Reserved. Personal use only; commercial use is strictly prohibited (for details see Privacy Policy and Legal Notice).
date: 13 December 2018
Previous Research and Current Understanding
History of Research on Heavy Precipitation and Flash Floods
Modern meteorological research on extreme precipitation and flash floods is closely tied to specific deadly and destructive events. In particular, several notable flash floods occurred in the late 1970s, which happened to be the time when mesoscale atmospheric observations (such as radars and satellites) and numerical models were becoming more readily available. Although the general conclusions of the analyses were somewhat limited because they represented single case studies, nonetheless they revealed important insights about the processes that can result in a devastating rainstorm and flood. In the United States, the extensively studied events included the Rapid City, South Dakota, flash flood of June 9–10, 1972 (Maddox, Hoxit, Chappell, & Caracena, 1978; Nair et al., 1997), the Big Thompson Canyon, Colorado, flood of July 31–August 1, 1976 (Caracena, Maddox, Hoxit, & Chappell, 1979; Maddox et al., 1978; Yoshizaki & Ogura, 1988), and the Johnstown, Pennsylvania, flood of July 19–20, 1977 (Bosart & Sanders, 1981; Hoxit et al., 1978; Zhang & Fritsch, 1986, 1987, 1988), among others. Contemporaneously, Miller (1978) conducted a thorough investigation of a heavy rainfall event over north London, United Kingdom, on August 14, 1975. The occurrence of the devastating flash floods within several years of one another led Maddox, Chappell, and Hoxit (1979) to conclude that, “During the 1970s flash floods have become the most significant natural disaster problem within the United States.”
Many other valuable case studies have also been conducted since then, with some notable studies (although far from a comprehensive list) including: Schwartz, Chappell, Togstad, and Zhong (1990), who studied the 1987 Minneapolis, Minnesota, flash flood; Petersen et al. (1999), on the 1997 Fort Collins, Colorado, flash flood; Pontrelli, Bryan, and Fritsch (1999) on the 1995 Madison County, Virginia, flash flood; Smith, Baeck, Zhang, and Doswell (2001) on flash-flood-producing supercells in Texas, Florida, Nebraska, and Pennsylvania; Schumacher and Johnson (2008) on the 2000 Union County, Missouri, flash flood; Moore, Neiman, Ralph, and Barthold (2012) on the 2010 Nashville, Tennessee, flash flood; Zhang and Zhang (2012) on the July 2003 event in east China; Rasmussen and Houze (2012) on the 2010 flash flood in Leh, Pakistan; and Gochis et al. (2015) on the Colorado floods of September 2013. The historic 1993 flooding in the Midwest United States was made up of numerous individual extreme rainfall events, which were analyzed by Junker, Schneider, and Fauver (1999).
One of the first efforts to synthesize the results of the many case studies into a more general understanding of heavy precipitation and flash flooding was the study by Maddox et al. (1979). They examined 151 reported flash floods over the 5-year period from 1973 to 1977 from across the United States. They categorized each event in terms of its
Heavy Rainfall and Flash Flooding
Page 4 of 42
PRINTED FROM the OXFORD RESEARCH ENCYCLOPEDIA, NATURAL HAZARD SCIENCE (oxfordre.com/naturalhazardscience). (c) Oxford University Press USA, 2018. All Rights Reserved. Personal use only; commercial use is strictly prohibited (for details see Privacy Policy and Legal Notice).
date: 13 December 2018
synoptic and mesoscale meteorological characteristics, but they found that several characteristics were common to nearly all of the cases they analyzed, regardless of the categorization:
• Heavy rains were produced by convective storms.
• Surface dewpoint temperatures were very high.
• Large moisture contents were present through a deep tropospheric layer.
• Vertical wind shear was weak to moderate through the cloud depth.
The quantitative values of “very high” surface dewpoints and “large moisture contents” varied for the different event types and regions studied by Maddox et al. (1979), which is discussed in greater detail in “SYNOPTIC AND MESOSCALE ENVIRONMENTS OF EXTREME RAIN EVENTS.”
Heavy Rainfall and Flash Flooding
Page 5 of 42
PRINTED FROM the OXFORD RESEARCH ENCYCLOPEDIA, NATURAL HAZARD SCIENCE (oxfordre.com/naturalhazardscience). (c) Oxford University Press USA, 2018. All Rights Reserved. Personal use only; commercial use is strictly prohibited (for details see Privacy Policy and Legal Notice).
date: 13 December 2018
The Ingredients for Heavy Precipitation
The characteristics originally presented by Maddox et al. (1979) were further distilled into an “ingredients-based methodology” for forecasting heavy precipitation and flash floods by Doswell, Brooks, and Maddox (1996). Ingredients-based methodologies, first proposed by Johns and Doswell (1992) in the context of severe weather, are intended to be applicable regardless of the geographic location or the particular methods being used to predict the phenomenon of interest, and to reflect the basic conditions that must be met for that phenomenon to occur. Although this ingredients-based thinking was designed with forecasters in mind (e.g., the Doswell et al. 1996 article resulted from a course on flash-flood forecasting for National Weather Service forecasters), it is equally useful as a grounding for research investigations. For heavy precipitation, the ingredients are summarized through a very simple equation for the rainfall accumulation. At any point on the earth: , where P is the total precipitation, R is the average rainfall rate, and D is the duration of the rainfall. Thus, for large precipitation totals, either the rainfall rate or the rain duration (or both) must be large, or, in other words, “the heaviest precipitation occurs where the rainfall rate is the highest for the longest time.”
Further, since precipitation results from lifting moist air to condensation, R= Ewq, where
E is the precipitation efficiency, w is the ascent rate in an updraft, and q is the mixing ratio of the air. This equation demonstrates that rapidly ascending air with large water vapor content (i.e., large vertical moisture flux) is necessary to produce a high rainfall rate. The rainfall rate can be limited by the precipitation efficiency, the percentage of water going into the storm or convective system that actually falls out as precipitation. Doswell et al. (1996) also point out that rainfall duration is related to system size and speed and the variations in rainfall intensity within a storm.
This ingredients-based methodology remains the standard for both understanding and predicting the factors necessary for heavy precipitation to occur. Yet, the difficulty lies in understanding or predicting where, when, and in what ways the atmosphere brings the necessary ingredients together. As noted by Doswell et al. (1996), “Flash flood event days often are not manifestly different from the nonevent days that preceded them. The difference between a rather nondescript day and a terrible flash flood situation may not be obvious even at the time of the morning soundings on the fateful day.” Several important studies have therefore focused on identifying the atmospheric conditions that are (and are not) responsible for bringing the necessary ingredients together in a particular location, and on improving predictions of those ingredients and conditions.
Synoptic and Mesoscale Environments of Extreme Rain Events
Maddox et al. (1979) summarized the synoptic and mesoscale conditions associated with extreme rainfall and flash flooding in the United States and categorized them into four types: “synoptic,” “frontal,” “mesohigh,” and “western.” The conditions in each of these
2
Heavy Rainfall and Flash Flooding
Page 6 of 42
PRINTED FROM the OXFORD RESEARCH ENCYCLOPEDIA, NATURAL HAZARD SCIENCE (oxfordre.com/naturalhazardscience). (c) Oxford University Press USA, 2018. All Rights Reserved. Personal use only; commercial use is strictly prohibited (for details see Privacy Policy and Legal Notice).
date: 13 December 2018
patterns are configured such that they bring together the ingredients for heavy rainfall and promote large rain rates, long-duration rainfall, or both. Maddox et al. (1979) constructed the categories somewhat subjectively, using limited data in comparison to the high-resolution satellite and radar observations and sophisticated gridded reanalyses of the early 21st century. Yet the categories and schematic diagrams, along with the refined versions presented by Chappell (1986), have proven to be highly insightful and are still regularly used by forecasters and are cited in scientific research. Although there have been a few flash-flood situations that are not well described by one of the four categories, the vast majority of extreme precipitation events in mid-latitude locations fall into one of these archetypes.
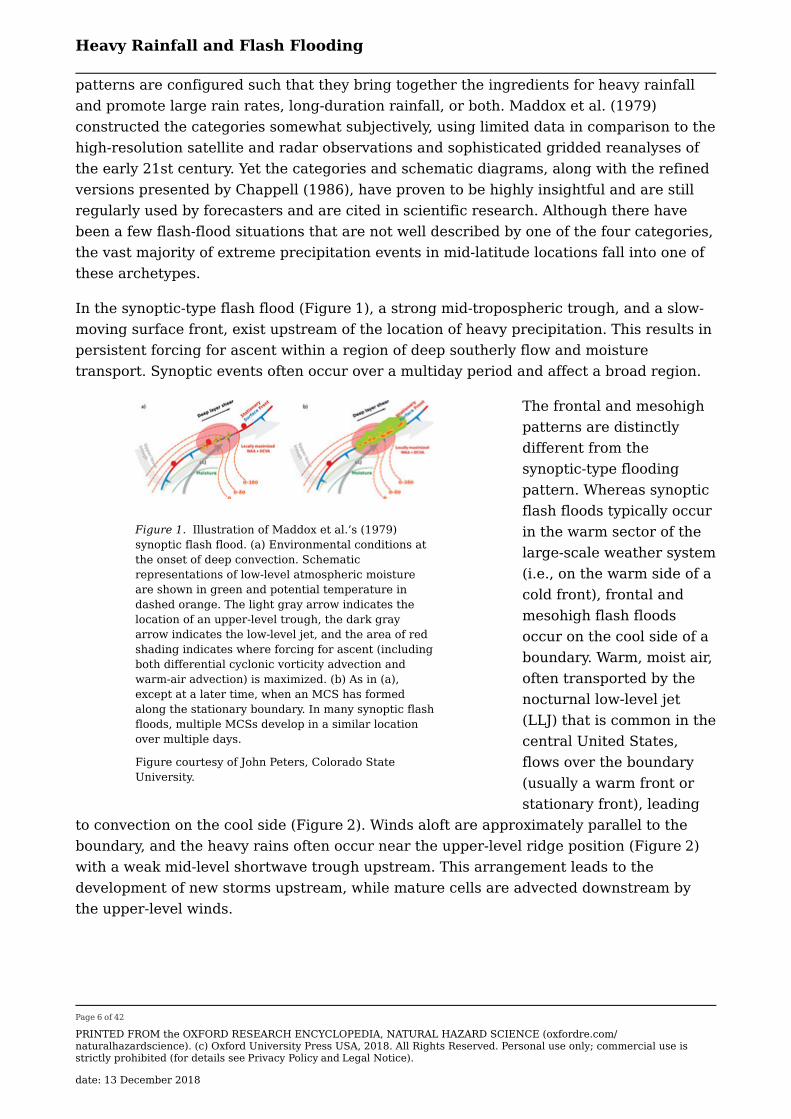
In the synoptic-type flash flood (Figure 1), a strong mid-tropospheric trough, and a slow-moving surface front, exist upstream of the location of heavy precipitation. This results in persistent forcing for ascent within a region of deep southerly flow and moisture transport. Synoptic events often occur over a multiday period and affect a broad region.
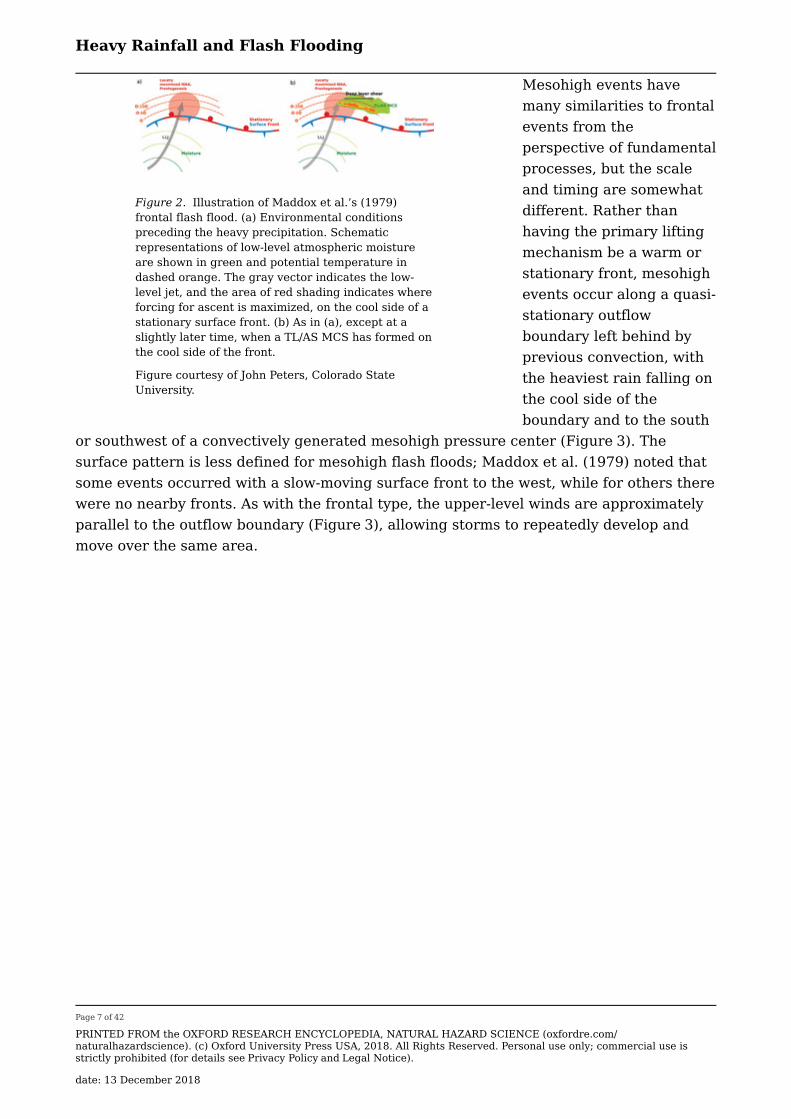
The frontal and mesohigh patterns are distinctly different from the synoptic-type flooding pattern. Whereas synoptic flash floods typically occur in the warm sector of the large-scale weather system (i.e., on the warm side of a cold front), frontal and mesohigh flash floods occur on the cool side of a boundary. Warm, moist air, often transported by the nocturnal low-level jet (LLJ) that is common in the central United States, flows over the boundary (usually a warm front or stationary front), leading
to convection on the cool side (Figure 2). Winds aloft are approximately parallel to the boundary, and the heavy rains often occur near the upper-level ridge position (Figure 2) with a weak mid-level shortwave trough upstream. This arrangement leads to the development of new storms upstream, while mature cells are advected downstream by the upper-level winds.
Figure 1. Illustration of Maddox et al.’s (1979) synoptic flash flood. (a) Environmental conditions at the onset of deep convection. Schematic representations of low-level atmospheric moisture are shown in green and potential temperature in dashed orange. The light gray arrow indicates the location of an upper-level trough, the dark gray arrow indicates the low-level jet, and the area of red shading indicates where forcing for ascent (including both differential cyclonic vorticity advection and warm-air advection) is maximized. (b) As in (a), except at a later time, when an MCS has formed along the stationary boundary. In many synoptic flashfloods, multiple MCSs develop in a similar location over multiple days.
Figure courtesy of John Peters, Colorado State University.
Heavy Rainfall and Flash Flooding
Page 7 of 42
PRINTED FROM the OXFORD RESEARCH ENCYCLOPEDIA, NATURAL HAZARD SCIENCE (oxfordre.com/naturalhazardscience). (c) Oxford University Press USA, 2018. All Rights Reserved. Personal use only; commercial use is strictly prohibited (for details see Privacy Policy and Legal Notice).
date: 13 December 2018
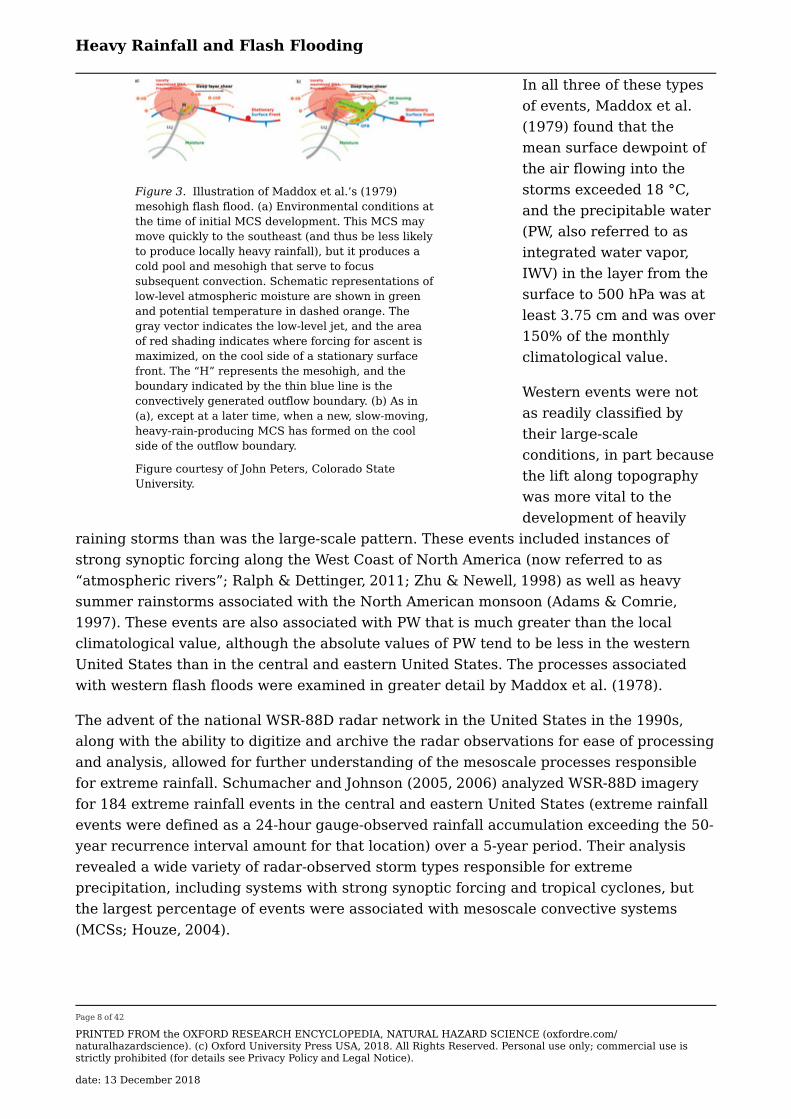
Mesohigh events have many similarities to frontal events from the perspective of fundamental processes, but the scale and timing are somewhat different. Rather than having the primary lifting mechanism be a warm or stationary front, mesohigh events occur along a quasi-stationary outflow boundary left behind by previous convection, with the heaviest rain falling on the cool side of the boundary and to the south
or southwest of a convectively generated mesohigh pressure center (Figure 3). The surface pattern is less defined for mesohigh flash floods; Maddox et al. (1979) noted that some events occurred with a slow-moving surface front to the west, while for others there were no nearby fronts. As with the frontal type, the upper-level winds are approximately parallel to the outflow boundary (Figure 3), allowing storms to repeatedly develop and move over the same area.
Figure 2. Illustration of Maddox et al.’s (1979) frontal flash flood. (a) Environmental conditions preceding the heavy precipitation. Schematic representations of low-level atmospheric moisture are shown in green and potential temperature in dashed orange. The gray vector indicates the low-level jet, and the area of red shading indicates where forcing for ascent is maximized, on the cool side of a stationary surface front. (b) As in (a), except at a slightly later time, when a TL/AS MCS has formed on the cool side of the front.
Figure courtesy of John Peters, Colorado State University.
Heavy Rainfall and Flash Flooding
Page 8 of 42
PRINTED FROM the OXFORD RESEARCH ENCYCLOPEDIA, NATURAL HAZARD SCIENCE (oxfordre.com/naturalhazardscience). (c) Oxford University Press USA, 2018. All Rights Reserved. Personal use only; commercial use is strictly prohibited (for details see Privacy Policy and Legal Notice).
date: 13 December 2018
In all three of these types of events, Maddox et al. (1979) found that the mean surface dewpoint of the air flowing into the storms exceeded 18 °C, and the precipitable water (PW, also referred to as integrated water vapor, IWV) in the layer from the surface to 500 hPa was at least 3.75 cm and was over 150% of the monthly climatological value.
Western events were not as readily classified by their large-scale conditions, in part because the lift along topography was more vital to the development of heavily
raining storms than was the large-scale pattern. These events included instances of strong synoptic forcing along the West Coast of North America (now referred to as “atmospheric rivers”; Ralph & Dettinger, 2011; Zhu & Newell, 1998) as well as heavy summer rainstorms associated with the North American monsoon (Adams & Comrie, 1997). These events are also associated with PW that is much greater than the local climatological value, although the absolute values of PW tend to be less in the western United States than in the central and eastern United States. The processes associated with western flash floods were examined in greater detail by Maddox et al. (1978).
The advent of the national WSR-88D radar network in the United States in the 1990s, along with the ability to digitize and archive the radar observations for ease of processing and analysis, allowed for further understanding of the mesoscale processes responsible for extreme rainfall. Schumacher and Johnson (2005, 2006) analyzed WSR-88D imagery for 184 extreme rainfall events in the central and eastern United States (extreme rainfall events were defined as a 24-hour gauge-observed rainfall accumulation exceeding the 50-year recurrence interval amount for that location) over a 5-year period. Their analysis revealed a wide variety of radar-observed storm types responsible for extreme precipitation, including systems with strong synoptic forcing and tropical cyclones, but the largest percentage of events were associated with mesoscale convective systems (MCSs; Houze, 2004).
Figure 3. Illustration of Maddox et al.’s (1979) mesohigh flash flood. (a) Environmental conditions at the time of initial MCS development. This MCS may move quickly to the southeast (and thus be less likely to produce locally heavy rainfall), but it produces a cold pool and mesohigh that serve to focus subsequent convection. Schematic representations of low-level atmospheric moisture are shown in green and potential temperature in dashed orange. The gray vector indicates the low-level jet, and the area of red shading indicates where forcing for ascent is maximized, on the cool side of a stationary surface front. The “H” represents the mesohigh, and the boundary indicated by the thin blue line is the convectively generated outflow boundary. (b) As in (a), except at a later time, when a new, slow-moving, heavy-rain-producing MCS has formed on the cool side of the outflow boundary.
Figure courtesy of John Peters, Colorado State University.
Heavy Rainfall and Flash Flooding
Page 9 of 42
PRINTED FROM the OXFORD RESEARCH ENCYCLOPEDIA, NATURAL HAZARD SCIENCE (oxfordre.com/naturalhazardscience). (c) Oxford University Press USA, 2018. All Rights Reserved. Personal use only; commercial use is strictly prohibited (for details see Privacy Policy and Legal Notice).
date: 13 December 2018
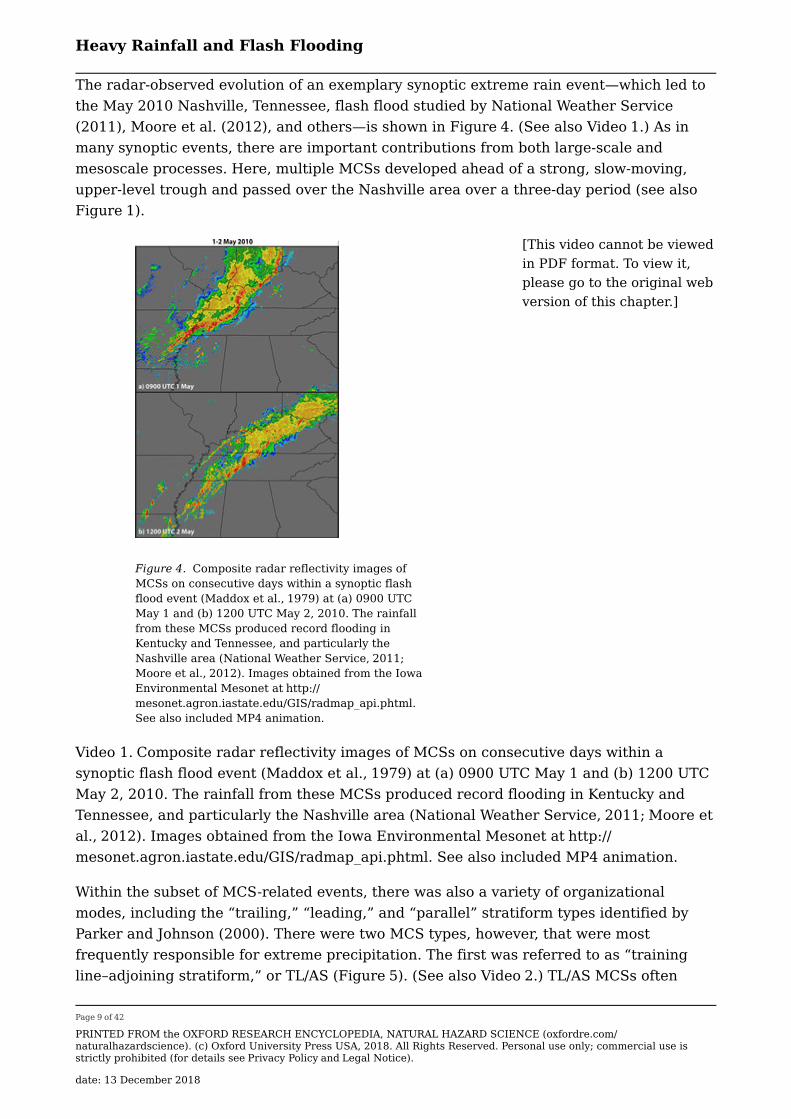
The radar-observed evolution of an exemplary synoptic extreme rain event—which led to the May 2010 Nashville, Tennessee, flash flood studied by National Weather Service (2011), Moore et al. (2012), and others—is shown in Figure 4. (See also Video 1.) As in many synoptic events, there are important contributions from both large-scale and mesoscale processes. Here, multiple MCSs developed ahead of a strong, slow-moving, upper-level trough and passed over the Nashville area over a three-day period (see also Figure 1).
[This video cannot be viewed in PDF format. To view it, please go to the original web version of this chapter.]
Video 1. Composite radar reflectivity images of MCSs on consecutive days within a synoptic flash flood event (Maddox et al., 1979) at (a) 0900 UTC May 1 and (b) 1200 UTC May 2, 2010. The rainfall from these MCSs produced record flooding in Kentucky and Tennessee, and particularly the Nashville area (National Weather Service, 2011; Moore et al., 2012). Images obtained from the Iowa Environmental Mesonet at http://mesonet.agron.iastate.edu/GIS/radmap_api.phtml. See also included MP4 animation.
Within the subset of MCS-related events, there was also a variety of organizational modes, including the “trailing,” “leading,” and “parallel” stratiform types identified by Parker and Johnson (2000). There were two MCS types, however, that were most frequently responsible for extreme precipitation. The first was referred to as “training line–adjoining stratiform,” or TL/AS (Figure 5). (See also Video 2.) TL/AS MCSs often
Figure 4. Composite radar reflectivity images of MCSs on consecutive days within a synoptic flash flood event (Maddox et al., 1979) at (a) 0900 UTC May 1 and (b) 1200 UTC May 2, 2010. The rainfall from these MCSs produced record flooding in Kentucky and Tennessee, and particularly the Nashville area (National Weather Service, 2011; Moore et al., 2012). Images obtained from the Iowa Environmental Mesonet at http://mesonet.agron.iastate.edu/GIS/radmap_api.phtml. See also included MP4 animation.
Heavy Rainfall and Flash Flooding
Page 10 of 42
PRINTED FROM the OXFORD RESEARCH ENCYCLOPEDIA, NATURAL HAZARD SCIENCE (oxfordre.com/naturalhazardscience). (c) Oxford University Press USA, 2018. All Rights Reserved. Personal use only; commercial use is strictly prohibited (for details see Privacy Policy and Legal Notice).
date: 13 December 2018
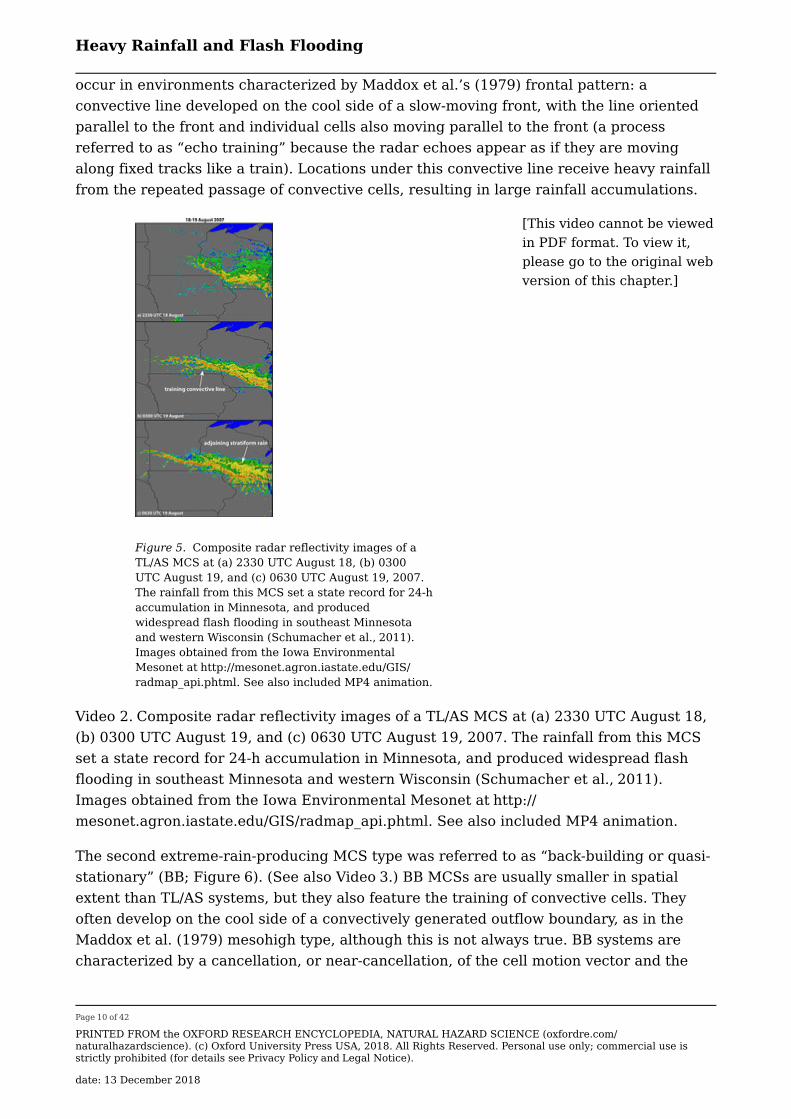
occur in environments characterized by Maddox et al.’s (1979) frontal pattern: a convective line developed on the cool side of a slow-moving front, with the line oriented parallel to the front and individual cells also moving parallel to the front (a process referred to as “echo training” because the radar echoes appear as if they are moving along fixed tracks like a train). Locations under this convective line receive heavy rainfall from the repeated passage of convective cells, resulting in large rainfall accumulations.
[This video cannot be viewed in PDF format. To view it, please go to the original web version of this chapter.]
Video 2. Composite radar reflectivity images of a TL/AS MCS at (a) 2330 UTC August 18, (b) 0300 UTC August 19, and (c) 0630 UTC August 19, 2007. The rainfall from this MCS set a state record for 24-h accumulation in Minnesota, and produced widespread flash flooding in southeast Minnesota and western Wisconsin (Schumacher et al., 2011). Images obtained from the Iowa Environmental Mesonet at http://mesonet.agron.iastate.edu/GIS/radmap_api.phtml. See also included MP4 animation.
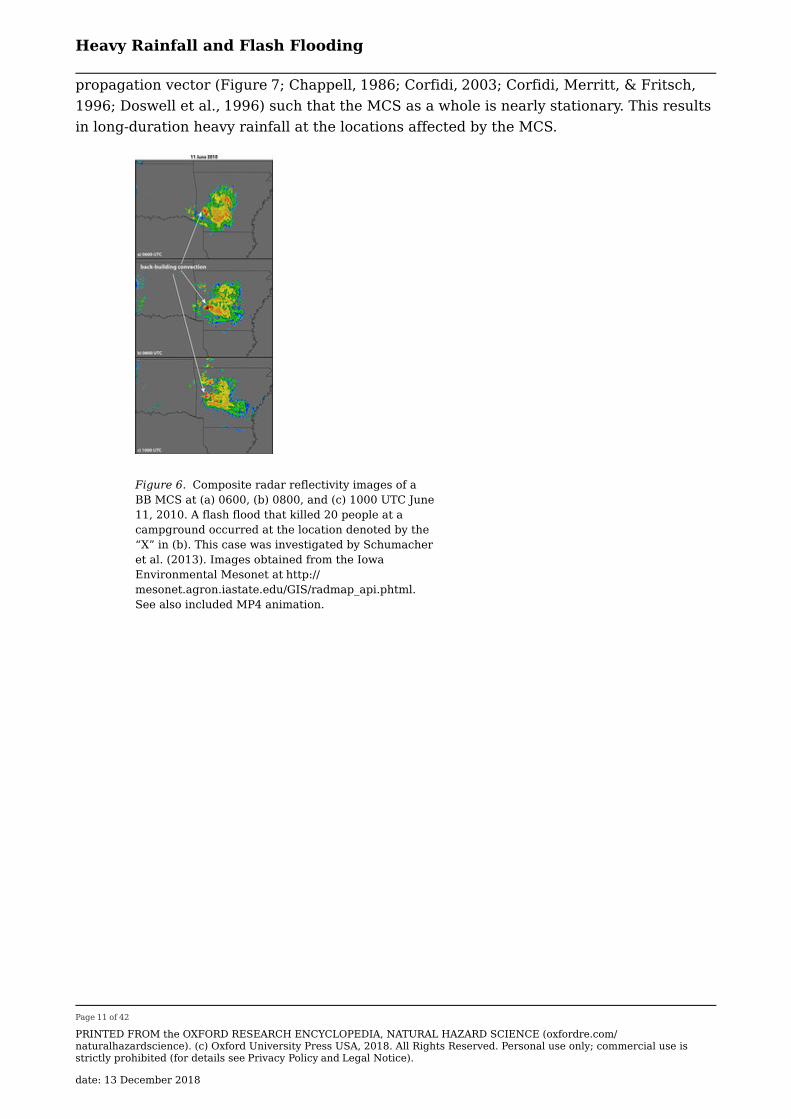
The second extreme-rain-producing MCS type was referred to as “back-building or quasi-stationary” (BB; Figure 6). (See also Video 3.) BB MCSs are usually smaller in spatial extent than TL/AS systems, but they also feature the training of convective cells. They often develop on the cool side of a convectively generated outflow boundary, as in the Maddox et al. (1979) mesohigh type, although this is not always true. BB systems are characterized by a cancellation, or near-cancellation, of the cell motion vector and the
Figure 5. Composite radar reflectivity images of a TL/AS MCS at (a) 2330 UTC August 18, (b) 0300 UTC August 19, and (c) 0630 UTC August 19, 2007. The rainfall from this MCS set a state record for 24-h accumulation in Minnesota, and produced widespread flash flooding in southeast Minnesota and western Wisconsin (Schumacher et al., 2011). Images obtained from the Iowa Environmental Mesonet at http://mesonet.agron.iastate.edu/GIS/radmap_api.phtml. See also included MP4 animation.
Heavy Rainfall and Flash Flooding
Page 11 of 42
PRINTED FROM the OXFORD RESEARCH ENCYCLOPEDIA, NATURAL HAZARD SCIENCE (oxfordre.com/naturalhazardscience). (c) Oxford University Press USA, 2018. All Rights Reserved. Personal use only; commercial use is strictly prohibited (for details see Privacy Policy and Legal Notice).
date: 13 December 2018
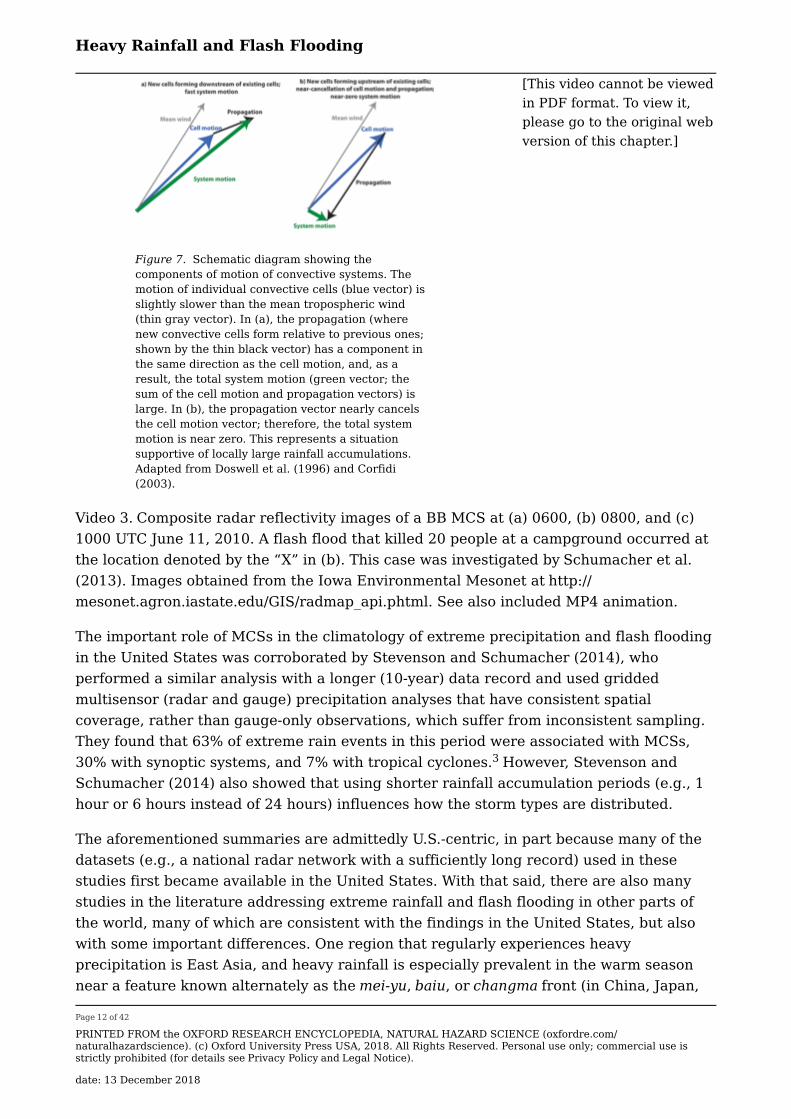
propagation vector (Figure 7; Chappell, 1986; Corfidi, 2003; Corfidi, Merritt, & Fritsch, 1996; Doswell et al., 1996) such that the MCS as a whole is nearly stationary. This results in long-duration heavy rainfall at the locations affected by the MCS.
Figure 6. Composite radar reflectivity images of a BB MCS at (a) 0600, (b) 0800, and (c) 1000 UTC June11, 2010. A flash flood that killed 20 people at a campground occurred at the location denoted by the “X” in (b). This case was investigated by Schumacher et al. (2013). Images obtained from the Iowa Environmental Mesonet at http://mesonet.agron.iastate.edu/GIS/radmap_api.phtml. See also included MP4 animation.
Heavy Rainfall and Flash Flooding
Page 12 of 42
PRINTED FROM the OXFORD RESEARCH ENCYCLOPEDIA, NATURAL HAZARD SCIENCE (oxfordre.com/naturalhazardscience). (c) Oxford University Press USA, 2018. All Rights Reserved. Personal use only; commercial use is strictly prohibited (for details see Privacy Policy and Legal Notice).
date: 13 December 2018
[This video cannot be viewed in PDF format. To view it, please go to the original web version of this chapter.]
Video 3. Composite radar reflectivity images of a BB MCS at (a) 0600, (b) 0800, and (c) 1000 UTC June 11, 2010. A flash flood that killed 20 people at a campground occurred at the location denoted by the “X” in (b). This case was investigated by Schumacher et al. (2013). Images obtained from the Iowa Environmental Mesonet at http://mesonet.agron.iastate.edu/GIS/radmap_api.phtml. See also included MP4 animation.
The important role of MCSs in the climatology of extreme precipitation and flash flooding in the United States was corroborated by Stevenson and Schumacher (2014), who performed a similar analysis with a longer (10-year) data record and used gridded multisensor (radar and gauge) precipitation analyses that have consistent spatial coverage, rather than gauge-only observations, which suffer from inconsistent sampling. They found that 63% of extreme rain events in this period were associated with MCSs, 30% with synoptic systems, and 7% with tropical cyclones. However, Stevenson and Schumacher (2014) also showed that using shorter rainfall accumulation periods (e.g., 1 hour or 6 hours instead of 24 hours) influences how the storm types are distributed.
The aforementioned summaries are admittedly U.S.-centric, in part because many of the datasets (e.g., a national radar network with a sufficiently long record) used in these studies first became available in the United States. With that said, there are also many studies in the literature addressing extreme rainfall and flash flooding in other parts of the world, many of which are consistent with the findings in the United States, but also with some important differences. One region that regularly experiences heavy precipitation is East Asia, and heavy rainfall is especially prevalent in the warm season near a feature known alternately as the mei-yu, baiu, or changma front (in China, Japan,
Figure 7. Schematic diagram showing the components of motion of convective systems. The motion of individual convective cells (blue vector) is slightly slower than the mean tropospheric wind (thin gray vector). In (a), the propagation (where new convective cells form relative to previous ones; shown by the thin black vector) has a component in the same direction as the cell motion, and, as a result, the total system motion (green vector; the sum of the cell motion and propagation vectors) is large. In (b), the propagation vector nearly cancels the cell motion vector; therefore, the total system motion is near zero. This represents a situation supportive of locally large rainfall accumulations. Adapted from Doswell et al. (1996) and Corfidi (2003).
3

Heavy Rainfall and Flash Flooding
Page 13 of 42
PRINTED FROM the OXFORD RESEARCH ENCYCLOPEDIA, NATURAL HAZARD SCIENCE (oxfordre.com/naturalhazardscience). (c) Oxford University Press USA, 2018. All Rights Reserved. Personal use only; commercial use is strictly prohibited (for details see Privacy Policy and Legal Notice).
date: 13 December 2018
and Korea, respectively). This front, which is often nearly stationary during the Asian monsoon rainy season (see Ding, 2004), is characterized by a relatively weak temperature gradient, but a strong moisture gradient. MCSs often develop along or on the moist side of this boundary, move slowly, and result in large rainfall accumulations, in a similar manner to the heavy-rain-producing MCS patterns in the United States. Lee and Kim (2007) synthesized the patterns of MCS organization during heavy rainfall over Korea, and there are many case studies that examine the detailed evolution of heavily raining MCSs (for Japan, see Kato & Goda, 2001; for China, see Zhang & Zhang, 2012, and Luo, Gong, & Zhang, 2014).
Another region that has received considerable attention for extreme precipitation leading to devastating flash floods is the Mediterranean coast of Europe. In this region, warm, moist air from over the Mediterranean Sea can be transported northward, where it is forced to ascend along steep terrain, such as the Massif Central in southern France and the Alps in France and Italy. In these cases, the ingredients for extreme precipitation are brought together, and flooding is a particular concern because of the complex terrain and small catchments (see Creutin et al., 2009; Ducrocq, Nuissier, Ricard, Lebeaupin, & Thouvenin, 2008; Ricard, Ducrocq, & Auger, 2012).
Furthermore, topography has an important role in both the precipitation processes and the hydrologic response to extreme precipitation. In some extreme precipitation events, the ascent of moist air up a topographic barrier is the primary factor responsible for the magnitude of the rainfall. For example, the world records for rainfall accumulations longer than 1 hr (Arizona State University, cited 2016) occurred in places where orographic lift is important: La Réunion Island or Cherrapunji, India. The La Réunion records (e.g., 4936 mm in 4 days in February 2007) were set when tropical cyclones impacted this steeply sloped island, a situation that also occurs with some regularity in Taiwan (e.g., rainfall accumulations exceeding 1200 mm from Typhoon Morakot in 2009; Chien & Kuo, 2011). The ascent of moist air from the Bay of Bengal toward the Himalayas during the Asian monsoon (see Prokop & Walanus, 2015; Rasmussen & Houze, 2012), from the Pacific Ocean toward the coastal range and Sierra Nevada in North America (see Ralph & Dettinger, 2012), and from east to west toward the Rocky Mountains (see Gochis et al., 2015; Milrad, Gyakum, & Atallah, 2015) are other situations in which exceptional rainfall accumulations occur. Compounding the enhancement of precipitation from steep terrain is the resulting flood response that results from water falling on steep slopes that are often prone to rapid runoff and landslides. Although a full treatment of the hydrologic processes resulting from heavy rainfall in steep topography is beyond the scope of this article, it is clear that many of the deadliest and most destructive flash floods in the world occur when orographic ascent enhances rainfall production and then leads to rapid runoff along steep slopes and canyons; for example, the Big Thompson Canyon flash flood in Colorado, 1976 (Caracena et al., 1979) and the Leh, Pakistan, flash flood of 2010 (Rasmussen & Houze, 2012), among many others.
Heavy Rainfall and Flash Flooding
Page 14 of 42
PRINTED FROM the OXFORD RESEARCH ENCYCLOPEDIA, NATURAL HAZARD SCIENCE (oxfordre.com/naturalhazardscience). (c) Oxford University Press USA, 2018. All Rights Reserved. Personal use only; commercial use is strictly prohibited (for details see Privacy Policy and Legal Notice).
date: 13 December 2018
A major challenge in attempting to identify what causes the “most extreme” or “most destructive” flash flood is that flash floods themselves remain difficult to define and quantify. Unlike other hazards, where well-established rating scales exist (e.g., the Enhanced Fujita scale for tornadoes, the Saffir-Simpson scale for tropical cyclones), no such scale exists for flash floods. This results, in part, from the fact that (as stated by Doswell et al., 1996): “a flash flood event is the concatenation of a meteorological event with a particular hydrological situation.” In other words, a given amount of precipitation could yield everything from no flooding (if it occurred over a flat, dry, unpopulated area) to a major flood (if it occurred in a highly urbanized area with poor drainage), along with many possibilities in between. Thus, although the precipitation is (relatively) straightforward to quantify, the magnitude of flash floods is not. Some attempts have been made to address this gap (see Gourley et al., 2013; Gruntfest & Huber, 1991; Schroeder et al., 2016B), but the issue is unlikely to be resolved in the near future considering the multifaceted nature of flash floods.
Remaining Challenges in the Understanding and Prediction of Extreme Precipitation and Flash Floods
Prediction of Extreme Precipitation and Flash Floods
Although many advances have been made in understanding the general conditions under which extreme precipitation occurs, translating this quantitative and conceptual understanding to effective prediction has remained difficult. As concluded by Fritsch and Carbone (2004), “warm-season QPFs [quantitative precipitation forecasts] are, certifiably, the poorest performance area of forecast systems worldwide.” Some of this difficulty stems from fundamental limitations to atmospheric predictability. As first described by Thompson (1957) and Lorenz (1969) and corroborated by many others, the “lead time” at which accurate predictions can be made is quite short when the phenomena of interest occur on small spatial scales. Thus, because extreme precipitation nearly always occurs on small spatial scales (even within a highly organized convective system or tropical cyclone, only a small region typically has extreme precipitation amounts), expectations for precise forecasts must remain tempered. Furthermore, heavy rainfall almost always results from deep convection, which also has limited predictability (see Melhauser & Zhang, 2012; Nielsen & Schumacher, 2016; Zhang, Snyder, & Rotunno, 2003; Zhang, Odins, & Nielsen-Gammon, 2006). As a result, QPFs for heavy rainfall, especially in the warm season, remain poor, although they have shown some improvements over time (see Fritsch & Carbone, 2004; Sukovich, Ralph, Barthold, Reynolds, & Novak, 2014). Similar to other convective weather hazards (e.g., tornadoes, severe winds), the overall environments and ingredients that are favorable for heavy rainfall are fairly well
Heavy Rainfall and Flash Flooding
Page 15 of 42
PRINTED FROM the OXFORD RESEARCH ENCYCLOPEDIA, NATURAL HAZARD SCIENCE (oxfordre.com/naturalhazardscience). (c) Oxford University Press USA, 2018. All Rights Reserved. Personal use only; commercial use is strictly prohibited (for details see Privacy Policy and Legal Notice).
date: 13 December 2018
understood and can be identified sometimes several days in advance, but the detailed intensity and distribution of rainfall can often be anticipated only hours or minutes prior to its occurrence.
Although there are fundamental limitations to the ability to predict the details of extreme precipitation, there are also improvements that are attainable through improved physical understanding and numerical modeling. The small spatial and temporal scales on which rainfall occurs and the importance of moist convection argue for numerical weather prediction models that can explicitly represent convective processes, rather than estimating them through parameterizations. Furthermore, the limited predictability of the atmospheric processes important for extreme rainfall suggests that attempts to forecast it deterministically (i.e., predict a single specific outcome) are unlikely to succeed. Instead, a probabilistic approach is required, which can, in principle, indicate the likelihood of different possible outcomes, as well as identifying worst-case and best-case scenarios. Indeed, convection-allowing numerical models (with horizontal grid spacing of 1–4 km, which can explicitly represent convective systems if not individual cells) have come into widespread use in both research and operational forecasting. Furthermore, ensembles of convection-allowing models, in which numerous forecasts are integrated with the initial conditions, the model physics, or both, slightly altered, are also becoming an important tool for predicting heavy rainfall (and other convective weather hazards).
Despite some documented cases for which convection-allowing models degraded the precipitation forecast (see Gallus, 1999; Zhang et al., 2006), evidence indicates that these higher-resolution models outperform those with coarser resolution and parameterized convection (see Davis, Manning, Carbone, Trier, & Tuttle, 2003; Roberts & Lean, 2008; Schwartz et al., 2009; Weisman, Davis, Wang, Manning, & Klemp, 2008). Furthermore, convection-allowing ensembles—even with a smaller number of members to mitigate the greater computational expense of the higher resolution—produce better probabilistic forecasts of warm-season precipitation than ensembles with parameterized convection (see Clark, Gallus, Xue, & Kong, 2009; Iyer, Clark, Xue, & Kong, 2016). Following from these results, and from the greater availability of high-performance computing systems, the use of convection-allowing ensembles in research and operations has continued to grow (see Clark et al., 2012; Schwartz, Romine, Sobash, Fossell, & Weisman, 2015; Tennant, 2015).
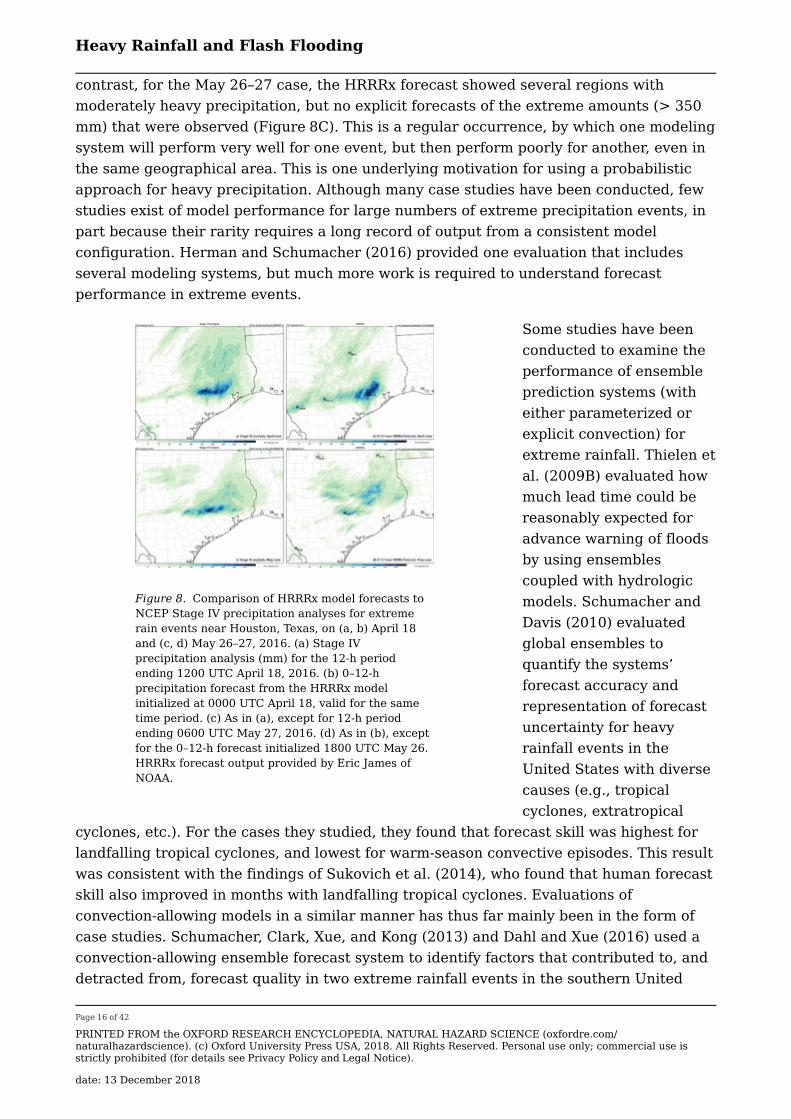
As one example, the Houston, Texas, area was affected by two extreme precipitation events in the spring of 2016, on April 18 and May 26–27. The development and evolution of the convection in these two events were quite similar, as was the eventual spatial distribution of rainfall (Figure 8A,C). The performance of the experimental High Resolution Rapid Refresh (HRRRx) model for these two cases, at similar lead times, was different, however. In the April 18, event, the model forecast very closely matched the observations, with the forecast heaviest rainfall in almost the exact location where it was observed (Figure 8B), with the timing and evolution of the convection closely resembling observations as well (not shown). The HRRRx performance in this case represents essentially the best possible forecast that could be expected of an NWP model today. In
4
Heavy Rainfall and Flash Flooding
Page 16 of 42
PRINTED FROM the OXFORD RESEARCH ENCYCLOPEDIA, NATURAL HAZARD SCIENCE (oxfordre.com/naturalhazardscience). (c) Oxford University Press USA, 2018. All Rights Reserved. Personal use only; commercial use is strictly prohibited (for details see Privacy Policy and Legal Notice).
date: 13 December 2018
contrast, for the May 26–27 case, the HRRRx forecast showed several regions with moderately heavy precipitation, but no explicit forecasts of the extreme amounts (> 350 mm) that were observed (Figure 8C). This is a regular occurrence, by which one modeling system will perform very well for one event, but then perform poorly for another, even in the same geographical area. This is one underlying motivation for using a probabilistic approach for heavy precipitation. Although many case studies have been conducted, few studies exist of model performance for large numbers of extreme precipitation events, in part because their rarity requires a long record of output from a consistent model configuration. Herman and Schumacher (2016) provided one evaluation that includes several modeling systems, but much more work is required to understand forecast performance in extreme events.
Some studies have been conducted to examine the performance of ensemble prediction systems (with either parameterized or explicit convection) for extreme rainfall. Thielen et al. (2009B) evaluated how much lead time could be reasonably expected for advance warning of floods by using ensembles coupled with hydrologic models. Schumacher and Davis (2010) evaluated global ensembles to quantify the systems’ forecast accuracy and representation of forecast uncertainty for heavy rainfall events in the United States with diverse causes (e.g., tropical cyclones, extratropical
cyclones, etc.). For the cases they studied, they found that forecast skill was highest for landfalling tropical cyclones, and lowest for warm-season convective episodes. This result was consistent with the findings of Sukovich et al. (2014), who found that human forecast skill also improved in months with landfalling tropical cyclones. Evaluations of convection-allowing models in a similar manner has thus far mainly been in the form of case studies. Schumacher, Clark, Xue, and Kong (2013) and Dahl and Xue (2016) used a convection-allowing ensemble forecast system to identify factors that contributed to, and detracted from, forecast quality in two extreme rainfall events in the southern United
Figure 8. Comparison of HRRRx model forecasts to NCEP Stage IV precipitation analyses for extreme rain events near Houston, Texas, on (a, b) April 18 and (c, d) May 26–27, 2016. (a) Stage IV precipitation analysis (mm) for the 12-h period ending 1200 UTC April 18, 2016. (b) 0–12-h precipitation forecast from the HRRRx model initialized at 0000 UTC April 18, valid for the same time period. (c) As in (a), except for 12-h period ending 0600 UTC May 27, 2016. (d) As in (b), except for the 0–12-h forecast initialized 1800 UTC May 26. HRRRx forecast output provided by Eric James of NOAA.
Heavy Rainfall and Flash Flooding
Page 17 of 42
PRINTED FROM the OXFORD RESEARCH ENCYCLOPEDIA, NATURAL HAZARD SCIENCE (oxfordre.com/naturalhazardscience). (c) Oxford University Press USA, 2018. All Rights Reserved. Personal use only; commercial use is strictly prohibited (for details see Privacy Policy and Legal Notice).
date: 13 December 2018
States, and Luo and Chen (2015) used a similar approach for an event in China. A recurring theme in the three studies is that the forecast skill at later times is very sensitive to the representation of deep convection at earlier times in the forecast. In particular, accurate prediction of the heavy-rain-producing convection was shown to depend on whether or not convectively generated cold pools from previous convection were accurately represented. As highlighted in Maddox et al.’s (1979) mesohigh flash flood type, these boundaries serve as important lifting mechanisms for slow-moving, heavily raining convective systems.
The current frontier in flood and flash-flood prediction involves coupling atmospheric observations and models to hydrologic models, such that the runoff, inundation, and so forth, in flash floods can be explicitly represented. European countries have pioneered many of these efforts, leveraging the world-leading European Centre for Medium-Range Weather Forecasts (ECMWF) ensemble prediction system as well as higher-resolution atmospheric ensembles (see Cloke & Pappenberger, 2009; Golding, Roberts, Leoncini, Myle, & Swinbank, 2016; Thielen, Bartholmes, Ramos, & de Roo, 2009A; Vincendon, Ducrocq, Nuissier, & Vié, 2011; Zappa et al., 2008). Coupled atmospheric-hydrologic prediction systems are now also being deployed operationally in North America (see Brown, Seo, & Du, 2012; Gourley et al., 2016; Krajewski et al., 2016) as well as in developing countries (see Hopson & Webster, 2010). Davis (2001) provides a review of the concepts and challenges underlying these approaches. A promising development is the release of the WRF-Hydro system (Gochis, Yu, & Yates, 2014), which is a community-supported hydrologic modeling system and is integrated with the widely used WRF atmospheric model. Many challenges remain to make these ensemble hydrologic predictions accurate and useful, however. There are fundamental mismatches in scales between the atmosphere and the land surface that must be overcome (e.g., even the highest-resolution atmospheric forecasts have a grid spacing on the order of 1 km, which is too coarse to adequately represent flooding in small catchments). Furthermore, urban areas can be particularly prone to flooding, and the representation of urban land use and the built environment in prediction models remains incomplete. Sufficiently detailed observations of rainfall are also unavailable in many locations: rain gauges have sparse coverage, and while radar and satellite rainfall measurements continue to improve, they also have limitations in accuracy and coverage (see Zhang et al., 2016). Also, considering the limitations of forecasting heavy precipitation in atmospheric models, new techniques are required to account for these uncertainties (see Hardy et al., 2016). In the United States, the Flash Flood and Intense Rainfall Experiment (FFaIR, Barthold et al., 2015) has been established to bring forecasters, researchers, and model developers together each summer to assess new tools and techniques.
One limitation to current ensemble prediction systems is that they are generally not well calibrated: they have insufficient ensemble spread (owing to the expense of running a large number of ensemble members), individual members may have systemic biases, their forecasts may not be reliable (where reliability can simply be defined by an n% frequency of occurrence when an n% probability of occurrence is predicted), and so on. These problems can be amplified for extreme events (such as heavy rainfall), and they present
Heavy Rainfall and Flash Flooding
Page 18 of 42
PRINTED FROM the OXFORD RESEARCH ENCYCLOPEDIA, NATURAL HAZARD SCIENCE (oxfordre.com/naturalhazardscience). (c) Oxford University Press USA, 2018. All Rights Reserved. Personal use only; commercial use is strictly prohibited (for details see Privacy Policy and Legal Notice).
date: 13 December 2018
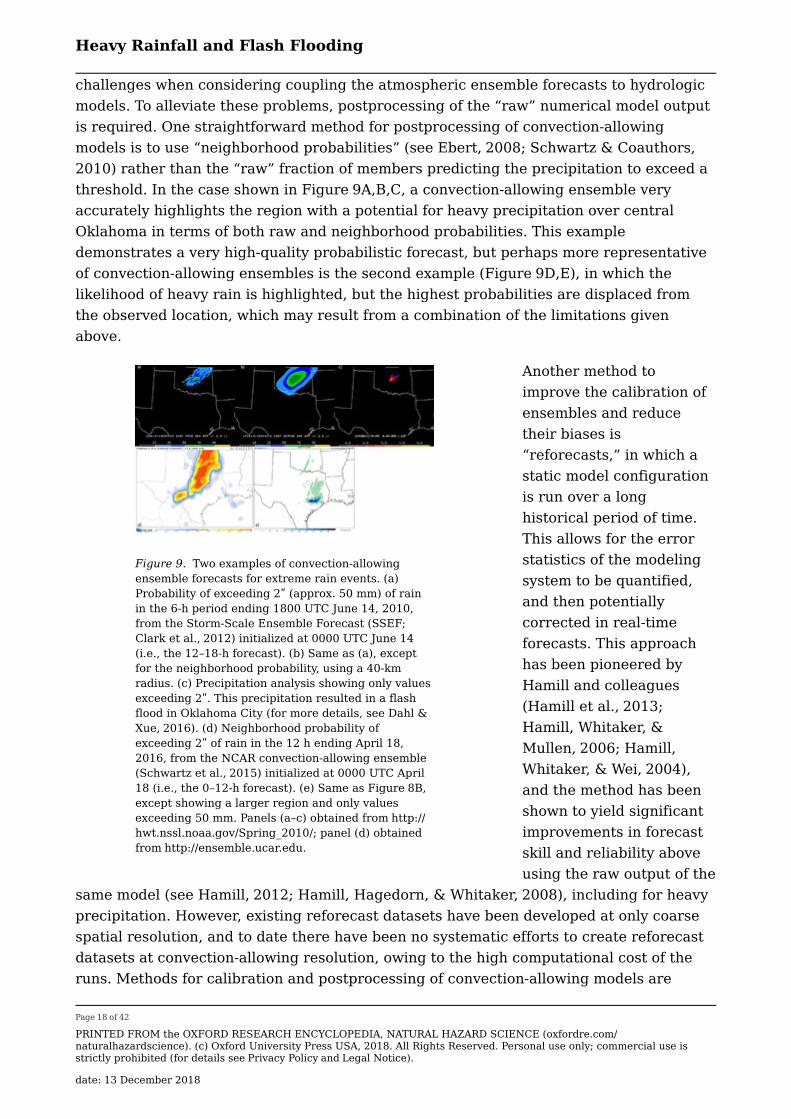
challenges when considering coupling the atmospheric ensemble forecasts to hydrologic models. To alleviate these problems, postprocessing of the “raw” numerical model output is required. One straightforward method for postprocessing of convection-allowing models is to use “neighborhood probabilities” (see Ebert, 2008; Schwartz & Coauthors, 2010) rather than the “raw” fraction of members predicting the precipitation to exceed a threshold. In the case shown in Figure 9A,B,C, a convection-allowing ensemble very accurately highlights the region with a potential for heavy precipitation over central Oklahoma in terms of both raw and neighborhood probabilities. This example demonstrates a very high-quality probabilistic forecast, but perhaps more representative of convection-allowing ensembles is the second example (Figure 9D,E), in which the likelihood of heavy rain is highlighted, but the highest probabilities are displaced from the observed location, which may result from a combination of the limitations given above.
Another method to improve the calibration of ensembles and reduce their biases is “reforecasts,” in which a static model configuration is run over a long historical period of time. This allows for the error statistics of the modeling system to be quantified, and then potentially corrected in real-time forecasts. This approach has been pioneered by Hamill and colleagues (Hamill et al., 2013; Hamill, Whitaker, & Mullen, 2006; Hamill, Whitaker, & Wei, 2004), and the method has been shown to yield significant improvements in forecast skill and reliability above using the raw output of the
same model (see Hamill, 2012; Hamill, Hagedorn, & Whitaker, 2008), including for heavy precipitation. However, existing reforecast datasets have been developed at only coarse spatial resolution, and to date there have been no systematic efforts to create reforecast datasets at convection-allowing resolution, owing to the high computational cost of the runs. Methods for calibration and postprocessing of convection-allowing models are
Figure 9. Two examples of convection-allowing ensemble forecasts for extreme rain events. (a) Probability of exceeding 2ʺ (approx. 50 mm) of rain in the 6-h period ending 1800 UTC June 14, 2010, from the Storm-Scale Ensemble Forecast (SSEF; Clark et al., 2012) initialized at 0000 UTC June 14 (i.e., the 12–18-h forecast). (b) Same as (a), except for the neighborhood probability, using a 40-km radius. (c) Precipitation analysis showing only values exceeding 2ʺ. This precipitation resulted in a flash flood in Oklahoma City (for more details, see Dahl & Xue, 2016). (d) Neighborhood probability of exceeding 2ʺ of rain in the 12 h ending April 18, 2016, from the NCAR convection-allowing ensemble (Schwartz et al., 2015) initialized at 0000 UTC April 18 (i.e., the 0–12-h forecast). (e) Same as Figure 8B, except showing a larger region and only values exceeding 50 mm. Panels (a–c) obtained from http://hwt.nssl.noaa.gov/Spring_2010/; panel (d) obtained from http://ensemble.ucar.edu.

Heavy Rainfall and Flash Flooding
Page 19 of 42
PRINTED FROM the OXFORD RESEARCH ENCYCLOPEDIA, NATURAL HAZARD SCIENCE (oxfordre.com/naturalhazardscience). (c) Oxford University Press USA, 2018. All Rights Reserved. Personal use only; commercial use is strictly prohibited (for details see Privacy Policy and Legal Notice).
date: 13 December 2018
beginning to emerge (see Gagne, McGovern, & Xue, 2014; Marsh et al., 2012) and are an active and important area of ongoing research, especially as they pertain to extreme precipitation.
Finally, amid the rapid development of new models and other forecast tools, and the proliferation of real-time, high-resolution ensemble systems, relatively little research has been done into how these tools may be understood or used by human forecasters or other users of forecast information, including the public. A few studies have examined forecasters’ perceptions of convection-allowing ensembles (Barthold et al., 2015; Clark et al., 2012; Evans, Van Dyke, & Lericos, 2014), and some studies have explored how people understand the concept of “probability of precipitation” (Joslyn, Nadav-Greenberg, & Nichols, 2009; Morss, Demuth, & Lazo, 2008; Stewart et al., 2016). One relevant topic that has received some attention is how users understand and use forecast uncertainty information for unusual events (see Frick & Hegg, 2011; Joslyn & Savelli, 2010; Morss, Lazo, & Demuth, 2010) and similarly, how people perceive the risk of flooding in flood-prone areas (see Lazrus, Morss, Demuth, Lazo, & Bostrom, 2016; Lutoff, Creutin, Ruin, & Borga, 2016). It is clear that much remains to be learned on this topic, as well as numerous other topics, including optimizing the “human-computer mix” when predicting extreme events and communicating precipitation and flood hazards to various populations.
Broader Impacts of Extreme Rainfall and Flash Floods
Closely linked with the goal of enhancing the coupling between meteorology and hydrology to improve predictions is the goal of enhancing the coupling between these disciplines and many others to improve the overall understanding of how flash floods impact society. Floods can have long-term effects on people, economies, infrastructure, and ecosystems: Jonkman (2005) concluded that “a comparison with figures for other types of natural disasters shows that floods are the most significant disaster type in terms of the number of persons affected.” Yet the analysis of floods often considers only a portion of the effects, rather than considering them in an integrated manner.
One of the deadliest floods in U.S. history, the Big Thompson Canyon, Colorado, flood of 1976, led to pioneering work (Gruntfest, 1977) on whether and how people received flood warnings, what decisions they made during the flood, and ultimately whether they survived the event. Gruntfest (1977) found that people driving alone in the Big Thompson Canyon were at the greatest risk, and subsequent research has confirmed that a large fraction of flood fatalities occur when people are in vehicles: for example, Ashley and Ashley (2008) found that over 60% of U.S. flood fatalities occurred in vehicles. This happens for numerous reasons: vehicles can be washed away by a relatively small amount of floodwater, people driving may not have access to current warning information (see Hayden et al., 2007), and people may underestimate the risk associated with driving across flooded roads (see Becker et al., 2015). In the United States, Kellar and Schmidlin (2012) found that vehicle-related flood deaths occurred most frequently in particular
Heavy Rainfall and Flash Flooding
Page 20 of 42
PRINTED FROM the OXFORD RESEARCH ENCYCLOPEDIA, NATURAL HAZARD SCIENCE (oxfordre.com/naturalhazardscience). (c) Oxford University Press USA, 2018. All Rights Reserved. Personal use only; commercial use is strictly prohibited (for details see Privacy Policy and Legal Notice).
date: 13 December 2018
flood-prone regions of the country. Recent research has thus focused on better understanding the factors that increase vulnerabilty to flooding while driving, and potentially how to mitigate that risk (Debionne, Ruin, Shabou, Lutoff, & Creutin, 2016; Drobot, Benight, & Gruntfest, 2007; Ruin, Gaillard, & Lutoff, 2007).
Numerous approaches have been established with the goal of better integrating the broad impacts of floods into research. Some of the approaches have involved building networks of interdisciplinary researchers and practitioners with interests in studying floods from multiple perspectives (Demuth, Gruntfest, Morss, Drobot, & Lazo, 2007; Ruin et al., 2012; Schumacher, 2016). Ruin et al. (2014) proposed a research methodology for studying floods that incorporates information from hydrometeorology, transportation, and the behavioral sciences. They employed this method after a flood in France and found that people’s situational context is very important in determining how they are affected by the flood, echoing the results of Gruntfest (1977). With the populations of large cities increasing, and with many cities being highly flood-prone, the factors that contribute to vulnerability from urban floods are important to quantify but are not yet well understood (National Research Council, 2010; Wilhelmi & Morss, 2013). The study of “socio-hydro-meteorology” (a term coined by E. Gruntfest) remains an important frontier in pursuit of the goal of reducing fatalities and damage from flooding.
Sources and Uncertainties in Atmospheric Water Vapor
From a meteorological perspective, one of the primary sources of uncertainty in numerical model forecasts of extreme precipitation is the distribution of water vapor in the atmosphere. Moist air is a prerequisite for heavy rainfall (Doswell et al., 1996), and although moisture is well measured at the surface and in a column-integrated sense, the vertical structure of moisture is not. Fabry and Sun (2010) showed that mesoscale model forecasts are particularly sensitive to mid-level moisture errors, and several studies have demonstrated that the structure, evolution, and precipitation production of convective storms can be altered as a result of small moisture perturbations (Alfaro & Khairoutdinov,2015; Bretherton, Peters, & Back, 2004; McCaul, Cohen, & Kirkpatrick, 2005; Schumacher, 2015; Takemi, 2010). Several studies have found that large local anomalies (deviations from the local climatology) in PW often precede extreme precipitation events, although they are by no means a sufficient condition for occurrence (e.g., Hart & Grumm,2001; Junker et al., 2008; Schroeder, Basara, Shepherd, & Nelson, 2016A). Thus, an important line of research has focused on understanding, and anticipating, the sources of anomalously abundant atmospheric moisture.
The most mature line of research on this topic has focused on “atmospheric rivers:” narrow corridors of increased water vapor that transport moisture from the tropics into middle and high latitudes. This concept was first introduced by Zhu and Newell (1998). Atmospheric rivers that form over the Pacific Ocean and affect the West Coast of North America have been studied most extensively (see Lackmann & Gyakum, 1999; Neiman, Schick, Ralph, Hughes, & Wick, 2011; Ralph et al., 2006; Ralph & Dettinger, 2011; Ralph,
Heavy Rainfall and Flash Flooding
Page 21 of 42
PRINTED FROM the OXFORD RESEARCH ENCYCLOPEDIA, NATURAL HAZARD SCIENCE (oxfordre.com/naturalhazardscience). (c) Oxford University Press USA, 2018. All Rights Reserved. Personal use only; commercial use is strictly prohibited (for details see Privacy Policy and Legal Notice).
date: 13 December 2018
Neiman, Kiladis, Weickmann, & Reynolds, 2011), although they have also been shown to have connections to heavy rainfall in the southeast United States (see Mahoney et al., 2016; Moore et al., 2012) and in Europe (see Lavers, Villarini, Allan, Wood, & Wade, 2012; Stohl, Forster, & Sodemann, 2008). The physical processes responsible for the formation of, and water vapor transport in, atmospheric rivers remain a subject of debate: particularly the misunderstanding that they represent a direct transport of moisture from the tropics (see Cordeira, Ralph, & Moore, 2013; Dacre, Clark, Martinez-Alvarado, & Stringer, 2015). Nonetheless, the evidence connecting atmospheric rivers to heavy precipitation and flooding is unquestionable, and their spatial and temporal coherence represent a situation where there can be relatively high predictive accuracy for the associated precipitation and flooding (see Cordeira et al., 2016; Junker et al., 2008; Lavers, Waliser, Ralph, & Dettinger, 2016).
Another phenomenon that is distinct from, but related to, atmospheric rivers, is the “predecessor rain event” (PRE) that can occur ahead of a recurving tropical cyclone. In PREs (Galarneau, Bosart, & Schumacher, 2010; Schumacher, Galarneau, & Bosart, 2011), tropical moisture is advected poleward of a tropical cyclone and is lifted along an extratropical baroclinic zone. The atmospheric conditions in which the PREs occur are often already favorable for the development of a heavy-rain-producing convective system [many correspond to Maddox et al.’s (1979) frontal flash flood], and the deep tropical moisture serves to increase the rainfall rates and accumulations within the MCS (see Moore, Bosart, Keyser, & Jurewicz, 2013; Schumacher et al., 2011; Schumacher & Galarneau, 2012). With PREs that have affected the U.S. Midwest, the rainfall has often resulted in significant flooding (Rowe & Villarini, 2013). PREs are also an important producer of extreme precipitation in East Asia, in association with west Pacific typhoons (see Byun & Lee, 2012; Meng & Zhang, 2012).
The aforementioned phenomena implicate moisture originating from oceans as a primary source for heavy precipitation, but land surfaces can also play a crucial role in supplying moisture for rainfall over continents. Feedbacks between rainfall and surface fluxes—known as moisture recycling—are important moisture sources, especially over geographic regions where air parcels originating over oceans must travel a long distance to reach the regions of frequent convection, such as North and South America (Dirmeyer & Kinter, 2010; Dirmeyer, Schlosser, & Brubaker, 2009; van der Ent & Savenije, 2011). Milrad et al. (2015) suggest that moisture recycled from the land surface, rather than moisture transported from a distant ocean, was the most important source of moisture in the June 2013 Alberta rain and flood event. Methods have been developed in numerical models to “tag” water vapor sources, which can be used to identify the moist important moisture sources to extreme rain events in different regions (see Piaget et al., 2015; Sodemann, Wernli, & Schweirz, 2009).
Regardless of the initial source of moisture, it is clear that more observations of the horizontal and vertical structure of water vapor are needed for improved predictions of heavy precipitation, and that those observations must be appropriately assimilated into numerical weather prediction models. There are several promising methods for collecting
Heavy Rainfall and Flash Flooding
Page 22 of 42
PRINTED FROM the OXFORD RESEARCH ENCYCLOPEDIA, NATURAL HAZARD SCIENCE (oxfordre.com/naturalhazardscience). (c) Oxford University Press USA, 2018. All Rights Reserved. Personal use only; commercial use is strictly prohibited (for details see Privacy Policy and Legal Notice).
date: 13 December 2018
water vapor profiles at high vertical and temporal resolution, including differential absorption lidar (DIAL; Spuler et al., 2015) and atmospheric emitted radiance interferometer (AERI; Turner & Löhnert, 2014), although horizontally dense measurements may be more challenging to routinely collect.
Role of Supercells and Mesovortices in Extreme Rainfall
Although a wide variety of storm types can lead to extreme precipitation, some of the most extreme short-term rainfall rates and accumulations occur when the convection occurs in the presence of rotation: either in pre-existing mesoscale convective vortices (MCVs; Bartels & Maddox, 1991), or in supercell thunderstorms (defined by their rotating updrafts; Lemon & Doswell, 1979). Schumacher and Johnson (2009) synthesized the conditions associated with MCV-related extreme rainfall that had previously been documented in numerous case studies (see Bosart & Sanders, 1981; Fritsch, Murphy, & Kain, 1994; Schumacher & Johnson, 2008; Trier & Davis, 2002). In the central United States, where the nocturnal LLJ often approaches MCVs that were produced by convection on the previous day, the environment can favor very slow-moving, heavily raining convection. High relative humidity is concentrated near the vortex center, and ascent is favored on the upwind side of the vortex, such that cells repeatedly form there and move eastward, resulting in near-zero overall system motion, as illustrated in Figures6 and 7. Feedbacks can occur on multiple scales that support further heavy rainfall: latent heating in convection produces potential vorticity (PV) anomalies, which can reinforce an MCV and even allow it to persist across multiple diurnal cycles (see Raymond & Jiang, 1990; Trier, Davis, & Tuttle, 2000). Latent heating can also enhance the strength of low-level jets, transporting additional moisture into the convective system (Lackmann, 2002; Morales, Schumacher, & Kreidenweis, 2015). Similar processes can also occur in the outer rainbands of tropical cyclones and produce extreme rainfall (Wang et al., 2015).
Supercell thunderstorms occur on a smaller spatial scale than MCVs or MCSs, but they can sometimes produce extremely large local rainfall accumulations. Smith et al. (2001) analyzed several cases in which supercells produced short-term rain rates exceeding 200 mm/h. Although the environments in which supercells form can be detrimental to extreme rainfall (e.g., they often have layers of dry air aloft, and their strong updrafts can favor the production of hail at the expense of rain), because supercell updrafts can be strong, large in area, and long lived, they can condense and precipitate large amounts of water vapor despite the precipitation efficiency being relatively low, especially in “high-precipitation” or “HP” supercells (i.e., wq is so large that it can make up for small E; Doswell et al., 1996; Moller, Doswell, Foster, & Woodall, 1994; Smith et al., 2001). The strong dynamic (as opposed to buoyant) forcing for low-level updrafts in supercells may also support extreme rainfall production, although less is understood about the importance of this process. Extreme rainfall from supercells is a topic that warrants further research, especially considering that these situations can present hazards from
Heavy Rainfall and Flash Flooding
Page 23 of 42
PRINTED FROM the OXFORD RESEARCH ENCYCLOPEDIA, NATURAL HAZARD SCIENCE (oxfordre.com/naturalhazardscience). (c) Oxford University Press USA, 2018. All Rights Reserved. Personal use only; commercial use is strictly prohibited (for details see Privacy Policy and Legal Notice).
date: 13 December 2018
both tornadoes and flash floods, which require very different protective actions (National Weather Service, 2014; Nielsen, Herman, Tournay, Peters, & Schumacher, 2015).
Cloud Microphysical Processes in Exceptionally Heavy Rainfall
Storm types and environmental conditions support extreme precipitation, yet heavy rainfall production is fundamentally a result of microphysical processes that occur within convective clouds. All else being equal, high rain rates are favored when warm-rain processes (i.e., rain produced solely by the condensation and accretion of water, with no ice processes) are dominant in a convective storm. These processes, in turn, are favored when there is a deep layer of cloud below the freezing level (Davis, 2001). When observed by radar, storms of this type have what is referred to as a “low-echo centroid” (Caracena et al., 1979; Ryan & Vitale, 2008), as the highest values of radar reflectivity are located below the freezing level. Low-echo centroids have been identified in numerous instances of extreme precipitation and flash flooding and are illustrative of high precipitation efficiency. In a global survey of space-borne observations, Hamada and colleagues (Hamada, Takayabu, Liu, & Zipser, 2015) found that the heaviest rainstorms were generally not those that had the most intense convection, and recent results from the Convective Precipitation Experiment (COPE) in the United Kingdom indicated that very heavy precipitation can result from solely warm-rain processes even at high latitudes (Leon et al., 2016).
Nonetheless, storms that produce a large quantity of ice hydrometeors—including supercells—are also observed to produce extreme rainfall at the surface, and even in storms in which warm-rain processes are key to the rainfall production, ice processes can play an important role (Friedrich, Kalina, Aikins, Gochis, & Rasmussen, 2016; Gochis et al., 2015). There remain many open questions and uncertainties regarding the microphysical processes at work in very heavy rainfall, both in terms of fundamental understanding and when trying to include what is known into numerical models. The influences of atmospheric aerosol on the production of heavy precipitation are also poorly understood. Some studies have worked to quantify the precipitation efficiency in heavy rainstorms (Market, Allen, Scofield, Kuligowski, & Gruber, 2003; McCaul et al., 2005), but predicting this quantity remains challenging. To summarize: in addition to improving understanding and prediction of the mesoscale conditions and storm types that are associated with heavy precipitation, greater understanding of the cloud and precipitation microphysics at work in these storms is also required.
Climate Change and Its Possible Influences on Heavy Rainfall
Anthropogenic climate change, and its influences on weather, has been one of the foremost research topics of the last few decades, and a full assessment of climate-change influences on precipitation is well beyond the scope of this article. However, a brief description of some of the lines of inquiry related to extreme precipitation is
Heavy Rainfall and Flash Flooding
Page 24 of 42
PRINTED FROM the OXFORD RESEARCH ENCYCLOPEDIA, NATURAL HAZARD SCIENCE (oxfordre.com/naturalhazardscience). (c) Oxford University Press USA, 2018. All Rights Reserved. Personal use only; commercial use is strictly prohibited (for details see Privacy Policy and Legal Notice).
date: 13 December 2018
appropriate. All else being equal, a warmer planet will have more atmospheric water vapor: the Clausius-Clapeyron relation states that saturation vapor pressure increases with increasing temperature, so if relative humidity remains approximately constant, water vapor will increase by approximately 6% to 7% per ºC of warming. Then, because water vapor is one of the key ingredients for heavy rainfall, one might expect that precipitation will also increase. Although the mean global precipitation is constrained by the global radiation balance, and will not increase at such a high rate (instead, on the order of 2% to 3%; Allen & Ingram, 2002; Allan & Soden, 2008; Pall, Allen, & Stone, 2007), any given precipitation system is influenced by the nearby water vapor content rather than by the radiative constraints. Thus, the expectation is that heavy rainfall will contribute more to the climatology of precipitation than it has in the past: the total rainfall should increase modestly, but the ability of the atmosphere to produce heavy rainfall will be greater.
In some parts of the world, this has been shown to be true, at least in a broad sense. For example, Groisman, Knight, and Karl (2012) found increases in the frequency of heavy, very heavy, and extreme precipitation in the central United States from 1979 to 2009, but no changes in moderately heavy rainfall events. However, attribution of the changes to global climate change is difficult, as many of the regions seeing the changes also underwent major land-use changes (e.g., changes in agricultural activity) over the same time period. Westra, Alexander, and Zweirs (2013) analyzed global data and found that locally extreme precipitation had increased from 1990 to 2009 at a rate between 5.9% and 7.7% per ºC of warming, although this rate varied substantially with latitude.
How the theoretical and observed changes may translate to future changes in extreme precipitation remains uncertain, however, and is a very active area of research. For the same reasons that precipitation is a particularly difficult quantity to predict in NWP models (e.g., model resolution, challenges of parameterizing convection, and microphysics), it is also difficult to accurately represent in climate models. How the characteristics of large-scale forcing for ascent, and of convective dynamics, will change in different regions is also uncertain. Various approaches have been employed to run convection-allowing models to examine future changes in extreme precipitation, including “pseudo-global-warming” simulations of observed events (Lackmann, 2013), dynamical downscaling for a particular region (Mahoney et al., 2013), and long integrations of convection-permitting regional models forced by global climate models (Ban, Schmidli, & Schär, 2015; Rajczak, Pall, & Schär, 2013). Westra et al. (2014) review the results of climate simulations from both coarse-resolution climate models and convection-allowing models, which suggest increases in heavy precipitation in most regions, but much additional research is needed to achieve robust future projections. As it becomes more feasible to run climate simulations at convection-allowing resolutions, the confidence in these projections should increase.
5
Heavy Rainfall and Flash Flooding
Page 25 of 42
PRINTED FROM the OXFORD RESEARCH ENCYCLOPEDIA, NATURAL HAZARD SCIENCE (oxfordre.com/naturalhazardscience). (c) Oxford University Press USA, 2018. All Rights Reserved. Personal use only; commercial use is strictly prohibited (for details see Privacy Policy and Legal Notice).
date: 13 December 2018
ConclusionAlthough many advances have been made in the understanding and prediction of extreme precipitation and flash floods, they remain among the deadliest and most destructive natural hazards globally. Some of the aspects of extreme precipitation that are well established, and applicable in most regions, include:
• The ingredients for large rainfall rates include moist air, upward motion (typically in the form of deep convection), and efficient precipitation processes. When these ingredients are maintained for a long period of time over a given area, large rainfall accumulations result.
• A wide variety of storm types can produce extreme precipitation, including tropical cyclones, extratropical cyclones, supercell thunderstorms, and mesoscale convective systems. Some regions are at risk from all of these storm types, whereas in other regions, only one or two storm types frequently produce heavy rain.
• When mesoscale convective systems become organized so that deep convective cells repeatedly pass over a given area, they often produce extreme rainfall accumulations.
• Human and numerical model forecasts of heavy precipitation have improved over time, but still have little skill, especially when the rain is produced by warm-season convection.
Research has begun to address many of the remaining gaps in understanding and prediction, which include:
• Understanding the predictability of extreme precipitation in different regions and large-scale atmospheric flow patterns.
• Improving precipitation prediction through increased understanding, enhanced observations, and improved numerical models.
• Coupling atmospheric and hydrologic predictions to produce forecasts of flooding, including quantification of uncertainty.
• Understanding how people receive and perceive flood information, and analyzing the wide-ranging impacts of floods on society.
• Observing the four-dimensional distribution of atmospheric water vapor, and its role in leading to extreme precipitation.
• Diagnosing and quantifying feedbacks between cloud microphysical processes and atmospheric dynamics in heavily raining convection.
• Understanding and projecting how changes to the global climate system may affect the frequency and magnitude of extreme rainfall and flooding.
Heavy Rainfall and Flash Flooding
Page 26 of 42
PRINTED FROM the OXFORD RESEARCH ENCYCLOPEDIA, NATURAL HAZARD SCIENCE (oxfordre.com/naturalhazardscience). (c) Oxford University Press USA, 2018. All Rights Reserved. Personal use only; commercial use is strictly prohibited (for details see Privacy Policy and Legal Notice).
date: 13 December 2018
Achieving adequate progress in all of these areas will require not only basic research, but interdisciplinary research collaborations and collaborations between researchers, practitioners, emergency managers, and the public.
References
Adams, D. K., & Comrie, A. C. (1997). The North American monsoon. Bulletin of the American Meteorological Society, 78, 2197–2213.
Alfaro, D. A., & Khairoutdinov, M. (2015). Thermodynamic constraints on the morphology of simulated midlatitude squall lines. Journal of the Atmospheric Sciences, 72, 3116–3137.
Allan, R. P., & Soden, B. J. (2008). Atmospheric warming and the amplification of precipitation extremes. Science, 321, 1481–1484.
Allen, M. R., & Ingram, W. J. (2002). Constraints on future changes in climate and the hydrologic cycle. Nature, 419, 224–232.
Arizona State University. (cited 2016). World weather/climate extremes archive. Available online at http://wmo.asu.edu/.
Ashley, S. T., & Ashley, W. S. (2008). Flood fatalities in the United States. Journal of Applied Meteorology and Climatology, 47, 805–818.
Ban, N., Schmidli, J., & Schär, C. (2015). Heavy precipitation in a changing climate: Does short-term summer precipitation increase faster? Geophysical Research Letters, 42, 1165–1172.
Bartels, D. L., & Maddox, R. A. (1991). Midlevel cyclonic vortices generated by mesoscale convective systems. Monthly Weather Review, 119, 104–118.
Barthold, F. E., Workoff, T. E., Cosgrove, B. A., Gourley, J. J., Novak, D. R., & Mahoney, K. M. (2015). Improving flash flood forecasts: The HMT-WPC Flash Flood and Intense Rainfall Experiment. Bulletin of the American Meteorological Society, 96, 1859–1866.
Becker, J. S., Taylor, H. L., Doody, B. J., Wright, K. C., Gruntfest, E., & Webber, D. (2015). A review of people’s behavior in and around floodwater. Weather, Climate, and Society, 7, 321–332.
Bosart, L. F., & Sanders, F. (1981). The Johnstown flood of July 1977: A long-lived convective system. Journal of the Atmospheric Sciences, 38, 1616–1642.
Bretherton, C. S., Peters, M. E., & Back, L. E. (2004). Relationships between water vapor path and precipitation over the tropical oceans. Journal of Climate, 17, 1517–1528.
Heavy Rainfall and Flash Flooding
Page 27 of 42
PRINTED FROM the OXFORD RESEARCH ENCYCLOPEDIA, NATURAL HAZARD SCIENCE (oxfordre.com/naturalhazardscience). (c) Oxford University Press USA, 2018. All Rights Reserved. Personal use only; commercial use is strictly prohibited (for details see Privacy Policy and Legal Notice).
date: 13 December 2018
Brown, J. D., Seo, D.-J., & Du, J. (2012). Verification of precipitation forecasts from NCEP’s Short-Range Ensemble Forecast (SREF) system with reference to ensemble streamflow prediction using lumped hydrologic models. Journal of Hydrometeorology, 13, 808–836.
Byun, K.-Y., & Lee, T.-Y. (2012). Remote effects of tropical cyclones on heavy rainfall over the Korean Peninsula: Statistical and composite analysis. Tellus A, 64, 14983.
Caracena, F., Maddox, R. A., Hoxit, L. R., & Chappell, C. F. (1979). Mesoanalysis of the Big Thompson storm. Monthly Weather Review, 107, 1–17.
Chappell, C. F. (1986). Quasi-stationary convective events. In P. S. Ray (Ed.), Mesoscale meteorology and forecasting (pp. 289–309). American Meteorological Society.
Chien, F.-C., & Kuo, H.-C. (2011). On the extreme rainfall of Typhoon Morakot (2009). Journal of Geophysical Research, 116, 2156–2202.
Clark, A. J., Gallus, W. A., Jr., Xue, M., & Kong, F. (2009). A comparison of precipitation forecast skill between small convection-allowing and large convection-parameterizing ensembles. Weather and Forecasting, 24, 1121–1140.
Clark, A. J., Weiss, S. J., Kain, J. S., Jirak, I. L., Coniglio, M., Melick, C. J., et al. (2012). An overview of the 2010 Hazardous Weather Testbed Experimental Forecast Program spring experiment. Bulletin of the American Meteorological Society, 93, 55–74.
Cloke, H. L., & Pappenberger, F. (2009). Ensemble flood forecasting: A review. Journal of Hydrology, 375, 613–626.
Cordeira, J. M., Ralph, F. M., Martin, A., Gaggini, N., Spackman, R., Neiman, P., et al. (2016). Forecasting atmospheric rivers during CalWater 2015. Bulletin of the American Meteorological Society.
Cordeira, J. M., Ralph, F. M., & Moore, B. J. (2013). The development and evolution of two atmospheric rivers in proximity to western North Pacific tropical cyclones in October 2010. Monthly Weather Review, 141, 4234–4255.
Corfidi, S. F. (2003). Cold pools and MCS propagation: Forecasting the motion of downwind-developing MCSs. Weather and Forecasting, 18, 997–1017.
Corfidi, S. F., Merritt, J. H., & Fritsch, J. M. (1996). Predicting the movement of mesoscale convective complexes. Weather and Forecasting, 11, 41–46.
Creutin, J. D., Borga, M., Lutoff, C., Scolobig, A., Ruin, I., & Créton-Cazanave, L. (2009). Catchment dynamics and social response during flash floods: The potential of radar rainfall monitoring for warning procedures. Meteorological Applications, 16, 115–125.
Heavy Rainfall and Flash Flooding
Page 28 of 42
PRINTED FROM the OXFORD RESEARCH ENCYCLOPEDIA, NATURAL HAZARD SCIENCE (oxfordre.com/naturalhazardscience). (c) Oxford University Press USA, 2018. All Rights Reserved. Personal use only; commercial use is strictly prohibited (for details see Privacy Policy and Legal Notice).
date: 13 December 2018
Dacre, H. F., Clark, P. A., Martinez-Alvarado, O., & Stringer, M. A. (2015). How do atmospheric rivers form? Bulletin of the American Meteorological Society, 96, 1243–1255.
Dahl, N., & Xue, M. (2016). Prediction of the 14 June 2010 Oklahoma City extreme precipitation and flooding event in a multiphysics multi-initial-conditions storm-scale ensemble forecasting system. Weather and Forecasting, 31, 1215–1246.
Davis, C. A., Manning, K. W., Carbone, R. E., Trier, S. B., & Tuttle, J. D. (2003). Coherence of warm-season continental rainfall in numerical weather prediction models. Monthly Weather Review, 131, 2667–2679.
Davis, R. S. (2001). Flash flood forecast and detection methods. In Severe convective storms (pp. 481–525). Meteorological Monograph 50. American Meteorological Society.
Debionne, S., Ruin, I., Shabou, S., Lutoff, C., & Creutin, J.-D. (2016). Assessment of commuters’ daily exposure to flash flooding over the roads of the Gard region, France. Journal of Hydrology.
Demuth, J. L., Gruntfest, E., Morss, R. E., Drobot, S., & Lazo, J. K. (2007). WAS*IS: Building a community for integrating meteorology and social science. Bulletin of the American Meteorological Society, 88, 1729–1737.
Ding, Y. (2004). Seasonal march of the East-Asian summer monsoon. In East Asian monsoon (pp. 3–53). World Scientific.
Dirmeyer, P. A., & Kinter, J. L. III (2010). Floods over the U.S. Midwest: A regional water cycle perspective. Journal of Hydrometeorology, 11, 1172–1181.
Dirmeyer, P. A., Schlosser, C. A., & Brubaker, K. L. (2009). Precipitation, recycling, and land memory: An integrated analysis. Journal of Hydrometeorology, 10, 278–288.
Doswell, C. A. III, Brooks, H. E., & Maddox, R. A. (1996). Flash flood forecasting: An ingredients-based methodology. Weather and Forecasting, 11, 560–581.
Drobot, S. D., Benight, C., & Gruntfest, E. C. (2007). Risk factors for driving into flooded roads. Environmental Hazards, 7, 227–234.
Ducrocq, V., Nuissier, O., Ricard, D., Lebeaupin, C., & Thouvenin, T. (2008). A numerical study of three catastrophic precipitating events over southern France. II: Mesoscale triggering and stationarity factors. Quarterly Journal of the Royal Meteorological Society, 134, 131–145.
Ebert, E. E. (2008). Fuzzy verification of high-resolution gridded forecasts: A review and proposed framework. Meteorological Applications, 15, 51–64.
Heavy Rainfall and Flash Flooding
Page 29 of 42
PRINTED FROM the OXFORD RESEARCH ENCYCLOPEDIA, NATURAL HAZARD SCIENCE (oxfordre.com/naturalhazardscience). (c) Oxford University Press USA, 2018. All Rights Reserved. Personal use only; commercial use is strictly prohibited (for details see Privacy Policy and Legal Notice).
date: 13 December 2018
Evans, C., Van Dyke, D. F., & Lericos, T. (2014). How do forecasters utilize output from a convection-permitting ensemble forecast system? Case study of a high-impact precipitation event. Weather and Forecasting, 29, 466–486.
Fabry, F., & Sun, J. (2010). For how long should what data be assimilated for the mesoscale forecasting of convection and why? Part I: On the propagation of initial condition errors and their implications for data assimilation. Monthly Weather Review, 138, 242–255.
Frick, J., & Hegg, C. (2011). Can end-users’ flood management decision making be improved by information about forecast uncertainty? Atmospheric Research, 100, 296–303.
Friedrich, K., Kalina, E. A., Aikins, J., Gochis, D., & Rasmussen, R. (2016). Precipitation and cloud structures of intense rain during the 2013 great Colorado flood. Journal of Hydrometeorology, 17, 27–52.
Fritsch, J. M., & Carbone, R. E. (2004). Improving quantitative precipitation forecasts in the warm season: A USWRP research and development strategy. Bulletin of the American Meteorological Society, 85, 955–965.
Fritsch, J. M., Murphy, J. D., & Kain, J. S. (1994). Warm-core vortex amplification over land. Journal of the Atmospheric Sciences, 51, 1780–1807.
Gagne, D. J., II, McGovern, A., & Xue, M. (2014). Machine learning enhancement of storm-scale ensemble probabilistic quantitative precipitation forecasts. Weather Forecasting, 29, 1024–1043.
Galarneau, T. J., Jr., Bosart, L. F., & Schumacher, R. S. (2010). Predecessor rain events ahead of tropical cyclones. Monthly Weather Review, 138, 3272–3297.
Gallus, W. A., Jr. (1999). Eta simulations of three extreme precipitation events: Sensitivity to resolution and convective parameterization. Weather and Forecasting, 14, 405–426.
Gochis, D., Schumacher, R. S., Friedrich, K., Doesken, N., Kelsch, M., Sun, J., et al. (2015).The great Colorado flood of September 2013. Bulletin of the American Meteorological Society, 96, 1461–1487.
Gochis, D. J., Yu, W., & Yates, D. N. (2014). The WRF-Hydro model technical description and user’s guide, version 2.0. NCAR tech. document. Available online at http://www.ral.ucar.edu/projects/wrf_hydro.
Golding, B., Roberts, N., Leoncini, G., Myle, K., & Swinbank, R. (2016). MOGREPS-UK convection-permitting ensemble products for surface water flood forecasting: Rationale and first results. Journal of Hydrometeorology, 17, 1383–1406.
Heavy Rainfall and Flash Flooding
Page 30 of 42
PRINTED FROM the OXFORD RESEARCH ENCYCLOPEDIA, NATURAL HAZARD SCIENCE (oxfordre.com/naturalhazardscience). (c) Oxford University Press USA, 2018. All Rights Reserved. Personal use only; commercial use is strictly prohibited (for details see Privacy Policy and Legal Notice).
date: 13 December 2018
Gourley, J. J., Flamig, Z. L., Vergara, H., Kirstetter, P.-E., Clark, R. A., III, Argyle, E., Arthur, A., et al. (2016). The Flooded Locations And Simulated Hydrographs (FLASH) project: improving the tools for flash flood monitoring and prediction across the United States. Bulletin of the American Meteorological Society.
Gourley, J. J., Hong, Y., Flamig, Z. L., Arthur, A., Clark, R., Calianno, M., et al. (2013). A unified flash flood database across the United States. Bulletin of the American Meteorological Society, 94, 799–805.
Groisman, P. Y., Knight, R. W., & Karl, T. R. (2012). Changes in intense precipitation over the central United States. Journal of Hydrometeorology, 13, 47–66.
Gruntfest, E., & Huber, C. J. (1991). Toward a comprehensive national assessment of flash flooding in the United States. Episodes, 14, 26–34.
Gruntfest, E. C. (1977). What people did during the Big Thompson flood. Urban Drainage and Flood Control District Working Paper 32, http://hermes.cde.state.co.us/drupal/islandora/object/co%3A21896/datastream/OBJ/view.
Hamada, A., Takayabu, Y. N., Liu, C., & Zipser, E. J. (2015). Weak linkage between the heaviest rainfall and tallest storms. Nature Communications, 6, 6213.
Hamill, T. M. (2012). Verification of TIGGE multimodel and ECMWF reforecast-calibrated probabilistic precipitation forecasts over the contiguous United States. Monthly Weather Review, 140, 2232–2252.
Hamill, T. M., Bates, G. T., Whitaker, J. S., Murray, D. R., Fiorino, M., Galarneau, T. J., Jr., et al. (2013). NOAA’s second-generation global medium-range ensemble reforecast dataset. Bulletin of the American Meteorological Society, 94, 1553–1565.
Hamill, T. M., Hagedorn, R., & Whitaker, J. S. (2008). Probabilistic forecast calibration using ECMWF and GFS ensemble reforecasts. Part II: Precipitation. Monthly Weather Review, 136, 2620–2632.
Hamill, T. M., Whitaker, J. S., & Mullen, S. L. (2006). Reforecasts: An important dataset for improving weather predictions. Bulletin of the American Meteorological Society, 87, 33–46.
Hamill, T. M., Whitaker, J. S., & Wei, X. (2004). Ensemble reforecasting: Improving medium-range forecast skill using retrospective forecasts. Monthly Weather Review, 132, 1434–1447.
Hardy, J., Gourley, J. J., Kirstette, P.-E., Hong, Y., Kong, F., & Flamig, Z. L. (2016). A method for probabilistic flash flood forecasting. Journal of Hydrology.
Hart, R. E., & Grumm, R. H. (2001). Using normalized climatological anomalies to rank synoptic-scale events objectively. Monthly Weather Review, 129, 2426–2442.
Heavy Rainfall and Flash Flooding
Page 31 of 42
PRINTED FROM the OXFORD RESEARCH ENCYCLOPEDIA, NATURAL HAZARD SCIENCE (oxfordre.com/naturalhazardscience). (c) Oxford University Press USA, 2018. All Rights Reserved. Personal use only; commercial use is strictly prohibited (for details see Privacy Policy and Legal Notice).
date: 13 December 2018
Hayden, M. H., Drobot, S., Radil, S., Benight, C., Gruntfest, E. C., & Barnes, L. R. (2007). Information sources for flash flood warnings in Denver, CO and Austin, TX. Environmental Hazards, 7, 211–219.
Herman, G. R., & Schumacher, R. S. (2016). Extreme precipitation in models: An evaluation. Weather and Forecasting.
Hopson, T. M., & Webster, P. J. (2010). A 1–10-day ensemble forecasting scheme for the major river basins of Bangladesh: Forecasting severe floods of 2003–07. Journal of Hydrometeorology, 11, 618–641.
Houze, R. A., Jr. (2004). Mesoscale convective systems. Reviews of Geophysics, 42, RG4003.
Hoxit, L. R., Maddox, R. A., Chappell, C. F., Zuckerberg, F. L., Mogil, H. M., Jones, I., et al. (1978). Meteorological analysis of the Johnstown, Pennsylvania, flash flood. NOAA Technical Report ERL 401–APCL 43.
Iyer, E. R., Clark, A. J., Xue, M., & Kong, F. (2016). A comparison of 36–60-h precipitation forecasts from convection-allowing and convection-parameterizing ensembles. Weather and Forecasting, 31, 647–661.
Johns, R. H., & Doswell, C. A. III (1992). Severe local storms forecasting. Weather and Forecasting, 7, 588–612.
Jonkman, S. N. (2005). Global perspectives on loss of human life caused by floods. Natural Hazards, 34, 151–175.
Joslyn, S., Nadav-Greenberg, L., & Nichols, R. M. (2009). Probability of precipitation: Assessment and enhancement of end-user understanding. Bulletin of the American Meteorological Society, 90, 185–193.
Joslyn, S., & Savelli, S. (2010). Communicating forecast uncertainty: Public perception of weather forecast uncertainty. Meteorological Applications, 17, 180–195.
Junker, N. W., Grumm, R. H., Hart, R., Bosart, L. F., Bell, K. M., & Pereira, F. J. (2008). Use of normalized anomaly fields to anticipate extreme rainfall in the mountains of northern California. Weather and Forecasting, 23, 336–356.
Junker, N. W., Schneider, R. S., & Fauver, S. L. (1999). A study of heavy rainfall events during the Great Midwest Flood of 1993. Weather and Forecasting, 14, 701–712.
Kato, T., & Goda, H. (2001). Formation and maintenance processes of a stationary band-shaped heavy rainfall observed in Niigata on 4 August 1998. Journal of the Meteorological Society of Japan, 79, 899–924.
Heavy Rainfall and Flash Flooding
Page 32 of 42
PRINTED FROM the OXFORD RESEARCH ENCYCLOPEDIA, NATURAL HAZARD SCIENCE (oxfordre.com/naturalhazardscience). (c) Oxford University Press USA, 2018. All Rights Reserved. Personal use only; commercial use is strictly prohibited (for details see Privacy Policy and Legal Notice).
date: 13 December 2018
Kellar, D. M. M., & Schmidlin, T. W. (2012). Vehicle-related flood deaths in the United States, 1995–2005. Journal of Flood Risk Management, 5, 153–163.
Krajewski, W. F., Ceynar, D., Demir, I., Goska, R., Kruger, A., Langel, C., et al. (2016). Real-time flood forecasting and information system for the state of Iowa. Bulletin of the American Meteorological Society, in press.
Kunkel, K. E., Karl, T. R., Brooks, H., Kossin, J., Lawrimore, J. H., Arndt, D., et al. (2013). Monitoring and understanding trends in extreme storms: State of knowledge. Bulletin of the American Meteorological Society, 94, 499–514.
Lackmann, G. M. (2002). Cold-frontal potential vorticity maxima, the low-level jet, and moisture transport in extratropical cyclones. Monthly Weather Review, 130, 59–74.
Lackmann, G. M. (2013). The South-Central US flood of May 2010: Present and future. Journal of Climate, 26, 4688–4709.
Lackmann, G. M., & Gyakum, J. R. (1999). Heavy cold-season precipitation in the northwestern United States: Synoptic climatology and an analysis of the flood of 17–18 January 1986. Weather and Forecasting, 14, 687–700.
Lavers, D. A., Villarini, G., Allan, R. P., Wood, E. F., & Wade, A. J. (2012). The detection of atmospheric rivers in atmospheric reanalyses and their links to British winter floods and the large-scale climatic circulation. Journal of Geophysical Research, 117, D20106.
Lavers, D. A., Waliser, D. E., Ralph, F. M., & Dettinger, M. D. (2016). Predictability of horizontal water vapor transport relative to precipitation: Enhancing situational awareness for forecasting western U.S. extreme precipitation and flooding. Geophysical Research Letters, 43, 2275–2282.
Lazrus, H., Morss, R. E., Demuth, J. L., Lazo, J. K., & Bostrom, A. (2016). “Know what to do if you encounter a flash flood”: Mental models analysis for improving flash flood risk communication and public decision making. Risk Analysis, 36, 411–427.
Lee, T.-Y., & Kim, Y.-H. (2007). Heavy precipitation systems over the Korean Peninsula and their classification. Journal of the Korean Meteorological Society, 43, 367–396.
Lemon, L. R., & Doswell, C. A. III (1979). Severe thunderstorm evolution and mesocyclone structure as related to tornadogenesis. Monthly Weather Review, 107, 1184–1197.
Leon, D. C., French, J. R., Lasher-Trapp, S., Blyth, A. M., Abel, S. J., Ballard, S., et al. (2016). The Convective Precipitation Experiment (COPE): Investigating the origins of heavy precipitation in the southwestern United Kingdom. Bulletin of the American Meteorological Society, 97, 1003–1020.
Heavy Rainfall and Flash Flooding
Page 33 of 42
PRINTED FROM the OXFORD RESEARCH ENCYCLOPEDIA, NATURAL HAZARD SCIENCE (oxfordre.com/naturalhazardscience). (c) Oxford University Press USA, 2018. All Rights Reserved. Personal use only; commercial use is strictly prohibited (for details see Privacy Policy and Legal Notice).
date: 13 December 2018
Lorenz, E. N. (1969). The predictability of a flow which possesses many scales of motion. Tellus, 21, 289–307.
Luo, Y., & Chen, Y. (2015). Investigation of the predictability and physical mechanisms of an extreme-rainfall-producing mesoscale convective system along the meiyu front in East China: An ensemble approach. Journal of Geophysical Research, 120, 10593–10618.
Luo, Y., Gong, Y., & Zhang, D.-L. (2014). Initiation and organizational modes of an extreme-rain-producing mesoscale convective system along a mei-yu front in east China. Monthly Weather Review, 142, 203–221.
Lutoff, C., Creutin, J.-D., Ruin, I., & Borga, M. (2016). Anticipating flash-floods: Multi-scale aspects of the social response. Journal of Hydrology, 541, 626–635.
Maddox, R. A., Chappell, C. F., & Hoxit, L. R. (1979). Synoptic and mesoscale aspects of flash flood events. Bulletin of the American Meteorological Society, 60, 115–123.
Maddox, R. A., Hoxit, L. R., Chappell, C. F., & Caracena, F. (1978). Comparison of meteorological aspects of the Big Thompson and Rapid City flash floods. Monthly Weather Review, 106, 375–389.
Mahoney, K., Alexander, M., Scott, J., & Barsugli, J. (2013). High-resolution downscaled simulations of warm-season extreme precipitation events in the Colorado Front Range under past and future climates. Journal of Climate, 26, 8671–8689.
Mahoney, K. M., Jackson, D. L., Neiman, P., Hughes, M., Darby, L., Wick, G., et al. (2016). Understanding the role of atmospheric rivers in heavy precipitation in the southeast United States. Monthly Weather Review, 144, 1617–1632.
Market, P., Allen, S., Scofield, R., Kuligowski, R., & Gruber, A. (2003). Precipitation efficiency of warm-season midwestern mesoscale convective systems. Weather and Forecasting, 18, 1273–1285.
Markowski, P., & Richardson, Y. (2010). Mesoscale meteorology in midlatitudes. Wiley-Blackwell.
Marsh, P. T., Kain, J. S., Lakshmanan, V., Clark, A. J., Hitchens, N. M., & Hardy, J. (2012). A method for calibrating deterministic forecasts of rare events. Weather Forecasting, 27, 531–538.
McCaul, E. W., Jr., Cohen, C., & Kirkpatrick, C. (2005). The sensitivity of simulated storm structure, intensity, and precipitation efficiency to environmental temperature. Monthly Weather Review, 133, 3015–3037.
Heavy Rainfall and Flash Flooding
Page 34 of 42
PRINTED FROM the OXFORD RESEARCH ENCYCLOPEDIA, NATURAL HAZARD SCIENCE (oxfordre.com/naturalhazardscience). (c) Oxford University Press USA, 2018. All Rights Reserved. Personal use only; commercial use is strictly prohibited (for details see Privacy Policy and Legal Notice).
date: 13 December 2018
Melhauser, C., & Zhang, F. (2012). Practical and intrinsic predictability of severe and convective weather at the mesoscales. Journal of the Atmospheric Sciences, 69, 3350–3371.
Meng, Z., & Zhang, Y. (2012). On the squall lines preceding landfalling tropical cyclones in China. Monthly Weather Review, 140, 445–470.
Miller, M. J. (1978). The Hampstead storm: A numerical simulation of a quasi-stationary cumulonimbus system. Quarterly Journal of the Royal Meteorological Society, 104, 413–427.
Milrad, S. M., Gyakum, J. R., & Atallah, E. H. (2015). A meteorological analysis of the 2013 Alberta flood: Antecedent large-scale flow pattern and synopticdynamic characteristics. Monthly Weather Review, 143, 2817–2841.
Moller, A. R., Doswell, C. A., Foster, M. P., & Woodall, G. R. (1994). The operational recognition of supercell thunderstorm environments and storm structures. Weather and Forecasting, 9, 327–347.
Moore, B. J., Bosart, L. F., Keyser, D., & Jurewicz, M. L. (2013). Synoptic-scale environments of predecessor rain events occurring east of the Rocky Mountains in association with Atlantic basin tropical cyclones. Monthly Weather Review, 141, 1022–1047.
Moore, B. J., Neiman, P. J., Ralph, F. M., & Barthold, F. E. (2012). Physical processes associated with heavy flooding rainfall in Nashville, Tennessee, and vicinity during 1–2 May 2010: The role of an atmospheric river and mesoscale convective systems. Monthly Weather Review, 140, 358–378.
Morales, A., Schumacher, R. S., & Kreidenweis, S. M. (2015). Mesoscale vortex development during extreme precipitation: Colorado, September 2013. Monthly Weather Review, 143, 4943–4962.
Morss, R. E., Demuth, J. L., & Lazo, J. K. (2008). Communicating uncertainty in weather forecasts: A survey of the U.S. public. Weather and Forecasting, 23, 974–991.
Morss, R. E., Lazo, J. K., & Demuth, J. L. (2010). Examining the use of weather forecasts in decision scenarios: Results from a US survey with implications for uncertainty communication. Meteorological Applications, 17, 149–162.
Nair, U. S., Hjelmfelt, M. R., & Pielke, R. A., Sr. (1997). Numerical simulation of the 9–10 June 1972 Black Hills storm using CSU RAMS. Monthly Weather Review, 125, 1753–1766.
National Research Council. (2010). When weather matters: Science and services to meet critical societal needs. National Academies Press. Washington, DC.
Heavy Rainfall and Flash Flooding
Page 35 of 42
PRINTED FROM the OXFORD RESEARCH ENCYCLOPEDIA, NATURAL HAZARD SCIENCE (oxfordre.com/naturalhazardscience). (c) Oxford University Press USA, 2018. All Rights Reserved. Personal use only; commercial use is strictly prohibited (for details see Privacy Policy and Legal Notice).
date: 13 December 2018
National Research Council. (2016). Attribution of extreme weather events in the context of climate change. National Academies Press, Washington, DC.
National Weather Service. (2011). Service assessment: Record floods of Greater Nashville: Including flooding in middle Tennessee and western Kentucky, May 1–4, 2010. Available online at http://www.nws.noaa.gov/om/assessments/pdfs/Tenn_Flooding.pdf.
National Weather Service. (2014). Service assessment: May 2013 Oklahoma tornadoes and flash flooding. Available online at http://www.nws.noaa.gov/om/assessments/pdfs/13oklahoma_tornadoes.pdf.
Neiman, P. J., Schick, J. L., Ralph, F. M., Hughes, M., & Wick, G. A. (2011). Flooding in western Washington: The connection to atmospheric rivers. Journal of Hydrometeorology, 12, 1337–1358.
Nielsen, E. R., Herman, G. R., Tournay, R. C., Peters, J. M., & Schumacher, R. S. (2015). Double impact: When both tornadoes and flash floods threaten the same place at the same time. Weather and Forecasting, 30, 1673–1693.
Nielsen, E. R., & Schumacher, R. S. (2016). Using convection-allowing ensembles to understand the predictability of an extreme rainfall event. Monthly Weather Review, 144, 3651–3676.
NOAA. (cited 2016). Natural hazard statistics. Available online at http://www.nws.noaa.gov/om/hazstats.shtml.
Pall, P., Allen, M. R., & Stone, D. A. (2007). Testing the Clausius-Clapeyron constraint on changes in extreme precipitation under CO warming. Climate Dynamics, 28, 351–363.
Parker, M. D., & Johnson, R. H. (2000). Organizational modes of midlatitude mesoscale convective systems. Monthly Weather Review, 128, 3413–3436.
Petersen, W. A., Carey, L. D., Rutledge, S. A., Knievel, J. C., Johnson, R. H., Doesken, N. J., et al. (1999). Mesoscale and radar observations of the Fort Collins flash flood of 28 July 1997. Bulletin of the American Meteorological Society, 80, 191–216.
Piaget, N., Froidevaux, P., Giannakaki, P., Gierth, F., Martius, O., Riemer, M., et al. (2015). Dynamics of a local Alpine flooding event in October 2011: Moisture source and large-scale circulation. Quarterly Journal of the Royal Meteorological Society, 141, 1922–1937.
Pontrelli, M. D., Bryan, G., & Fritsch, J. M. (1999). The Madison County, Virginia, flash flood of 27 June 1995. Weather and Forecasting, 14, 384–404.
2
Heavy Rainfall and Flash Flooding
Page 36 of 42
PRINTED FROM the OXFORD RESEARCH ENCYCLOPEDIA, NATURAL HAZARD SCIENCE (oxfordre.com/naturalhazardscience). (c) Oxford University Press USA, 2018. All Rights Reserved. Personal use only; commercial use is strictly prohibited (for details see Privacy Policy and Legal Notice).
date: 13 December 2018
Prokop, P., & Walanus, A. (2015). Variation in the orographic extreme rain events over the Meghalaya Hills in northeast India in the two halves of the twentieth century. Theoretical and Applied Climatology, 121, 389–399.
Rajczak, J., Pall, P., & Schär, C. (2013). Projections of extreme precipitation events in regional climate simulations for Europe and the Alpine Region. Journal of Geophysical Research, 118, 3610-3626.
Ralph, F. M., & Dettinger, M. D. (2011). Storms, floods, and the science of atmospheric rivers. Eos, Transactions of the American Geophysical Union, 92, 265–267.
Ralph, F. M., & Dettinger, M. D. (2012). Historical and national perspectives on extreme West Coast precipitation associated with atmospheric rivers during December 2010. Bulletin of the American Meteorological Society, 93, 783–790.
Ralph, F. M., Neiman, P. J., Kiladis, G. N., Weickmann, K., & Reynolds, D. W. (2011). A multiscale observational case study of a Pacific atmospheric river exhibiting tropical-extratropical connections and a mesoscale frontal wave. Monthly Weather Review, 139, 1169–1189.
Ralph, F. M., Neiman, P. J., Wick, G. A., Gutman, S. I., Dettinger, M. D., Cayan, D. R., & White, A. B. (2006). Flooding on California’s Russian River: Role of atmospheric rivers. Geophysical Research Letters, 33, L13801.
Rasmussen, K. L., & Houze, R. A., Jr. (2012). A flash-flooding storm at the steep edge of high terrain: Disaster in the Himalayas. Bulletin of the American Meteorological Society, 93, 1713–1724.
Raymond, D. J., & Jiang, H. (1990). A theory for long-lived mesoscale convective systems. Journal of the Atmospheric Sciences, 47, 3067–3077.
Ricard, D., Ducrocq, V., & Auger, L. (2012). A climatology of the mesoscale environment associated with heavily precipitating events over a northwestern Mediterranean area. Journal of Applied Meteorology and Climatology, 51, 468–488.
Roberts, N. M., & Lean, H. W. (2008). Scale-selective verification of rainfall accumulations from high-resolution forecasts of convective events. Monthly Weather Review, 136, 78–97.
Rogers, R., Marks, F., & Marchok, T. (2009). Tropical cyclone rainfall. Encyclopedia of Hydrological Sciences (Vol. 3).
Rowe, S. T., & Villarini, G. (2013). Flooding associated with predecessor rain events over the Midwest United States. Environmental Research. Letters, 8, 024007.
Ruin, I., Gaillard, J.-C., & Lutoff, C. (2007). How to get there? Assessing motorists’ flash flood risk perception on daily itineraries. Environmental Hazards, 7.
Heavy Rainfall and Flash Flooding
Page 37 of 42
PRINTED FROM the OXFORD RESEARCH ENCYCLOPEDIA, NATURAL HAZARD SCIENCE (oxfordre.com/naturalhazardscience). (c) Oxford University Press USA, 2018. All Rights Reserved. Personal use only; commercial use is strictly prohibited (for details see Privacy Policy and Legal Notice).
date: 13 December 2018
Ruin, I., Lutoff, C., Boudevillain, B., Creutin, J.-D., Anquetin, S., Rojo, M. B., et al. (2014). Social and hydrological responses to extreme precipitations: An interdisciplinary strategy for postflood investigation. Weather, Climate, and Society, 6, 135–153.
Ruin, I., Lutoff, C., Creton-Cazanave, L., Anquetin, S., Borga, M., Chardonnel, S., et al. (2012). Toward a space-time framework for integrated water and society studies. Bulletin of the American Meteorological Society, 93, ES89–ES91.
Ryan, T. M., & Vitale, J. D. (2008). Operational recognition of high precipitation efficiency and low echo centroid convection. In Extended Abstracts, 24th Conference on Severe Local Storms (American Meterological Society, Savannah, GA. Available online at https://ams.confex.com/ams/pdfpapers/141601.pdf.
Schroeder, A., Basara, J., Shepherd, J. M., & Nelson, S. (2016a). Insights into atmospheric contributors to urban flash flooding across the United States using an analysis of rawinsonde data and associated calculated parameters. Journal of Applied Meteorology and Climatology, 55, 313–323.
Schroeder, A. J., Gourley, J. J., Hardy, J., Henderson, J. J., Parhi, P., Rahmani, V., et al. (2016b). The development of a flash flood severity index. Journal of Hydrology, 541, 523–532.
Schumacher, R. S. (2015). Sensitivity of precipitation accumulation in elevated convective systems to small changes in low-level moisture. Journal of the Atmospheric Sciences, 72, 2507–2524.
Schumacher, R. S. (2016). The Studies of Precipitation, flooding, and Rainfall Extremes Across Disciplines (SPREAD) workshop: An interdisciplinary research and education initiative. Bulletin of the American Meteorological Society, 97, 1791–1796,
Schumacher, R. S., Clark, A. J., Xue, M., & Kong, F. (2013). Factors influencing the development and maintenance of nocturnal heavy-rain-producing convective systems in a storm-scale ensemble. Monthly Weather Review, 141, 2778–2801.
Schumacher, R. S., & Davis, C. A. (2010). Ensemble-based forecast uncertainty analysis of diverse heavy rainfall events. Weather and Forecasting, 25, 1103–1122.
Schumacher, R. S., & Galarneau, T. J., Jr. (2012). Moisture transport into midlatitudes ahead of recurving tropical cyclones and its relevance in two predecessor rain events. Monthly Weather Review, 140, 1810–1827.
Schumacher, R. S., Galarneau, T. J., Jr., & Bosart, L. F. (2011). Distant effects of a recurving tropical cyclone on rainfall in a midlatitude convective system: A high-impact predecessor rain event. Monthly Weather Review, 139, 650–667.
Heavy Rainfall and Flash Flooding
Page 38 of 42
PRINTED FROM the OXFORD RESEARCH ENCYCLOPEDIA, NATURAL HAZARD SCIENCE (oxfordre.com/naturalhazardscience). (c) Oxford University Press USA, 2018. All Rights Reserved. Personal use only; commercial use is strictly prohibited (for details see Privacy Policy and Legal Notice).
date: 13 December 2018
Schumacher, R. S., & Johnson, R. H. (2005). Organization and environmental properties of extreme-rain-producing mesoscale convective systems. Monthly Weather Review, 133, 961–976.
Schumacher, R. S., & Johnson, R. H. (2006). Characteristics of United States extreme rain events during 1999–2003. Weather and Forecasting, 21, 69–85.
Schumacher, R. S., & Johnson, R. H. (2008). Mesoscale processes contributing to extreme rainfall in a midlatitude warm-season flash flood. Monthly Weather Review, 136, 3964–3986.
Schumacher, R. S., & Johnson, R. H. (2009). Quasi-stationary, extreme-rain-producing convective systems associated with midlevel cyclonic circulations. Weather and Forecasting, 24, 555–574.
Schwartz, B. E., Chappell, C. F., Togstad, W. E., & Zhong, X.-P. (1990). The Minneapolis flash flood: Meteorological analysis and operational response. Weather and Forecasting, 5, 3–21.
Schwartz, C. S., & Coauthors. (2010). Toward improved convection-allowing ensembles: Model physics sensitivities and optimizing probabilistic guidance with small ensemble membership. Weather and Forecasting, 25, 263–280.
Schwartz, C. S., Kain, J. S., Weiss, S. J., Xue, M., Bright, D. R., Kong, F., et al. (2009). Next-day convection-allowing WRF model guidance: A second look at 2-km versus 4-km grid spacing. Monthly Weather Review, 137, 3351–3372.
Schwartz, C. S., Romine, G. S., Sobash, R. A., Fossell, K. R., & Weisman, M. L. (2015). NCAR’s experimental real-time convection-allowing ensemble prediction system. Weather and Forecasting, 30, 1645–1654.
Smith, J. A., Baeck, M. L., Zhang, Y., & Doswell, C. A. (2001). Extreme rainfall and flooding from supercell thunderstorms. Journal of Hydrometeorology, 2, 469–489.
Sodemann, H., Wernli, H., & Schweirz, C. (2009). Sources of water vapour contributing to the Elbe flood in August 2002: A tagging study in a mesoscale model. Quarterly Journal of the Royal Meteorological Society, 135, 205–223.
Spuler, S. M., Repasky, K. S., Morley, B., Moen, D., Hayman, M., & Nehrir, A. R. (2015). Field-deployable diode-laser-based differential absorption lidar (dial) for profiling water vapor. Atmospheric Measurement Techniques, 8, 1073–1087.
Stevenson, S. N., & Schumacher, R. S. (2014). A 10-year survey of extreme rainfall events in the central and eastern United States using gridded multisensor precipitation analyses. Monthly Weather Review, 142, 3147–3162.
Heavy Rainfall and Flash Flooding
Page 39 of 42
PRINTED FROM the OXFORD RESEARCH ENCYCLOPEDIA, NATURAL HAZARD SCIENCE (oxfordre.com/naturalhazardscience). (c) Oxford University Press USA, 2018. All Rights Reserved. Personal use only; commercial use is strictly prohibited (for details see Privacy Policy and Legal Notice).
date: 13 December 2018
Stewart, A. E., Williams, C. A., Phan, M. D., Horst, A. L., Knox, E. D., & Knox, J. A. (2016). Through the eyes of the experts: Meteorologists’ perceptions of the probability of precipitation. Weather and Forecasting, 31, 5–17.
Stohl, A., Forster, C., & Sodemann, H. (2008). Remote sources of water vapor forming precipitation on the Norwegian west coast at 60 N: A tale of hurricanes and an atmospheric river. Journal of Geophysical Research, 113, D05102.
Sukovich, E. M., Ralph, F. M., Barthold, F. E., Reynolds, D. W., & Novak, D. R. (2014). Extreme quantitative precipitation forecast performance at the Weather Prediction Center from 2001 to 2011. Weather and Forecasting, 29, 894–911.
Takemi, T. (2010). Dependence of the precipitation intensity in mesoscale convective systems to temperature lapse rate. Atmospheric Research, 96, 273–285.
Tennant, W. (2015). Improving initial condition perturbations for MOGREPS-UK. Quarterly Journal of the Royal Meteorological Society, 141, 2324–2336.
Thielen, J., Bartholmes, J., Ramos, M.-H., & de Roo, A. (2009a). The European flood alert system—Part 1: concept and development. Hydrology and Earth System Sciences, 13, 125–140.
Thielen, J., Bogner, K., Pappenberger, F., Kalas, M., del Medico, M., & de Roo, A. (2009b). Monthly, medium-, and short-range flood warning: Testing the limits of predictability. Meteorological Applications, 16, 77–90.
Thompson, P. D. (1957). Uncertainty of initial state as a factor in the predictability of large-scale atmospheric flow patterns. Tellus, 9, 275–295.
Trier, S. B., & Davis, C. A. (2002). Influence of balanced motions on heavy precipitation within a long-lived convectively generated vortex. Monthly Weather Review, 130, 877–899.
Trier, S. B., Davis, C. A., & Tuttle, J. D. (2000). Long-lived mesoconvective vortices and their environment. Part I: Observations from the central United States during the 1998 warm season. Monthly Weather Review, 128, 3376–3395.
Turner, D. D., & Löhnert, U. (2014). Information content and uncertainties in thermodynamic profiles and liquid cloud properties retrieved from the ground-based Atmospheric Emitted Radiance Interferometer (AERI). Journal of Applied Meteorology and Climatology, 53, 752–771.
van der Ent, R. J., & Savenije, H. H. G. (2011). Length and time scales of atmospheric moisture recycling. Atmospheric Chemistry and Physics, 11, 1853–1863.
∘
Heavy Rainfall and Flash Flooding
Page 40 of 42
PRINTED FROM the OXFORD RESEARCH ENCYCLOPEDIA, NATURAL HAZARD SCIENCE (oxfordre.com/naturalhazardscience). (c) Oxford University Press USA, 2018. All Rights Reserved. Personal use only; commercial use is strictly prohibited (for details see Privacy Policy and Legal Notice).
date: 13 December 2018
Vincendon, B., Ducrocq, V., Nuissier, O., & Vié, B. (2011). Perturbation of convection-permitting NWP forecasts for flash-flood ensemble forecasting. Natural Hazards and Earth System. Sciences, 11, 1529–1544.
Wang, C.-C., Kuo, H.-C., Johnson, R. H., Lee, C.-Y., Huang, S.-Y., & Chen, Y.-H. (2015). A numerical study of convection in rainbands of Typhoon Morakot (2009) with extreme rainfall: Roles of pressure perturbations with low-level wind maxima. Atmospheric Chemistry and Physics, 15, 11097–11115.
Weisman, M. L., Davis, C., Wang, W., Manning, K. W., & Klemp, J. B. (2008). Experiences with 0–36-h explicit convective forecasts with the WRF-ARW model. Weather and Forecasting, 23, 407–437.
Westra, S., Alexander, L. V., & Zweirs, F. W. (2013). Global increasing trends in annual maximum daily precipitation. Journal of Climate, 26, 3904–3918.
Westra, S., Fowler, H. J., Evans, J. P., Alexander, L. V., Berg, P., Johnson, F., et al. (2014). Future changes to the intensity and frequency of short-duration extreme rainfall. Reviews of Geophysics, 52, 522–555.
Wilhelmi, O. V., & Morss, R. E. (2013). Integrated analysis of societal vulnerability in an extreme precipitation event: A Fort Collins case study. Environmental Science and Policy, 26, 49–62.
Yoshizaki, M., & Ogura, Y. (1988). Two-and three-dimensional modelling studies of the Big Thompson storm. Journal of the Atmospheric Sciences, 45, 3700–3722.
Zappa, M., Rotach, M. W., Arpagaus, M., Dorninger, M., Hegg, C., Montani, A., et al. (2008). MAP D-PHASE: Real-time demonstration of hydrological ensemble prediction systems. Atmospheric Science Letters, 9, 80–87.
Zhang, D.-L., & Fritsch, J. M. (1986). Numerical simulation of the meso-scale structure and evolution of the 1977 Johnstown flood. Part I: Model description and verification. Journal of the Atmospheric Sciences, 43, 1913–1944.
Zhang, D.-L., & Fritsch, J. M. (1987). Numerical simulation of the meso-scale structure and evolution of the 1977 Johnstown flood. Part II: Inertially stable warm-core vortex and the mesoscale convective complex. Journal of the Atmospheric Sciences, 44, 2593–2612.
Zhang, D.-L., & Fritsch, J. M. (1988). Numerical simulation of the meso-scale structure and evolution of the 1977 Johnstown flood. Part III: Internal gravity waves and the squall line. Journal of the Atmospheric Sciences, 45, 1252–1268.
Zhang, F., Odins, A. M., & Nielsen-Gammon, J. W. (2006). Mesoscale predictability of an extreme warm-season precipitation event. Weather and Forecasting, 21, 149–166.
Heavy Rainfall and Flash Flooding
Page 41 of 42
PRINTED FROM the OXFORD RESEARCH ENCYCLOPEDIA, NATURAL HAZARD SCIENCE (oxfordre.com/naturalhazardscience). (c) Oxford University Press USA, 2018. All Rights Reserved. Personal use only; commercial use is strictly prohibited (for details see Privacy Policy and Legal Notice).
date: 13 December 2018
Zhang, F., Snyder, C., & Rotunno, R. (2003). Effects of moist convection on mesoscale predictability. Journal of the Atmospheric Sciences, 60, 1173–1185.
Zhang, J., Howard, K., Langston, C., Kaney, B., Qi, Y., Tang, L., et al. (2016). Multi-Radar Multi-Sensor (MRMS) quantitative precipitation estimation: Initial operating capabilities. Bulletin of the American Meteorological Society, 97, 621–638.
Zhang, M., & Zhang, D.-L. (2012). Subkilometer simulation of a torrential-rain-producing mesoscale convective system in East China. Part I: Model verification and convective organization. Monthly Weather Review, 140, 184–201.
Zhu, Y., & Newell, R. E. (1998). A proposed algorithm for moisture fluxes from atmospheric rivers. Monthly Weather Review, 126, 725–735.
Notes:
(1.) The atmospheric “mesoscale” represents intermediate scales of motion: larger than microscale processes, such as turbulence and thermals, and smaller than synoptic-scale processes, such as extratropical cyclones. See Markowski and Richardson (2010) for detailed definitions of the mesoscale.
(2.) This statement is attributed to C. F. Chappell, and is sometimes referred to as the “first law of quantitative precipitation forecasting.”
(3.) The low percentage for tropical cyclones is somewhat misleading, because a single landfalling tropical cyclone usually produces extreme rainfall over a much larger area than a single MCS. See Rogers et al. (2009) for an overview of rainfall from tropical cyclones.
(4.) The HRRR model was made operational in the United States in February 2014, and is considered the state-of-the-art prediction system for short-term forecasts of convection. The HRRRx is the experimental version that was being prepared for operational deployment in August 2016.
(5.) For a more thorough treatment of the influences of climate change on extreme weather, see Kunkel et al. (2013) and National Research Council (2016).
Russ S. Schumacher
Department of Atmospheric Science, Colorado State University
Heavy Rainfall and Flash Flooding
Page 42 of 42
PRINTED FROM the OXFORD RESEARCH ENCYCLOPEDIA, NATURAL HAZARD SCIENCE (oxfordre.com/naturalhazardscience). (c) Oxford University Press USA, 2018. All Rights Reserved. Personal use only; commercial use is strictly prohibited (for details see Privacy Policy and Legal Notice).
date: 13 December 2018