the liquidity crunch in quant equities - federal · pdf filethe liquidity crunch in quant...
TRANSCRIPT

The Liquidity Crunch in Quant EquitiesAnalysis and Implications
December 13, 2007
This material is provided for educational purposes only and should not be construed as investment advice or an offer or solicitation to buy or sell securities.
2
Agenda
A. What do quantitative investors do?
B. The liquidity crunch of August 2007
C. Implications for the future
Appendix

3
What do quants do?
1 Standard DeviationStandard deviation is a statistical measure of the degree to which an individual value in a probability distribution deviates from the mean of the distribution. The above information is as of December 16, 2005. GSAM portfolio holdings are not stagnant and may change over time without prior notice. Source: Goldman Sachs. Please see appendix for other important disclosures.
• Identify fundamental return-driving factors
• Create portfolios with optimal exposures to those factors
• Identify and hedge exposures to risk factors
• Use optimizers to make trade-offs
⎯ Seek to maximize expected returns, net of expected trading costs, subject to a risk budget
Global Equity Opportunities, Plc
0.0%
10.0%
20.0%
30.0%
ConsumerDiscretionary
Consumer Staples Energy Financials Healthcare Industrials InformationTechnology
Materials Telecommunications Utilities
Long exposure Short exposure
0.00
0.20
0.40
0.60
0.80
1.00
1.20
AnalystSentiment
Valuation Momentum Profitability EarningsQuality
ManagementImpact
Volatility Size TradingActivity
Growth
Net
Exp
osur
e1
Return factors Risk factors
4
Alpha/beta separation
We search for alpha in many places:
• Global stock selection
• Relative value strategies in currencies; fixed income and equity indices
• Timing strategies in stocks, bonds, and other indices
• Strategies in commodities, volatilities, credit, correlations, yield curves, emerging markets, and insurance
• Over 2 dozen strategies in total

5
Fundamentals drive alpha
Valuation
How is the company priced relative to fundamental accounting measures?
Sample Metric:Book-to-price ratio
Analyst Sentiment
Are analysts upgrading or downgrading their view of this company?
Sample Metric:Earnings forecast revisions
Momentum
How has the market responded to the company’s changing fortunes?
Sample Metric:Price momentum
Management Impact
How is the company’s management employing its capital?
Sample Metric:Change in shares outstanding
Profitability
What are the company’s profit margins? How efficient are its operations?
Sample Metric:Earnings-to-sales ratio
Earnings Quality
Were earnings derived from sustainable sources?
Sample Metric:Accruals-to-total-assets
XYZ Co.Alpha

6
The quant explosion
• Quants started in low-risk enhanced-index and GTAA strategies (1980s)
• Success lead to imitation, extensions and growth (1990s):
⎯ Expanded into high-risk, levered hedge funds
⎯ Statistical arbitrage managers added low-frequency fundamental factors
• Assets in all parts of the space grew rapidly (2000s)
For illustrative purposes only. The chart on the left shows selected hedge fund assets and selected active quantitative manager assets as a percentage of the Russell 3000 Index. The universe of managers examined were those institutions filing holdings data with 13Fs which were picked up in the Thomson ownership database. We screened for Quantitative Managers who we consider our main competitors and other factors we deemed relevant. The chart on the right shows the growth in GQE assets. Total GQE assets includes both market neutral assets and long only assets. GQE market neutral assets also includes long/short (Flex) assets. Long only assets and market neutral assets have been scaled based on tracking error.
0.0%
1.0%
2.0%
3.0%
4.0%
5.0%
6.0%
7.0%
Mar
-97
Mar
-98
Mar
-99
Mar
-00
Mar
-01
Mar
-02
Mar
-03
Mar
-04
Mar
-05
Mar
-06
Mar
-07
Perc
ent o
f mar
ket
Selected Quantitative Hedge FundsSelected Active Quantitative Managers
Growth in GQE AUM in equivalent notionals
0.00%
0.20%
0.40%
0.60%
0.80%
1.00%
1.20%
1.40%
1.60%
2002 2003 2004 2005 2006 Jun-07
Perc
ent o
f mar
ket
Total GQE assetsGQE long only assetsGQE market neutral assets

7
The liquidity crunch of August 2007

8
What happened?
• Sub-prime mortgage market disruption
⎯ Starts January 2007; Substantial acceleration in June 2007
• Spillover to investment-grade credit markets shortly thereafter
• Spillover to yen carry trade
• Spillover to US quant equity strategies, and then international quant strategies in early August
Contagion – YTD 2007 Theme returns by region (August 1 - August 10, 2007)*
For illustrative purposes only. Contagion graph source: ABX BBB-Tranch closing price, ABX A, USD/Yen exchange rate (PACE). Theme returns source: Goldman Sachs Asset Management (PACE).*Theme returns are shown as of August 1 – 9 for the US and as of August 1 – 10 for Europe ex-UK, UK and Japan.
-25
-20
-15
-10
-5
0
Valuation Profitability Momentum ManagementImpact
AnalystSentiment
EarningsQuality
Nor
mal
ized
ret
urns
(sta
ndar
d de
viat
ion)
US Europe ex-UK UK Japan
50.00
60.00
70.00
80.00
90.00
100.00
110.00
Jan-
07
Feb-
07
Mar
-07
Apr
-07
May
-07
Jun-
07
Jul-0
7
Aug
-07
Clo
sing
Pric
e
110.00
112.00
114.00
116.00
118.00
120.00
122.00
124.00
126.00
Exch
ange
Rat
e
Investment GradeSub primeYen Carry
9
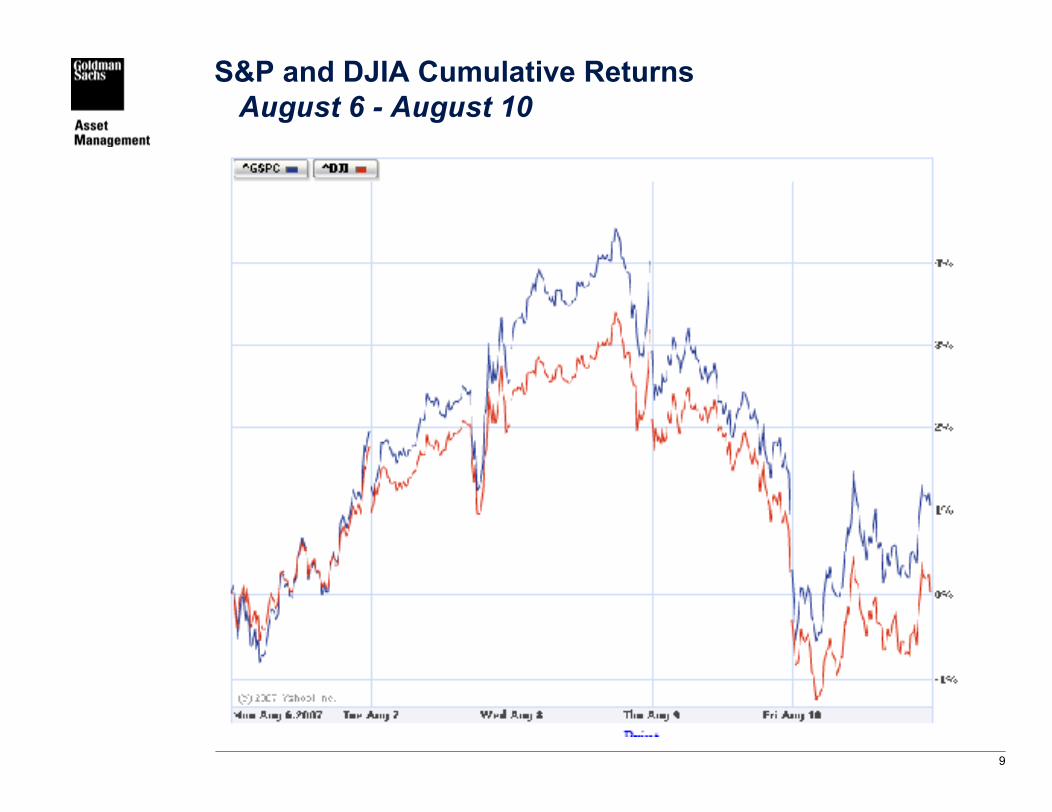
S&P and DJIA Cumulative ReturnsAugust 6 - August 10

10
S&P and DJIA Cumulative ReturnsAugust ‘05 - August 10, 2007
11
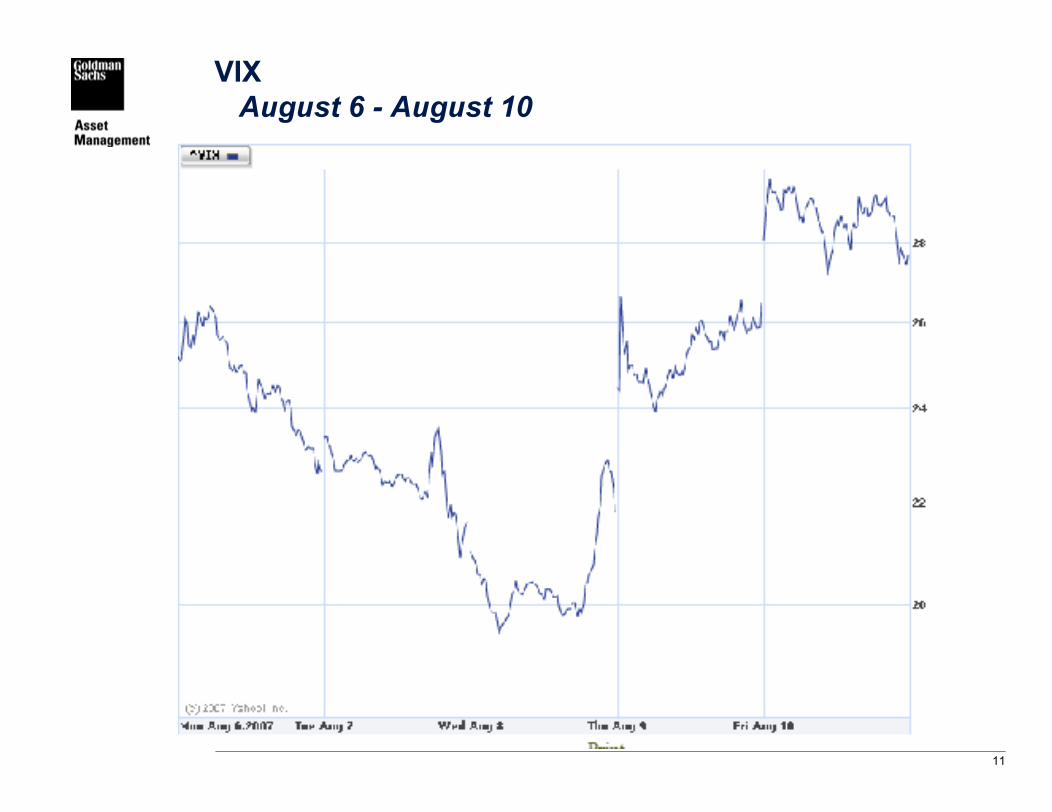
VIXAugust 6 - August 10
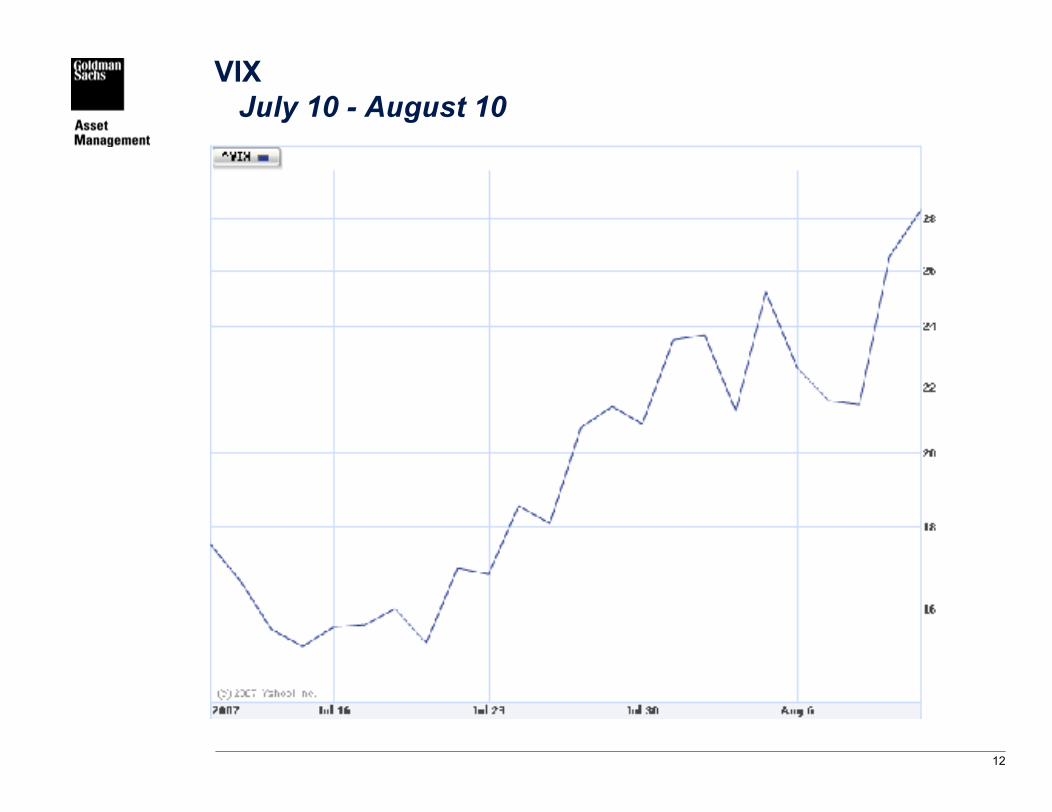
12
VIXJuly 10 - August 10

13
VIX1990 – August 10, 2007
14
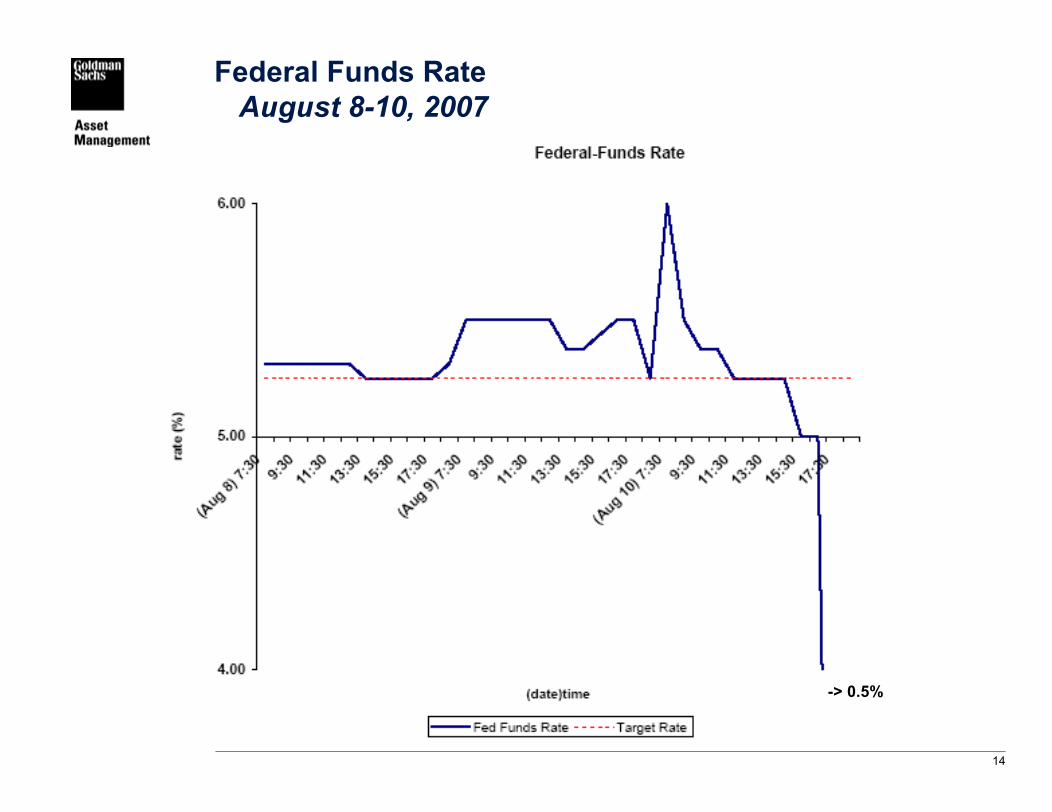
Federal Funds RateAugust 8-10, 2007
-> 0.5%

15
US Theme Returns -- August 1-10

16
Japan Theme Returns -- August 1-10

17
EU Theme Returns -- August 1-10

18
UK Theme Returns -- August 1-10
19
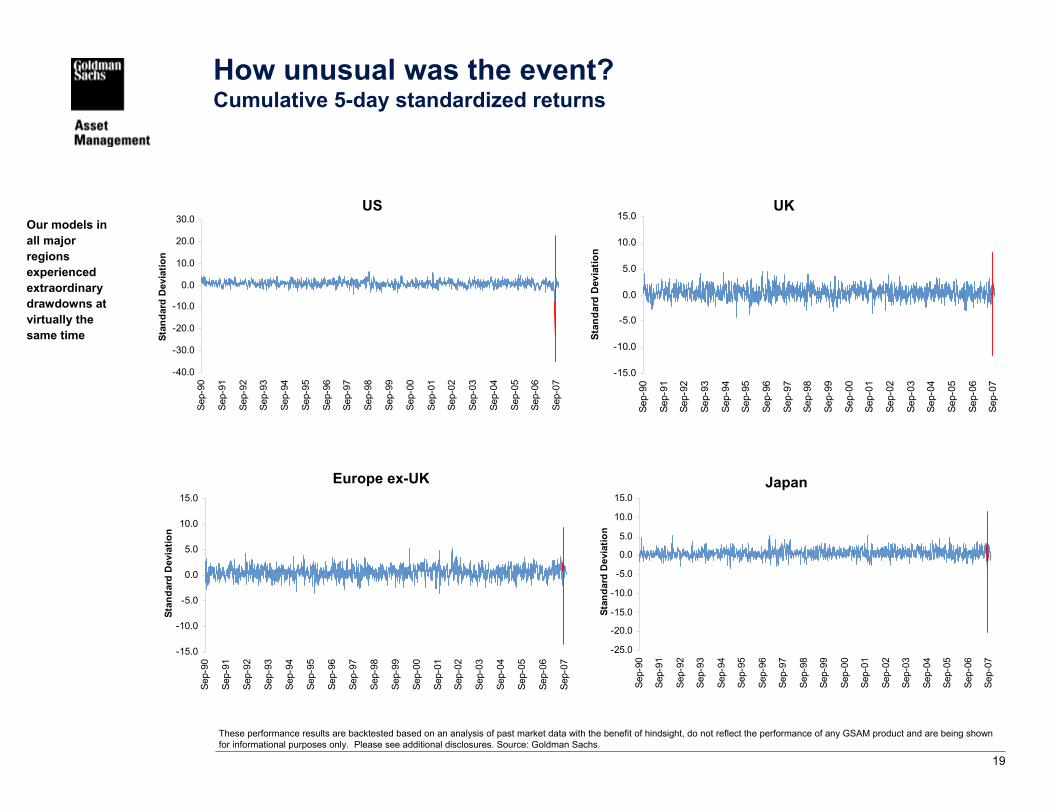
How unusual was the event?Cumulative 5-day standardized returns
UKUS
JapanEurope ex-UK
These performance results are backtested based on an analysis of past market data with the benefit of hindsight, do not reflect the performance of any GSAM product and are being shown for informational purposes only. Please see additional disclosures. Source: Goldman Sachs.
Our models in all major regions experienced extraordinary drawdowns at virtually the same time
-40.0
-30.0
-20.0
-10.0
0.0
10.0
20.0
30.0
Sep-
90
Sep-
91
Sep-
92
Sep-
93
Sep-
94
Sep-
95
Sep-
96
Sep-
97
Sep-
98
Sep-
99
Sep-
00
Sep-
01
Sep-
02
Sep-
03
Sep-
04
Sep-
05
Sep-
06
Sep-
07
Stan
dard
Dev
iatio
n
-15.0
-10.0
-5.0
0.0
5.0
10.0
15.0
Sep-
90
Sep-
91
Sep-
92
Sep-
93
Sep-
94
Sep-
95
Sep-
96
Sep-
97
Sep-
98
Sep-
99
Sep-
00
Sep-
01
Sep-
02
Sep-
03
Sep-
04
Sep-
05
Sep-
06
Sep-
07
Stan
dard
Dev
iatio
n
-25.0
-20.0
-15.0
-10.0
-5.0
0.0
5.0
10.0
15.0
Sep-
90
Sep-
91
Sep-
92
Sep-
93
Sep-
94
Sep-
95
Sep-
96
Sep-
97
Sep-
98
Sep-
99
Sep-
00
Sep-
01
Sep-
02
Sep-
03
Sep-
04
Sep-
05
Sep-
06
Sep-
07
Stan
dard
Dev
iatio
n
-15.0
-10.0
-5.0
0.0
5.0
10.0
15.0
Sep-
90
Sep-
91
Sep-
92
Sep-
93
Sep-
94
Sep-
95
Sep-
96
Sep-
97
Sep-
98
Sep-
99
Sep-
00
Sep-
01
Sep-
02
Sep-
03
Sep-
04
Sep-
05
Sep-
06
Sep-
07
Stan
dard
Dev
iatio
n
20
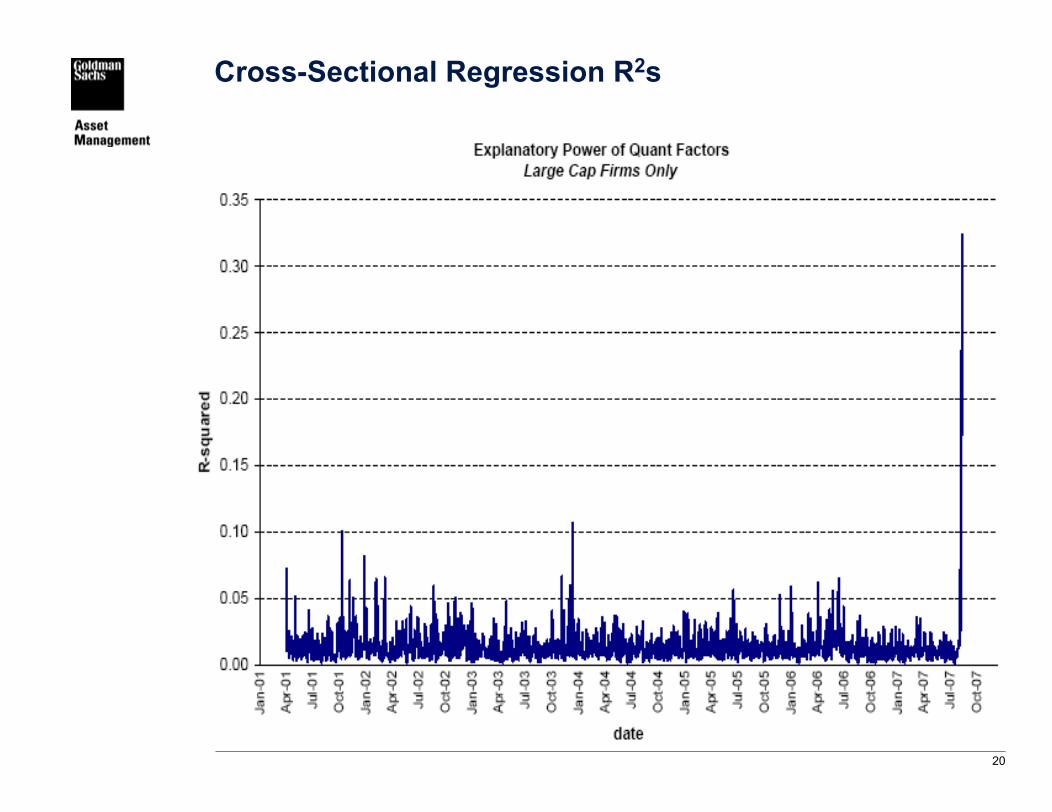
Cross-Sectional Regression R2s

21
History provided no warning
Rolling 5-Day volatility of the Global Equity Opportunities Fund, Plc
• Recent events were well outside the range of prior experience
• Although we’ve seen occasional blow-ups in some factors in some regions, we had never seen this happen simultaneously to virtually all factors in every major region
• This produced a 20-sigma drawdown for our Global Equity Opportunities Fund and a huge spike in volatility
0%
50%
100%
150%
200%
250%
May
-03
Jul-0
3
Sep
-03
Nov
-03
Jan-
04
Mar
-04
May
-04
Jul-0
4
Sep
-04
Nov
-04
Jan-
05
Mar
-05
May
-05
Jul-0
5
Sep
-05
Nov
-05
Jan-
06
Mar
-06
May
-06
Jul-0
6
Sep
-06
Nov
-06
Jan-
07
Mar
-07
May
-07
Jul-0
7
Ann
ualiz
ed V
olat
ility
Since inception as of August 24, 2007. The inception date of the Global Equity Opportunities Fund, Plc is May 1, 2003. Past performance is not indicative of future results, which may vary. Please note that the above data is calculated using two day overlapping gross returns. The returns presented herein are gross and do not reflect the deduction of investment advisory fees, which will reduce returns.
22
Market dynamics: how it started
• Multi-strategy hedge funds
⎯ Hidden losses in illiquid mortgage and credit positions
⎯ Looking to reduce risk and raise cash
• Quant equity strategies
⎯ Viewed as liquid
⎯ Required relatively large margin balances (good source of cash)
⎯ Were not performing well

23
Market dynamics: contagion
• Prisoner’s dilemma developed
⎯ Slow trading reduces costs
⎯ We’re all better off if everyone is patient
⎯ But if others rush to liquidate, I better get out first panic unwinding
• Liquidity dried up
⎯ Liquidity is normally provided by stat-arb strategies and brokers
⎯ When small price discrepancies become large imbalances, liquidity providers pull back
⎯ Normal, slow summer schedules may have contributed
24
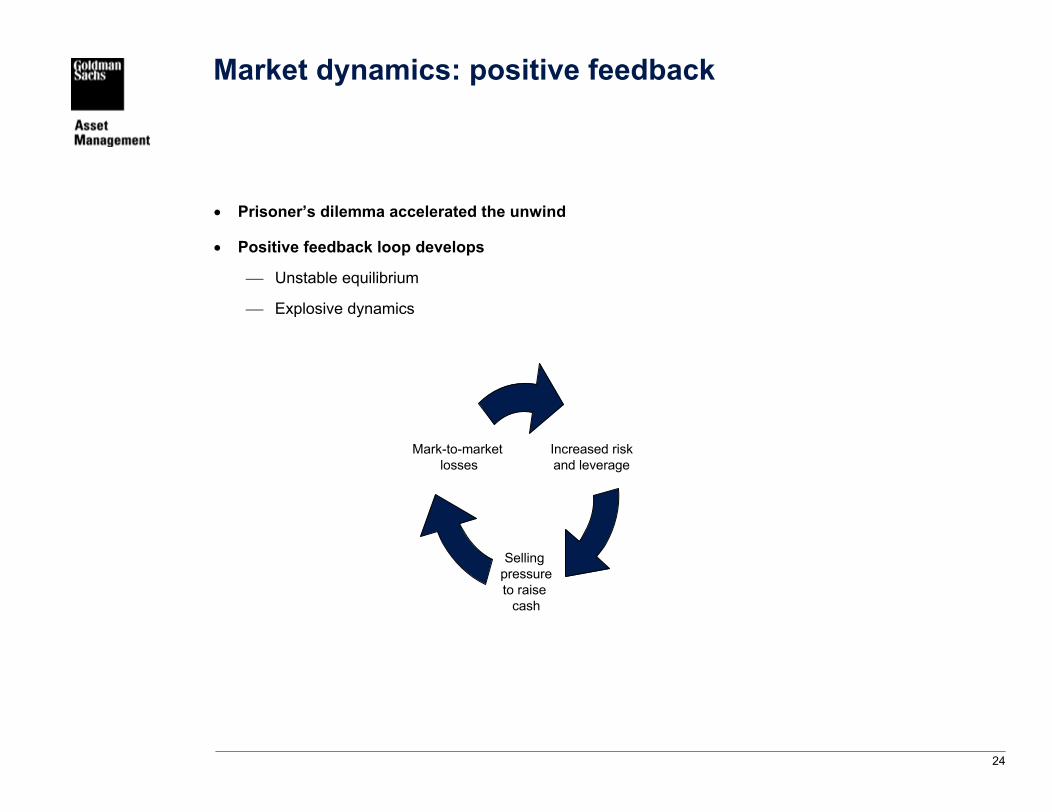
Market dynamics: positive feedback
• Prisoner’s dilemma accelerated the unwind
• Positive feedback loop develops
⎯ Unstable equilibrium
⎯ Explosive dynamics
Increased riskand leverage
Sellingpressureto raise
cash
Mark-to-marketlosses
25
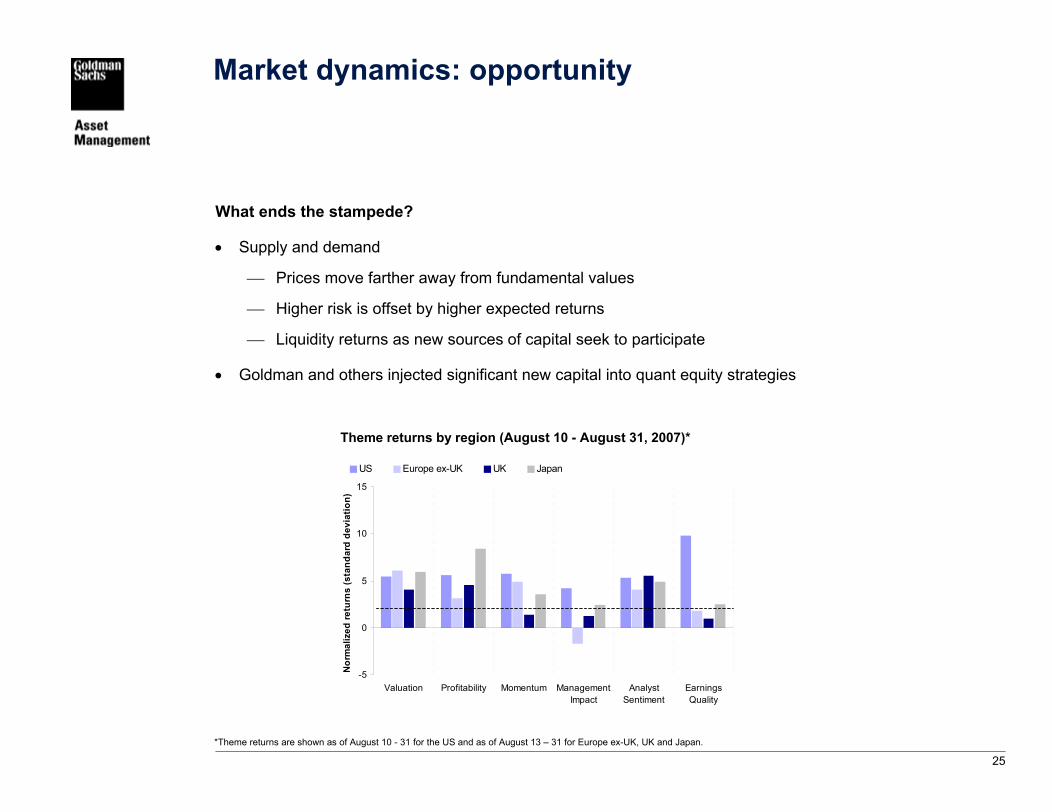
Market dynamics: opportunity
What ends the stampede?
• Supply and demand
⎯ Prices move farther away from fundamental values
⎯ Higher risk is offset by higher expected returns
⎯ Liquidity returns as new sources of capital seek to participate
• Goldman and others injected significant new capital into quant equity strategies
Theme returns by region (August 10 - August 31, 2007)*
*Theme returns are shown as of August 10 - 31 for the US and as of August 13 – 31 for Europe ex-UK, UK and Japan.
-5
0
5
10
15
Valuation Profitability Momentum ManagementImpact
AnalystSentiment
EarningsQuality
Nor
mal
ized
retu
rns
(sta
ndar
d de
viat
ion)
US Europe ex-UK UK Japan

26
What made this event unique?
Market dislocations occur regularly
• The unwinding of “crowded trades” can create large losses, but they are not uncommon
⎯ However, they usually involve concentrated positions in relatively illiquid assets
• What made this event unique was:
⎯ A crowded trade in a diversified portfolio of normally liquid assets
⎯ It hit all quant factors in all major markets at almost the same time
⎯ Without looking at quantitative factors you might have missed it

27
We didn’t foresee this scenario
We saw the growth of quant AUM, but
• Didn’t see how far these strategies had extended into statistical arbitrage desks and hedge-funds
• We felt our proprietary factor specifications and weighting would provide differentiation
⎯ Supported by historical correlations plus low exposures of other quant managers to our factors
• Our individual equity positions were small, liquid, and diversified – we didn’t foresee a significant liquidation event focused on similar portfolios

28
What we’ve learned

29
Lessons learned
Did our process fail?
• It was designed to give us efficient exposure to our factors, which it did.
• These factors moved sharply against us as quant portfolios were de-levered
• In fact, the event is only understandable in the context of quantitative models (a factor story)
• Our process was not designed to anticipate or protect us from 20-sigma events
Other Lessons:
• The risks, rewards, and impacts on market behavior of popular alpha strategies are more dynamic than ever
• In integrated markets with sophisticated risk sharing mechanisms, spillover of de-levering from one strategy to another is likely to be more common
• Sound quant strategies should do very well when they are new, and perhaps even better as they gain popularity, but can become risky and less profitable when they get too popular

30
Did we have an adequate margin of safety?
• In most funds, we did
• In the Global Equity Opportunities Fund, we had enough cash to withstand a 30% drawdown (a 10-sigma monthly event)
⎯ Seemed more than adequate, but wasn’t
• After several days of large losses, we had two options to reduce leverage:
1. Unwind in an illiquid market
2. Raise cash from outside investors
• We felt the 2nd option was more prudent, and beneficial to all investors.

31
Lessons learned
Did our process fail?
• It was designed to give us efficient exposure to our factors, which it did.
• These factors moved sharply against us as quant portfolios were de-levered
• In fact, the event is only understandable in the context of quantitative models (a factor story)
• Our process was not designed to anticipate or protect us from 20-sigma events
Other Lessons:
• The risks, rewards, and impacts on market behavior of popular alpha strategies are more dynamic than ever
• In integrated markets with sophisticated risk sharing mechanisms, spillover of de-levering from one strategy to another is likely to be more common
• Sound quant strategies should do very well when they are new, and perhaps even better as they gain popularity, but can become risky and less profitable when they get too popular
32
Quant investing
Is it broken?
• No, in fact we believe near-term opportunities are especially attractive
• Academic finance continues to identify and explain market anomalies
• But, as knowledge diffuses, these strategies become more crowded
• In finance, unlike most other fields, what we predict reacts to our predictions, especially when they become widely-held.
• Innovation and adaptation will remain the keys to success
33
Implications for the future

34
• Superior research will continue to differentiate the best managers
• We have re-prioritized our research agenda in light of recent events
⎯ Risk management:
− Can we anticipate, or at least prepare for, sudden changes in risks/correlations?
− Can we identify and hedge transient risks (e.g., low quality rally)?
⎯ Alpha models:
− Identify over-used (common) factors
− Continue to develop more proprietary factors
− Re-allocate risk between common and proprietary factors
− Focus more on less-followed or difficult-to-analyze data (barriers to entry)
• Although we will continue to share the philosophy and intuition behind our process with outside investors, we won’t be able to reveal specific calculations or other details. This is solely to protect our clients’ interests.
Implications for quantitative equity research

35
Implications for our process
Issues Raised Action Items
Capacity: There is more money chasing these strategies than we appreciated.
We will be more conservative on capacity estimates going forward, while continuing to search for innovative/proprietary strategies.
“Crowded” factors: Commonly-used factors are riskier and may be less effective in the future.
These events will help us to better identify over-used factors and either avoid them or better hedge their risks.
“Crowded” positions: Stocks that are widely held by hedge funds and other quants can experience severe pricing pressure in times of stress.
Going forward we will need to consider this risk during portfolio construction.
Leverage: Allows us to increase risk without changing the underlying portfolio’s expected IR, but can be hard to reduce in periods of market turmoil.
We will need to keep leverage at levels that can withstand turmoil, and adjust risk as needed using our underlying positions.
Factor timing: Many factor returns are now riskier and can have sudden and severe drawdowns.
We have accelerated our research efforts into factor timing and risk forecasting.
Trading: During liquidity events, anonymous trading and minimizing impact are even more important.
We will make even greater use of algorithmic trading, short-term timing factors, and opportunistic trading in the future.
Risk management: Even the most adaptive risk model cannot predict sudden and dramatic changes in risk.
Can we forecast market disruptions using structural models of contagion?

36
Appendix

37
Factor risksUS
60-Day Realized Volatility 60-Day Realized Volatility
60-Day Realized VolatilityAverage Pairwise Theme Return Correlations 60-Day Realized
These performance results are backtested based on an analysis of past market data with the benefit of hindsight, do not reflect the performance of any GSAM product and are being shown for informational purposes only. Please see additional disclosures. Source: Goldman Sachs.
0.0%
0.5%
1.0%
1.5%
2.0%
2.5%
3.0%
3.5%
4.0%
4.5%
5.0%
Aug-
77
Aug-
79
Aug-
81
Aug-
83
Aug-
85
Aug-
87
Aug-
89
Aug-
91
Aug-
93
Aug-
95
Aug-
97
Aug-
99
Aug-
01
Aug-
03
Aug-
05
Aug-
07
Vola
tility
(ann
ualiz
ed)
ValuationProfitabilityEarnings Quality
0.0%
0.5%
1.0%
1.5%
2.0%
2.5%
3.0%
3.5%
4.0%
4.5%
Aug
-77
Aug
-79
Aug
-81
Aug
-83
Aug
-85
Aug
-87
Aug
-89
Aug
-91
Aug
-93
Aug
-95
Aug
-97
Aug
-99
Aug
-01
Aug
-03
Aug
-05
Aug
-07
Vola
tility
(ann
ualiz
ed)
MomentumManagement ImpactAnalyst Sentiment
-40.0%
-20.0%
0.0%
20.0%
40.0%
60.0%
80.0%
100.0%
Aug
-77
Aug
-79
Aug
-81
Aug
-83
Aug
-85
Aug
-87
Aug
-89
Aug
-91
Aug
-93
Aug
-95
Aug
-97
Aug
-99
Aug
-01
Aug
-03
Aug
-05
Aug
-07
Cor
rela
tion
0.0%
0.2%
0.4%
0.6%
0.8%
1.0%
1.2%
1.4%
1.6%
1.8%
2.0%
Aug
-77
Aug
-79
Aug
-81
Aug
-83
Aug
-85
Aug
-87
Aug
-89
Aug
-91
Aug
-93
Aug
-95
Aug
-97
Aug
-99
Aug
-01
Aug
-03
Aug
-05
Aug
-07
Vola
tility
(ann
ualiz
ed)
OTP

38
Factor risksUK
These performance results are backtested based on an analysis of past market data with the benefit of hindsight, do not reflect the performance of any GSAM product and are being shown for informational purposes only. Please see additional disclosures. Source: Goldman Sachs.
60-Day Realized Volatility 60-Day Realized Volatility
Average Pairwise Theme Return Correlations 60-Day Realized 60-Day Realized Volatility
0.0%
0.5%
1.0%
1.5%
2.0%
2.5%
3.0%
3.5%
4.0%
4.5%
Aug
-90
Aug
-91
Aug
-92
Aug
-93
Aug
-94
Aug
-95
Aug
-96
Aug
-97
Aug
-98
Aug
-99
Aug
-00
Aug
-01
Aug
-02
Aug
-03
Aug
-04
Aug
-05
Aug
-06
Aug
-07
Vola
tility
(ann
ualiz
ed)
ValuationProfitabilityEarnings Quality
0.0%
0.5%
1.0%
1.5%
2.0%
2.5%
3.0%
3.5%
4.0%
4.5%
5.0%
Aug
-90
Aug
-91
Aug
-92
Aug
-93
Aug
-94
Aug
-95
Aug
-96
Aug
-97
Aug
-98
Aug
-99
Aug
-00
Aug
-01
Aug
-02
Aug
-03
Aug
-04
Aug
-05
Aug
-06
Aug
-07
Vola
tility
(ann
ualiz
ed)
MomentumManagement ImpactAnalyst Sentiment
0.0%
0.2%
0.4%
0.6%
0.8%
1.0%
1.2%
1.4%
1.6%
1.8%
Aug
-90
Aug
-91
Aug
-92
Aug
-93
Aug
-94
Aug
-95
Aug
-96
Aug
-97
Aug
-98
Aug
-99
Aug
-00
Aug
-01
Aug
-02
Aug
-03
Aug
-04
Aug
-05
Aug
-06
Aug
-07
Vola
tility
(ann
ualiz
ed)
OTP
-20.0%
0.0%
20.0%
40.0%
60.0%
80.0%
100.0%
Aug
-90
Aug
-91
Aug
-92
Aug
-93
Aug
-94
Aug
-95
Aug
-96
Aug
-97
Aug
-98
Aug
-99
Aug
-00
Aug
-01
Aug
-02
Aug
-03
Aug
-04
Aug
-05
Aug
-06
Aug
-07
Cor
rela
tion

39
Factor risksJapan
These performance results are backtested based on an analysis of past market data with the benefit of hindsight, do not reflect the performance of any GSAM product and are being shown for informational purposes only. Please see additional disclosures. Source: Goldman Sachs.
60-Day Realized Volatility 60-Day Realized Volatility
Average Pairwise Theme Return Correlations 60-Day Realized 60-Day Realized Volatility
0.0%
1.0%
2.0%
3.0%
4.0%
5.0%
6.0%
Aug
-90
Aug
-91
Aug
-92
Aug
-93
Aug
-94
Aug
-95
Aug
-96
Aug
-97
Aug
-98
Aug
-99
Aug
-00
Aug
-01
Aug
-02
Aug
-03
Aug
-04
Aug
-05
Aug
-06
Aug
-07
Vola
tility
(ann
ualiz
ed)
ValuationProfitabilityEarnings Quality
0.0%
0.5%
1.0%
1.5%
2.0%
2.5%
3.0%
3.5%
4.0%
Aug-
90
Aug-
91
Aug-
92
Aug-
93
Aug-
94
Aug-
95
Aug-
96
Aug-
97
Aug-
98
Aug-
99
Aug-
00
Aug-
01
Aug-
02
Aug-
03
Aug-
04
Aug-
05
Aug-
06
Aug-
07
Vola
tility
(ann
ualiz
ed)
MomentumManagement ImpactAnalyst Sentiment
-20.0%
0.0%
20.0%
40.0%
60.0%
80.0%
100.0%
Aug
-90
Aug
-91
Aug
-92
Aug
-93
Aug
-94
Aug
-95
Aug
-96
Aug
-97
Aug
-98
Aug
-99
Aug
-00
Aug
-01
Aug
-02
Aug
-03
Aug
-04
Aug
-05
Aug
-06
Aug
-07
Cor
rela
tion
0.0%
0.5%
1.0%
1.5%
2.0%
2.5%
3.0%
Aug-
90
Aug-
91
Aug-
92
Aug-
93
Aug-
94
Aug-
95
Aug-
96
Aug-
97
Aug-
98
Aug-
99
Aug-
00
Aug-
01
Aug-
02
Aug-
03
Aug-
04
Aug-
05
Aug-
06
Aug-
07
Vola
tility
(ann
ualiz
ed)
OTP
40
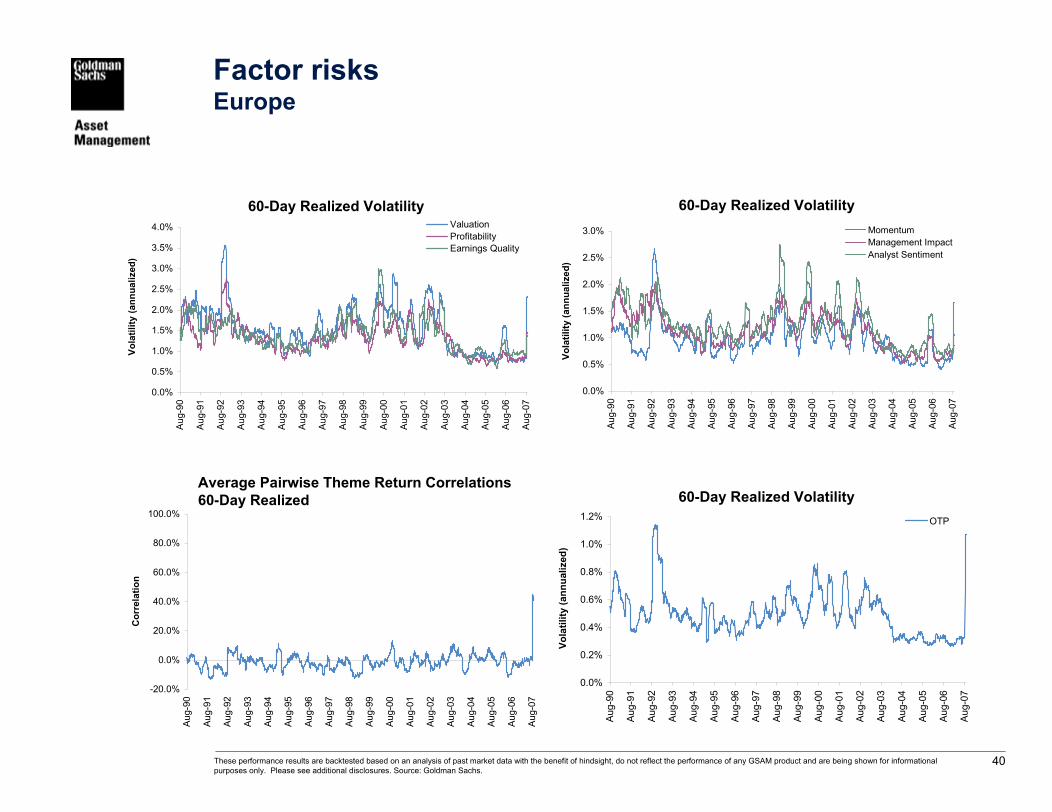
Factor risksEurope
These performance results are backtested based on an analysis of past market data with the benefit of hindsight, do not reflect the performance of any GSAM product and are being shown for informational purposes only. Please see additional disclosures. Source: Goldman Sachs.
60-Day Realized Volatility 60-Day Realized Volatility
Average Pairwise Theme Return Correlations 60-Day Realized 60-Day Realized Volatility
0.0%
0.5%
1.0%
1.5%
2.0%
2.5%
3.0%
3.5%
4.0%
Aug
-90
Aug
-91
Aug
-92
Aug
-93
Aug
-94
Aug
-95
Aug
-96
Aug
-97
Aug
-98
Aug
-99
Aug
-00
Aug
-01
Aug
-02
Aug
-03
Aug
-04
Aug
-05
Aug
-06
Aug
-07
Vola
tility
(ann
ualiz
ed)
ValuationProfitabilityEarnings Quality
0.0%
0.5%
1.0%
1.5%
2.0%
2.5%
3.0%
Aug-
90
Aug-
91
Aug-
92
Aug-
93
Aug-
94
Aug-
95
Aug-
96
Aug-
97
Aug-
98
Aug-
99
Aug-
00
Aug-
01
Aug-
02
Aug-
03
Aug-
04
Aug-
05
Aug-
06
Aug-
07
Vola
tility
(ann
ualiz
ed)
MomentumManagement ImpactAnalyst Sentiment
0.0%
0.2%
0.4%
0.6%
0.8%
1.0%
1.2%
Aug
-90
Aug
-91
Aug
-92
Aug
-93
Aug
-94
Aug
-95
Aug
-96
Aug
-97
Aug
-98
Aug
-99
Aug
-00
Aug
-01
Aug
-02
Aug
-03
Aug
-04
Aug
-05
Aug
-06
Aug
-07
Vola
tility
(ann
ualiz
ed)
OTP
-20.0%
0.0%
20.0%
40.0%
60.0%
80.0%
100.0%
Aug-
90
Aug-
91
Aug-
92
Aug-
93
Aug-
94
Aug-
95
Aug-
96
Aug-
97
Aug-
98
Aug-
99
Aug-
00
Aug-
01
Aug-
02
Aug-
03
Aug-
04
Aug-
05
Aug-
06
Aug-
07
Cor
rela
tion
41
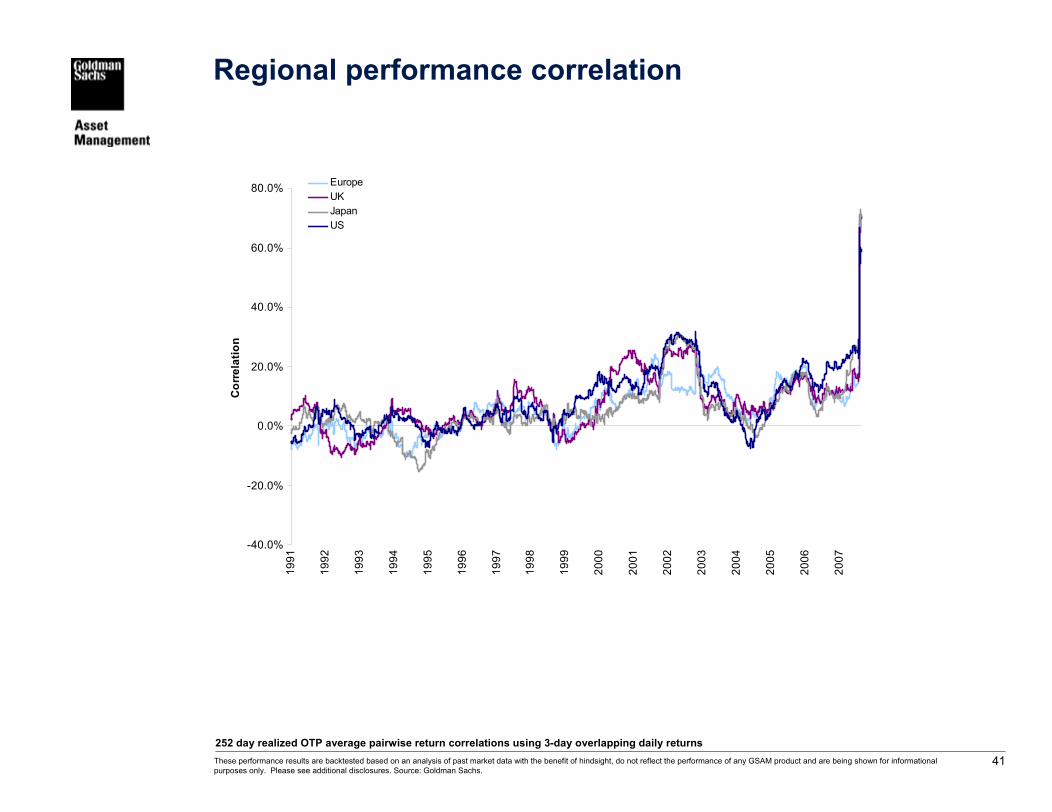
Regional performance correlation
These performance results are backtested based on an analysis of past market data with the benefit of hindsight, do not reflect the performance of any GSAM product and are being shown for informational purposes only. Please see additional disclosures. Source: Goldman Sachs.
252 day realized OTP average pairwise return correlations using 3-day overlapping daily returns
-40.0%
-20.0%
0.0%
20.0%
40.0%
60.0%
80.0%
1991
1992
1993
1994
1995
1996
1997
1998
1999
2000
2001
2002
2003
2004
2005
2006
2007
Cor
rela
tion
EuropeUKJapanUS

42
Additional information
This material is provided for educational purposes only and should not be construed as investment advice or an offer or solicitation to buy or sell securities.
Opinions expressed are current opinions as of the date appearing in this material only. No part of this material may, without Goldman Sachs Asset Management’s prior written consent, be (i) copied, photocopied or duplicated in any form, by any means, or (ii) distributed to any person that is not an employee, officer, director, or authorized agent of the recipient. No person has been authorized to give any information or to make any representation, warranty, statement or assurance not contained in the Offering Memorandum and, if given or made, such other information or representation, warranty, statement or assurance may not be relied upon.
The portfolio risk management processes discussed herein include an effort to monitor and manage risk, but should not be confused with and do not imply low risk.
This presentation has been issued or approved for use in or from Hong Kong by Goldman Sachs (Asia) L.L.C. This presentation has been issued or approved for use in or from Singapore by Goldman Sachs (Singapore) Pte. (Company Number: 198602165W). This presentation has been communicated in the United Kingdom by Goldman Sachs Asset Management International which is authorized and regulated by the Financial Services Authority (FSA).
This presentation has been communicated in Canada by GSAM LP, which is registered as a non-resident adviser under securities legislation in certain provinces of Canada and as a non-resident commodity trading manager under the commodity futures legislation of Ontario. In other provinces, GSAM LP conducts its activities under exemptions from the adviser registration requirements. Investments in securities of the type referenced in this presentation may only be made pursuant to applicable Canadian private placement offering documents, of which this material is not a part. Canadian private placement offering documents will be provided to you upon request for the purpose of any investment you may wish to make in any securities referenced herein. In certain provinces GSAM LP is not registered to provide investment advisory or portfolio management services in respect of exchange-traded futures or options contracts and is not offering to provide such investment advisory or portfolio management services in such provinces by delivery of this material. GSAM LP and certain of its affiliates may serve as theinvestment manager or adviser to investment funds described in this presentation and may be entitled to receive fees in connection therewith. Accordingly, the investment funds may be considered a “related issuer” or “connected issuer” of GSAM LP or certain of its affiliates for purposes of applicable Canadian securities laws. Further information concerning relationships between GSAM LP and its affiliates and investment funds described in this presentation is included in the applicable Canadian private placement offering documents pursuant to which the investment funds may be offered for sale in Canada.
43
Additional information
Prospective investors should inform themselves and take appropriate advice as to any applicable legal requirements and any applicable taxation and exchange control regulations in the countries of their citizenship, residence or domicile which might be relevant to the subscription, purchase, holding, exchange, redemption or disposal of any investments.
COREsm is a registered service mark of Goldman, Sachs & Co.
Backtested performance results do not represent the results of actual trading using client assets. They do not reflect the reinvestment of dividends, the deduction of any fees, commissions or any other expenses a client would have to pay. If GSAM had managed your account during the period, it is highly improbable that your account would have been managed in a similar fashion due to differences in economic and market conditions.
Simulated performance is hypothetical and may not take into account material economic and market factors that would impact the adviser’s decision-making. Simulated results are achieved by retroactively applying a model with the benefit of hindsight. The results reflect the reinvestment of dividends and other earnings, but do not reflect fees, transaction costs, and other expenses, which would reduce returns. Actual results will vary.
References to indices, benchmarks or other measures of relative market performance over a specified period of time are provided for your information only and do not imply that the portfolio will achieve similar results. The index composition may not reflect the manner in which a portfolio is constructed. While an adviser seeks to design a portfolio which reflects appropriate risk and return features, portfolio characteristics may deviate from those of the benchmark.
This material has been prepared by GSAM and is not a product of the Goldman Sachs Global Investment Research (GIR) Department. The views and opinions expressed may differ from those of the GIR Department or other departments or divisions of Goldman Sachs and its affiliates. .This information may not be current and GSAM has no obligation to provide any updates or changes. Itshould not be relied upon in making an investment decision.
Holdings may change by the time you receive this report. The securities discussed do not represent all of the portfolio's holdings and may represent only a small percentage of the strategy’s portfolio holdings. A complete list of holdings is available upon request. Future portfolio holdings may not be profitable. The information should not be deemed representative of future characteristics for the strategy.
Tracking Error is one possible measurement of the dispersion of a portfolio’s returns from its stated benchmark. More specifically, it is the standard deviation of such excess returns. Tracking error figures are representations of statistical expectations falling within “normal” distributions of return patterns. Normal statistical distributions of returns suggests that approximately two thirds of the time the annual gross returns of the accounts will lie in a range equal to the benchmark return plus or minus the tracking error if the market behaves in a manner suggested by historical returns. Targeted tracking error therefore applies statistical probabilities (and the language of uncertainty) and so cannot be predictive of actual results. The tracking error that will actually be achieved may inherently lie outside of the range suggested by a "normal " statistical distribution of returns. The actual tracking error is the result of many factors (including but not limited to market volatility, company specific anomalies, instability of correlation between benchmark holdings, timing differences between the calculation of the portfolio value and the valuation of the benchmark by the index provider. In addition, past tracking error is not indicative of future tracking error and there can be no assurance that the tracking error actually reflected in your accounts will be at levels either specified in the investment objectives or suggested by our forecasts.
The Global Industry Classification Standard (“GICS”) was developed by and is the exclusive property and a service mark of Morgan Stanley Capital International Inc. (“MSCI”) and Standard & Poor’s, a division of The McGraw-Hill Companies, Inc. (“S&P”) and is licensed for use by Goldman Sachs . Neither MSCI, S&P nor any other party involved in making or compiling the GICS or any GICS classifications makes any express or implied warranties or representations with respect to such standard or classification (or the results to be obtained by the use thereof), and all such parties hereby expressly disclaim all warranties of originality, accuracy, completeness, merchantability or fitness for a particular purpose with respect to any of such standard or classification. Without limiting any of the foregoing, in no event shall MSCI, S&P, any of their affiliates or any third party involved in making or compiling the GICS or any GICS classifications have any liability for any direct, indirect, special, punitive, consequential or any other damages (including lost profits) even if notified of the possibility of such damages.
Past performance is not indicative of future results, which may vary. The value of investments and the income derived from investments can go down as well as up. Future returns are not guaranteed, and a loss of principal may occur.
Opinions expressed are current opinions as of the date appearing in this material only. No part of this material may, without GSAM’s prior written consent, be (i) copied, photocopied or duplicated in any form, by any means, or (ii) distributed to any person that is not an employee, officer, director, or authorized agent of the recipient.
Copyright 2007 Goldman, Sachs & Co. All Rights Reserved. 07-4886