quant 2018 · 2019-04-30 · quant annual reort 2018 quant annual reort 2018 5 introduction to...
TRANSCRIPT
Q U A N T A N N U A L R E P O R T 2 0 1 8
Q U A N T A N N U A L R E P O R T
2 0 1 8
1
Q U A N T A N N U A L R E P O R T 2 0 1 8
2
TABLE OF CONTENTS
04
05
08
10
24
28
CEO’s Letter
Introduction to Quant
Strategy to create value
Market & Service Offering
Segments
Management Report

Q U A N T A N N U A L R E P O R T 2 0 1 8
Q U A N T A N N U A L R E P O R T
2 0 1 8
3
Q U A N T A N N U A L R E P O R T 2 0 1 8
4
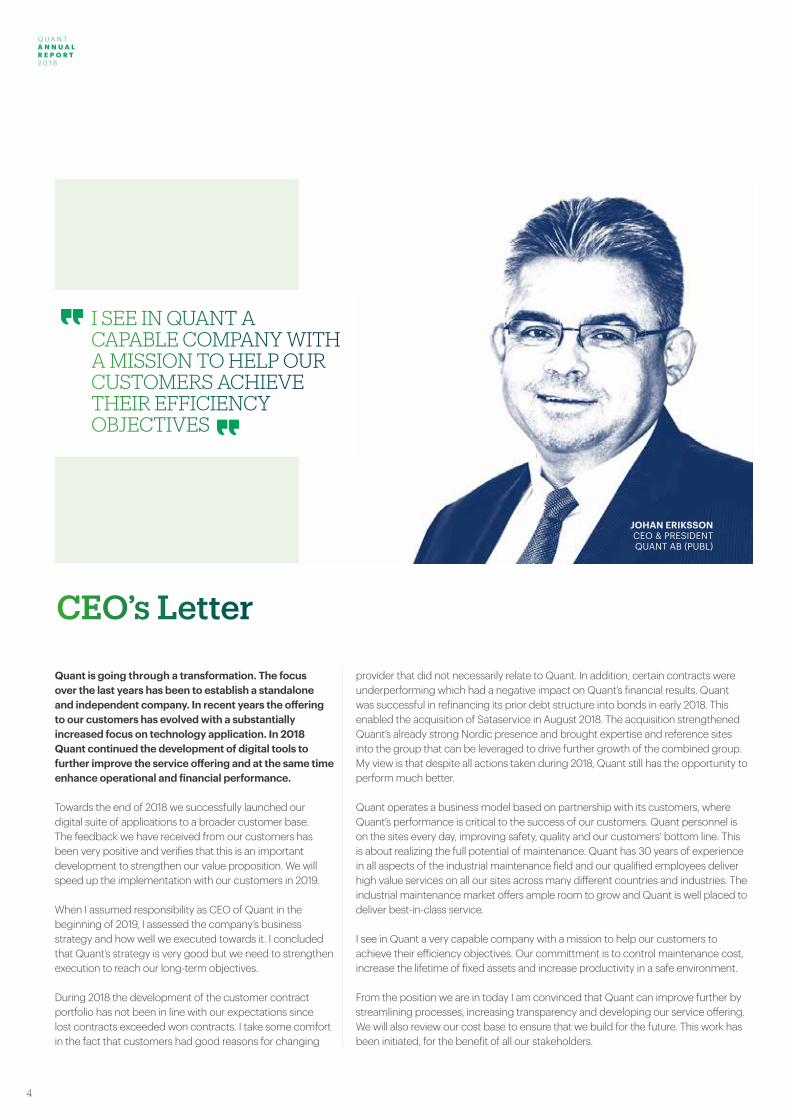
CEO’s Letter
Quant is going through a transformation. The focus over the last years has been to establish a standalone and independent company. In recent years the offering to our customers has evolved with a substantially increased focus on technology application. In 2018 Quant continued the development of digital tools to further improve the service offering and at the same time enhance operational and financial performance.
Towards the end of 2018 we successfully launched our digital suite of applications to a broader customer base. The feedback we have received from our customers has been very positive and verifies that this is an important development to strengthen our value proposition. We will speed up the implementation with our customers in 2019.
When I assumed responsibility as CEO of Quant in the beginning of 2019, I assessed the company’s business strategy and how well we executed towards it. I concluded that Quant’s strategy is very good but we need to strengthen execution to reach our long-term objectives.
During 2018 the development of the customer contract portfolio has not been in line with our expectations since lost contracts exceeded won contracts. I take some comfort in the fact that customers had good reasons for changing
JOHAN ERIKSSONCEO & PRESIDENTQUANT AB (PUBL)
provider that did not necessarily relate to Quant. In addition, certain contracts were underperforming which had a negative impact on Quant’s financial results. Quant was successful in refinancing its prior debt structure into bonds in early 2018. This enabled the acquisition of Sataservice in August 2018. The acquisition strengthened Quant’s already strong Nordic presence and brought expertise and reference sites into the group that can be leveraged to drive further growth of the combined group. My view is that despite all actions taken during 2018, Quant still has the opportunity to perform much better. Quant operates a business model based on partnership with its customers, where Quant’s performance is critical to the success of our customers. Quant personnel is on the sites every day, improving safety, quality and our customers’ bottom line. This is about realizing the full potential of maintenance. Quant has 30 years of experience in all aspects of the industrial maintenance field and our qualified employees deliver high value services on all our sites across many different countries and industries. The industrial maintenance market offers ample room to grow and Quant is well placed to deliver best-in-class service. I see in Quant a very capable company with a mission to help our customers to achieve their efficiency objectives. Our committment is to control maintenance cost, increase the lifetime of fixed assets and increase productivity in a safe environment.
From the position we are in today I am convinced that Quant can improve further by streamlining processes, increasing transparency and developing our service offering. We will also review our cost base to ensure that we build for the future. This work has been initiated, for the benefit of all our stakeholders.
I SEE IN QUANT A CAPABLE COMPANY WITH A MISSION TO HELP OUR CUSTOMERS ACHIEVE THEIR EFFICIENCY OBJECTIVES
Q U A N T A N N U A L R E P O R T 2 0 1 8
Q U A N T A N N U A L R E P O R T
2 0 1 8
5
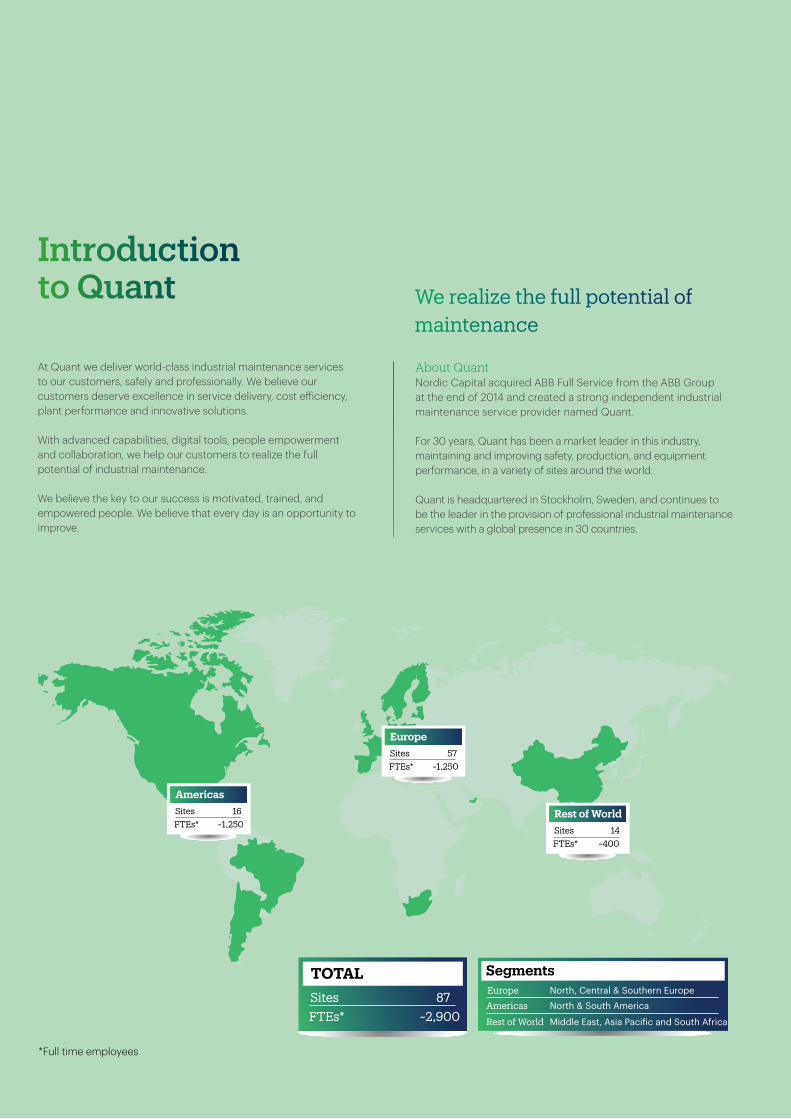
Introduction to Quant We realize the full potential of
maintenance
At Quant we deliver world-class industrial maintenance services to our customers, safely and professionally. We believe our customers deserve excellence in service delivery, cost efficiency, plant performance and innovative solutions.
With advanced capabilities, digital tools, people empowerment and collaboration, we help our customers to realize the full potential of industrial maintenance.
We believe the key to our success is motivated, trained, and empowered people. We believe that every day is an opportunity to improve.
About QuantNordic Capital acquired ABB Full Service from the ABB Group at the end of 2014 and created a strong independent industrial maintenance service provider named Quant.
For 30 years, Quant has been a market leader in this industry, maintaining and improving safety, production, and equipment performance, in a variety of sites around the world.
Quant is headquartered in Stockholm, Sweden, and continues to be the leader in the provision of professional industrial maintenance services with a global presence in 30 countries.
*Full time employees
SitesFTEs*
57~1,250
Europe
SitesFTEs*
16~1,250
Americas
SitesFTEs*
14~400
Rest of World
SitesFTEs*
87~2,900
Europe
Americas
North, Central & Southern Europe
North & South America
Segments
Rest of World Middle East, Asia Pacific and South Africa
Q U A N T A N N U A L R E P O R T 2 0 1 8
6
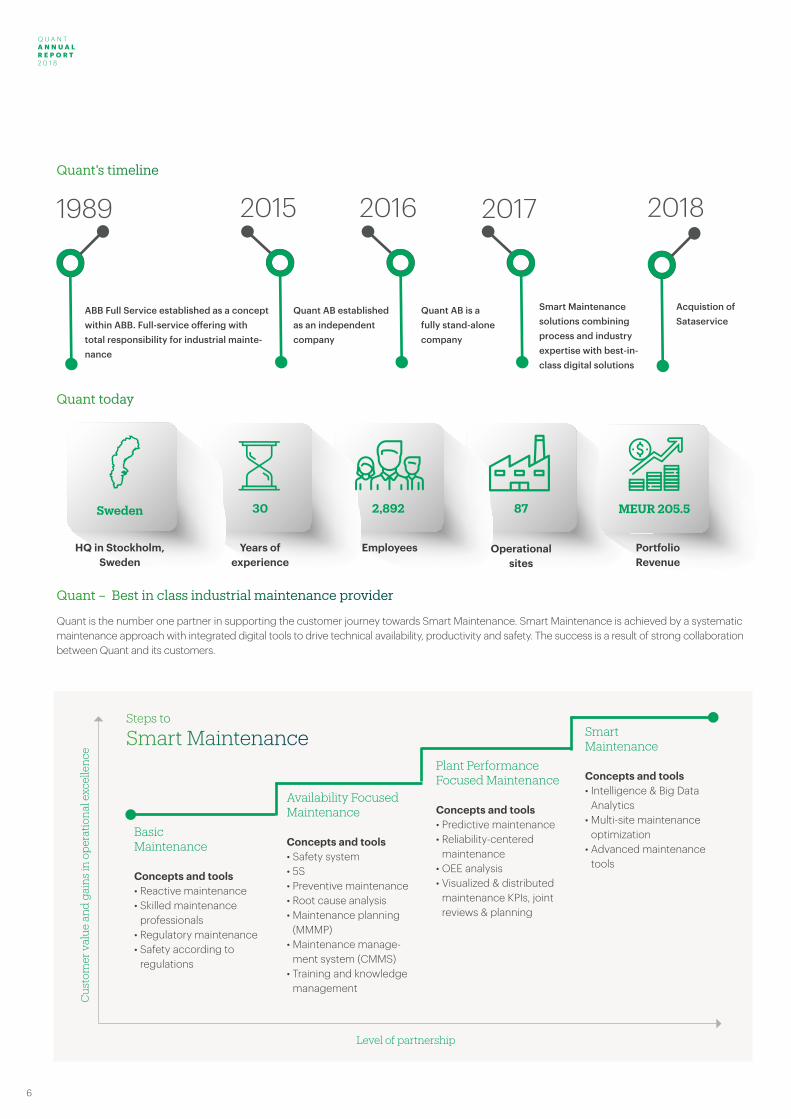
1989 201720162015
ABB Full Service established as a concept within ABB. Full-service offering with total responsibility for industrial mainte-nance
Quant AB established as an independent company
Quant AB is a fully stand-alone company
Smart Maintenance solutions combining process and industry expertise with best-in- class digital solutions
30 2,892 87Sweden
Steps to
Smart Maintenance
Cus
tom
er v
alue
and
gai
ns
in o
per
atio
nal
exc
elle
nce
Level of partnership
Basic Maintenance Concepts and tools• Reactive maintenance• Skilled maintenance
professionals• Regulatory maintenance• Safety according to
regulations
Availability Focused Maintenance
Concepts and tools• Safety system • 5S• Preventive maintenance• Root cause analysis• Maintenance planning
(MMMP)• Maintenance manage-
ment system (CMMS)• Training and knowledge
management
Plant Performance Focused Maintenance
Concepts and tools• Predictive maintenance• Reliability-centered
maintenance• OEE analysis• Visualized & distributed
maintenance KPIs, joint reviews & planning
Smart Maintenance
Concepts and tools• Intelligence & Big Data
Analytics• Multi-site maintenance
optimization• Advanced maintenance
tools
Years of experience
Employees Operational sites
HQ in Stockholm, Sweden
MEUR 205.5
PortfolioRevenue
Quant’s timeline
Quant today
Quant – Best in class industrial maintenance provider
Quant is the number one partner in supporting the customer journey towards Smart Maintenance. Smart Maintenance is achieved by a systematic maintenance approach with integrated digital tools to drive technical availability, productivity and safety. The success is a result of strong collaboration between Quant and its customers.
2018
Acquistion of Sataservice
Q U A N T A N N U A L R E P O R T 2 0 1 8
Q U A N T A N N U A L R E P O R T
2 0 1 8
7
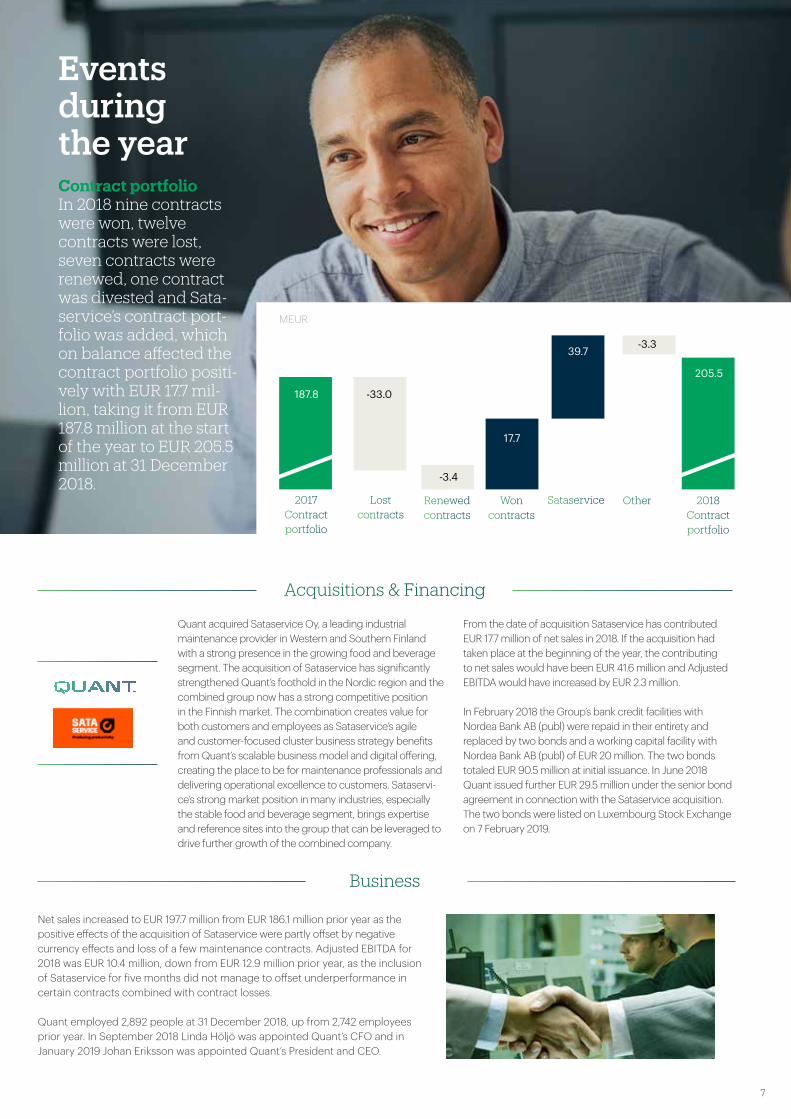
Events during the year
Net sales increased to EUR 197.7 million from EUR 186.1 million prior year as the positive effects of the acquisition of Sataservice were partly offset by negative currency effects and loss of a few maintenance contracts. Adjusted EBITDA for 2018 was EUR 10.4 million, down from EUR 12.9 million prior year, as the inclusion of Sataservice for five months did not manage to offset underperformance in certain contracts combined with contract losses.
Quant employed 2,892 people at 31 December 2018, up from 2,742 employees prior year. In September 2018 Linda Höljö was appointed Quant’s CFO and in January 2019 Johan Eriksson was appointed Quant’s President and CEO.
Quant acquired Sataservice Oy, a leading industrial maintenance provider in Western and Southern Finland with a strong presence in the growing food and beverage segment. The acquisition of Sataservice has significantly strengthened Quant’s foothold in the Nordic region and the combined group now has a strong competitive position in the Finnish market. The combination creates value for both customers and employees as Sataservice’s agile and customer-focused cluster business strategy benefits from Quant’s scalable business model and digital offering, creating the place to be for maintenance professionals and delivering operational excellence to customers. Sataservi-ce’s strong market position in many industries, especially the stable food and beverage segment, brings expertise and reference sites into the group that can be leveraged to drive further growth of the combined company.
From the date of acquisition Sataservice has contributed EUR 17.7 million of net sales in 2018. If the acquisition had taken place at the beginning of the year, the contributing to net sales would have been EUR 41.6 million and Adjusted EBITDA would have increased by EUR 2.3 million.
In February 2018 the Group’s bank credit facilities with Nordea Bank AB (publ) were repaid in their entirety and replaced by two bonds and a working capital facility with Nordea Bank AB (publ) of EUR 20 million. The two bonds totaled EUR 90.5 million at initial issuance. In June 2018 Quant issued further EUR 29.5 million under the senior bond agreement in connection with the Sataservice acquisition. The two bonds were listed on Luxembourg Stock Exchange on 7 February 2019.
Contract portfolio In 2018 nine contracts were won, twelve contracts were lost, seven contracts were renewed, one contract was divested and Sata-service’s contract port-folio was added, which on balance affected the contract portfolio positi-vely with EUR 17.7 mil-lion, taking it from EUR 187.8 million at the start of the year to EUR 205.5 million at 31 December 2018.
Acquisitions & Financing
Business
“EUR 120 million Bond issuance”
2017Contract portfolio
Lostcontracts
Renewed contracts
Woncontracts
Sataservice Other 2018Contract portfolio
187.8
17.7
39.7
205.5
-33.0
-3.4
-3.3
MEUR
Q U A N T A N N U A L R E P O R T 2 0 1 8
8
For 30 years, Quant has been the leading maintenance partner for companies in a large variety of sectors. Maintenance in its core is all about improving production efficiency by maintaining and improving fixed assets, processes and tools. Good maintenance increases the value and expected lifetime of production equipment. An efficient maintenance strategy and execution improves our customers’ productivity due to less downtime.
Quant’s business strategy enables the Group’s vision to become the global leader in realizing the full potential of maintenance. The business strategy is built on Quant’s three core values.
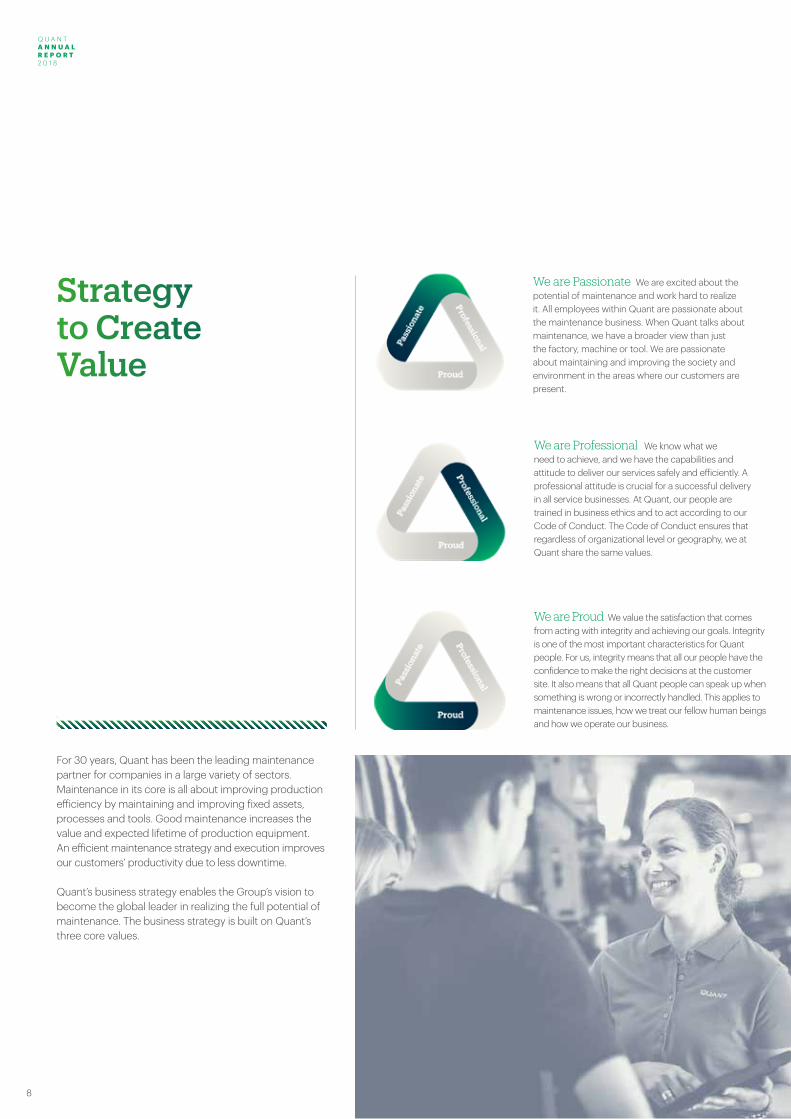
Strategy to Create Value
We are Passionate We are excited about the potential of maintenance and work hard to realize it. All employees within Quant are passionate about the maintenance business. When Quant talks about maintenance, we have a broader view than just the factory, machine or tool. We are passionate about maintaining and improving the society and environment in the areas where our customers are present.
We are Professional We know what we need to achieve, and we have the capabilities and attitude to deliver our services safely and efficiently. A professional attitude is crucial for a successful delivery in all service businesses. At Quant, our people are trained in business ethics and to act according to our Code of Conduct. The Code of Conduct ensures that regardless of organizational level or geography, we at Quant share the same values.
We are Proud We value the satisfaction that comes from acting with integrity and achieving our goals. Integrity is one of the most important characteristics for Quant people. For us, integrity means that all our people have the confidence to make the right decisions at the customer site. It also means that all Quant people can speak up when something is wrong or incorrectly handled. This applies to maintenance issues, how we treat our fellow human beings and how we operate our business.
Q U A N T A N N U A L R E P O R T 2 0 1 8
Q U A N T A N N U A L R E P O R T
2 0 1 8
9
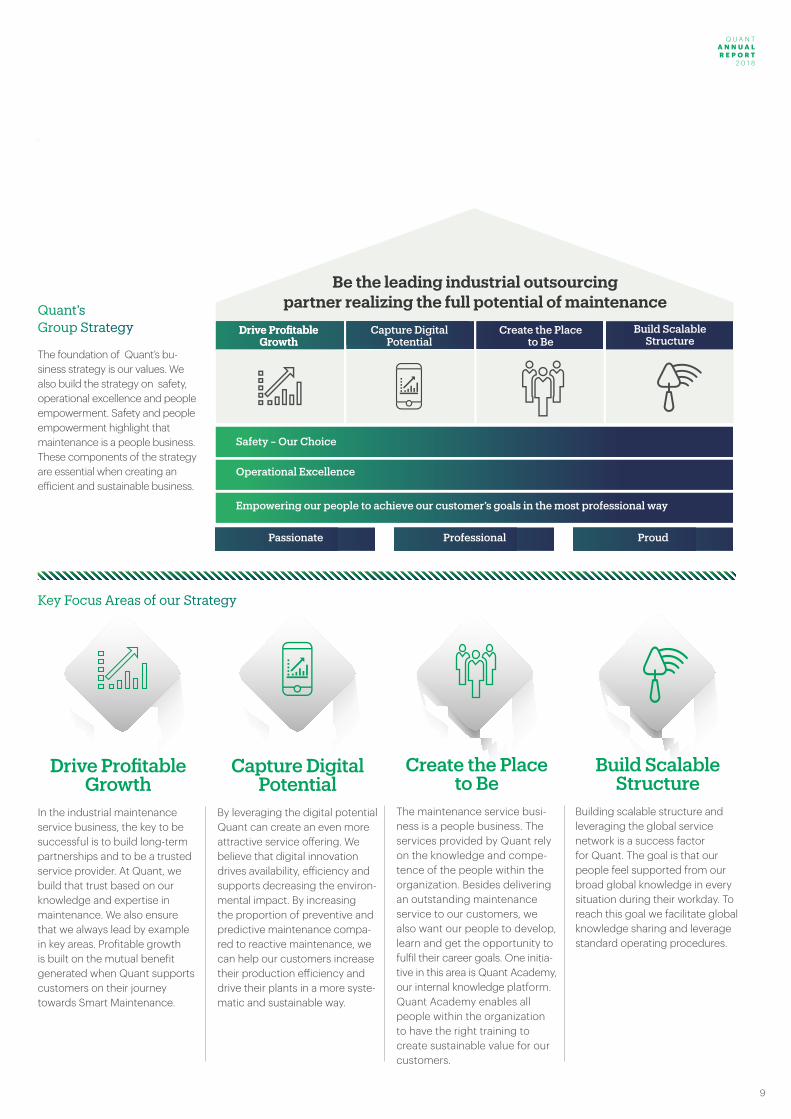
Key Focus Areas of our Strategy
Drive Profitable Growth
In the industrial maintenance service business, the key to be successful is to build long-term partnerships and to be a trusted service provider. At Quant, we build that trust based on our knowledge and expertise in maintenance. We also ensure that we always lead by example in key areas. Profitable growth is built on the mutual benefit generated when Quant supports customers on their journey towards Smart Maintenance.
Build Scalable Structure
Building scalable structure and leveraging the global service network is a success factor for Quant. The goal is that our people feel supported from our broad global knowledge in every situation during their workday. To reach this goal we facilitate global knowledge sharing and leverage standard operating procedures.
Capture Digital Potential
By leveraging the digital potential Quant can create an even more attractive service offering. We believe that digital innovation drives availability, efficiency and supports decreasing the environ-mental impact. By increasing the proportion of preventive and predictive maintenance compa-red to reactive maintenance, we can help our customers increase their production efficiency and drive their plants in a more syste-matic and sustainable way.
Create the Place to Be
The maintenance service busi-ness is a people business. The services provided by Quant rely on the knowledge and compe-tence of the people within the organization. Besides delivering an outstanding maintenance service to our customers, we also want our people to develop, learn and get the opportunity to fulfil their career goals. One initia-tive in this area is Quant Academy, our internal knowledge platform. Quant Academy enables all people within the organization to have the right training to create sustainable value for our customers.
Quant’s Group Strategy
The foundation of Quant’s bu-siness strategy is our values. We also build the strategy on safety, operational excellence and people empowerment. Safety and people empowerment highlight that maintenance is a people business. These components of the strategy are essential when creating an efficient and sustainable business.
Be the leading industrial outsourcing partner realizing the full potential of maintenance
Drive ProfitableGrowth
Capture Digital Potential
Create the Place to Be
Build ScalableStructure
Safety – Our Choice
Operational Excellence
Empowering our people to achieve our customer’s goals in the most professional way
Passionate Professional Proud
Drive Profitable Growth
Q U A N T A N N U A L R E P O R T 2 0 1 8
10
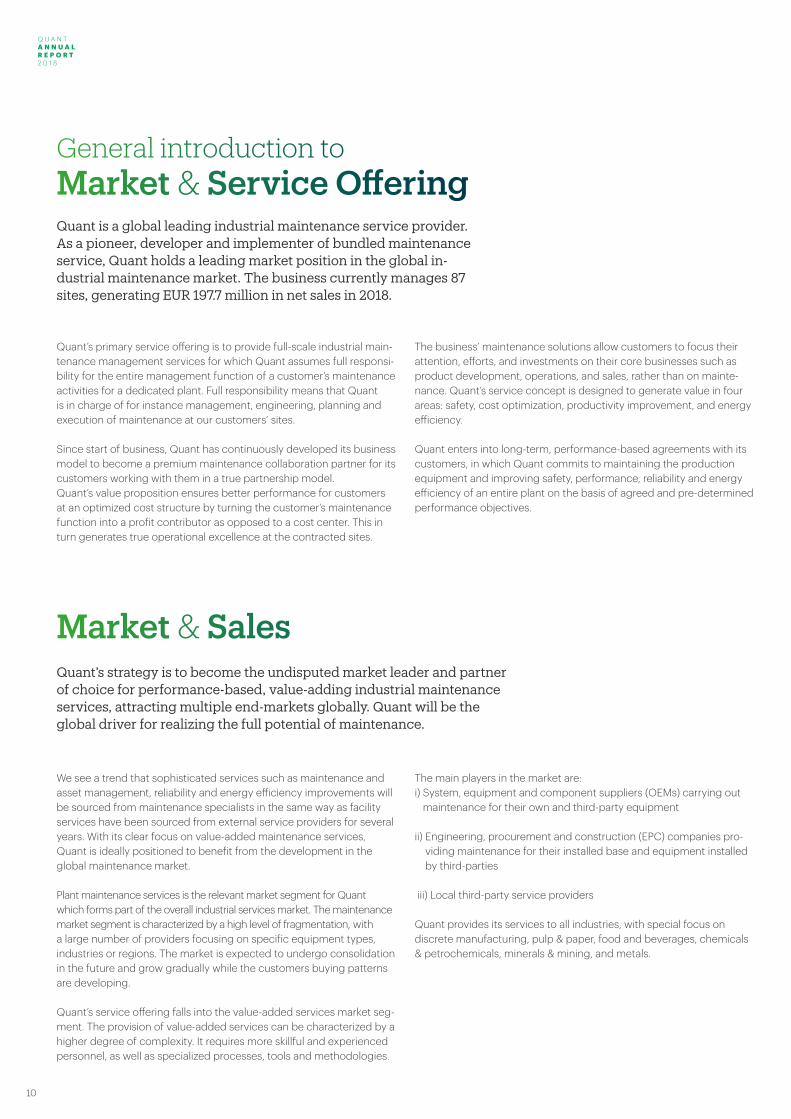
Quant’s primary service offering is to provide full-scale industrial main-tenance management services for which Quant assumes full responsi-bility for the entire management function of a customer’s maintenance activities for a dedicated plant. Full responsibility means that Quant is in charge of for instance management, engineering, planning and execution of maintenance at our customers’ sites.
Since start of business, Quant has continuously developed its business model to become a premium maintenance collaboration partner for its customers working with them in a true partnership model. Quant’s value proposition ensures better performance for customers at an optimized cost structure by turning the customer’s maintenance function into a profit contributor as opposed to a cost center. This in turn generates true operational excellence at the contracted sites.
The business’ maintenance solutions allow customers to focus their attention, efforts, and investments on their core businesses such as product development, operations, and sales, rather than on mainte-nance. Quant’s service concept is designed to generate value in four areas: safety, cost optimization, productivity improvement, and energy efficiency.
Quant enters into long-term, performance-based agreements with its customers, in which Quant commits to maintaining the production equipment and improving safety, performance, reliability and energy efficiency of an entire plant on the basis of agreed and pre-determined performance objectives.
General introduction to Market & Service Offering
We see a trend that sophisticated services such as maintenance and asset management, reliability and energy efficiency improvements will be sourced from maintenance specialists in the same way as facility services have been sourced from external service providers for several years. With its clear focus on value-added maintenance services, Quant is ideally positioned to benefit from the development in the global maintenance market.
Plant maintenance services is the relevant market segment for Quant which forms part of the overall industrial services market. The maintenance market segment is characterized by a high level of fragmentation, with a large number of providers focusing on specific equipment types, industries or regions. The market is expected to undergo consolidation in the future and grow gradually while the customers buying patterns are developing.
Quant’s service offering falls into the value-added services market seg-ment. The provision of value-added services can be characterized by a higher degree of complexity. It requires more skillful and experienced personnel, as well as specialized processes, tools and methodologies.
The main players in the market are: i) System, equipment and component suppliers (OEMs) carrying out
maintenance for their own and third-party equipment
ii) Engineering, procurement and construction (EPC) companies pro-viding maintenance for their installed base and equipment installed by third-parties
iii) Local third-party service providers
Quant provides its services to all industries, with special focus on discrete manufacturing, pulp & paper, food and beverages, chemicals & petrochemicals, minerals & mining, and metals.
Market & Sales
Quant is a global leading industrial maintenance service provider. As a pioneer, developer and implementer of bundled maintenance service, Quant holds a leading market position in the global in-dustrial maintenance market. The business currently manages 87 sites, generating EUR 197.7 million in net sales in 2018.
Quant’s strategy is to become the undisputed market leader and partner of choice for performance-based, value-adding industrial maintenance services, attracting multiple end-markets globally. Quant will be the global driver for realizing the full potential of maintenance.

Q U A N T A N N U A L R E P O R T 2 0 1 8
Q U A N T A N N U A L R E P O R T
2 0 1 8
11
Chemicals & Petrochemicals
DiscreteManufacturing
Food &Beverages
Metals Mining &Minerals
Oil &Gas
Pulp &Paper
Service Stations
Utilities
Quant serves a diversified global customer base, main-taining long-term relation- ships with its major custo-mers. Quant operated at 87 sites at the end of the year, in 30 countries, serving more than 45 customers. Our references span over 300 customers of which several are long-term partners.
11
Q U A N T A N N U A L R E P O R T 2 0 1 8
12
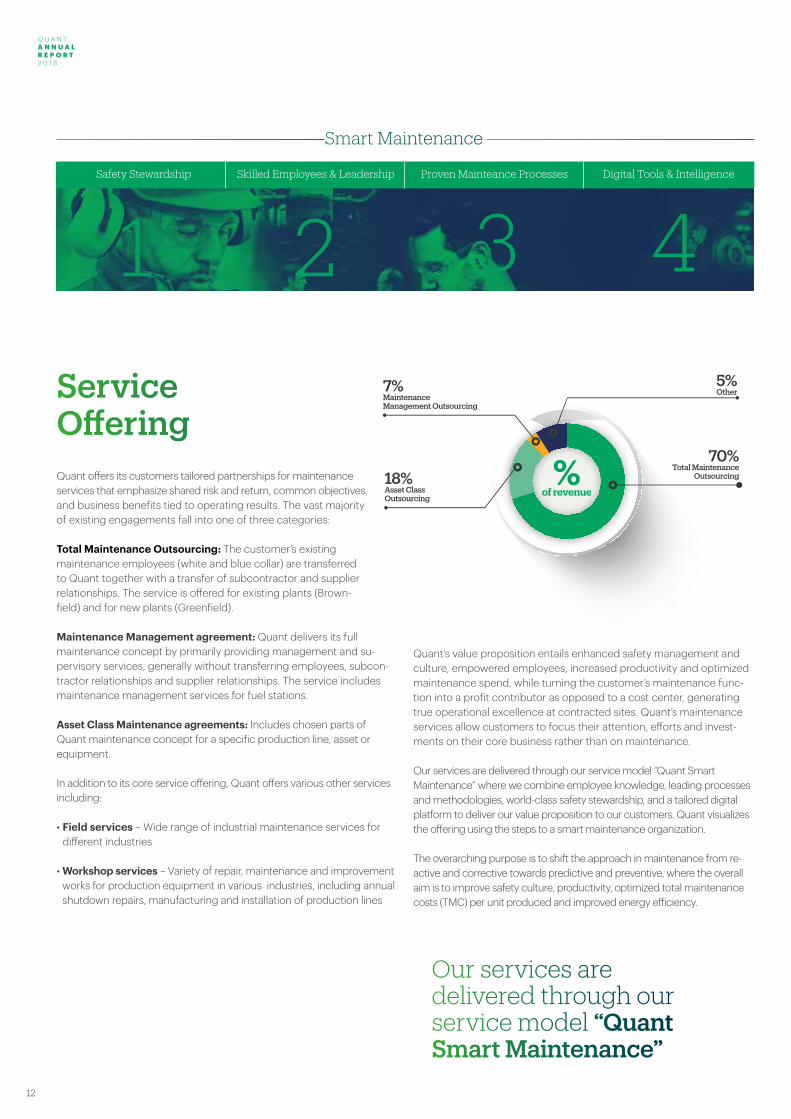
Quant offers its customers tailored partnerships for maintenance services that emphasize shared risk and return, common objectives, and business benefits tied to operating results. The vast majority of existing engagements fall into one of three categories:
Total Maintenance Outsourcing: The customer’s existing maintenance employees (white and blue collar) are transferred to Quant together with a transfer of subcontractor and supplier relationships. The service is offered for existing plants (Brown-field) and for new plants (Greenfield).
Maintenance Management agreement: Quant delivers its full maintenance concept by primarily providing management and su-pervisory services, generally without transferring employees, subcon-tractor relationships and supplier relationships. The service includes maintenance management services for fuel stations.
Asset Class Maintenance agreements: Includes chosen parts of Quant maintenance concept for a specific production line, asset or equipment.
In addition to its core service offering, Quant offers various other services including:
• Field services – Wide range of industrial maintenance services for different industries
• Workshop services – Variety of repair, maintenance and improvement works for production equipment in various industries, including annual shutdown repairs, manufacturing and installation of production lines
Quant’s value proposition entails enhanced safety management and culture, empowered employees, increased productivity and optimized maintenance spend, while turning the customer’s maintenance func-tion into a profit contributor as opposed to a cost center, generating true operational excellence at contracted sites. Quant’s maintenance services allow customers to focus their attention, efforts and invest-ments on their core business rather than on maintenance.
Our services are delivered through our service model “Quant Smart Maintenance” where we combine employee knowledge, leading processes and methodologies, world-class safety stewardship, and a tailored digital platform to deliver our value proposition to our customers. Quant visualizes the offering using the steps to a smart maintenance organization.
The overarching purpose is to shift the approach in maintenance from re-active and corrective towards predictive and preventive, where the overall aim is to improve safety culture, productivity, optimized total maintenance costs (TMC) per unit produced and improved energy efficiency.
Service Offering
.
Smart Maintenance
1 2 3 4Safety Stewardship Skilled Employees & Leadership Proven Mainteance Processes Digital Tools & Intelligence
70% Total Maintenance
Outsourcing
5% Other
18% Asset ClassOutsourcing
7% Maintenance Management Outsourcing
Our services are delivered through our service model “Quant Smart Maintenance”
Q U A N T A N N U A L R E P O R T 2 0 1 8
Q U A N T A N N U A L R E P O R T
2 0 1 8
13
Smart Maintenance
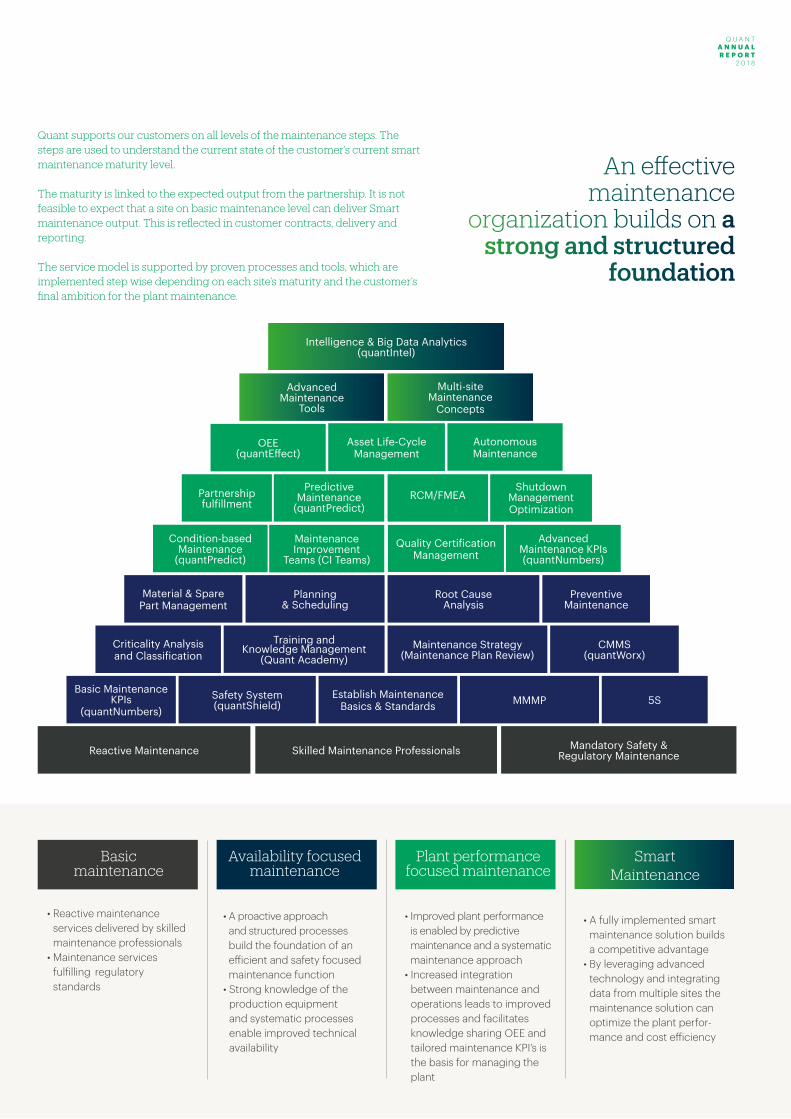
• A fully implemented smart maintenance solution builds a competitive advantage
• By leveraging advanced technology and integrating data from multiple sites the maintenance solution can optimize the plant perfor-mance and cost efficiency
Basic maintenance
• Reactive maintenance services delivered by skilled maintenance professionals
• Maintenance services fulfilling regulatory standards
Availability focused maintenance
• A proactive approach and structured processes build the foundation of an efficient and safety focused maintenance function
• Strong knowledge of the production equipment and systematic processes enable improved technical availability
Plant performance focused maintenance
• Improved plant performance is enabled by predictive maintenance and a systematic maintenance approach
• Increased integration between maintenance and operations leads to improved processes and facilitates knowledge sharing OEE and tailored maintenance KPI’s is the basis for managing the plant
Reactive Maintenance Skilled Maintenance Professionals Mandatory Safety & Regulatory Maintenance
Basic Maintenance KPIs
(quantNumbers)Safety System (quantShield)
Establish Maintenance Basics & Standards MMMP 5S
Criticality Analysis and Classification
Training and Knowledge Management
(Quant Academy)Maintenance Strategy
(Maintenance Plan Review)CMMS
(quantWorx)
Material & Spare Part Management
Planning & Scheduling
Root Cause Analysis
Preventive Maintenance
Maintenance Improvement
Teams (CI Teams)Quality Certification
ManagementAdvanced
Maintenance KPIs (quantNumbers)
Condition-based Maintenance
(quantPredict)
Predictive Maintenance
(quantPredict)Partnership fulfillment
Shutdown Management Optimization
RCM/FMEA
OEE(quantEffect)
Autonomous Maintenance
Asset Life-Cycle Management
Multi-site Maintenance
Concepts
Advanced Maintenance
Tools
Intelligence & Big Data Analytics(quantIntel)
Quant supports our customers on all levels of the maintenance steps. The steps are used to understand the current state of the customer’s current smart maintenance maturity level.
The maturity is linked to the expected output from the partnership. It is not feasible to expect that a site on basic maintenance level can deliver Smart maintenance output. This is reflected in customer contracts, delivery and reporting.
The service model is supported by proven processes and tools, which are implemented step wise depending on each site’s maturity and the customer’s final ambition for the plant maintenance.
An effective maintenance
organization builds on a strong and structured
foundation
Q U A N T A N N U A L R E P O R T 2 0 1 8
14
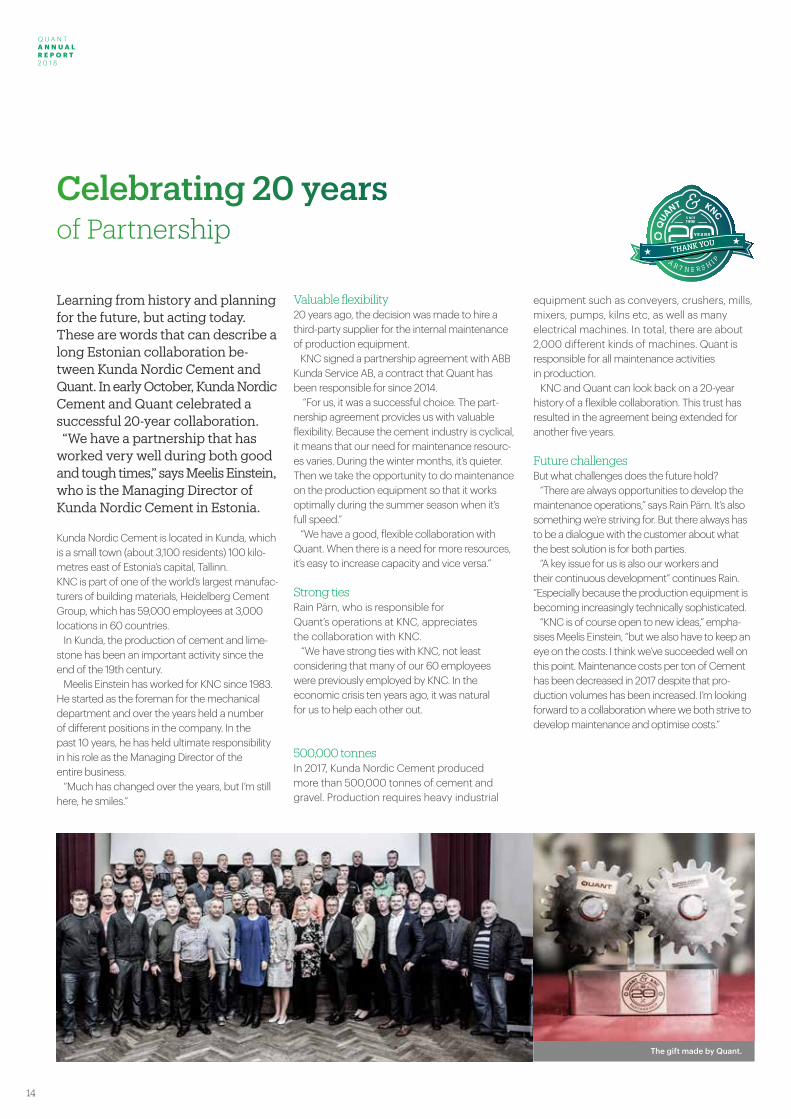
Celebrating 20 years of Partnership
Learning from history and planning for the future, but acting today. These are words that can describe a long Estonian collaboration be-tween Kunda Nordic Cement and Quant. In early October, Kunda Nordic Cement and Quant celebrated a successful 20-year collaboration. “We have a partnership that has worked very well during both good and tough times,” says Meelis Einstein, who is the Managing Director of Kunda Nordic Cement in Estonia.
Kunda Nordic Cement is located in Kunda, which is a small town (about 3,100 residents) 100 kilo-metres east of Estonia’s capital, Tallinn.KNC is part of one of the world’s largest manufac-turers of building materials, Heidelberg Cement Group, which has 59,000 employees at 3,000 locations in 60 countries. In Kunda, the production of cement and lime-stone has been an important activity since the end of the 19th century. Meelis Einstein has worked for KNC since 1983. He started as the foreman for the mechanical department and over the years held a number of different positions in the company. In the past 10 years, he has held ultimate responsibility in his role as the Managing Director of the entire business. “Much has changed over the years, but I’m still here, he smiles.”
Valuable flexibility20 years ago, the decision was made to hire a third-party supplier for the internal maintenance of production equipment. KNC signed a partnership agreement with ABB Kunda Service AB, a contract that Quant has been responsible for since 2014. “For us, it was a successful choice. The part-nership agreement provides us with valuable flexibility. Because the cement industry is cyclical, it means that our need for maintenance resourc-es varies. During the winter months, it’s quieter. Then we take the opportunity to do maintenance on the production equipment so that it works optimally during the summer season when it’s full speed.” “We have a good, flexible collaboration with Quant. When there is a need for more resources, it’s easy to increase capacity and vice versa.”
Strong tiesRain Pärn, who is responsible for Quant’s operations at KNC, appreciates the collaboration with KNC. “We have strong ties with KNC, not least considering that many of our 60 employees were previously employed by KNC. In the economic crisis ten years ago, it was natural for us to help each other out.
500,000 tonnesIn 2017, Kunda Nordic Cement produced more than 500,000 tonnes of cement and gravel. Production requires heavy industrial
equipment such as conveyers, crushers, mills, mixers, pumps, kilns etc, as well as many electrical machines. In total, there are about 2,000 different kinds of machines. Quant is responsible for all maintenance activities in production. KNC and Quant can look back on a 20-year history of a flexible collaboration. This trust has resulted in the agreement being extended for another five years.
Future challengesBut what challenges does the future hold? “There are always opportunities to develop the maintenance operations,” says Rain Pärn. It’s also something we’re striving for. But there always has to be a dialogue with the customer about what the best solution is for both parties. “A key issue for us is also our workers and their continuous development” continues Rain. “Especially because the production equipment is becoming increasingly technically sophisticated. “KNC is of course open to new ideas,” empha-sises Meelis Einstein, “but we also have to keep an eye on the costs. I think we’ve succeeded well on this point. Maintenance costs per ton of Cement has been decreased in 2017 despite that pro-duction volumes has been increased. I’m looking forward to a collaboration where we both strive to develop maintenance and optimise costs.”
The gift made by Quant.
Q U A N T A N N U A L R E P O R T 2 0 1 8
Q U A N T A N N U A L R E P O R T
2 0 1 8
15
Celebrating 20 years of Partnership
Q U A N T A N N U A L R E P O R T 2 0 1 8
16
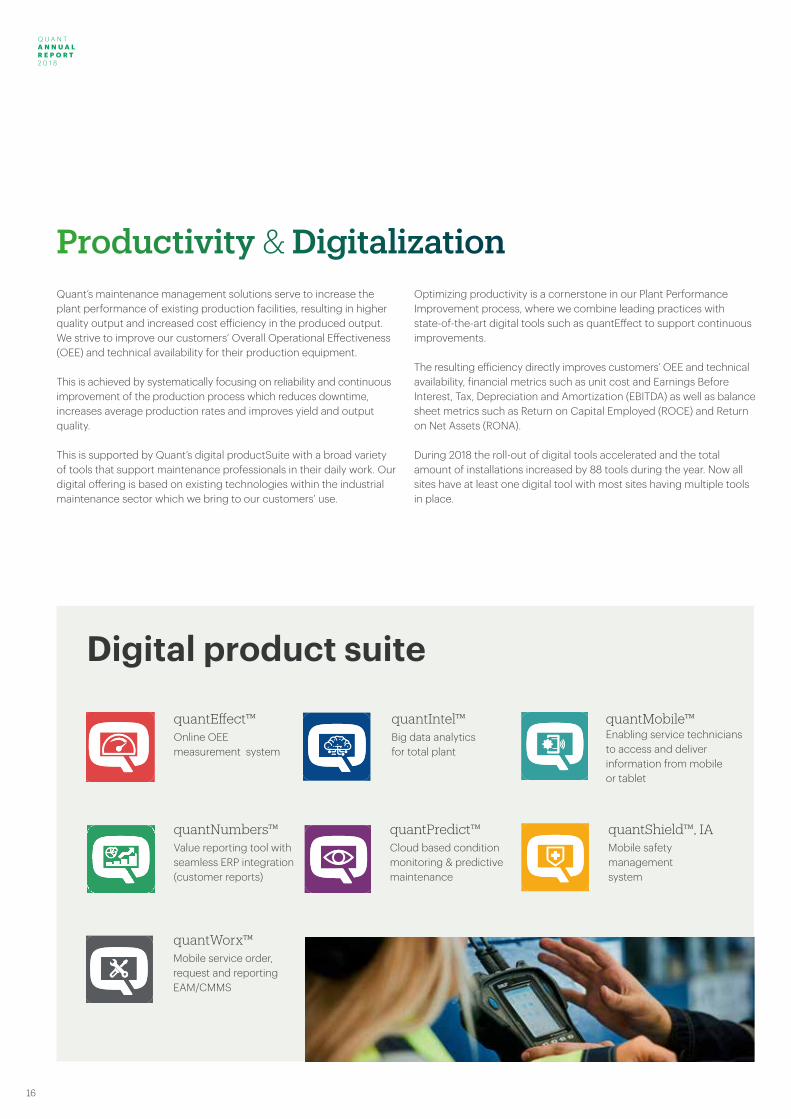
Quant’s maintenance management solutions serve to increase the plant performance of existing production facilities, resulting in higher quality output and increased cost efficiency in the produced output. We strive to improve our customers’ Overall Operational Effectiveness (OEE) and technical availability for their production equipment.
This is achieved by systematically focusing on reliability and continuous improvement of the production process which reduces downtime, increases average production rates and improves yield and output quality.
This is supported by Quant’s digital productSuite with a broad variety of tools that support maintenance professionals in their daily work. Our digital offering is based on existing technologies within the industrial maintenance sector which we bring to our customers’ use.
Optimizing productivity is a cornerstone in our Plant Performance Improvement process, where we combine leading practices with state-of-the-art digital tools such as quantEffect to support continuous improvements.
The resulting efficiency directly improves customers’ OEE and technical availability, financial metrics such as unit cost and Earnings Before Interest, Tax, Depreciation and Amortization (EBITDA) as well as balance sheet metrics such as Return on Capital Employed (ROCE) and Return on Net Assets (RONA).
During 2018 the roll-out of digital tools accelerated and the total amount of installations increased by 88 tools during the year. Now all sites have at least one digital tool with most sites having multiple tools in place.
Productivity & Digitalization
quantEffect™ Online OEE measurement system
quantIntel™ Big data analytics for total plant
quantMobile™ Enabling service technicians to access and deliver information from mobileor tablet
quantNumbers™ Value reporting tool with seamless ERP integration (customer reports)
quantPredict™ Cloud based condition monitoring & predictivemaintenance
quantShield™, IA Mobile safety management system
quantWorx™ Mobile service order, request and reporting EAM/CMMS
Digital product suite
Q U A N T A N N U A L R E P O R T 2 0 1 8
Q U A N T A N N U A L R E P O R T
2 0 1 8
17
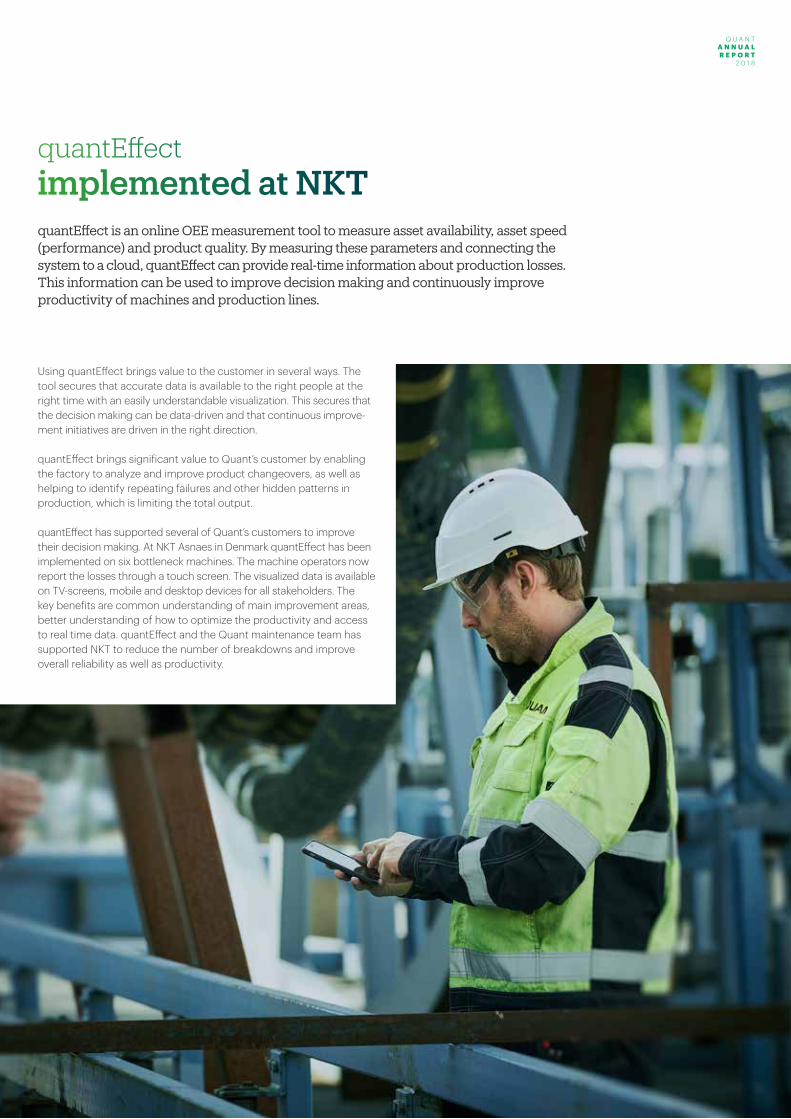
quantEffect implemented at NKTquantEffect is an online OEE measurement tool to measure asset availability, asset speed (performance) and product quality. By measuring these parameters and connecting the system to a cloud, quantEffect can provide real-time information about production losses. This information can be used to improve decision making and continuously improve productivity of machines and production lines.
Using quantEffect brings value to the customer in several ways. The tool secures that accurate data is available to the right people at the right time with an easily understandable visualization. This secures that the decision making can be data-driven and that continuous improve-ment initiatives are driven in the right direction.
quantEffect brings significant value to Quant’s customer by enabling the factory to analyze and improve product changeovers, as well as helping to identify repeating failures and other hidden patterns in production, which is limiting the total output.
quantEffect has supported several of Quant’s customers to improve their decision making. At NKT Asnaes in Denmark quantEffect has been implemented on six bottleneck machines. The machine operators now report the losses through a touch screen. The visualized data is available on TV-screens, mobile and desktop devices for all stakeholders. The key benefits are common understanding of main improvement areas, better understanding of how to optimize the productivity and access to real time data. quantEffect and the Quant maintenance team has supported NKT to reduce the number of breakdowns and improve overall reliability as well as productivity.
Q U A N T A N N U A L R E P O R T 2 0 1 8
18
Efficient use of energy has a direct impact on a manufacturer’s profi-tability and sustainability as many plants’ energy costs and efficiency can be as important as overall maintenance costs. Quant’s experience indicates that well-maintained equipment results in higher gains from improved energy efficiency. Quant’s maintenance solutions therefore contain an energy efficiency program that focuses on improving specific energy-related components at the respective site. This includes measuring and identifying energy losses, developing and implementing energy efficiency projects, considering energy efficiency in spare part purchasing decisions and implementing ISO 50001 programs as well as energy management and optimization software.
Energy Efficiency
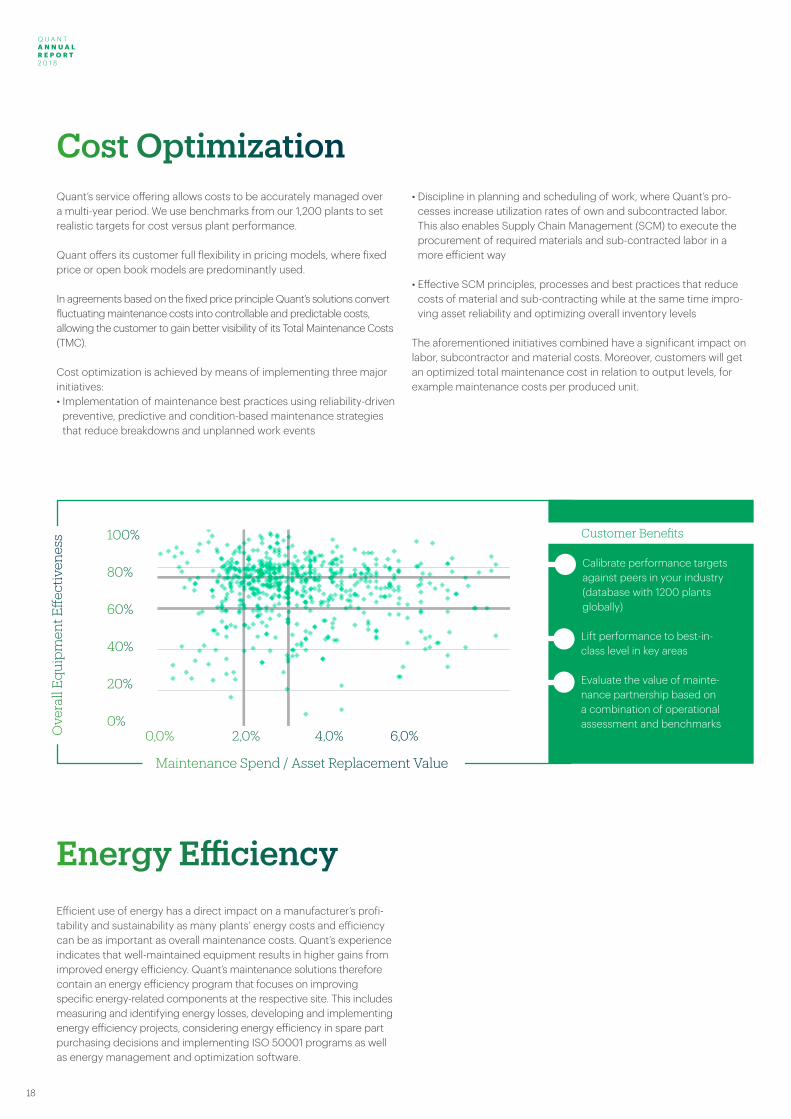
Quant’s service offering allows costs to be accurately managed over a multi-year period. We use benchmarks from our 1,200 plants to set realistic targets for cost versus plant performance.
Quant offers its customer full flexibility in pricing models, where fixed price or open book models are predominantly used.
In agreements based on the fixed price principle Quant’s solutions convert fluctuating maintenance costs into controllable and predictable costs, allowing the customer to gain better visibility of its Total Maintenance Costs (TMC).
Cost optimization is achieved by means of implementing three major initiatives: • Implementation of maintenance best practices using reliability-driven
preventive, predictive and condition-based maintenance strategies that reduce breakdowns and unplanned work events
• Discipline in planning and scheduling of work, where Quant’s pro-cesses increase utilization rates of own and subcontracted labor. This also enables Supply Chain Management (SCM) to execute the procurement of required materials and sub-contracted labor in a more efficient way
• Effective SCM principles, processes and best practices that reduce costs of material and sub-contracting while at the same time impro-ving asset reliability and optimizing overall inventory levels
The aforementioned initiatives combined have a significant impact on labor, subcontractor and material costs. Moreover, customers will get an optimized total maintenance cost in relation to output levels, for example maintenance costs per produced unit.
Cost Optimization
Customer Benefits
Calibrate performance targets against peers in your industry (database with 1200 plants globally)
Lift performance to best-in-class level in key areas
Evaluate the value of mainte-nance partnership based on a combination of operational assessment and benchmarks
100%
80%
60%
40%
20%
0%0,0% 2,0% 4,0% 6,0%
80% Maintenance Spend / Asset Replacement Value
Ove
rall
Equi
pm
ent E
ffect
iven
ess

Q U A N T A N N U A L R E P O R T 2 0 1 8
Q U A N T A N N U A L R E P O R T
2 0 1 8
19
NKT develops, manufactures and markets high quality cables, accessories and solutions for electrical infrastructure, the construction field and in the rail-way industries, with production plants in Northern and Central Europe.
NKT and Quant A world class maintenance partnership
Quant’s engagement with NKT started when taking over the mainte-nance at the High Voltage plant in Karlskrona, at that time owned and operated by ABB. Since then, Quant has developed a world-leading maintenance performance at the plant and the contract has been renewed three times.
When NKT acquired the plant in 2017, they recognized the services provided by Quant and the option to leverage from this in their Excel-lence journey in their Low / Medium voltage plants. The parties agreed to form a Multi-Site Maintenance Partnership agreement, covering six of NKT plants in Europe.
Today Quant delivers maintenance in Karlskrona and Falun in Sweden, Asnaes in Denmark, Kladno and Velké Meziříčí in Czech Republic and in Warszowice in Poland.
During 2018 Quant’s focus has been to start up the new sites in Falun and Asnaes and continuous development of the site in Karlskrona.
Some achievements for new low and medium voltage sites in Scandinavia 2018:
• No Lost Time Incidents (LTI) during 2018 • Enhanced service and safety culture including implementation of
quantShield• Technical Availability in bottleneck machines clearly improved• quantEffect installed for bottleneck machines, giving full transparency
in OEE figures supporting productivity improvements• quantWorx installed establishing a platform for continuous
improvement of maintenance execution and reliability improvement process
• quantNumbers under implementation which will improve value reporting and data-driven decision making
2019 focus is to finalize startup/mobilization of sites in Czech Republic and Poland and continue setting up one way of working for all sites. This will drive the improvement of safety and reliability.
Q U A N T A N N U A L R E P O R T 2 0 1 8
20
Safety – our choice
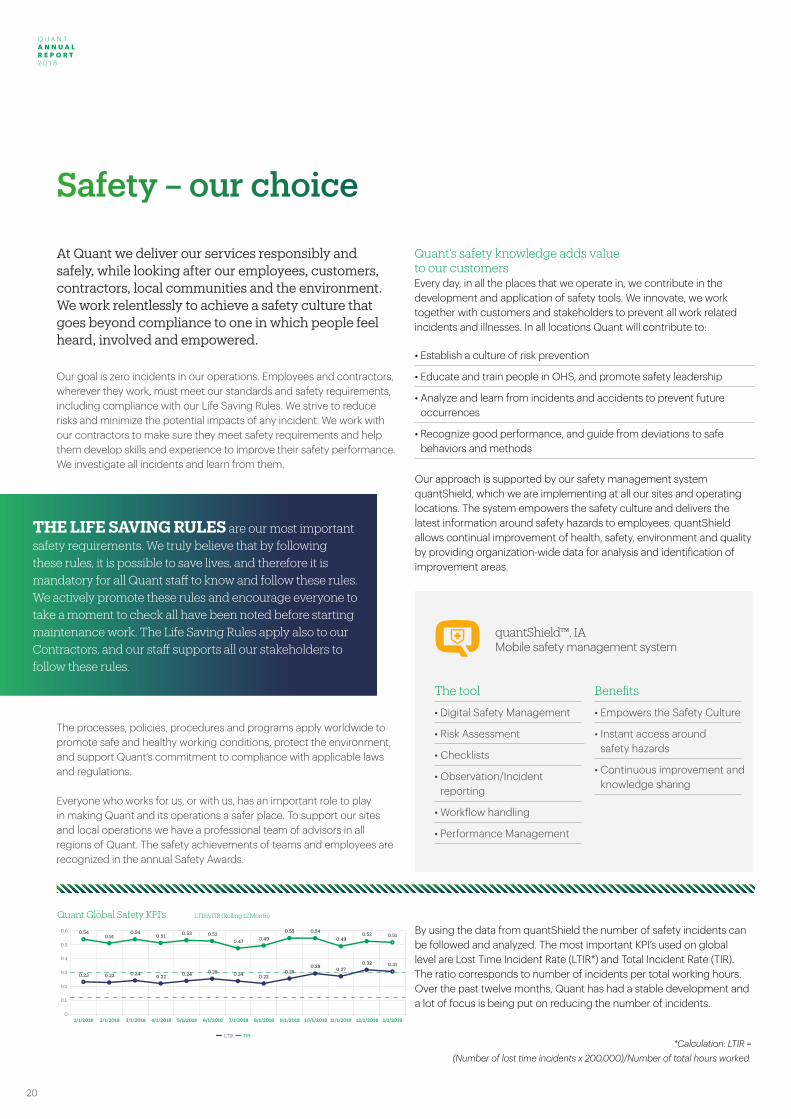
At Quant we deliver our services responsibly and safely, while looking after our employees, customers, contractors, local communities and the environment. We work relentlessly to achieve a safety culture that goes beyond compliance to one in which people feel heard, involved and empowered.
Our goal is zero incidents in our operations. Employees and contractors, wherever they work, must meet our standards and safety requirements, including compliance with our Life Saving Rules. We strive to reduce risks and minimize the potential impacts of any incident. We work with our contractors to make sure they meet safety requirements and help them develop skills and experience to improve their safety performance. We investigate all incidents and learn from them.
The processes, policies, procedures and programs apply worldwide to promote safe and healthy working conditions, protect the environment, and support Quant‘s commitment to compliance with applicable laws and regulations.
Everyone who works for us, or with us, has an important role to play in making Quant and its operations a safer place. To support our sites and local operations we have a professional team of advisors in all regions of Quant. The safety achievements of teams and employees are recognized in the annual Safety Awards.
Quant’s safety knowledge adds value to our customersEvery day, in all the places that we operate in, we contribute in the development and application of safety tools. We innovate, we work together with customers and stakeholders to prevent all work related incidents and illnesses. In all locations Quant will contribute to:
• Establish a culture of risk prevention
• Educate and train people in OHS, and promote safety leadership
• Analyze and learn from incidents and accidents to prevent future occurrences
• Recognize good performance, and guide from deviations to safe behaviors and methods
Our approach is supported by our safety management system quantShield, which we are implementing at all our sites and operating locations. The system empowers the safety culture and delivers the latest information around safety hazards to employees. quantShield allows continual improvement of health, safety, environment and quality by providing organization-wide data for analysis and identification of improvement areas.
1/1/2018 2/1/2018 3/1/2018 4/1/2018 5/1/2018 6/1/2018 7/1/2018 8/1/2018 9/1/2018 10/1/2018 11/1/2018 12/1/2018 1/1/2019
0.23
0.54
0.23
0.51
0.24
0.54
0.22
0.51
0.24
0.53
0.25
0.52
0.24
0.47
0.22
0.49
0.25
0.55
0.29
0.54
0.27
0.49
0.32
0.52
0.31
0.51
0
0.1
0.2
0.3
0.4
0.5
0.6
LTIR&TIR (Rolling 12 Month)
LTIR TIR
.
Page 1 of 1
QuantKPI_Graph
THE LIFE SAVING RULES are our most important safety requirements. We truly believe that by following these rules, it is possible to save lives, and therefore it is mandatory for all Quant staff to know and follow these rules. We actively promote these rules and encourage everyone to take a moment to check all have been noted before starting maintenance work. The Life Saving Rules apply also to our Contractors, and our staff supports all our stakeholders to follow these rules.
quantShield™, IA Mobile safety management system
The tool
• Digital Safety Management
• Risk Assessment
• Checklists
• Observation/Incident reporting
• Workflow handling
• Performance Management
Benefits
• Empowers the Safety Culture
• Instant access around safety hazards
• Continuous improvement and knowledge sharing
*Calculation: LTIR = (Number of lost time incidents x 200,000)/Number of total hours worked.
By using the data from quantShield the number of safety incidents can be followed and analyzed. The most important KPI’s used on global level are Lost Time Incident Rate (LTIR*) and Total Incident Rate (TIR). The ratio corresponds to number of incidents per total working hours. Over the past twelve months, Quant has had a stable development and a lot of focus is being put on reducing the number of incidents.
Quant Global Safety KPI’s
Q U A N T A N N U A L R E P O R T 2 0 1 8
Q U A N T A N N U A L R E P O R T
2 0 1 8
21
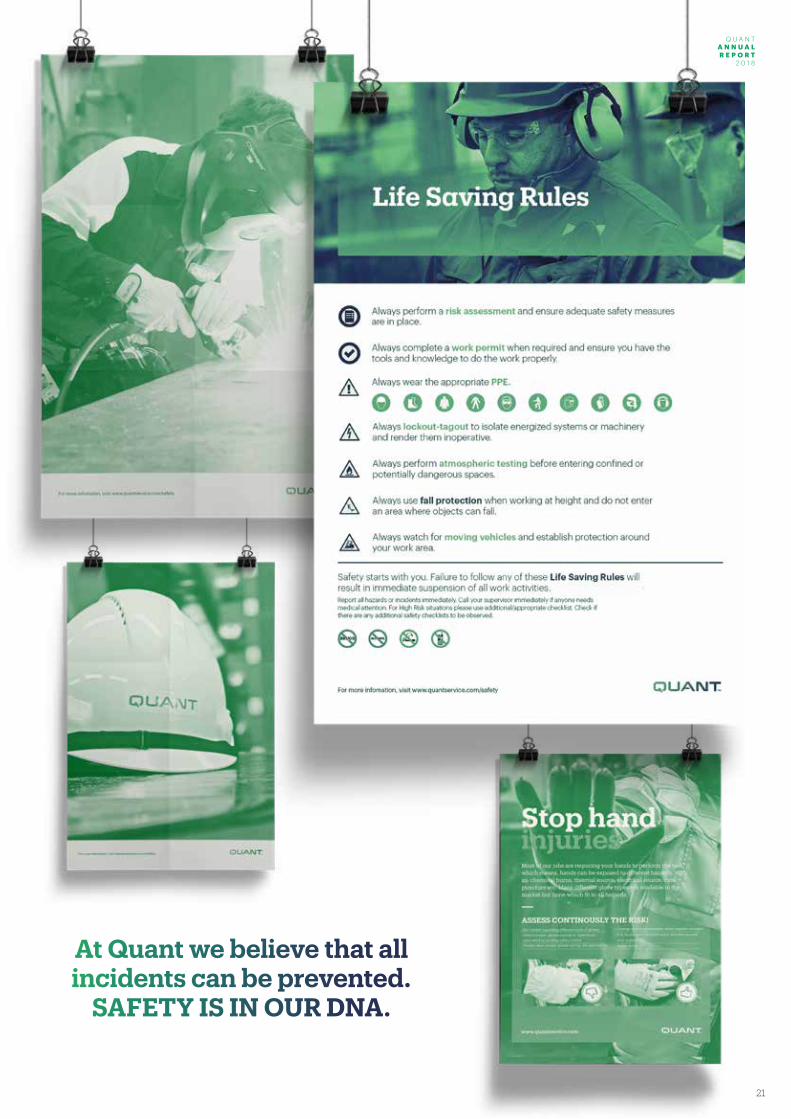
SAFETY
At Quant we believe that all incidents can be prevented.
SAFETY IS IN OUR DNA.
Benefits
• Empowers the Safety Culture
• Instant access around safety hazards
• Continuous improvement and knowledge sharing
Q U A N T A N N U A L R E P O R T 2 0 1 8
22
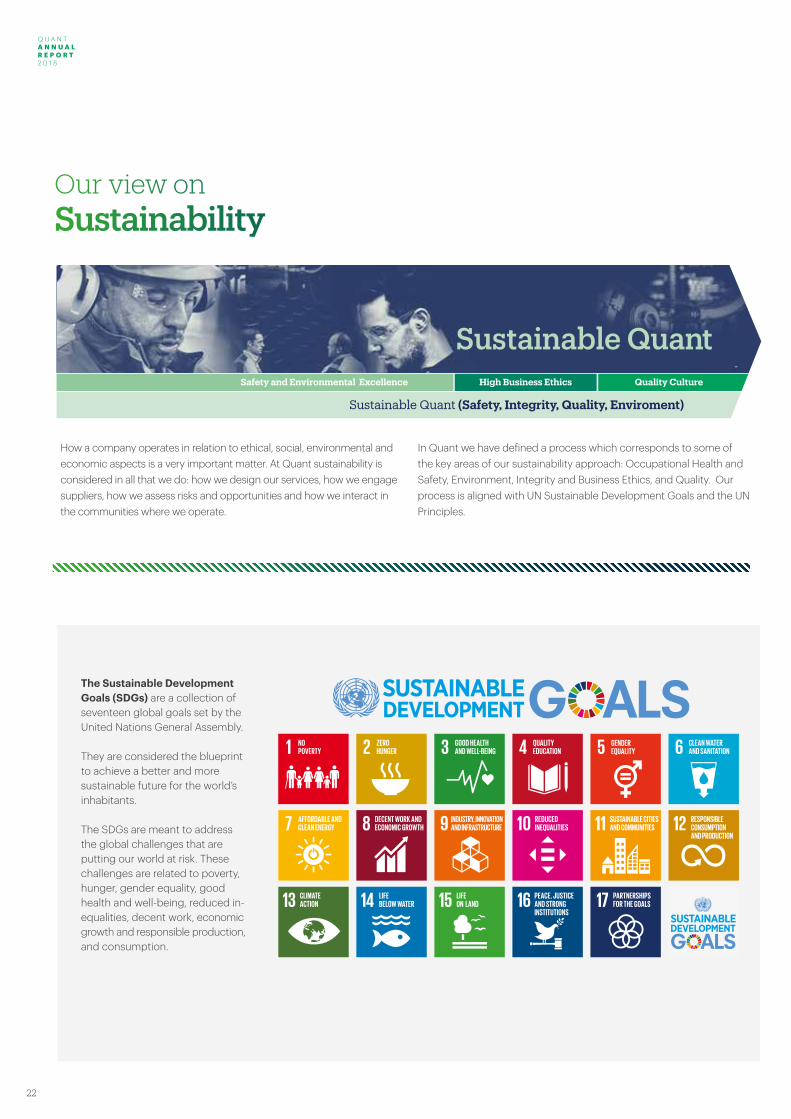
Our view on Sustainability
The Sustainable Development Goals (SDGs) are a collection of seventeen global goals set by the United Nations General Assembly.
They are considered the blueprint to achieve a better and more sustainable future for the world’s inhabitants.
The SDGs are meant to address the global challenges that are putting our world at risk. These challenges are related to poverty, hunger, gender equality, good health and well-being, reduced in-equalities, decent work, economic growth and responsible production, and consumption.
Safety and Environmental Excellence High Business Ethics Quality Culture
Sustainable Quant (Safety, Integrity, Quality, Enviroment)
Sustainable Quant
How a company operates in relation to ethical, social, environmental and economic aspects is a very important matter. At Quant sustainability is considered in all that we do: how we design our services, how we engage suppliers, how we assess risks and opportunities and how we interact in the communities where we operate.
In Quant we have defined a process which corresponds to some of the key areas of our sustainability approach: Occupational Health and Safety, Environment, Integrity and Business Ethics, and Quality. Our process is aligned with UN Sustainable Development Goals and the UN Principles.
Q U A N T A N N U A L R E P O R T 2 0 1 8
Q U A N T A N N U A L R E P O R T
2 0 1 8
23
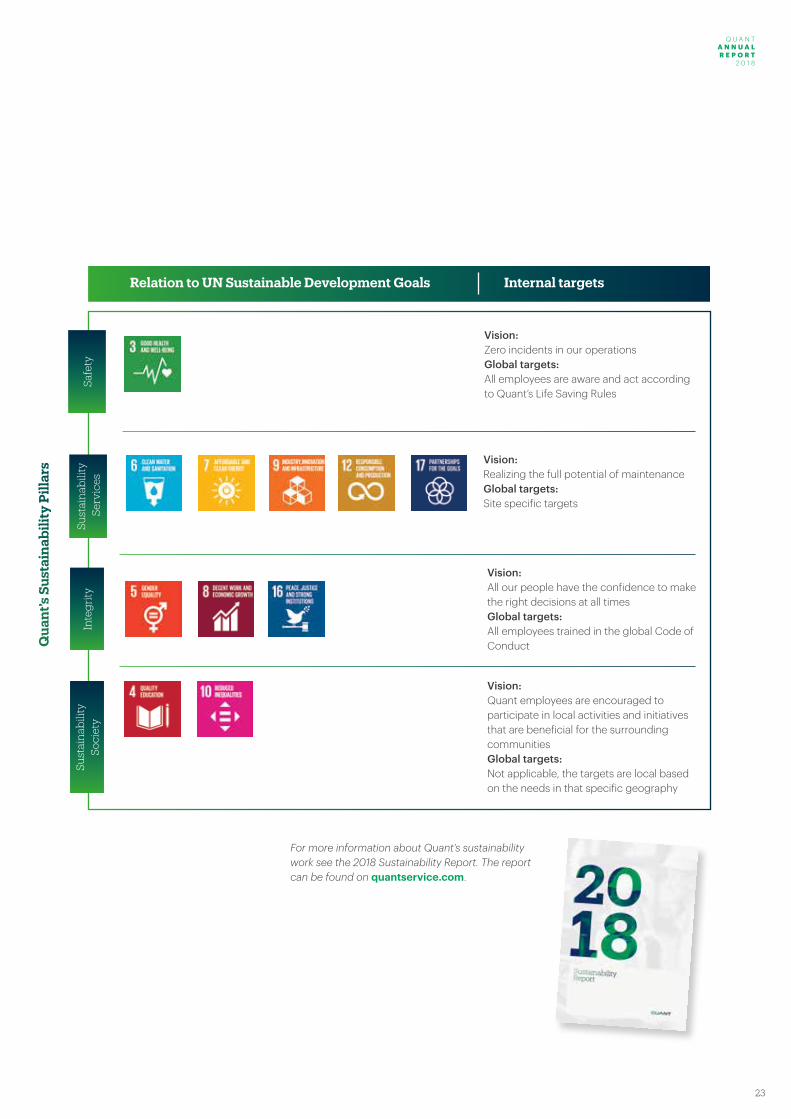
Internal targetsRelation to UN Sustainable Development Goals
Qua
nt’s
Sus
tain
abili
ty P
illar
s
Vision: Zero incidents in our operationsGlobal targets:All employees are aware and act according to Quant’s Life Saving Rules
Vision:Realizing the full potential of maintenanceGlobal targets:Site specific targets
Vision:All our people have the confidence to make the right decisions at all timesGlobal targets:All employees trained in the global Code of Conduct
Vision:Quant employees are encouraged to participate in local activities and initiatives that are beneficial for the surrounding communitiesGlobal targets:Not applicable, the targets are local based on the needs in that specific geography
Inte
grity
Safe
tySu
stai
nab
ility
Ser
vice
sSu
stai
nab
ility
So
ciet
y
For more information about Quant’s sustainability work see the 2018 Sustainability Report. The report can be found on quantservice.com.
Q U A N T A N N U A L R E P O R T 2 0 1 8
24
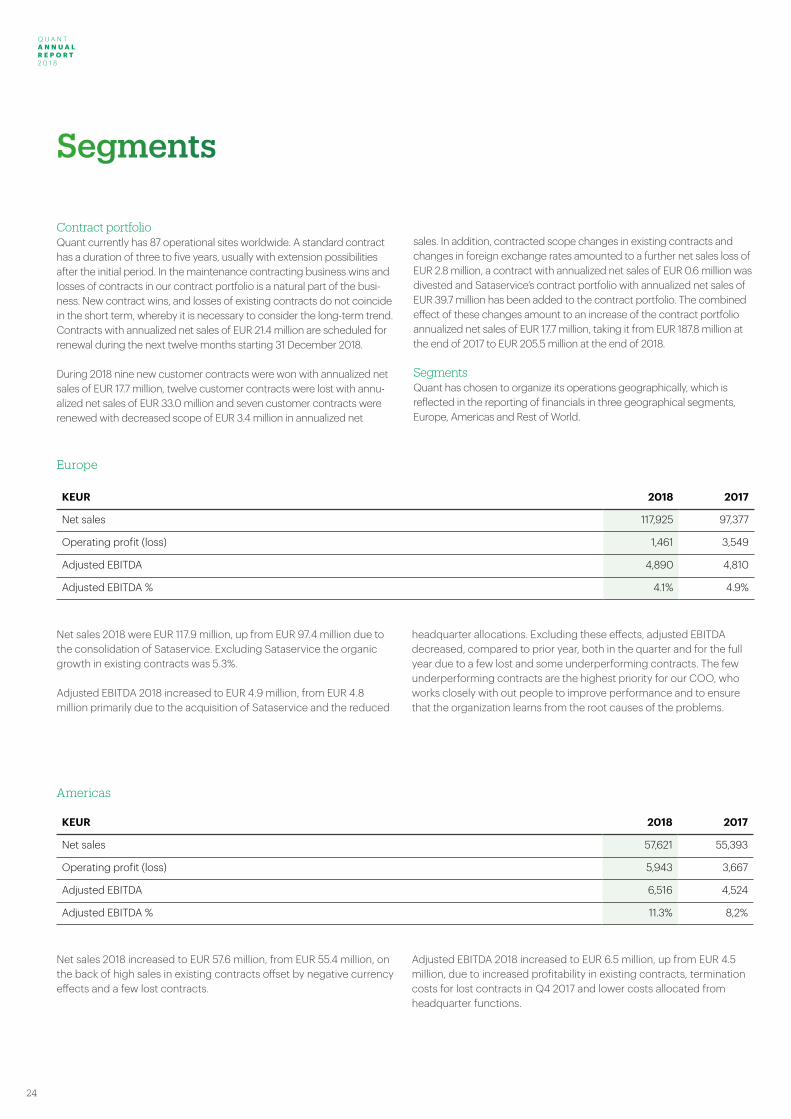
Segments
KEUR 2018 2017
Net sales 117,925 97,377
Operating profit (loss) 1,461 3,549
Adjusted EBITDA 4,890 4,810
Adjusted EBITDA % 4.1% 4.9%
Net sales 2018 were EUR 117.9 million, up from EUR 97.4 million due to the consolidation of Sataservice. Excluding Sataservice the organic growth in existing contracts was 5.3%.
Adjusted EBITDA 2018 increased to EUR 4.9 million, from EUR 4.8 million primarily due to the acquisition of Sataservice and the reduced
headquarter allocations. Excluding these effects, adjusted EBITDA decreased, compared to prior year, both in the quarter and for the full year due to a few lost and some underperforming contracts. The few underperforming contracts are the highest priority for our COO, who works closely with out people to improve performance and to ensure that the organization learns from the root causes of the problems.
Net sales 2018 increased to EUR 57.6 million, from EUR 55.4 million, on the back of high sales in existing contracts offset by negative currency effects and a few lost contracts.
Adjusted EBITDA 2018 increased to EUR 6.5 million, up from EUR 4.5 million, due to increased profitability in existing contracts, termination costs for lost contracts in Q4 2017 and lower costs allocated from headquarter functions.
Europe
Americas
Contract portfolioQuant currently has 87 operational sites worldwide. A standard contract has a duration of three to five years, usually with extension possibilities after the initial period. In the maintenance contracting business wins and losses of contracts in our contract portfolio is a natural part of the busi-ness. New contract wins, and losses of existing contracts do not coincide in the short term, whereby it is necessary to consider the long-term trend. Contracts with annualized net sales of EUR 21.4 million are scheduled for renewal during the next twelve months starting 31 December 2018.
During 2018 nine new customer contracts were won with annualized net sales of EUR 17.7 million, twelve customer contracts were lost with annu-alized net sales of EUR 33.0 million and seven customer contracts were renewed with decreased scope of EUR 3.4 million in annualized net
sales. In addition, contracted scope changes in existing contracts and changes in foreign exchange rates amounted to a further net sales loss of EUR 2.8 million, a contract with annualized net sales of EUR 0.6 million was divested and Sataservice’s contract portfolio with annualized net sales of EUR 39.7 million has been added to the contract portfolio. The combined effect of these changes amount to an increase of the contract portfolio annualized net sales of EUR 17.7 million, taking it from EUR 187.8 million at the end of 2017 to EUR 205.5 million at the end of 2018.
SegmentsQuant has chosen to organize its operations geographically, which is reflected in the reporting of financials in three geographical segments, Europe, Americas and Rest of World.
KEUR 2018 2017
Net sales 57,621 55,393
Operating profit (loss) 5,943 3,667
Adjusted EBITDA 6,516 4,524
Adjusted EBITDA % 11.3% 8,2%
Q U A N T A N N U A L R E P O R T 2 0 1 8
Q U A N T A N N U A L R E P O R T
2 0 1 8
25
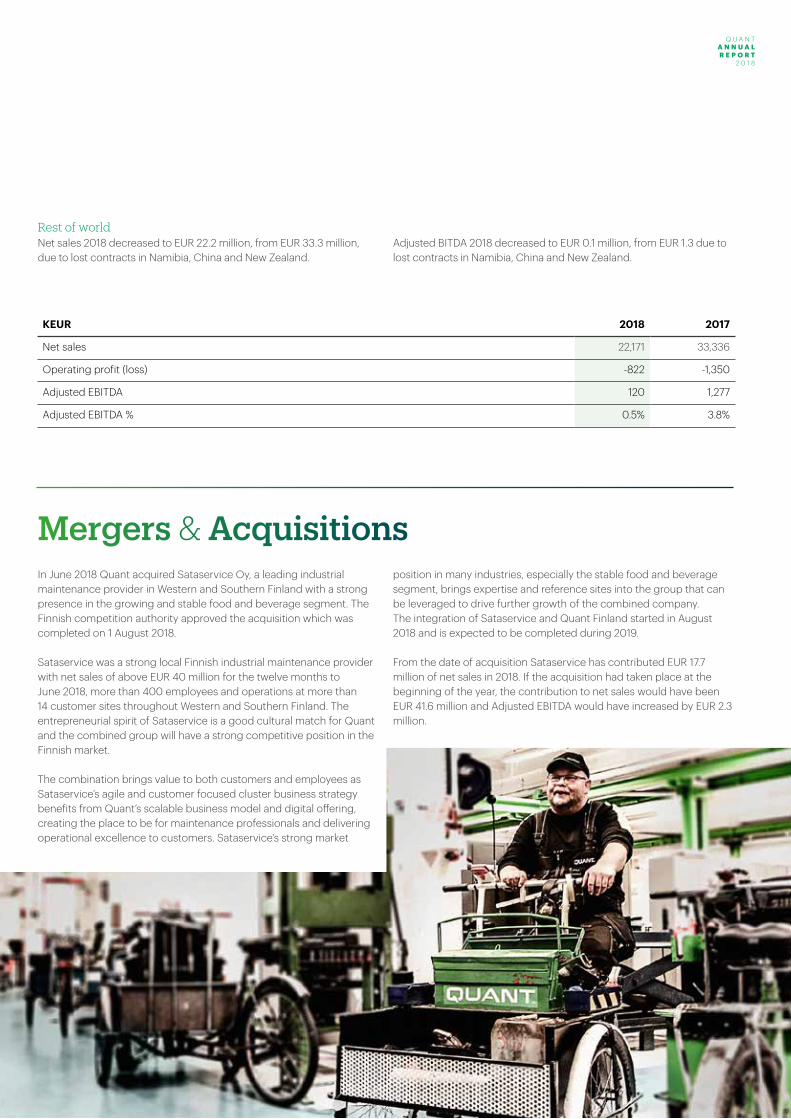
Net sales 2018 decreased to EUR 22.2 million, from EUR 33.3 million, due to lost contracts in Namibia, China and New Zealand.
Adjusted BITDA 2018 decreased to EUR 0.1 million, from EUR 1.3 due to lost contracts in Namibia, China and New Zealand.
Rest of world
Mergers & Acquisitions
KEUR 2018 2017
Net sales 22,171 33,336
Operating profit (loss) -822 -1,350
Adjusted EBITDA 120 1,277
Adjusted EBITDA % 0.5% 3.8%
In June 2018 Quant acquired Sataservice Oy, a leading industrial maintenance provider in Western and Southern Finland with a strong presence in the growing and stable food and beverage segment. The Finnish competition authority approved the acquisition which was completed on 1 August 2018.
Sataservice was a strong local Finnish industrial maintenance provider with net sales of above EUR 40 million for the twelve months to June 2018, more than 400 employees and operations at more than 14 customer sites throughout Western and Southern Finland. The entrepreneurial spirit of Sataservice is a good cultural match for Quant and the combined group will have a strong competitive position in the Finnish market.
The combination brings value to both customers and employees as Sataservice’s agile and customer focused cluster business strategy benefits from Quant’s scalable business model and digital offering, creating the place to be for maintenance professionals and delivering operational excellence to customers. Sataservice’s strong market
position in many industries, especially the stable food and beverage segment, brings expertise and reference sites into the group that can be leveraged to drive further growth of the combined company.The integration of Sataservice and Quant Finland started in August 2018 and is expected to be completed during 2019.
From the date of acquisition Sataservice has contributed EUR 17.7 million of net sales in 2018. If the acquisition had taken place at the beginning of the year, the contribution to net sales would have been EUR 41.6 million and Adjusted EBITDA would have increased by EUR 2.3 million.

Q U A N T A N N U A L R E P O R T 2 0 1 8
26

Q U A N T A N N U A L R E P O R T 2 0 1 8
Q U A N T A N N U A L R E P O R T
2 0 1 8
27
Q U A N T A N N U A L R E P O R T 2 0 1 8
28
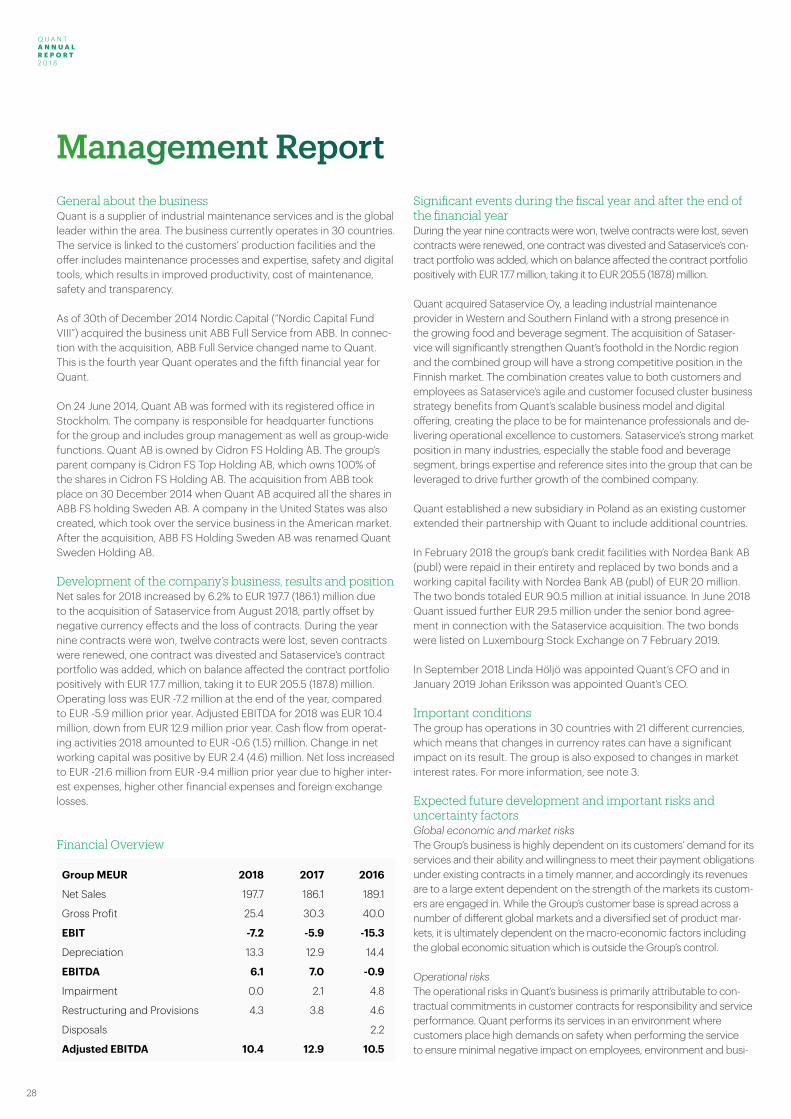
Management ReportGeneral about the businessQuant is a supplier of industrial maintenance services and is the global leader within the area. The business currently operates in 30 countries. The service is linked to the customers’ production facilities and the offer includes maintenance processes and expertise, safety and digital tools, which results in improved productivity, cost of maintenance, safety and transparency.
As of 30th of December 2014 Nordic Capital (“Nordic Capital Fund VIII”) acquired the business unit ABB Full Service from ABB. In connec-tion with the acquisition, ABB Full Service changed name to Quant. This is the fourth year Quant operates and the fifth financial year for Quant.
On 24 June 2014, Quant AB was formed with its registered office in Stockholm. The company is responsible for headquarter functions for the group and includes group management as well as group-wide functions. Quant AB is owned by Cidron FS Holding AB. The group’s parent company is Cidron FS Top Holding AB, which owns 100% of the shares in Cidron FS Holding AB. The acquisition from ABB took place on 30 December 2014 when Quant AB acquired all the shares in ABB FS holding Sweden AB. A company in the United States was also created, which took over the service business in the American market. After the acquisition, ABB FS Holding Sweden AB was renamed Quant Sweden Holding AB.
Development of the company’s business, results and positionNet sales for 2018 increased by 6.2% to EUR 197.7 (186.1) million due to the acquisition of Sataservice from August 2018, partly offset by negative currency effects and the loss of contracts. During the year nine contracts were won, twelve contracts were lost, seven contracts were renewed, one contract was divested and Sataservice’s contract portfolio was added, which on balance affected the contract portfolio positively with EUR 17.7 million, taking it to EUR 205.5 (187.8) million. Operating loss was EUR -7.2 million at the end of the year, compared to EUR -5.9 million prior year. Adjusted EBITDA for 2018 was EUR 10.4 million, down from EUR 12.9 million prior year. Cash flow from operat-ing activities 2018 amounted to EUR -0.6 (1.5) million. Change in net working capital was positive by EUR 2.4 (4.6) million. Net loss increased to EUR -21.6 million from EUR -9.4 million prior year due to higher inter-est expenses, higher other financial expenses and foreign exchange losses.
Financial Overview
Significant events during the fiscal year and after the end of the financial yearDuring the year nine contracts were won, twelve contracts were lost, seven contracts were renewed, one contract was divested and Sataservice’s con-tract portfolio was added, which on balance affected the contract portfolio positively with EUR 17.7 million, taking it to EUR 205.5 (187.8) million.
Quant acquired Sataservice Oy, a leading industrial maintenance provider in Western and Southern Finland with a strong presence in the growing food and beverage segment. The acquisition of Sataser-vice will significantly strengthen Quant’s foothold in the Nordic region and the combined group will have a strong competitive position in the Finnish market. The combination creates value to both customers and employees as Sataservice’s agile and customer focused cluster business strategy benefits from Quant’s scalable business model and digital offering, creating the place to be for maintenance professionals and de-livering operational excellence to customers. Sataservice’s strong market position in many industries, especially the stable food and beverage segment, brings expertise and reference sites into the group that can be leveraged to drive further growth of the combined company.
Quant established a new subsidiary in Poland as an existing customer extended their partnership with Quant to include additional countries.
In February 2018 the group’s bank credit facilities with Nordea Bank AB (publ) were repaid in their entirety and replaced by two bonds and a working capital facility with Nordea Bank AB (publ) of EUR 20 million. The two bonds totaled EUR 90.5 million at initial issuance. In June 2018 Quant issued further EUR 29.5 million under the senior bond agree-ment in connection with the Sataservice acquisition. The two bonds were listed on Luxembourg Stock Exchange on 7 February 2019.
In September 2018 Linda Höljö was appointed Quant’s CFO and in January 2019 Johan Eriksson was appointed Quant’s CEO.
Important conditionsThe group has operations in 30 countries with 21 different currencies, which means that changes in currency rates can have a significant impact on its result. The group is also exposed to changes in market interest rates. For more information, see note 3.
Expected future development and important risks and uncertainty factorsGlobal economic and market risks The Group’s business is highly dependent on its customers’ demand for its services and their ability and willingness to meet their payment obligations under existing contracts in a timely manner, and accordingly its revenues are to a large extent dependent on the strength of the markets its custom-ers are engaged in. While the Group’s customer base is spread across a number of different global markets and a diversified set of product mar-kets, it is ultimately dependent on the macro-economic factors including the global economic situation which is outside the Group’s control.
Operational risksThe operational risks in Quant’s business is primarily attributable to con-tractual commitments in customer contracts for responsibility and service performance. Quant performs its services in an environment where customers place high demands on safety when performing the service to ensure minimal negative impact on employees, environment and busi-
Group MEUR 2018 2017 2016
Net Sales 197.7 186.1 189.1
Gross Profit 25.4 30.3 40.0
EBIT -7.2 -5.9 -15.3
Depreciation 13.3 12.9 14.4
EBITDA 6.1 7.0 -0.9
Impairment 0.0 2.1 4.8
Restructuring and Provisions 4.3 3.8 4.6
Disposals 2.2
Adjusted EBITDA 10.4 12.9 10.5
Q U A N T A N N U A L R E P O R T 2 0 1 8
Q U A N T A N N U A L R E P O R T
2 0 1 8
29
ness process. Since Quant’s services are mainly performed by personnel, there is a risk that injuries and damages may occur due to negligence or other lack of performance of the service. Quant does its outmost to mini-mize the occurrence of these types of risk through, inter alia, risk analysis, training, certification, follow-up of performance of service, and through careful contract management with clear liability limits.
As a maintenance services business, the Group is highly dependent on retaining its customer portfolio as well as its ability to attract new cus-tomers on a regular basis in order to secure both short and long-term profitability. The Group currently faces competition from both global and local providers of maintenance services and is also facing the risk of its customers choosing to in-source the services provided. The loss of larger contracts or a loss of a number of less significant contracts would have a significant impact on the Group’s profitability. Any demobilization from a customer site is required to be managed in an organized manner that allows for exit costs to be minimized and, unless lost contracts are replaced by new contracts, that the group’s operations are adjusted to reduced earnings. To manage the risk of loss of contracts Quant is ensuring value-add for the customer by, for instance, maintaining moti-vated and well-trained personnel, a continuous development of services and processes and an active customer relationship dialogue.
Quant has a number of pricing models in its contracts, including fixed price contracts and cost-plus pricing models. While the Group has compiled an extensive qualitative and quantitative database of industry benchmarks over recent decades, resulting in a robust pricing process, if the total effective maintenance costs are above the agreed fixed price level, if cost increases occur despite price indexation in customer con-tracts, or if price pressures hinders Quant from applying a profit margin which it considers satisfactory in order to win a contract , it could have a negative impact on the Group’s operations and financial position.
A large portion of the Group’s risk of cost overruns, which significantly impact the profitability of contracts arise at the start-up and/or termi-nation stages of a contract, or in periods of site shut-down during the contract term. To manage this risk Quant has well defined processes and procedures for these key parts of the contracts life, as well as operational, financial and legal risk reviews of contracts before entering into new contract relationships.
The group operates in a relatively specialized business, and the potential departures of key persons and the ability to attract qualified personnel is crucial for the group’s success.
DigitalizationIn an increasingly digitalized world, one of the Group’s main focus areas in order to ensure long-term success and profitability is to stay ahead of technological advances and to offer cutting-edge technology as part of its services. While the Group currently offers advanced technological solutions to customers, the pace of advances in technology is increas-ing, and any failure by the Group to keep up with such advances may result in not being able to offer the most up to date technology, and/or to fall behind the products and services offered by its competitors.
Disputes and litigationsThe group regularly reviews significant outstanding claims and disputes to determine the need for provisions. Among the factors considered in such an assessment are the type of litigation or summons, the amount of any damages, the development of the case, perceptions of legal
and other advisers, experience from similar cases, and decisions of Group management regarding the Group’s actions concerning these claims or disputes. Estimates do not necessarily reflect the outcome of pending litigation, and differences between outcome and estimate may significantly affect the company’s financial position and have an unfavorable impact on operating income and liquidity.
Financial risksFinancial risks mainly consist of currency, interest rate and financing risks. The continued development of the global economy, including interest rate and currency risk, is an uncertainty factor for earnings performance. A more detailed description of Quant’s financial risks and how the group manage these risks is found in note 3.
Insurable risksUsage of insurance is governed by central guidelines. These include professional indemnity and product liability, property, disruption, transport, crime, CEO and board responsibilities and liability insurance for employment-related requirements. Most insurance policies are managed centrally by the group.
Own Shares There are no Quant shares that are owned by the company.
Use of financial instrumentsFinancial instruments derive from interest-bearing borrowing from bank and currency hedging of intercompany loans. As of 31 December 2018, currency swaps hedging intercompany loans were outstanding. The derivatives are included in the balance sheet under other liabilities and amount to 1 (1) thousand EUR.
Permit or notification required under the Environmental CodeThe Group does not operate a business that requires any permit or notification.
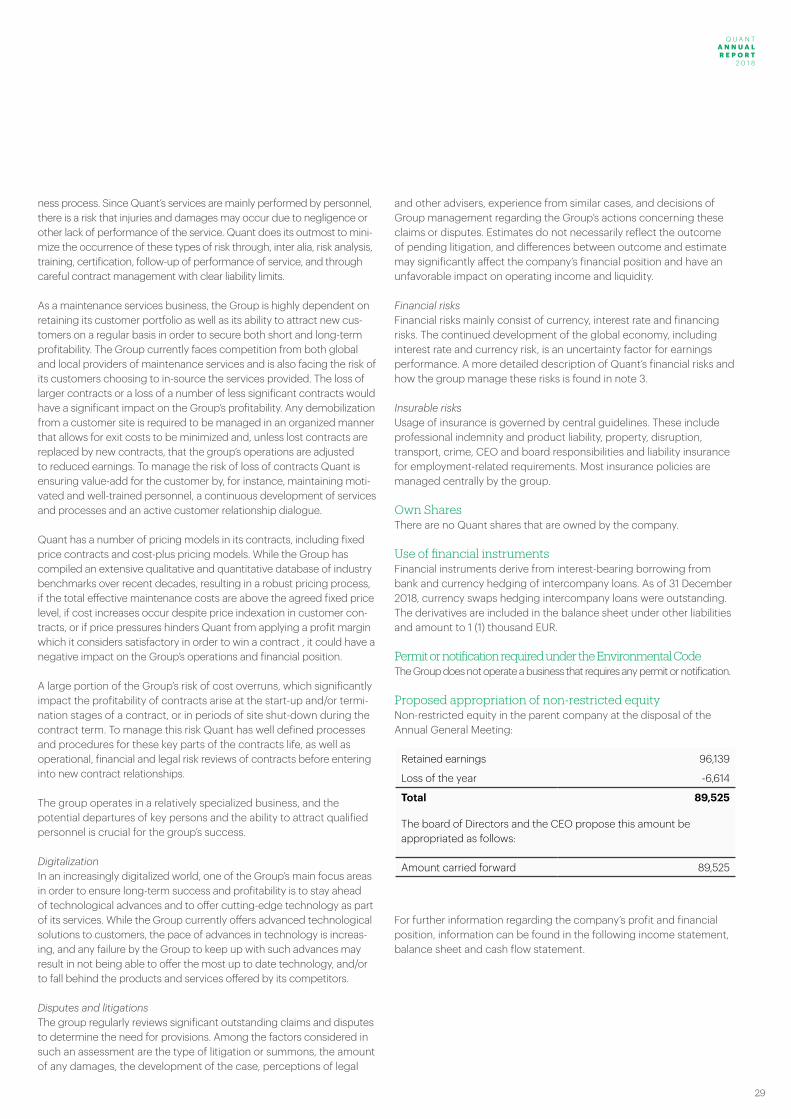
Proposed appropriation of non-restricted equityNon-restricted equity in the parent company at the disposal of the Annual General Meeting:
For further information regarding the company’s profit and financial position, information can be found in the following income statement, balance sheet and cash flow statement.
Retained earnings 96,139
Loss of the year -6,614
Total 89,525
The board of Directors and the CEO propose this amount be appropriated as follows:
Amount carried forward 89,525
Q U A N T A N N U A L R E P O R T 2 0 1 8
30
Management Team
Linda HöljöCFO
Nationality: SwedishLocation: SwedenQualifications/Education: Broad experience from senior roles in Finance and Operations, most recently as Head of Business Finance with Ericsson. Prior to that, 14 years in various roles in investment management and private equity.
MSc, Economics and Business Administration, DEA Subatomic Physics, MSc Engineering Physics.
Therese HolmqvistLegal Counsel
Nationality: SwedishLocation: SwedenQualifications/Education: More than 15 years of experience of commercial law. Most recently from a Swedish leading law firm, Mannheimer Swartling.
Jur.kand and LL.M (Master of Laws).
Johan HarstaCOO
Nationality: Swedish, CanadianLocation: Czech Republic Qualifications/Education: Broad international experience in process industry and main-tenance management from 35 years with Quant, ABB, ASEA.
MSc, Engineering Physics, from Uppsala University in 1984.
Jacob DuhanSVP Strategy & Business DevelopmentSVP Southern Europe
Nationality: Swedish Location: SwedenQualifications/Education: Long experience from inter-national strategy consultancy. Long experience from inter-national strategy consultancy with Roland Berger and Applied Value.
Double MSc in Industrial Engineering and Manage-ment, BA in German, Armed Forces Language Academy.
Nicklas FalkSVP Commercial Development
Nationality: SwedishLocation: SwedenQualifications/Education: 15 years of experience from various management positions in major Industrial Service Companies in Scandinavia.
Bachelor Degree in Mechanical Engineering.
Johan ErikssonCEO
Nationality: SwedishLocation: SwedenQualifications/ Education: COO of Securitas Cash Hand-ling, President & CEO of Poolia AB (publ), President & CEO of Transcom Worldwide AB (publ), various Board Director assignments.
Bachelor of Science in Business Administration and Economics.
Q U A N T A N N U A L R E P O R T 2 0 1 8
Q U A N T A N N U A L R E P O R T
2 0 1 8
31
Olof HedinCDO
Nationality: SwedishLocation: SwedenQualifications/Education: Started at ABB with DCS and MES systems for process industry then moved on to the IT industry working at SAP, KnowIT and Acando. Since 2012 worked as CIO and CDO.
MBA, MSc.
Steve StreblowSVP North America
Nationality: USALocation: USAQualifications/Education: Over thirty years of sales, operations, and management experience in heavy metals, pulp and paper, chemical and manufacturing industries.
Bachelor of Science Degree in Civil Engineering, Masters of Business Administration.
Maximiliano AquevequeSVP South America
Nationality: Chilean Location: ChileQualifications/Education: Metallurgical Engineer, has more than 18 years of experience in mining and minerals industry, including overseas assignments in different industries.
MBA.
Pekka VenäläinenSVP North and Central Europe
Nationality: FinnishLocation: SwedenQualifications/Education: Broad experience in industrial customer relations, business development and maintenance management. 27 years in ABB.
Bachelor Degree in Industrial Automation. Business Adminis-tration, General Management.
Basie MaponyaSVP Sub-Saharan Africa
Nationality: South AfricanLocation: South AfricaQualifications/Education: 20 years of industrial expe-rience in various roles. Well experienced customer rela-tions, business development, maintenance and engineering management. Most recently from Siemens.
Mechanical Certified Engineer.
Thomas LutherManaging Director Finland & Baltics
Nationality: FinnishLocation: FinlandQualifications/Education:Broad experience in global service business, industrial and sales leadership at Nokia, Metso and Sataservice Group.
MSc Econ & Bus Adm. Entre-preneurship & Management, Financing, BSc Engineering, Production Economics & Management.
Q U A N T A N N U A L R E P O R T 2 0 1 8
32
Jörgen BergqvistSweden
Has been, as employee representative, a director of the board of the Company since 2015.
Board of Directors
Mikael NorinUSA
Has been a director of the board of the Company since 2015 and is also the chairman of the board. He is currently the chief executive officer of Cavotec SA.
BSc in Business Administra-tion and Economics, Lund University.
Vartan VartanianSweden
Has been a director of the board of the Company since 2015. He currently serves as director of the board of Minalyze AB and Rubix Group.
Mechanical Engineer graduate from University of Toronto; extended studies at Stanford, London Business School.
Joachim ZetterlundSweden
Has been a director of the board of the Company since 2015. He currently serves as chairman of the board of One Agency AB and Förlags-system AB, and as a director of the board of Munters Topholding AB, Xpeedio AB and MHI Investments AB.
Olof Faxander Sweden
Has been a director of the Company since 2017.He currently serves as Boardmember Britax Ltd, vice chairman Acino AG and Boardmember Resman AS.
MSc in Engineering, Swedish Royal Institute of Technology, B A Economics, Stockholm University.
Casper LercheGermany
Has been a director of the Company since 2015.
MSc in Finance and Accounting, Copenhagen Business School
Per Hallius Sweden
Has been a director of the board of the Company since 2015. He currently serves as chairman of Nefab Group AB, vice chairman of Ruukki Construction Oy and director of the board of Munters Group AB and Kemetyl Holding AB.
MBA, Harvard Business School, MSc in Economics and Business Administra-tion, Stockholm School of Economics.
Johan Lundén Sweden
Has been a director of the board of the Company since 2018. He currently serves as director of the board of Greenfood AB and Acino International AG.
MSc in Economics and Business Administration, Stockholm School of Economics.
Q U A N T A N N U A L R E P O R T 2 0 1 8
Q U A N T A N N U A L R E P O R T
2 0 1 8
33
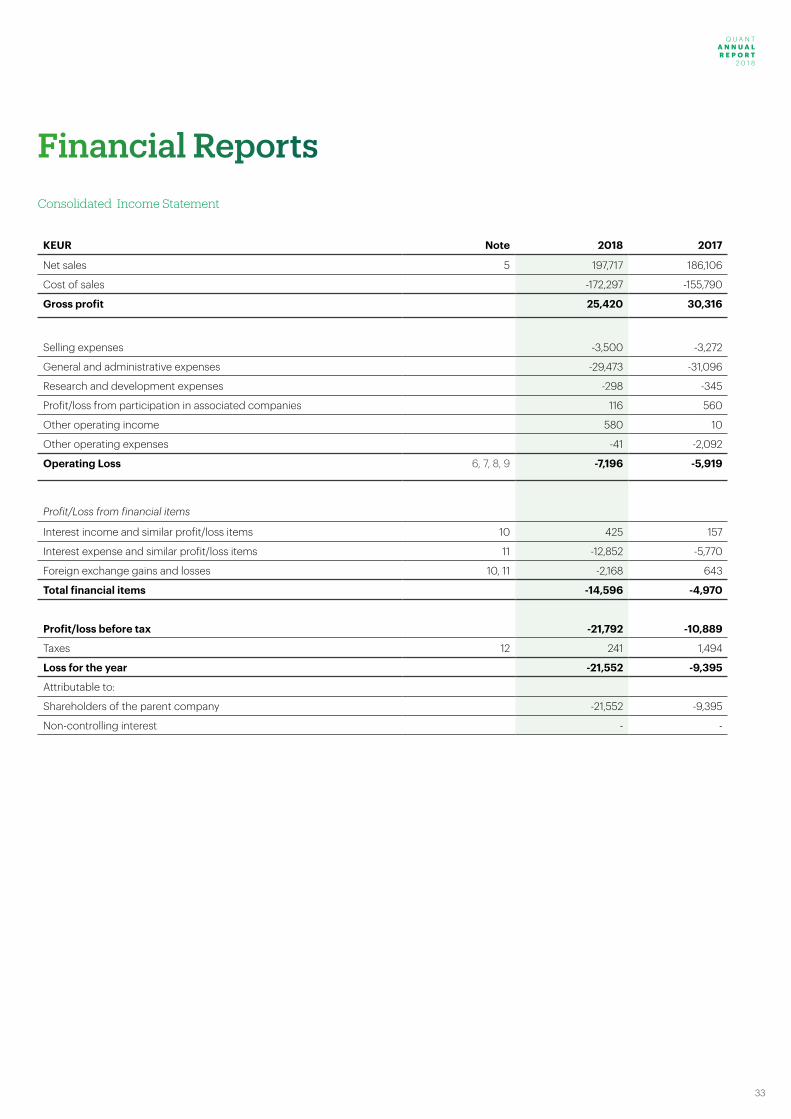
KEUR Note 2018 2017
Net sales 5 197,717 186,106
Cost of sales -172,297 -155,790
Gross profit 25,420 30,316
Selling expenses -3,500 -3,272
General and administrative expenses -29,473 -31,096
Research and development expenses -298 -345
Profit/loss from participation in associated companies 116 560
Other operating income 580 10
Other operating expenses -41 -2,092
Operating Loss 6, 7, 8, 9 -7,196 -5,919
Profit/Loss from financial items
Interest income and similar profit/loss items 10 425 157
Interest expense and similar profit/loss items 11 -12,852 -5,770
Foreign exchange gains and losses 10, 11 -2,168 643
Total financial items -14,596 -4,970
Profit/loss before tax -21,792 -10,889
Taxes 12 241 1,494
Loss for the year -21,552 -9,395
Attributable to:
Shareholders of the parent company -21,552 -9,395
Non-controlling interest - -
Consolidated Income Statement
Financial Reports
Q U A N T A N N U A L R E P O R T 2 0 1 8
34
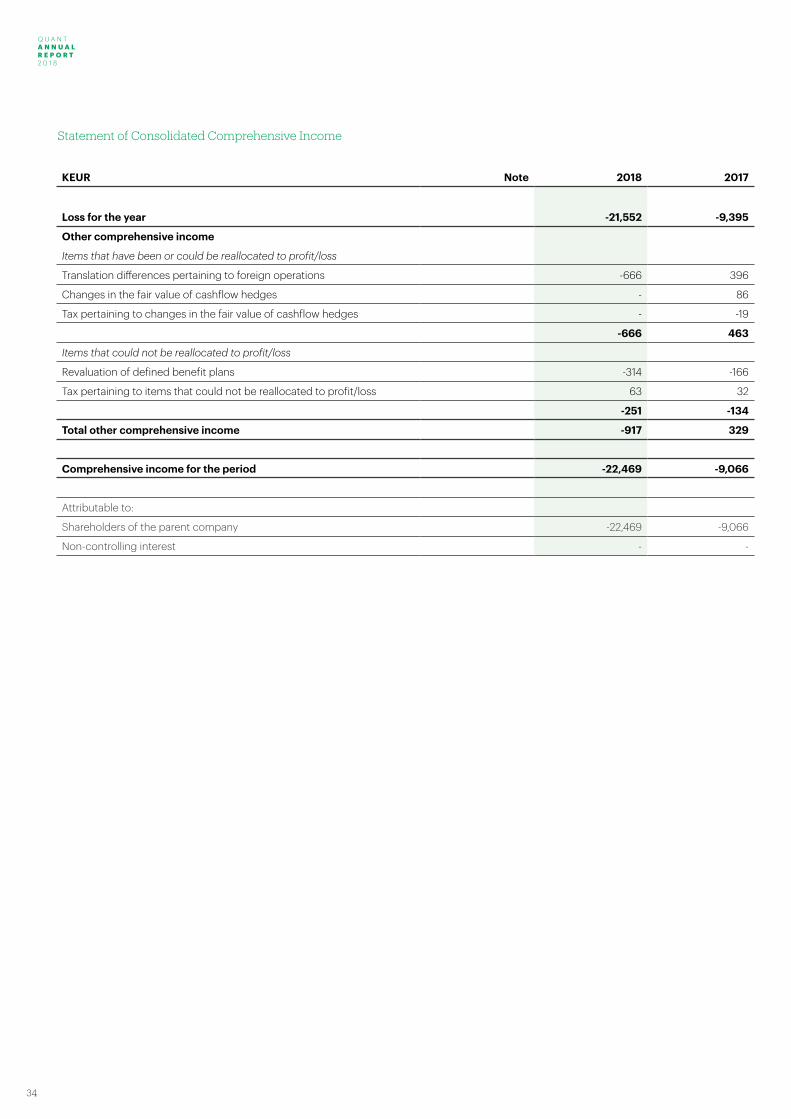
Statement of Consolidated Comprehensive Income
KEUR Note 2018 2017
Loss for the year -21,552 -9,395
Other comprehensive income
Items that have been or could be reallocated to profit/loss
Translation differences pertaining to foreign operations -666 396
Changes in the fair value of cashflow hedges - 86
Tax pertaining to changes in the fair value of cashflow hedges - -19
-666 463
Items that could not be reallocated to profit/loss
Revaluation of defined benefit plans -314 -166
Tax pertaining to items that could not be reallocated to profit/loss 63 32
-251 -134
Total other comprehensive income -917 329
Comprehensive income for the period -22,469 -9,066
Attributable to:
Shareholders of the parent company -22,469 -9,066
Non-controlling interest - -
Q U A N T A N N U A L R E P O R T 2 0 1 8
Q U A N T A N N U A L R E P O R T
2 0 1 8
35
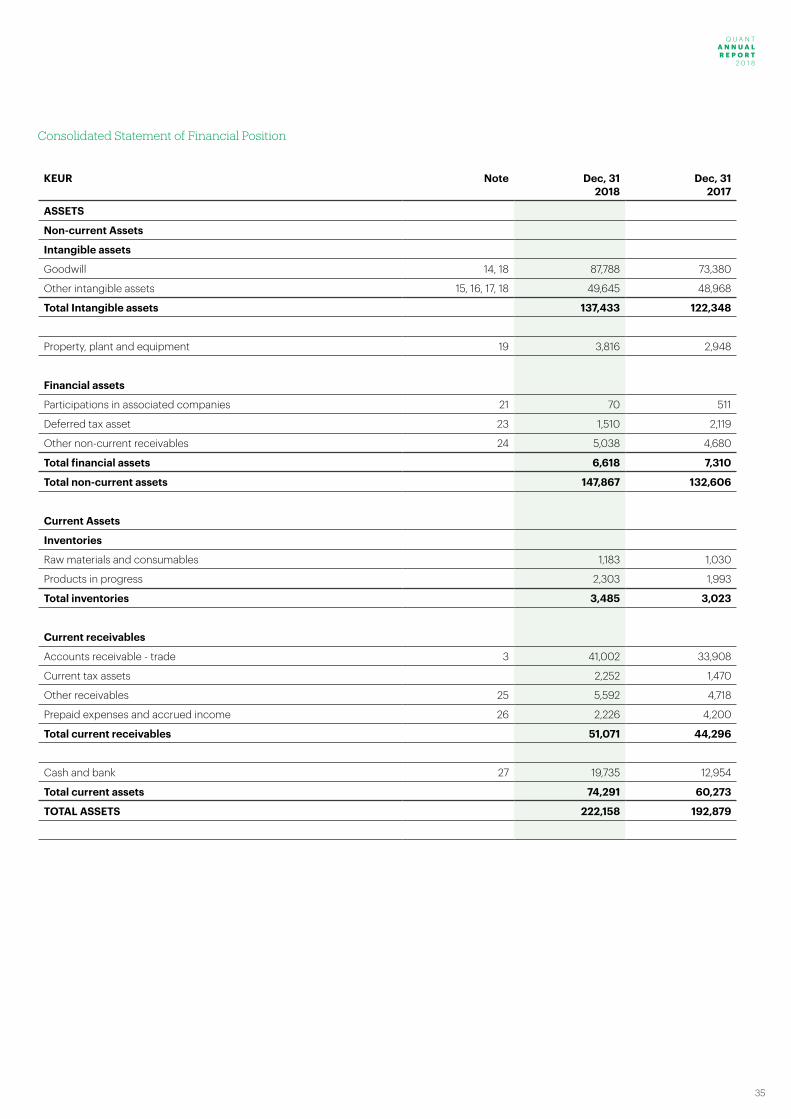
Consolidated Statement of Financial Position
KEUR Note Dec, 312018
Dec, 312017
ASSETS
Non-current Assets
Intangible assets
Goodwill 14, 18 87,788 73,380
Other intangible assets 15, 16, 17, 18 49,645 48,968
Total Intangible assets 137,433 122,348
Property, plant and equipment 19 3,816 2,948
Financial assets
Participations in associated companies 21 70 511
Deferred tax asset 23 1,510 2,119
Other non-current receivables 24 5,038 4,680
Total financial assets 6,618 7,310
Total non-current assets 147,867 132,606
Current Assets
Inventories
Raw materials and consumables 1,183 1,030
Products in progress 2,303 1,993
Total inventories 3,485 3,023
Current receivables
Accounts receivable - trade 3 41,002 33,908
Current tax assets 2,252 1,470
Other receivables 25 5,592 4,718
Prepaid expenses and accrued income 26 2,226 4,200
Total current receivables 51,071 44,296
Cash and bank 27 19,735 12,954
Total current assets 74,291 60,273
TOTAL ASSETS 222,158 192,879
Q U A N T A N N U A L R E P O R T 2 0 1 8
36
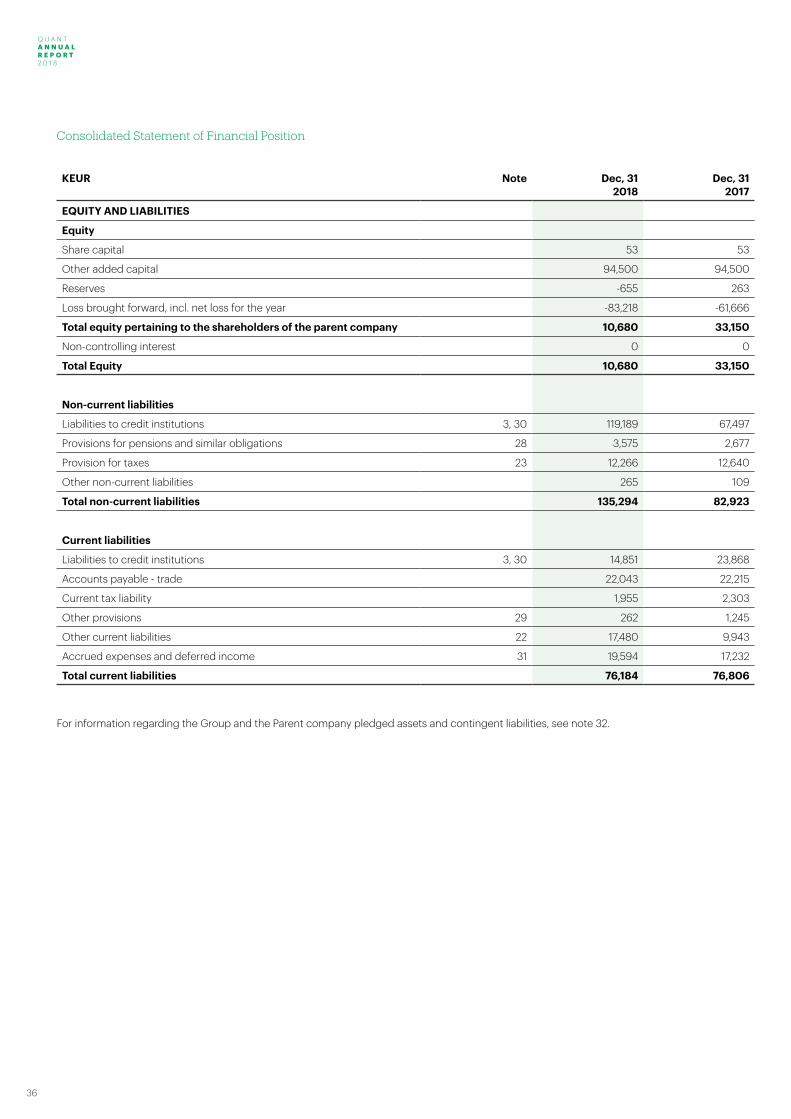
Consolidated Statement of Financial Position
KEUR Note Dec, 312018
Dec, 312017
EQUITY AND LIABILITIES
Equity
Share capital 53 53
Other added capital 94,500 94,500
Reserves -655 263
Loss brought forward, incl. net loss for the year -83,218 -61,666
Total equity pertaining to the shareholders of the parent company 10,680 33,150
Non-controlling interest 0 0
Total Equity 10,680 33,150
Non-current liabilities
Liabilities to credit institutions 3, 30 119,189 67,497
Provisions for pensions and similar obligations 28 3,575 2,677
Provision for taxes 23 12,266 12,640
Other non-current liabilities 265 109
Total non-current liabilities 135,294 82,923
Current liabilities
Liabilities to credit institutions 3, 30 14,851 23,868
Accounts payable - trade 22,043 22,215
Current tax liability 1,955 2,303
Other provisions 29 262 1,245
Other current liabilities 22 17,480 9,943
Accrued expenses and deferred income 31 19,594 17,232
Total current liabilities 76,184 76,806
For information regarding the Group and the Parent company pledged assets and contingent liabilities, see note 32.
Q U A N T A N N U A L R E P O R T 2 0 1 8
Q U A N T A N N U A L R E P O R T
2 0 1 8
37
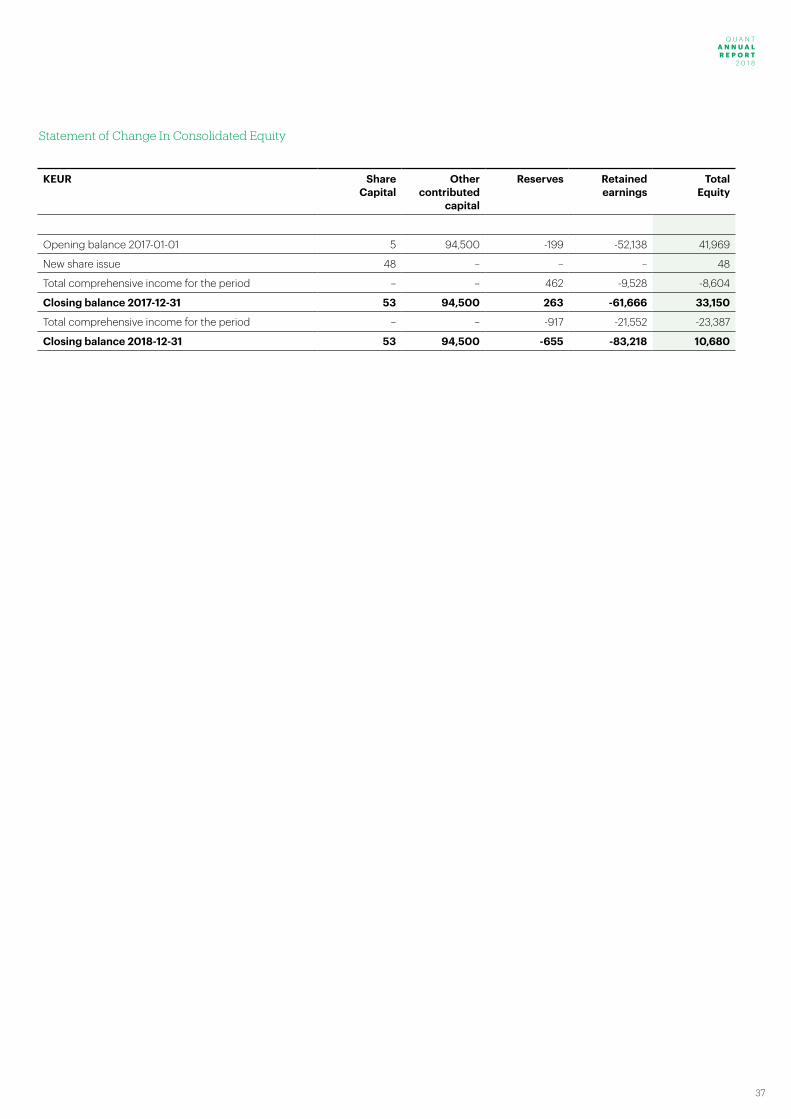
KEUR Share Capital
Other contributed
capital
Reserves Retained earnings
Total Equity
Opening balance 2017-01-01 5 94,500 -199 -52,138 41,969
New share issue 48 – – – 48
Total comprehensive income for the period – – 462 -9,528 -8,604
Closing balance 2017-12-31 53 94,500 263 -61,666 33,150
Total comprehensive income for the period – – -917 -21,552 -23,387
Closing balance 2018-12-31 53 94,500 -655 -83,218 10,680
Statement of Change In Consolidated Equity
Q U A N T A N N U A L R E P O R T 2 0 1 8
38
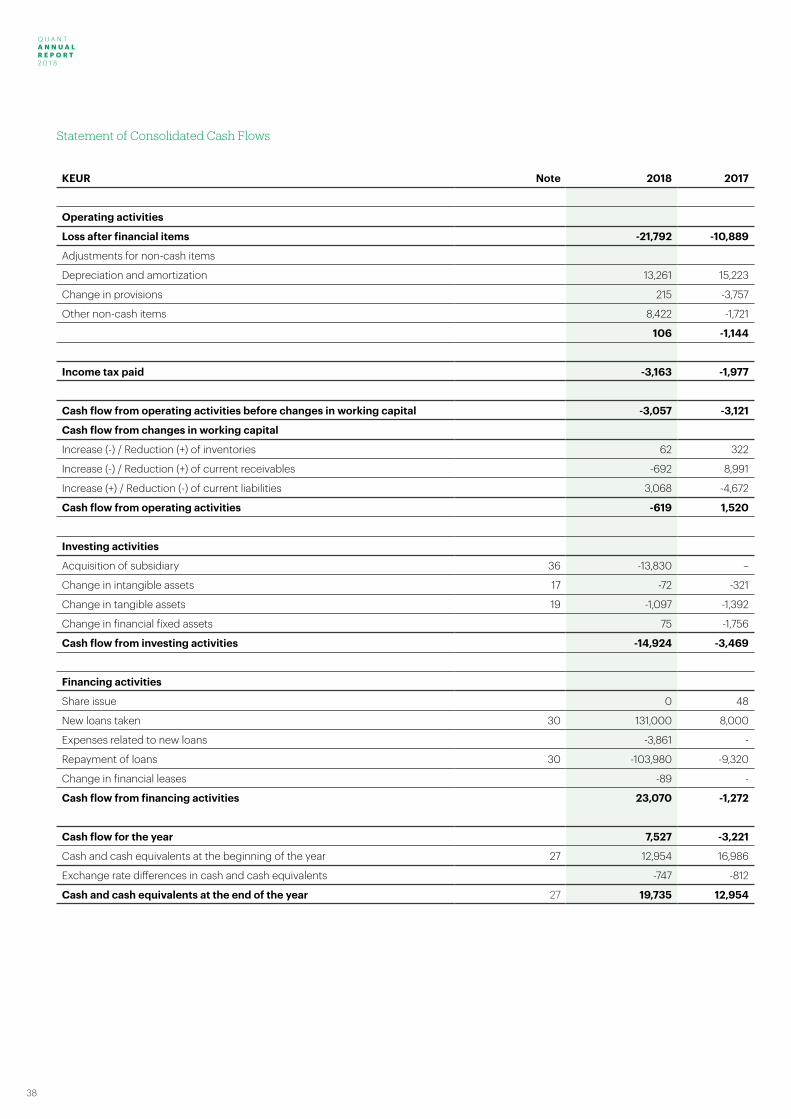
Statement of Consolidated Cash Flows
KEUR Note 2018 2017
Operating activities
Loss after financial items -21,792 -10,889
Adjustments for non-cash items
Depreciation and amortization 13,261 15,223
Change in provisions 215 -3,757
Other non-cash items 8,422 -1,721
106 -1,144
Income tax paid -3,163 -1,977
Cash flow from operating activities before changes in working capital -3,057 -3,121
Cash flow from changes in working capital
Increase (-) / Reduction (+) of inventories 62 322
Increase (-) / Reduction (+) of current receivables -692 8,991
Increase (+) / Reduction (-) of current liabilities 3,068 -4,672
Cash flow from operating activities -619 1,520
Investing activities
Acquisition of subsidiary 36 -13,830 –
Change in intangible assets 17 -72 -321
Change in tangible assets 19 -1,097 -1,392
Change in financial fixed assets 75 -1,756
Cash flow from investing activities -14,924 -3,469
Financing activities
Share issue 0 48
New loans taken 30 131,000 8,000
Expenses related to new loans -3,861 -
Repayment of loans 30 -103,980 -9,320
Change in financial leases -89 -
Cash flow from financing activities 23,070 -1,272
Cash flow for the year 7,527 -3,221
Cash and cash equivalents at the beginning of the year 27 12,954 16,986
Exchange rate differences in cash and cash equivalents -747 -812
Cash and cash equivalents at the end of the year 27 19,735 12,954
Q U A N T A N N U A L R E P O R T 2 0 1 8
Q U A N T A N N U A L R E P O R T
2 0 1 8
39
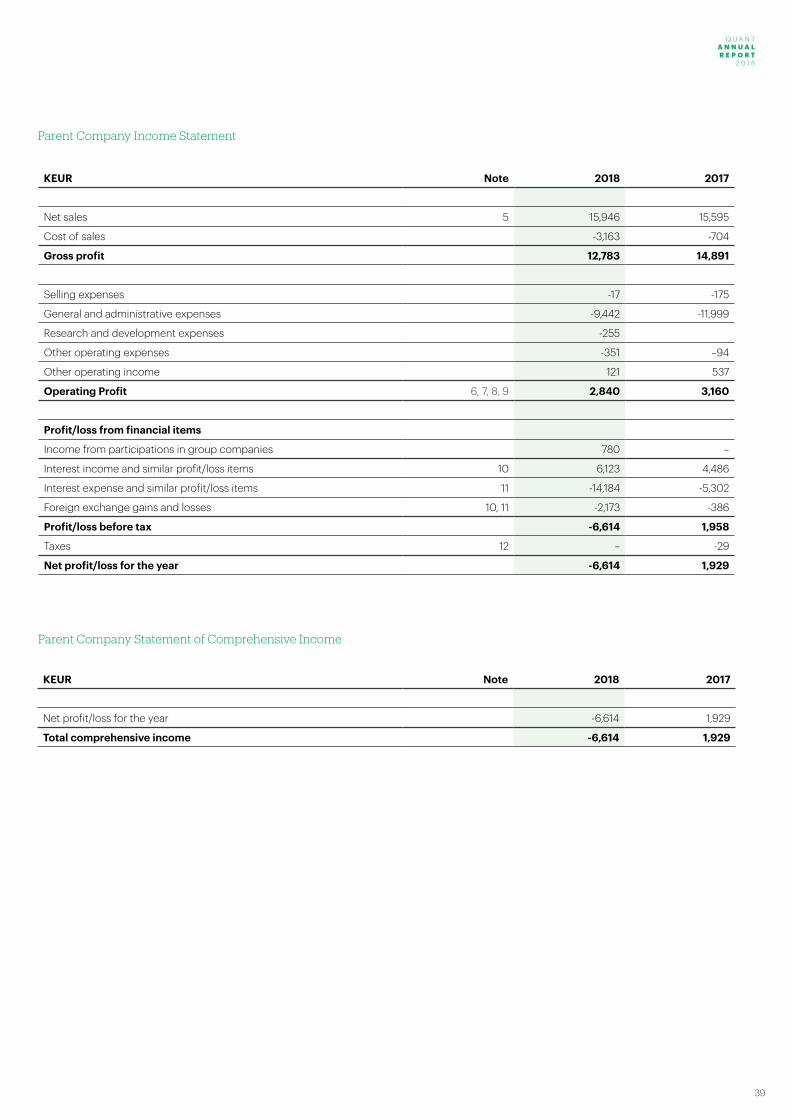
Parent Company Income Statement
KEUR Note 2018 2017
Net sales 5 15,946 15,595
Cost of sales -3,163 -704
Gross profit 12,783 14,891
Selling expenses -17 -175
General and administrative expenses -9,442 -11,999
Research and development expenses -255
Other operating expenses -351 –94
Other operating income 121 537
Operating Profit 6, 7, 8, 9 2,840 3,160
Profit/loss from financial items
Income from participations in group companies 780 –
Interest income and similar profit/loss items 10 6,123 4,486
Interest expense and similar profit/loss items 11 -14,184 -5,302
Foreign exchange gains and losses 10, 11 -2,173 -386
Profit/loss before tax -6,614 1,958
Taxes 12 – -29
Net profit/loss for the year -6,614 1,929
Parent Company Statement of Comprehensive Income
KEUR Note 2018 2017
Net profit/loss for the year -6,614 1,929
Total comprehensive income -6,614 1,929

Q U A N T A N N U A L R E P O R T 2 0 1 8
40
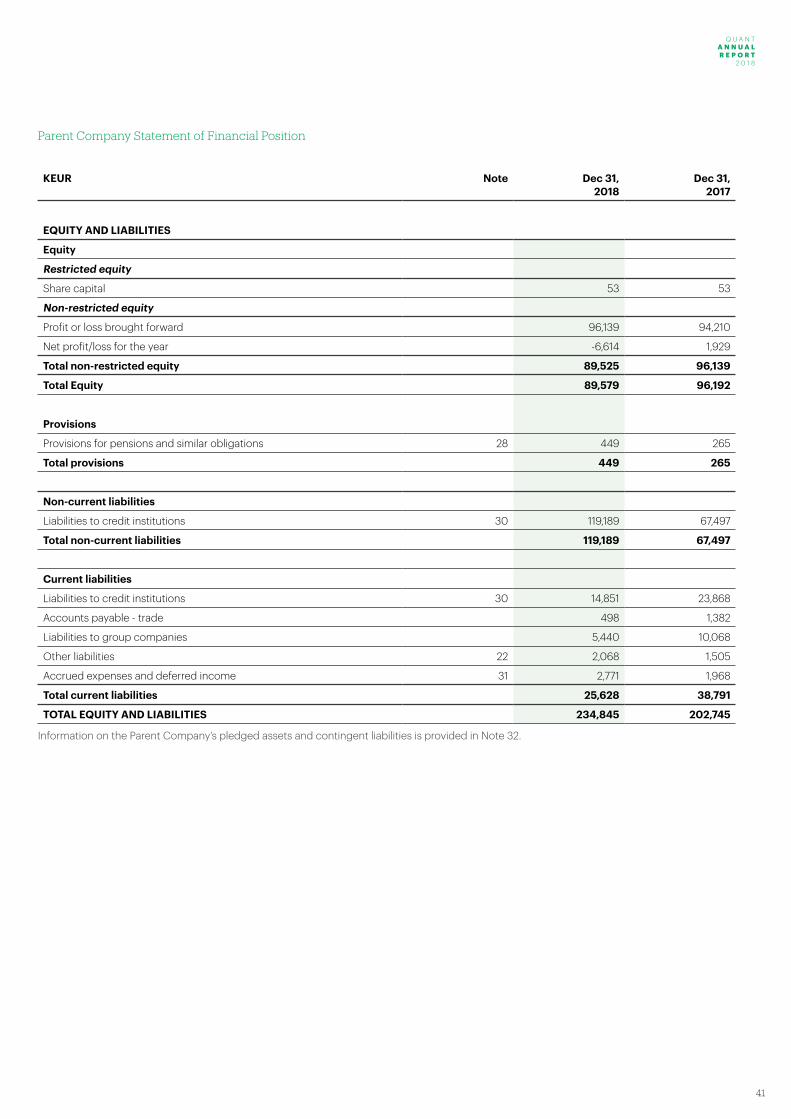
Parent Company Statement of Financial Position
KEUR Note Dec 31,2018
Dec 31, 2017
ASSETS
Non-current assets
Intangible assets
Other intangible assets 17 161 2,638
161 2,638
Property, plant and equipment
Equipment, fixtures and fittings 19 37 54
37 54
Financial assets
Participation in group companies 20 99,331 99,331
Receivables from group companies 6,217 6,217
Other non-current receivables 24 364 213
Total financial assets 105,911 105,761
Total non-current assets 106,110 108,453
Current assets
Current receivables
Receivables from group companies 126,706 93,195
Other receivables 25 327 119
Prepaid expenses and accrued income 26 945 283
Total current receivables 127,977 93,597
Cash and bank balances 27 758 695
Total current assets 128,735 94,292
TOTAL ASSETS 234,845 202,745
Q U A N T A N N U A L R E P O R T 2 0 1 8
Q U A N T A N N U A L R E P O R T
2 0 1 8
41
Parent Company Statement of Financial Position
KEUR Note Dec 31, 2018
Dec 31, 2017
EQUITY AND LIABILITIES
Equity
Restricted equity
Share capital 53 53
Non-restricted equity
Profit or loss brought forward 96,139 94,210
Net profit/loss for the year -6,614 1,929
Total non-restricted equity 89,525 96,139
Total Equity 89,579 96,192
Provisions
Provisions for pensions and similar obligations 28 449 265
Total provisions 449 265
Non-current liabilities
Liabilities to credit institutions 30 119,189 67,497
Total non-current liabilities 119,189 67,497
Current liabilities
Liabilities to credit institutions 30 14,851 23,868
Accounts payable - trade 498 1,382
Liabilities to group companies 5,440 10,068
Other liabilities 22 2,068 1,505
Accrued expenses and deferred income 31 2,771 1,968
Total current liabilities 25,628 38,791
TOTAL EQUITY AND LIABILITIES 234,845 202,745
Information on the Parent Company’s pledged assets and contingent liabilities is provided in Note 32.

Q U A N T A N N U A L R E P O R T 2 0 1 8
42
Restricted equity Non-restricted equityKEUR Share Capital Retained earnings Total Equity
Opening balance 2017-01-01 5 94,210 94,215
Share issue 48 48
Total comprehensive income 1,929 1,929
Closing balance 2017 53 96,139 96,192
Total comprehensive income – -6,614 -6,614
Closing balance 2018 53 89,525 89,579
Parent Company Statement of Changes in Equity
Parent Company Statement of Cash Flows
KEUR Note 2018 2017
Operating activities
Profit/loss after financial items -6,614 1,958
Adjustments for non-cash items
Depreciation 2,500 2,498
Other non-cash items 7,620 -2,988
Income tax paid -144 -128
Cash flow from operating activities before changes in working capital
3,363 1,340
Cash flow from working capital changes
Increase (-) / Reduction (+) of current receivables 6,272 11,144
Increase (+) / Reduction (-) of current liabilities -4,045 -11,772
Cash flow from operating activities 5,590 712
Investing activities
Acquisition of intangible assets 17 -7 -16
Change in financial fixed assets -150 –
Cash flow from investing activities -157 -16
Financing activities
Rights issue 48
New loans taken, external 30 131,000 8,000
Expenses related to new loans -3,861
Repayment of loans, external 30 -89,563
Change in loans to group companies -42,722 -9,320
Cash flow from financing activities -5,146 -1,272
Cash flow for the year 27 287 -576
Cash and cash equivalents at the beginning of the year 695 1,271
Exchange gains/losses in foreign currency -225 –
Cash and cash equivalents at the end of the year 27 758 695
Q U A N T A N N U A L R E P O R T 2 0 1 8
Q U A N T A N N U A L R E P O R T
2 0 1 8
43
The parent company, Quant AB (publ), Swedish corporate ID no.556975-5654 is a limited liability company registered in Sweden, having its registered office at the address: St Göransgatan 66, 112 33 Stockholm. Since Feb 7, 2019 Quant AB (publ) has its bonds registered on the EU regulated market of the Luxembourg Stock Exchange.
Quant AB is a wholly-owned subsidiary of Cidron FS Holding AB, org no 556968-8905 with its registered office in Stockholm. Cidron FS Holding AB is part of a group of companies in which Cidron FS Top Holding AB, org no 556985-2287, based in Stockholm, reports consoli-dated financial statements for the largest group.
The consolidated financial statements have been prepared in accordance with EU-approved International Financial Reporting Standards (IFRS) issued by the International Accounting Standards Board (IASB). In addition, the Group applies the Swedish Financial Reporting Board’s recommendation RFR 1 supplementary accounting regulations for corporate conglomerates, which specifies the supplements to IFRS required pursuant to the stipula-tions of the Swedish Annual Accounts Act.
The parent company applies the same accounting principles as the group except in the cases listed below under the section ”Parent Company Accounting Principles”.
The Annual Report was approved for issue by the Board of Directors and the CEO on 29 April 2019. The Balance Sheets and Income State-ments will be subject to approval by the Annual General Meeting on April 29, 2019.
Basics for appraisal applied when establishing the financial statementsAssets, provisions and liabilities have been valued at acquisition values unless otherwise stated below.
Functional currency and reporting currencyThe functional currency of the parent company is the Euro (EUR), which is also the reporting currency for the parent company and the Group. This means that the financial statements are presented in Euro. Unless otherwise stated, all amounts are rounded to the nearest thousand (EUR thousand). Amounts in parentheses refer to the previous year. Income statement items refer to the period January 1 – December 31, while balance sheet items refer to December 31.
Assessments and estimates in the financial statementsTo prepare the financial statements in accordance with IFRS requi-res management to make assessments and estimates and to make assumptions that affect the application of accounting principles and the reported amounts of assets, liabilities, income and expenses. The actual outcome may deviate from these estimates and assessments.The estimates and assumptions are reviewed regularly. Changes to estimates are reported in the period in which the change is made if the change only affected this period, or in the period the change is made and future periods if the change affects both the current period and future periods.
Disclosures of such IFRS standards or interpretations that have entered into force in 2018
IFRS 9 – Financial instruments IFRS 9 – Financial instruments went into effect on January 1 2018, replacing IAS 39 Financial instruments: Recognition and Measure-ment. IFRS 9 classifies financial assets in three different categories. Classification is determined at initial recognition based on asset characteristics and the company’s business model. The second part concerns hedge accounting. New policies regarding impairment of financial assets using a model based on financial assets has been introduced. One of the purposes of the new impairment model is to require that reserves for credit losses be made at an earlier stage. The new standard has not had any material effect on the Group’s financial reports with the exception of broader disclosure requirements.
IFRS 15 Revenue from Contracts with CustomersIFRS 15 went into effect on January 1 2018 and is the new standard for revenue recognition replacing IAS 18 Revenues and IAS 11 Construc-tion Contracts. The new standard is based on the principle that revenue be recognised when the customer takes control of the sold item or service, as opposed to the previous principle where revenue was recognised when the risks and benefits of ownership had passed to the customer. The standard has not had a material impact on the financial statements with the exception of the broader disclosure requirements. There were no adjustments made to the opening balan-ces as a result of IFRS 15.
Disclosure of such IFRS standards or interpretations that have not yet entered into force
IFRS 16 Leases New standard regarding accounting of leasing. For lessees, the classification in IAS 17 of operating and financial leasing is removed and is replaced by a model in which assets and liabilities for all leasing contracts are to be recognized in the balance sheet. Exemptions for accounting in the balance sheet are available for smaller leasing contracts and contracts with a maturity of 12 months or less. In the income statement, depreciation is reported separately from interest expenses attributable to the leasing liability. The Group applies IFRS 16 1 January 2019.
Based on information available, the Group estimates that it will recog-nize additional lease liabilities of approximately EUR 11 million. Right of use assets net of prepaid leasing charges also amount to approxima-tely EUR 11 million. The precise calculations will be implemented and presented in the January – March 2019 interim report. The information provided in note 8 on operational leasing agreements gives an indica-tion of the type and scope of existing agreements.
The Group will apply the modified retrospective approach which means that the accumulated effect of IFRS 16 will be recognized in the opening balance at January 1, 2019 without restating comparative figures. The Group does not expect the introduction of the new standard to affect its ability to meet the requirements of existing covenants for the Group.
No other changes to accounting standards with future application are considered to have any material effect on the consolidated accounts.
NotesNote 1. Accounting principles
Q U A N T A N N U A L R E P O R T 2 0 1 8
44
ClassificationThe classification of fixed assets and non-current liabilities consists substantially of amounts that are expected to be recovered or paid more than 12 months from the balance sheet date. Current assets and current liabilities consist substantially of amounts that are expected to be recovered or paid within 12 months of the balance sheet date.
Consolidation principles and business combinationsSubsidiariesSubsidiaries are companies that are under a controlling influence from Quant AB. Controlling influence exists if Quant AB has power over the investee company, is exposed to, or has the right to, variable returns from its engagement with the company and can use its influence over the investment to influence the return. When assessing whether a controlling influence exists, potential voting shares are taken into account and if de facto control exists.
Subsidiaries are reported according to the acquisition method. The method implies that the acquisition of a subsidiary is regarded as a transaction whereby the group indirectly acquires the subsidiary’s as-sets and assumes its liabilities. In the acquisition analysis, the fair value of the acquisition date is determined by the identifiable assets and liabilities assumed, as well as any non-controlling interest. Transaction expenditure, with the exception of transaction expenditure relating to the issue of equity instruments or debt instruments, that arises is reported directly in profit or loss for the year. In the case of business combinations where transferred remuneration, possible non-con-trolling interest and value of previously owned share (in the case of incremental acquisitions) exceed the fair value of acquired assets and assumed liabilities that is recognized separately, the difference is recognized as goodwill. When the difference is negative, so-called acquisition at low price, this is reported directly in profit or loss for the year.
Contingent consideration is reported at fair value at the time of acqui-sition. Where the contingent consideration is classified as an equity instrument, no revaluation and regulation is made within equity. For other contingent considerations, these are revalued at each reporting date and the change is reported in profit or loss for the year.In cases where the acquisition does not relate to 100% of the subsi-diary, non-controlling interest is acquired. There are two options for reporting non-controlling interests. These two options are to report non-controlling interest in net proportional assets or that non-con-trolling interests are recognized at fair value, which means that non-controlling interests have share in goodwill. The choice between the different options to report non-controlling interests can be made depending on the acquisition.
AssociatesAssociates are companies over which the group has a significant, but not a controlling, influence over the operational and financial mana-gement, usually through shareholdings between 20% and 50% of the voting rights. From the moment the significant influence is received, participations in associated companies are reported in accordance with the equity method in the consolidated financial statements. The equity method implies that the value of the shares in associated companies reported in the group corresponds to the group’s share in the associated companies’ equity as well as group goodwill and any remaining values is reported in group surplus and deficit values.
The group’s share of associated companies’ profit/loss adjusted for possible depreciation, impairment losses and dissolutions of acquired surplus and deficit values are reported as ”participation in the result of associates”. These share splits decreased with dividends received from associated companies represent the main change in the carrying amount of participations in associates. The group’s share of other comprehensive income in associated companies is reported on a separate line in the group’s other comprehensive income.
Any difference in the acquisition between the acquisition value of the holding and the investor’s share of the fair value net of the identifiable assets and liabilities of the associate is reported according to the same principles as in the acquisition of subsidiaries.
Transaction expenditure, with the exception of transaction expendi-ture relating to the issue of equity instruments or debt instruments, which arises is included in the acquisition value. When the group’s sha-re of reported losses in the associated company exceeds the carrying amount of the group’s shares, the value of the shares is reduced to zero. Offsetting of losses is also effected against non-collateral long-term financial transactions, which are, in their economic sense, part of the investor’s net investment in the associated company. Continued losses are not reported unless the group has provided guarantees to cover the losses incurred by the associated company. The equity method is applied up to the time when the significant influence ceases.
Transactions eliminated on consolidationIntercompany receivables and liabilities, income or expenses and un-realized gains or losses arising from intra-group transactions between business units are eliminated in full when the consolidated financial statements are prepared. Unrealized gains arising from transactions with associates are eliminated to the extent that corresponds to the group’s ownership interest in the company. Unrealized losses are eliminated in the same way as unrealized gains, but only to the extent that there is no impairment.
Foreign currencyTransactions in foreign currencyTransactions in foreign currency are translated into the functional currency at the exchange rate prevailing on the transaction date. Functional currency is the currency of the primary economic environ-ments in which the companies conduct their business. Monetary assets and liabilities denominated in foreign currency are converted into functional currency at the balance sheet date and exchange rate differences are recognized. Exchange rate differences arising from translation are reported in profit or loss for the year. Non-monetary as-sets and liabilities that are reported at historical acquisition values are translated with the exchange rate at the transaction. Non-monetary assets and liabilities that are recognized at fair value are translated into the functional currency at the rate prevailing at the time of measure-ment at fair value.
Financial statements of foreign operationsAssets and liabilities in foreign operations, including goodwill and other group surplus and discount values, are translated from entity functional currency to the group’s reporting currency, euro, at the exchange rate prevailing on balance sheet date. Income and expen-ses in a foreign operation are translated into euro at an average rate that is an approximation of the exchange rates prevailing at the time
Q U A N T A N N U A L R E P O R T 2 0 1 8
Q U A N T A N N U A L R E P O R T
2 0 1 8
45
of the respective transaction. Translation differences arising from currency translation of foreign operations are recognized in other comprehensive income and accumulate in a separate component of equity, the term ”translation reserve”. When controlling influence or significant influence ceases for a foreign operation, they are realized in the operations related to accumulated translation differences, which are reclassified from the translation reserve in equity to the profit/loss for the year. Where disposal occurs but controlling influence remains, the proportional share of accumulated translation differences from the conversion reserve is transferred to non-controlling interests. In the case of disposal of parts of associates, but significant influence rema-ins, the proportionate share of the translation differences is reclassified to profit for the year.
RevenueThe Group began to apply the new accounting standard IFRS 15 Revenue from Contracts with Customers on January 1 2018. Quant is a supplier of industrial maintenance services whose customers are comprised of industrial facilities such as production factories, pulp and paper mills and mining operations to name a few. Our contracts with customers are commitments to provide services over the period of time specified in the contract. Therefore, our revenues are recognized over the time during which the services are rendered. In some cases, invoices are not sent in the same period as the service delivered which then results in accrued or deferred revenue.
LeasingOperational leasing agreementsExpenses relating to operational leasing agreements are reported in the income statement on a straight-line basis over the lease term. Benefits received in connection with the signing of an agreement are reported in income statement as a reduction in the leasing charges linearly over the term of the leasing contract. Variable fees are expen-sed in the periods they arise.
Financial income and expensesFinancial income consists of interest income on invested funds and gain on the change in value of financial assets valued at fair value through profit or loss.
Interest income on financial instruments is reported according to the effective interest method (see below). Dividend income is recognized when the right to receive dividends is determined. The result of the disposal of a financial instrument is recognized when the risks and benefits associated with ownership of the instrument are transferred to the buyer and the group no longer has control over the instrument.Financial expenses consist of interest expenses on loans, the effect of the dissolution of the present value calculation of provisions, loss on changes in value of financial assets valued at fair value through profit or loss, impairment of financial assets and such losses on hedging instruments reported in profit or loss for the year. Borrowing costs are recognized in profit or loss using the effective interest method, except to the extent that they are directly attributable to the purchase, construction or production of assets that take a significant amount of time to complete for their intended use or sales, in which case they are included in the acquisition value of the assets.
The effective interest rate is the interest rate discounting the estimated future cash receipts and disbursements for the expected maturity of the financial assets or liabilities of the net carrying amount of the asset
or liability. The calculation includes all fees paid or received by the con-tracting parties that are part of the effective interest rate, transaction costs and all other surplus or deficit rates.
TaxesIncome taxes consist of current tax and deferred tax. Income taxes are re-ported in the income statement except where the underlying transaction is recognized in other comprehensive income or in equity, whereby the related tax effect is recognized in other comprehensive income or equity.Current tax is tax that is to be paid or received in the current year, based on the tax rates enacted or substantively enacted at the end of the reporting period, including adjustments of current tax in respect of prior periods.
Deferred tax is calculated using the balance sheet method on the basis of temporary differences between the carrying amounts and the tax values of assets and liabilities. Temporary differences are not taken into consideration that occurred when goodwill was first recognized, nor for the difference arising from the initial recognition of assets and liabilities that are not business combinations that at the time of the transaction do not affect either the accounting taxable profit or loss. Furthermore, temporary differences attributable to shares in subsi-diaries and associates that are not expected to be reversed in the foreseeable future are also not considered. The valuation of deferred tax is based on how the underlying assets or liabilities are expected to be realized or settled. Deferred tax is calculated by applying the tax rates and tax rules adopted or adopted in practice decided at the reporting date.
Deferred tax assets relating to deductible temporary differences and loss carryforwards are recognized only to the extent that it is probable that they will be utilised. The value of deferred tax assets is reduced when it is no longer deemed likely that they can be utilised.
Any additional income tax arising from dividends is recognized at the same time as the dividend is recognized as a liability.
Financial instrumentsFinancial instruments are any form of contract that gives rise to a financial asset in a company and a financial liability or an equity instru-ment of another company.
Recognition in and deletion from the statement of financial position A financial asset or financial liability is included in the statement of financial position when the company becomes a party under the con-tractual terms of the instrument. A claim is raised when the company has performed, and a contractual obligation exists for the counterparty to pay, even if the invoice has not yet been sent. Accounts receivable are included in the statement of financial position when the invoice has been sent. Debt is raised when the counterparty has performed, and contractual obligation exists to pay, even if the invoice has not yet been received. Accounts payable are entered when the invoice is received.
A financial asset is removed from the statement of financial position when the rights in the agreement are realized, expired or the company loses control of them. The same applies to parts of financial assets. A financial liability is removed from the statement of financial position when the contractual obligation is fulfilled or otherwise extinguished. The same applies to parts of financial liabilities.
Q U A N T A N N U A L R E P O R T 2 0 1 8
46
A financial asset and a financial liability are offset and reported with a net amount in the statement of financial position only when there is a legal right to offset the amounts and that there is an intention to regulate the items with a net amount or to simultaneously realize the asset and settle the debt.
Acquisitions and divestments of financial assets are reported on the trade date. The business day constitutes the date on which the com-pany commits to acquire or divest the asset.
Classification and valuationThe classification of financial instruments are in the following catego-ries: (a) Financial assets valued at fair value through profit or loss, (b) Loan receivables and trade receivables, (c) Financial instruments held to maturity, (d) Financial available-for-sale assets and (e) Other financial liabilities. The classification depends on the purpose for which the instruments were acquired. The management determines the initial accounts and reconsiders this decision at each reporting date. All financial instruments are reported from the business day.
Classification and measurement of financial assets and liabilities (a) Financial assets valued at fair value through profit or loss. This category has two sub-groups: financial assets held for trading and those which from the outset are attributable to the category valued at fair value through profit or loss for the year. A financial asset is classified in this category if it has been acquired mainly for the purpose of being sold shortly or if this classification is determined by management. Derivative instruments are also categorized as holdings for trading if they are not identified as hedges. Assets in this category are classified as current assets if they are either held for trading or are expected to be realized within 12 months of the balance sheet date.
(b) Loans receivable and Accounts receivableLoan receivables and trade receivables are non-derivative financial assets with fixed or determinable payments that are not quoted on an active market. Characteristically, they arise when the group provides money, goods or services directly to a customer without the intention of trading the resulting receivable. They are included in current assets, except for items with a due date more than 12 months after the balan-ce sheet date, which are classified as fixed assets. Quant’s liquid funds, accounts receivable, accrued income and certain other receivables are included in this category.
(c) Financial assets held to maturityFinancial assets held to maturity are non-derivative financial assets with fixed or determinable payments and fixed maturities for which the group’s management has the intention and ability to retain to maturity. Quant has no financial instruments classified in this category.
(d) Available-for-sale financial assetsFinancial assets not classified in any other category such as shares and participations in both listed and non-listed companies. Quant has no financial instruments classified in this category.
(e) Other financial liabilitiesFinancial liabilities that are not held for trading. Quants borrowing, accounts payable and certain accrued expenses are included in this category.
Liquid fundsLiquid funds consist of cash and immediately available balances of banks and corresponding institutions and short- term liquid invest-ments with a maturity from the acquisition date of less than three months, which are subject to only insignificant risk of fluctuation.
Recognition and measurement of financial instrumentsFinancial assets not recognized at fair value (Loan receivables and trade receivables) are non-derivative financial assets with fixed or determinable payments that are not quoted in an active market. These assets are measured at amortized cost which is determined based on the effective interest rate calculated on the date of acquisition. Assets with short maturities are not discounted.
Accounts receivable are recognized at the amount which is expected to be received, i.e. after the deduction of bad debts, assessed indivi-dually. Impairment losses on accounts receivable are recognized in operating expenses.
Other receivables are classified as non-current receivables if the holding period is longer than one year and if they are shorter than other receivables. A provision for credit losses is made when there are strong indications that the group will not be able to obtain the amounts stated in the original terms of the claims.
Other financial liabilities are reported at amortized cost based on the effective interest method. The acquisition value is the fair value at the time of acquisition. For borrowing, this amount received is reduced for any transaction costs. Accounts payable have a short expected term and are valued without discounting to their nominal amount.
Any gains or losses arising in connection with the disposal of financial instruments or the repurchase of loan liabilities are recognized in items within profit or loss for the year.
Offsetting of financial instrumentsFinancial assets and liabilities are offset against each other and netted in the consolidated financial statements in cases where Quant has agreed with the counterparty that the assets and liabilities are to be settled net.
Financial derivative instrumentsFinancial derivatives are initially reported at acquisition value in the sta-tement of financial position, and subsequently at the prevailing market value on the following balance sheet dates. The method of accounting for the resulting gain or loss varies depending on the nature of the hedged interest. Quant’s financial instruments are presented in more detail in note 21.
When a derivative contract is entered into, it is classified as either (1) fair value hedge of a recognized asset or liability (real value hedging), (2) Hedging of a planned transaction or a definitive commitment (cash flow hedge), (3) hedging of a net investment in a foreign company or (4) as a derivative instrument that does not qualify for hedge accounting.
Changes in the market value of derivatives classified as, and qualify for, fair value hedging and can be determined objectively are reported in items within the year’s profit, together with any changes in the market value of the asset or liability that the hedge relates to.
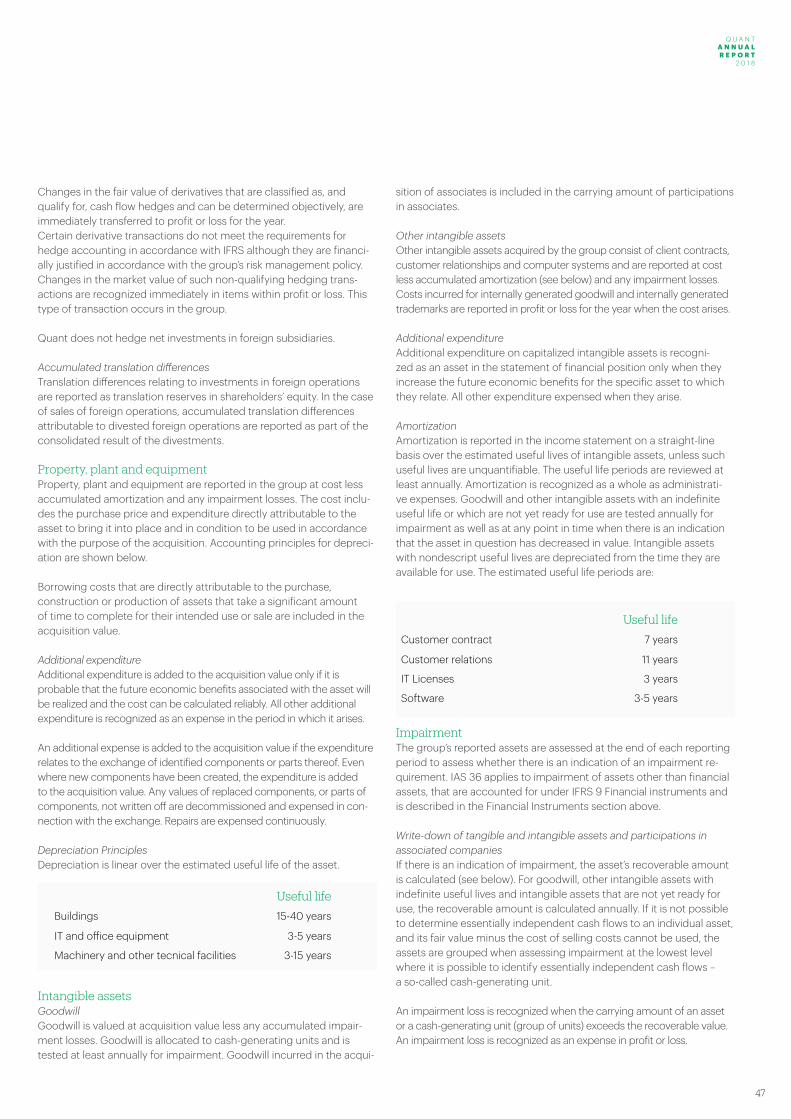
Q U A N T A N N U A L R E P O R T 2 0 1 8
Q U A N T A N N U A L R E P O R T
2 0 1 8
47
Changes in the fair value of derivatives that are classified as, and qualify for, cash flow hedges and can be determined objectively, are immediately transferred to profit or loss for the year.Certain derivative transactions do not meet the requirements for hedge accounting in accordance with IFRS although they are financi-ally justified in accordance with the group’s risk management policy. Changes in the market value of such non-qualifying hedging trans-actions are recognized immediately in items within profit or loss. This type of transaction occurs in the group.
Quant does not hedge net investments in foreign subsidiaries.
Accumulated translation differencesTranslation differences relating to investments in foreign operations are reported as translation reserves in shareholders’ equity. In the case of sales of foreign operations, accumulated translation differences attributable to divested foreign operations are reported as part of the consolidated result of the divestments.
Property, plant and equipmentProperty, plant and equipment are reported in the group at cost less accumulated amortization and any impairment losses. The cost inclu-des the purchase price and expenditure directly attributable to the asset to bring it into place and in condition to be used in accordance with the purpose of the acquisition. Accounting principles for depreci-ation are shown below.
Borrowing costs that are directly attributable to the purchase, construction or production of assets that take a significant amount of time to complete for their intended use or sale are included in the acquisition value.
Additional expenditureAdditional expenditure is added to the acquisition value only if it is probable that the future economic benefits associated with the asset will be realized and the cost can be calculated reliably. All other additional expenditure is recognized as an expense in the period in which it arises.
An additional expense is added to the acquisition value if the expenditure relates to the exchange of identified components or parts thereof. Even where new components have been created, the expenditure is added to the acquisition value. Any values of replaced components, or parts of components, not written off are decommissioned and expensed in con-nection with the exchange. Repairs are expensed continuously.
Depreciation PrinciplesDepreciation is linear over the estimated useful life of the asset.
Intangible assetsGoodwillGoodwill is valued at acquisition value less any accumulated impair-ment losses. Goodwill is allocated to cash-generating units and is tested at least annually for impairment. Goodwill incurred in the acqui-
sition of associates is included in the carrying amount of participations in associates.
Other intangible assetsOther intangible assets acquired by the group consist of client contracts, customer relationships and computer systems and are reported at cost less accumulated amortization (see below) and any impairment losses.Costs incurred for internally generated goodwill and internally generated trademarks are reported in profit or loss for the year when the cost arises.
Additional expenditureAdditional expenditure on capitalized intangible assets is recogni-zed as an asset in the statement of financial position only when they increase the future economic benefits for the specific asset to which they relate. All other expenditure expensed when they arise.
AmortizationAmortization is reported in the income statement on a straight-line basis over the estimated useful lives of intangible assets, unless such useful lives are unquantifiable. The useful life periods are reviewed at least annually. Amortization is recognized as a whole as administrati-ve expenses. Goodwill and other intangible assets with an indefinite useful life or which are not yet ready for use are tested annually for impairment as well as at any point in time when there is an indication that the asset in question has decreased in value. Intangible assets with nondescript useful lives are depreciated from the time they are available for use. The estimated useful life periods are:
ImpairmentThe group’s reported assets are assessed at the end of each reporting period to assess whether there is an indication of an impairment re-quirement. IAS 36 applies to impairment of assets other than financial assets, that are accounted for under IFRS 9 Financial instruments and is described in the Financial Instruments section above.
Write-down of tangible and intangible assets and participations in associated companiesIf there is an indication of impairment, the asset’s recoverable amount is calculated (see below). For goodwill, other intangible assets with indefinite useful lives and intangible assets that are not yet ready for use, the recoverable amount is calculated annually. If it is not possible to determine essentially independent cash flows to an individual asset, and its fair value minus the cost of selling costs cannot be used, the assets are grouped when assessing impairment at the lowest level where it is possible to identify essentially independent cash flows – a so-called cash-generating unit.
An impairment loss is recognized when the carrying amount of an asset or a cash-generating unit (group of units) exceeds the recoverable value. An impairment loss is recognized as an expense in profit or loss.
Useful life
Buildings 15-40 years
IT and office equipment 3-5 years
Machinery and other tecnical facilities 3-15 years
Useful life
Customer contract 7 years
Customer relations 11 years
IT Licenses 3 years
Software 3-5 years
Q U A N T A N N U A L R E P O R T 2 0 1 8
48
The recoverable amount is the highest of fair value minus selling costs and value in use. In calculating the value, future cash flows are discounted by a discount factor taking into account the risk-free interest rate and the risks associated with the specific asset.
Reversal of impairment lossesAn impairment loss on assets included in the scope of IAS 36 is reversed if there is both an indication that the impairment no longer exists and there has been a change in the assumptions that formed the basis for the calculation of the recoverable value. However, impairment of goodwill is never reversed. A reversal is only made to the extent that the carrying amount of the asset after reversal does not exceed the carrying amount that would have been recognized, less depreciation, where applicable, if no impairment was made.
Write-downs of loan receivables and accounts receivables that are recog-nized at amortized cost are reversed if the earlier reasons for impairment are no longer present and full payment from the customer is expected to be received.
InventoryInventories are valued at the lower of cost and net realizable value. The cost of inventories is calculated by applying the first-in, first-out (FIFO) method and includes expenditure incurred in the acquisition of the inven-tory assets and transporting them to their current location and condition.
Net realizable value is the estimated selling price in the ordinary course of business, after deduction of estimated costs for completion and for the purpose of obtaining a sale.
Payment of capital to the ownersDividends are recognized as a liability after the Annual General Meeting approves the dividend.
Employee BenefitsShort-term remunerationsShort-term employee benefits are calculated without discounting and are recognized as an expense when the related services are received.
A provision is recognized for the expected cost of profit-sharing and bonus payments when the group has an existing legal or constructive obligation to make such payments as a result of services received from employees and the obligation can be calculated reliably.
Defined contribution pension plansThe plans in which the company’s obligation is limited to the fees that the company has undertaken to pay is classifies as a defined-contribu-tion pension plan. In such a case, the amount of the employee’s pension depends on the fees paid by the company to the plan or to an insuran-ce company and the return on capital provided by the contributions. Consequently, it is the employee who bears the actuarial risk (that the compensation is lower than expected) and the investment risk (that the assets invested will be insufficient to provide the expected benefits). The company’s obligations for contributions to defined contribution plans are recognized as an expense in the profit or loss for the year as they are earned by the employees carrying out services to the company over a period of time.
Defined benefit pension plansDefined benefit plans are other post-employment benefit plans than defined contribution plans. The group’s net obligation for defined benefit plans is calculated separately for each plan by estimating the future remuneration that employees earned through their employment in both current and previous periods; This compensation is discounted to a present value. The discount rate is the interest rate on the balance sheet date of an investment grade corporate bond, including mort-gage bonds, with a maturity corresponding to the group’s pension obligations. When there is no viable market for such corporate bonds, the market rate is instead used on government bonds with a corres-ponding maturity. The calculation is performed by a qualified actuary, using the projected Unit Credit Method. Furthermore, the fair value of any plan assets is calculated as of the reporting date.
The group’s net obligation comprises the present value of the obli-gation, minus the fair value of the plan assets adjusted for any asset constraints.
Interest expense/revenue net of the defined benefit obligation/asset is reported in profit or loss for the year during net financial items. Net in-terest income is based on the interest that arises when discounting the net obligation, i.e. interest on the obligation, plan assets and interest on the effect of any asset constraints. Other components are reported in operating income.
Revaluation effects consist of actuarial gains and losses, difference between the actual return on management assets and the amount included in net interest income and any changes in the effects of asset restrictions (excluding interest Included in net interest income). The revaluation effects are recognized in other comprehensive income.
When the calculation results in an asset for the group, the carrying amount of the asset is limited to the lower of the surplus in the plan and the asset restriction calculated using the discount rate. The asset restriction is the present value of the future economic benefits in the form of reduced future fees or cash refunds. For the calculation of the present value of future refunds or payments, any requirements for minimum funding are taken into account.
Changes or curtailments of a defined benefit plan are recognized at the earliest of the following dates; A) when the change in the plan or reduction occurs or (b) when the entity reports related restructuring costs and termination benefits. The changes/reductions are reported directly in profit or loss for the year.
The special payroll tax is part of the actuarial assumptions and is therefore accounted for as part of the net obligation/asset. The part of the special payroll tax that is calculated on the basis of the safeguar-ding law of a legal person is recognized for reasons of simplification as accrued expense instead of as part of the net obligation/asset.
Return tax is reported on an ongoing basis in profit or loss for the period in which the tax relates and is thus not included in the liability calculation. In the case of funded plans, the tax is charged on the re-turn on plan assets and is recognized in other comprehensive income. In unfunded or partly unfunded plans, the tax is charged to net profit for the year.
Q U A N T A N N U A L R E P O R T 2 0 1 8
Q U A N T A N N U A L R E P O R T
2 0 1 8
49
Other long-term remunerationsThe group’s net obligation for other long-term benefits, other than pen-sions, amounts to the value of future benefits that employees have earned as compensation for the services they have performed in the current and previous periods. The compensation is discounted to a present value and the fair value of any plan assets is deducted. The discount rate is de-termined on the same basis as for defined benefit pension plans. The calculation is done with the so-called ”projected unit credit method”. Any actuarial gains or losses are recognized in the income for the year in the period in which they arise.
Termination benefitsA cost of remuneration in connection with redundancies is recognized at first when the company can no longer withdraw the offer to the employees or when the company recognizes restructuring costs. The benefits that are expected to be settled after 12 months are reported at its present value. Benefits that are not expected to be settled entirely within twelve months are reported according to long-term benefits.
ProvisionsA provision differs from other debts in that there is uncertainty about the period of payment or the amount to regulate the provision. A provision is recognized in the statement of financial position when there is an exis-ting legal or constructive obligation as a result of a past even, and it is probable that an outflow of financial resources will be required to regu-late the obligation and a reliable estimate of the amount can be made.
Provisions are made with the amount that is the best estimate of what is required to settle the existing obligation at the balance sheet date. Where the effect of when payment is made is material, provisions are calculated by discounting the expected future cash flow at a pre-tax rate that reflects current market assessments of the time value of money and, if applicable, the risks associated with the debt.
A provision for restructuring is recognized when the Group has adopted a comprehensive and formal restructuring plan, and the restructuring has either been started or published. No provisions are made for future operating expenses.
GuaranteesA provision for guarantees is recognized when the underlying pro-ducts or services are sold. The provision is based on historical data on guarantees and an aggregate of possible outcomes in relation to the probabilities that the outcomes are associated with.
Contingent liabilitiesA contingent liability is recognized when there is a possible commit-ment arising from past events and whose existence is confirmed only by one or more uncertain future events outside the group’s control or when there is a commitment that is not recognized as a liability or provision because it is not probable that an outflow of resources will be required or cannot be calculated with sufficient reliability.
Earnings per shareCalculation of earnings per share is based on consolidated profit or loss for the period attributable to shareholders of the parent and on the weighted average number of outstanding shares during the period. The Group has no employee share plans or other type of share program that would cause a dilutive effect on ordinary shares. Therefo-re Earnings per share after dilution is not calculated.
Parent Company Accounting PoliciesThe parent company has prepared its annual report in accordance with the Swedish Annual Accounts Act (1995:1554) and the Swedish Fi-nancial Reporting Board’s recommendation RFR 2 Accounting for legal entities. Statements issued by the Swedish Financial Reporting Board for listed companies are also applied. RFR 2 means that the parent company in the annual report of the legal entity shall apply all IFRS and statements adopted by the EU as far as possible within the framework of the Annual Accounts Act, the Security Law and with regard to the relationship between accounting and taxation. The recommendation specifies the exceptions and additions to IFRS which should be made.
Differences between the group’s and the parent company’s accounting policiesThe differences between the group’s and the parent company’s accounting principles are shown below. The accounting principles for the parent company described below have been applied consistently to all periods presented in the parent company’s financial statements.
Classification and presentation formsThe parent company uses the terms balance sheet and cash flow statement for the reports reported in the Group as the statement of financial position and the statement of cash flows. The income state-ment and balance sheet are for the parent company in accordance with the annual Accounts Act schedule, while the statement of income and other comprehensive income, the statement of changes in equity and the cash flow analysis is based on IAS 1 Presentation of Financial statements and IAS 7 Statement of Cashflows. The differences with the group’s reports that are made in the parent company’s income statement and balance sheet consist mainly of accounting for financial income and expenses, fixed assets, equity and the existence of provi-sions as own heading in the balance sheet.
SubsidiariesShares in subsidiaries are reported in the parent company accor-ding to the cost method. This means that transaction expenses are included in the carrying amount of investments in subsidiaries. In the consolidated financial statements, transaction expenses attributable to subsidiaries are reported directly in the result when these are incurred.
Financial instrumentsAs a result of the relationship between accounting and taxation, the rules on financial instruments is not applied in the parent company as a legal entity.
In the parent company, financial fixed assets are valued at cost less any impairment losses and financial current assets according to the lowest value principle. The acquisition value of interest-bearing instruments is adjusted for the accrued difference between what was initially paid, after deduction of transaction costs, and the amount paid on the due date (premium or discount).
Anticipated dividendsAnticipated dividends from subsidiaries are reported in cases where the parent company has the right to decide on the size of the dividend and the parent company has decided on the size of the dividend before the parent company publishes its financial statements.
Tangible fixed assetsTangible fixed assets in the parent company are reported at cost less
Q U A N T A N N U A L R E P O R T 2 0 1 8
50
The estimates and assessments that Quant’s management and Board of Directors mention below are those that are deemed most important to obtain an understanding of Quant’s financial reporting. The infor-mation is limited to areas that are essential, taking into account the degree of impact and underlying security. Estimates and assessments are based on historical experience and assumptions that management and the Board of Directors consider reasonable under the relevant circumstances. Drawn conclusions form the basis of the carrying amounts of assets and liabilities, where these cannot be determined by information from other sources. Actual outcome may differ from these through estimates and assessments.
Customer contractsQuant’s source of revenues consists mostly of fixed price contracts but also current hourly price contracts. Performance is assessed in re-lation to the terms of the contract. In order to determine the amounts to be recognized and whether the reservations for losses is to be made, the total contract costs are assessed and the proportion of the contract that has been completed.
Pension obligationsWithin the group, defined benefit pension plans have significant commitments for future benefits to current and former staff. To carry out the calculation of the pension liability, actuarial assumptions are of great importance for the outcome of the calculation. The assessments mainly concern the discount rate on commitments and expected re-turn on plan assets, but also assumptions about the rate of wage incre-ases, staff turnover and estimated life expectancy. A reduced discount
Through its operations, Quant is exposed to a number of different financial risks: market risk (primarily currency risk and interest rate risk), financing risk, credit risk and liquidity risk. Financial risks arise when refinancing and credit risks as well as changes in interest rates and exchange rates affect the group’s earnings, cash flow and value. Quant has a central treasury function whose overall objective is to act as the group’s internal bank, to provide a cost-effective and secure financing of the group, manage interest rate and currency risks and ensure effective liquidity management for the group. Treasury iden-tifies, evaluates and secures financial risks in close co-operation with the group’s operating units.
Quant has a finance policy approved by the Board whose purpose is to limit the financial risks that Quant is exposed to and determine how financial risks are to be controlled and managed. The financial policy is revised annually. Risk management and financing activities are reported continuously to management and the Board of Directors. The Board reviews and decides on strategies for managing financial risks as summarized below.
Market riskCurrency riskQuant’s operations are conducted in countries all over the world. The group is thereby exposed to currency risks, both through transactions in foreign currencies and through the translation of income state-ments and balance sheets into euro. Quant’s assets are contracts for the outsourcing of industrial maintenance, which generate revenues and costs mainly in CLP, EUR, SEK and USD but there is also exposure in other currencies. Changes in exchange rates in the aforementioned non-euro currencies thus entail changes in Quant’s operating profit.
Sensitivity analysis exchange rate risk Assuming that the currencies, significant for Quant’s earnings and cash flow, are weakened by 10% against the group’s functional cur-rency, the group’s EBITDA is affected by 8% (9%). The corresponding effect on external borrowing in non-functional currency amounts to 0% (5%).
Transaction exposureThe group is exposed to different types of currency risks. Transaction exposure is derived from the group’s sales and purchases in foreign currencies. These currency risks consist partly of the risk of fluctua-tions in the value of accounts receivable or accounts payable, and the currency risk in expected and contracted cash flows.
Note 2. Estimates and assessments
Note 3. Financial risk management framwork
accumulated amortization and any impairment losses in the same way as for the group but with additions for any write-ups.
Leased assetsIn the parent company, all leasing agreements are reported according to operating lease rules.
Borrowing costsIn the parent company, loan expenditure is charged to the result during the period to which they relate. No borrowing costs are capita-lized on assets.
Employee BenefitsDefined benefit plans.
Other grounds for calculating defined benefit plans than those set out in IAS 19 are applied in the parent company. The parent company complies with the provisions of the Swedish legal framework and Finansinspektionen’s (the Swedish financial supervisory authority) regulations as this is a precondition for tax deduction. The main differences compared to the rules in IAS 19 are how the discount rate is determined, that the calculation of the defined benefit obligation is based on the current salary level without the assumption of future salary increases, and that actuarial gains and losses are recognized in the income statement.
Group contributionsGroup contributions are reported as financial appropriation.
rate increases the reported pension liability. The actual outcome may deviate from the accounts in the case where the assumptions applied have been shown to be incorrect.
Intangible assetsIntangible assets mainly refer to goodwill, customer contracts and customer relations. Goodwill with an indefinite life expectancy is not subject to annual depreciation. Insofar as the underlying activities develop negatively, an impairment loss may arise. An impairment test is carried out annually mainly based on the value of use, with assump-tions about sales development, profit margins, current investments, changes in working capital and more.
Q U A N T A N N U A L R E P O R T 2 0 1 8
Q U A N T A N N U A L R E P O R T
2 0 1 8
51
Quant’s operations are largely local in the countries where the group is active. This means that the transaction exposure risk is limited for the group. Quant’s finance policy stipulates no minimum for currency hedging of transaction exposure, at the end of the year Quant had no transaction exposure derivatives outstanding. The group’s treasury function evaluates the ongoing transaction exposure risk and propo-ses hedging strategies.
Translation exposuresCurrency risks are also found in the translation of foreign subsidiaries’ assets and liabilities to the parent company’s functional currency. Quant’s exposure to translation risk arises because a large proportion of the subsidiaries have a functional currency that deviates from the accounting currency of the group. In accordance with the financial policy, Quant had not hedged the translation exposure at the end of the financial year.
Financial currency exposureThe group is also exposed to currency risks with respect to payment flows for loans and investments in foreign currency. In accordance with the finance policy, the goal is to limit currency effects on financial investments and loans. Group companies lend and deposits liquidity internally in the local currency of the respective borrowers to the ex-tent possible, depending on the local currency regulations and or the convertibility of the currencies. The net exposure of financial assets and liabilities is centralized to the parent company and currency is hedged according to the group’s finance policy. At the end of the pe-riod, Quant had financial hedge derivatives outstanding at a nominal value of EUR 0.9 (1.0) million.
Interest rate riskInterest rate risk is the risk that market rates fluctuate in such a way that Quant’s net interest expense develops negatively. The effect on the group’s result of a change in interest rates depends on the fixation periods of the loans and investments and the current share of fixed and variable interest rates. Since the group does not hold any signifi-cant interest-bearing assets, in addition to bank balances, the group’s income from operating activities is essentially independent of changes in market interest rates. Quant is exposed to interest rate risk through interest-bearing borrowing, which is one of the group’s sources of finance in addition to equity and cash flow from operating activities. Interest-bearing borrowing consists mainly of centrally agreed bond, which runs on fixed interest rates. In order to limit interest rate risk, Quant has the policy option of concluding interest rate derivatives in order to reduce the effects of future interest fluctuations by changing parts of the variable interest rate at a fixed rate. On December 31, 2018 there were no such interest rate derivative outstanding.
The average fixation period for the group’s borrowings (excluding shareholder loans) at the end of 2018 was 3.9 (0.2) years. On the basis of interest rate exposure as of December 31, 2018, a change in market interest rates of one percentage point would affect the group’s net financial items by EUR +/- 0.0 (0.9) million. The simulation assumes a parallel shift of all interest rate curves and does not take into account any currency and maturity differences.
Credit riskThe credit risk on financial assets, such as liquid assets and trading in financial instruments, is limited to credit risk for the banks where the group has bank accounts, and with which the group trades in financial instruments. The group’s liquidity is concentrated, according to the fi-nance policy, to the parent company and banks with a high rating. The liquidity that remains in the group companies within Quant is usually spread evenly across companies and thus evenly spread on different banks in different geographical areas.
Liquidity risk and financing riskLiquidity risk is defined as the risk that Quant cannot fulfil its obliga-tions to pay debts on time or at a reasonable cost. The group’s capital management aims to create a balance between equity and loan finan-cing so that financing of operations is secured at a reasonable cost of capital. The aim is to finance growth and normal investments with own generated cash flow as far as possible. risks are managed centrally for the entire group of the central treasury function. The group’s goal is to always have sufficient funds in available liquidity and unused loan facilities, a so- called liquidity Reserve, to cover 45 days of the group’s disbursement needs. Liquidity is monitored continuously to meet expected disbursement needs.
Refinancing is defined as the risk that financing or refinancing is difficult or costly to obtain. Quant has access to funding through the money market and the Board of Directors continuously monitors and evaluates the group’s financing and refinancing possibilities over time.
Financial covenantsThe group’s bonds and its bank facility contain financial commitments, so called covenants, where the group has committed to maintain financial ratios. The bond agreements contain covenants where the group’s borrowing against the result does not exceed certain ratios. These covenants are measured only under certain circumstances. The working capital facility contains covenants where drawn working capi-tal facility loans against the group’s results may not exceed certain rati-os and which are measured quarterly in connection with the quarterly report. The bond and facility agreements are also restrictive in relation to, inter alia, borrowings, the establishment of security or guarantees, acquisitions and sales of companies.
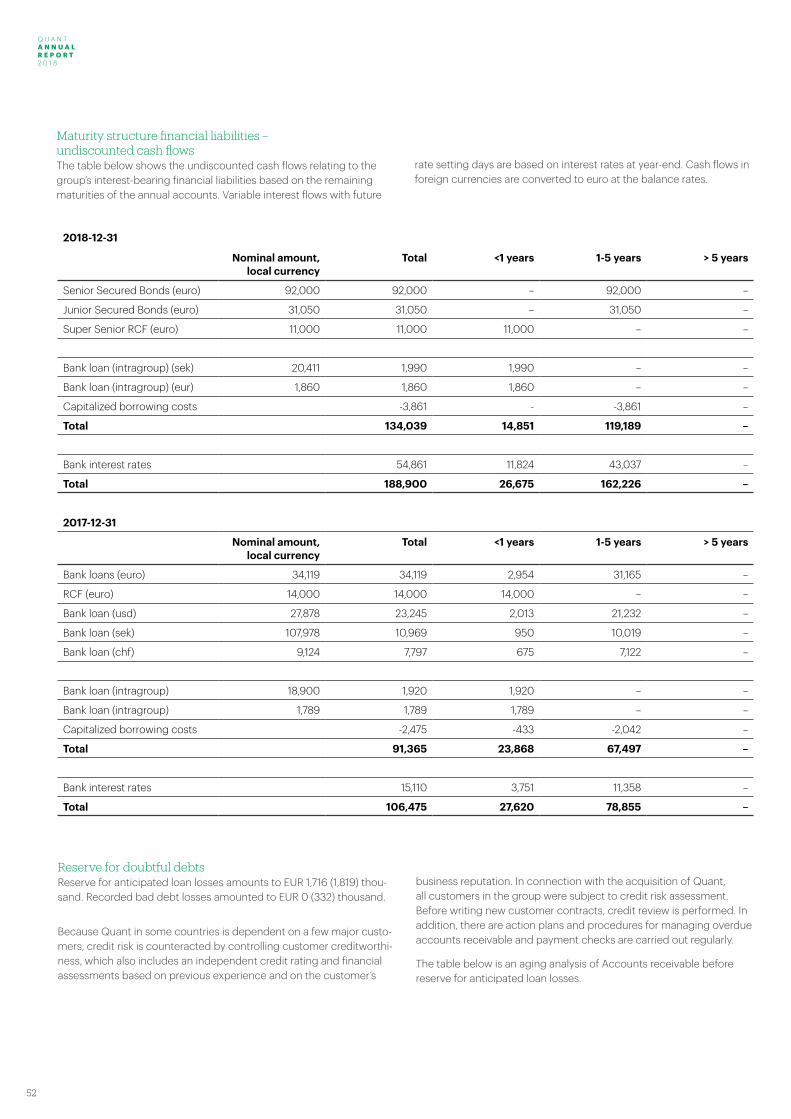
Q U A N T A N N U A L R E P O R T 2 0 1 8
52
2018-12-31
Nominal amount, local currency
Total <1 years 1-5 years > 5 years
Senior Secured Bonds (euro) 92,000 92,000 – 92,000 –
Junior Secured Bonds (euro) 31,050 31,050 – 31,050 –
Super Senior RCF (euro) 11,000 11,000 11,000 – –
Bank loan (intragroup) (sek) 20,411 1,990 1,990 – –
Bank loan (intragroup) (eur) 1,860 1,860 1,860 – –
Capitalized borrowing costs -3,861 - -3,861 –
Total 134,039 14,851 119,189 –
Bank interest rates 54,861 11,824 43,037 –
Total 188,900 26,675 162,226 –
2017-12-31
Nominal amount, local currency
Total <1 years 1-5 years > 5 years
Bank loans (euro) 34,119 34,119 2,954 31,165 –
RCF (euro) 14,000 14,000 14,000 – –
Bank loan (usd) 27,878 23,245 2,013 21,232 –
Bank loan (sek) 107,978 10,969 950 10,019 –
Bank loan (chf) 9,124 7,797 675 7,122 –
Bank loan (intragroup) 18,900 1,920 1,920 – –
Bank loan (intragroup) 1,789 1,789 1,789 – –
Capitalized borrowing costs -2,475 -433 -2,042 –
Total 91,365 23,868 67,497 –
Bank interest rates 15,110 3,751 11,358 –
Total 106,475 27,620 78,855 –
Reserve for doubtful debtsReserve for anticipated loan losses amounts to EUR 1,716 (1,819) thou-sand. Recorded bad debt losses amounted to EUR 0 (332) thousand.
Because Quant in some countries is dependent on a few major custo-mers, credit risk is counteracted by controlling customer creditworthi-ness, which also includes an independent credit rating and financial assessments based on previous experience and on the customer’s
business reputation. In connection with the acquisition of Quant, all customers in the group were subject to credit risk assessment. Before writing new customer contracts, credit review is performed. In addition, there are action plans and procedures for managing overdue accounts receivable and payment checks are carried out regularly.
The table below is an aging analysis of Accounts receivable before reserve for anticipated loan losses.
Maturity structure financial liabilities – undiscounted cash flowsThe table below shows the undiscounted cash flows relating to the group’s interest-bearing financial liabilities based on the remaining maturities of the annual accounts. Variable interest flows with future
rate setting days are based on interest rates at year-end. Cash flows in foreign currencies are converted to euro at the balance rates.
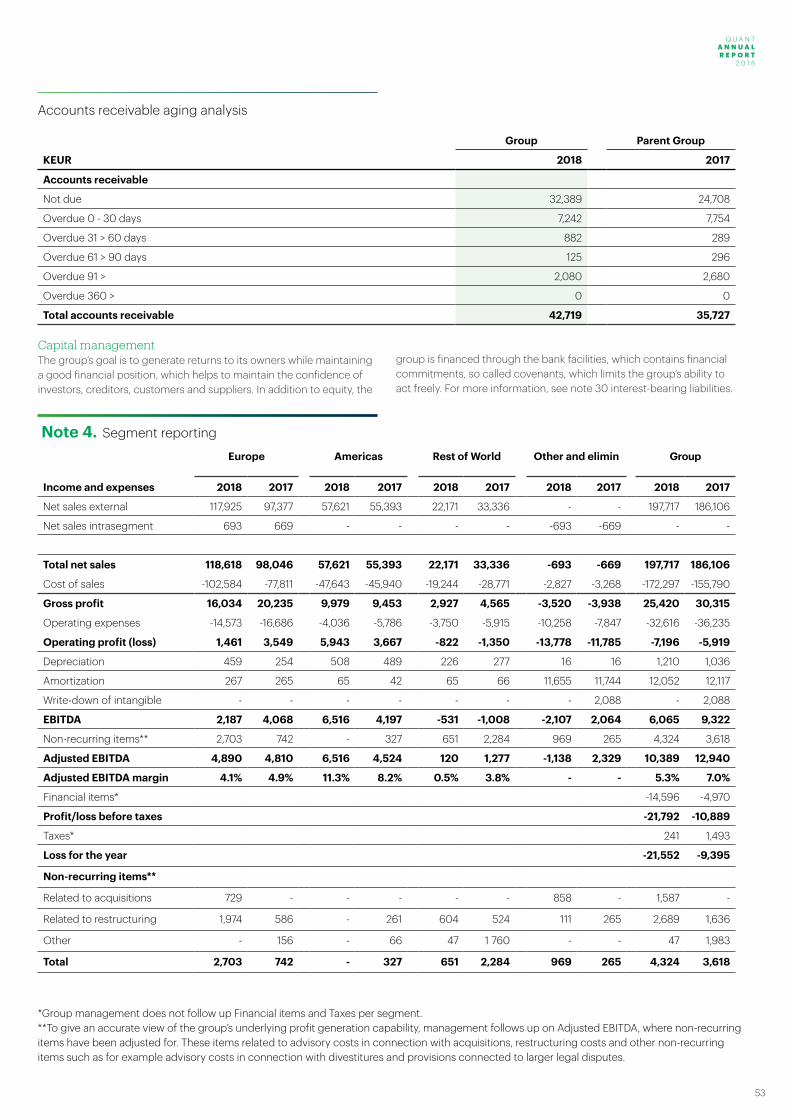
Q U A N T A N N U A L R E P O R T 2 0 1 8
Q U A N T A N N U A L R E P O R T
2 0 1 8
53
Note 4. Segment reporting
Europe Americas Rest of World Other and elimin Group
Income and expenses 2018 2017 2018 2017 2018 2017 2018 2017 2018 2017
Net sales external 117,925 97,377 57,621 55,393 22,171 33,336 - - 197,717 186,106
Net sales intrasegment 693 669 - - - - -693 -669 - -
Total net sales 118,618 98,046 57,621 55,393 22,171 33,336 -693 -669 197,717 186,106
Cost of sales -102,584 -77,811 -47,643 -45,940 -19,244 -28,771 -2,827 -3,268 -172,297 -155,790
Gross profit 16,034 20,235 9,979 9,453 2,927 4,565 -3,520 -3,938 25,420 30,315
Operating expenses -14,573 -16,686 -4,036 -5,786 -3,750 -5,915 -10,258 -7,847 -32,616 -36,235
Operating profit (loss) 1,461 3,549 5,943 3,667 -822 -1,350 -13,778 -11,785 -7,196 -5,919
Depreciation 459 254 508 489 226 277 16 16 1,210 1,036
Amortization 267 265 65 42 65 66 11,655 11,744 12,052 12,117
Write-down of intangible - - - - - - - 2,088 - 2,088
EBITDA 2,187 4,068 6,516 4,197 -531 -1,008 -2,107 2,064 6,065 9,322
Non-recurring items** 2,703 742 - 327 651 2,284 969 265 4,324 3,618
Adjusted EBITDA 4,890 4,810 6,516 4,524 120 1,277 -1,138 2,329 10,389 12,940
Adjusted EBITDA margin 4.1% 4.9% 11.3% 8.2% 0.5% 3.8% - - 5.3% 7.0%
Financial items* -14,596 -4,970
Profit/loss before taxes -21,792 -10,889
Taxes* 241 1,493
Loss for the year -21,552 -9,395
Non-recurring items**
Related to acquisitions 729 - - - - - 858 - 1,587 -
Related to restructuring 1,974 586 - 261 604 524 111 265 2,689 1,636
Other - 156 - 66 47 1 760 - - 47 1,983
Total 2,703 742 - 327 651 2,284 969 265 4,324 3,618
Group Parent Group
KEUR 2018 2017
Accounts receivable
Not due 32,389 24,708
Overdue 0 - 30 days 7,242 7,754
Overdue 31 > 60 days 882 289
Overdue 61 > 90 days 125 296
Overdue 91 > 2,080 2,680
Overdue 360 > 0 0
Total accounts receivable 42,719 35,727
Capital managementThe group’s goal is to generate returns to its owners while maintaining a good financial position, which helps to maintain the confidence of investors, creditors, customers and suppliers. In addition to equity, the
group is financed through the bank facilities, which contains financial commitments, so called covenants, which limits the group’s ability to act freely. For more information, see note 30 interest-bearing liabilities.
*Group management does not follow up Financial items and Taxes per segment.**To give an accurate view of the group’s underlying profit generation capability, management follows up on Adjusted EBITDA, where non-recurring items have been adjusted for. These items related to advisory costs in connection with acquisitions, restructuring costs and other non-recurring items such as for example advisory costs in connection with divestitures and provisions connected to larger legal disputes.
Accounts receivable aging analysis
Q U A N T A N N U A L R E P O R T 2 0 1 8
54
Quant’s operations are organized geographically and management follows up the business in three operating geographic regions: Europe, Americas and Rest of world. The reporting segment Other refers primarily to costs for headquarter functions that have not been operationally allocated to the geographic segments. There are no
intra-segment revenues charged between the operating segments, as the resources needed to perform services for each segment are procured within the respective segment. Since Quant’s business is all related to the supply of maintenance services to its customers, there is no further split of revenues into different types of services supplied.
Note 5. Revenue
From 1 January 2018 the Group complies with the new revenue recog-nition standard IFRS 15 Revenue from Contracts with Customers. The new standard has not produced any material effect on the financial statements except for the additional disclosure requirements. In our contracts with our customers we commit to performing maintenan-ce and managerial services over an agreed upon period of time and revenue is recognized over the period of time during which these services are rendered.
Within certain contracts Quant performs services in the form of inven-tory management of spare parts and repair components. This type of inventory passes through Quant’s ownership with no profit generated on this type of transaction. Consequently, Quant does not recognize this inventory turnover as a separate revenue category and only recog-nizes the revenue generated from the managerial services rendered to the customer.
Contract Assets and Contract LiabilitiesQuant typically invoices customers in the same period as the service is performed. The revenue is thus recognized in the same period as the invoicing occurs, resulting in limited Contract assets. In some cases, however, invoicing happens in a subsequent period to when the service is performed, resulting in a contract asset. This is recorded as Accrued income in the balance sheet (see note 26).
In some instances, Quant invoices the customer in advance of per-forming the service, resulting in Contract liabilities. This is recorded as Deferred income in the balance sheet (see note 31).
In addition, some contracts are invoiced at a monthly fixed price but have substantial variation during the year in fulfilment of the related performance obligations. This results in either contract assets or contract liabilities during the year but has an immaterial impact on the year-end result.
Order backlog (Unfulfilled performance obligations)Quant’s customer contracts mainly consist of multi-year contracts, where the customer may or may not have the possibility to terminate prematurely. To give an accurate view of the order backlog, it is mana-gement’s view that a better representation than the aggregate value of all contract revenue is the Contract portfolio.
Quant’s definition of contract portfolio is the annualized value of cur-rent customer contracts, adjusted for
• Signed new contracts, included at date of contract signing, irrespec-tive of start date
• Terminated contracts, excluded at date of formal notification, irre-spective of end date
• Changes formally agreed with the customers of existing contracts, in-cluded at date of agreement. This includes changes due to renewals of contracts or other reasons
At 31 December 2018, Quant’s contract portfolio was EUR 205.5 (187.8) million.
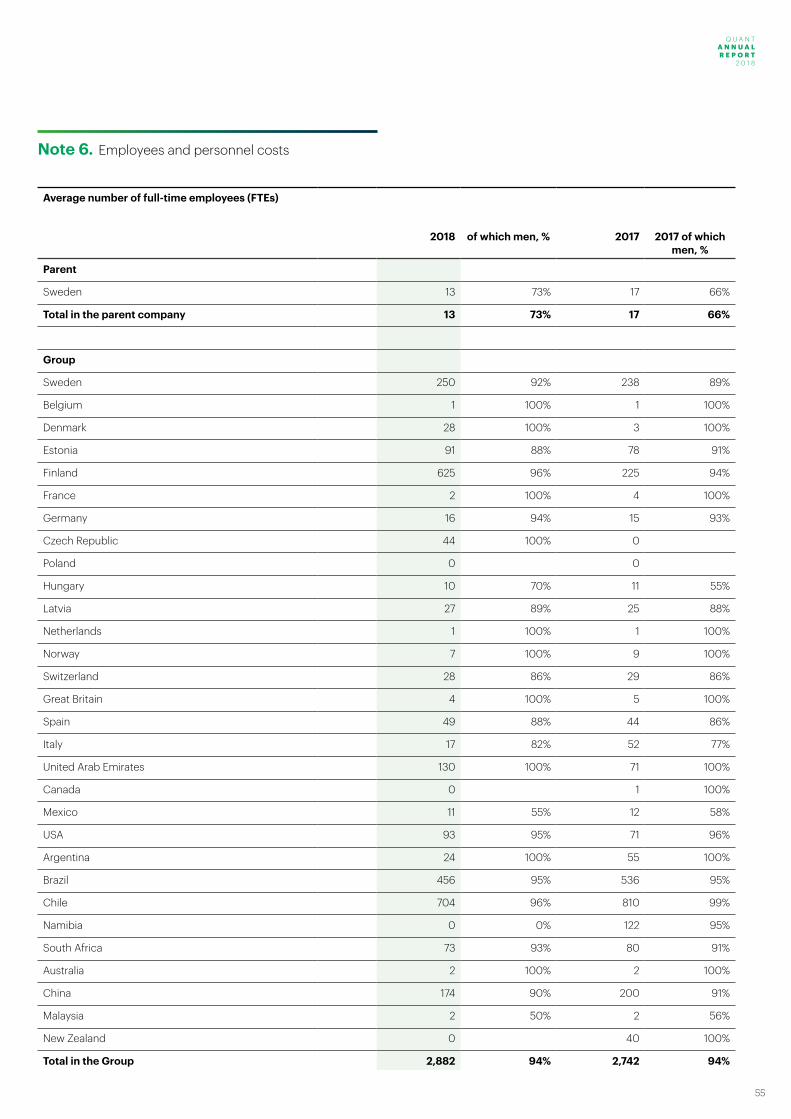
Q U A N T A N N U A L R E P O R T 2 0 1 8
Q U A N T A N N U A L R E P O R T
2 0 1 8
55
Note 6. Employees and personnel costs
Average number of full-time employees (FTEs)
2018 of which men, % 2017 2017 of which men, %
Parent
Sweden 13 73% 17 66%
Total in the parent company 13 73% 17 66%
Group
Sweden 250 92% 238 89%
Belgium 1 100% 1 100%
Denmark 28 100% 3 100%
Estonia 91 88% 78 91%
Finland 625 96% 225 94%
France 2 100% 4 100%
Germany 16 94% 15 93%
Czech Republic 44 100% 0
Poland 0 0
Hungary 10 70% 11 55%
Latvia 27 89% 25 88%
Netherlands 1 100% 1 100%
Norway 7 100% 9 100%
Switzerland 28 86% 29 86%
Great Britain 4 100% 5 100%
Spain 49 88% 44 86%
Italy 17 82% 52 77%
United Arab Emirates 130 100% 71 100%
Canada 0 1 100%
Mexico 11 55% 12 58%
USA 93 95% 71 96%
Argentina 24 100% 55 100%
Brazil 456 95% 536 95%
Chile 704 96% 810 99%
Namibia 0 0% 122 95%
South Africa 73 93% 80 91%
Australia 2 100% 2 100%
China 174 90% 200 91%
Malaysia 2 50% 2 56%
New Zealand 0 40 100%
Total in the Group 2,882 94% 2,742 94%
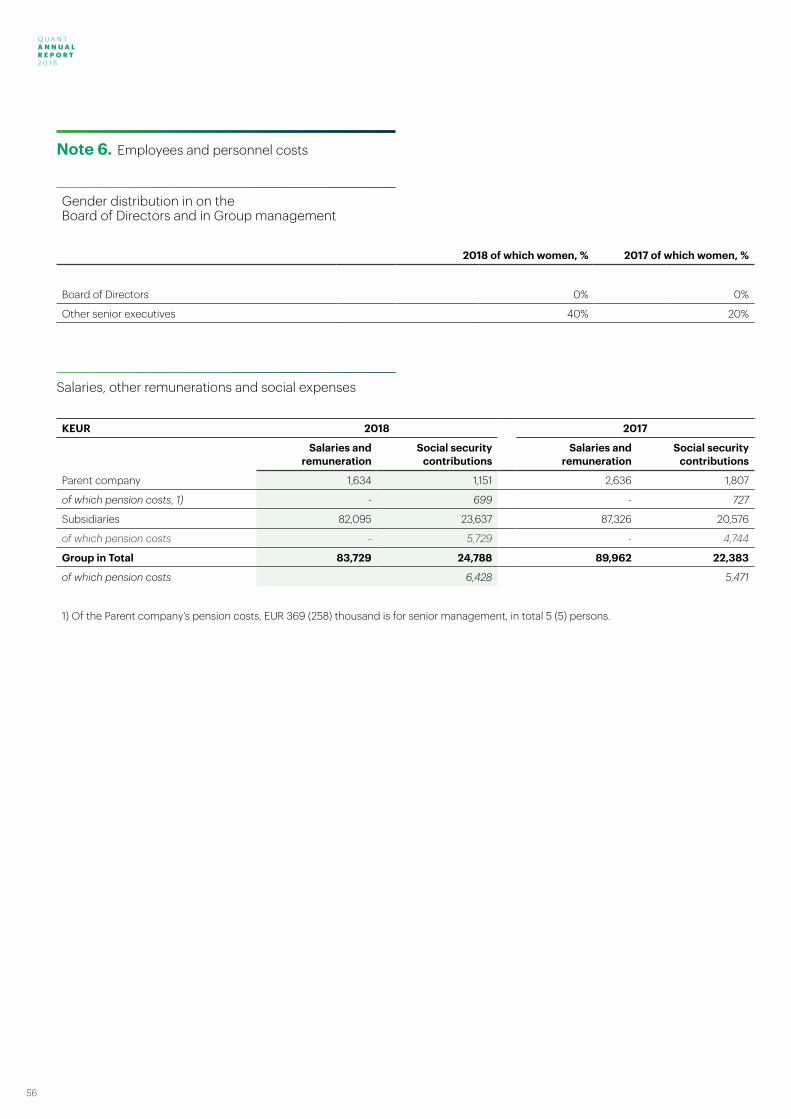
Q U A N T A N N U A L R E P O R T 2 0 1 8
56
Note 6. Employees and personnel costs
Gender distribution in on the Board of Directors and in Group management
2018 of which women, % 2017 of which women, %
Board of Directors 0% 0%
Other senior executives 40% 20%
KEUR 2018 2017
Salaries and remuneration
Social security contributions
Salaries and remuneration
Social security contributions
Parent company 1,634 1,151 2,636 1,807
of which pension costs, 1) - 699 - 727
Subsidiaries 82,095 23,637 87,326 20,576
of which pension costs - 5,729 - 4,744
Group in Total 83,729 24,788 89,962 22,383
of which pension costs 6,428 5,471
1) Of the Parent company’s pension costs, EUR 369 (258) thousand is for senior management, in total 5 (5) persons.
Salaries, other remunerations and social expenses
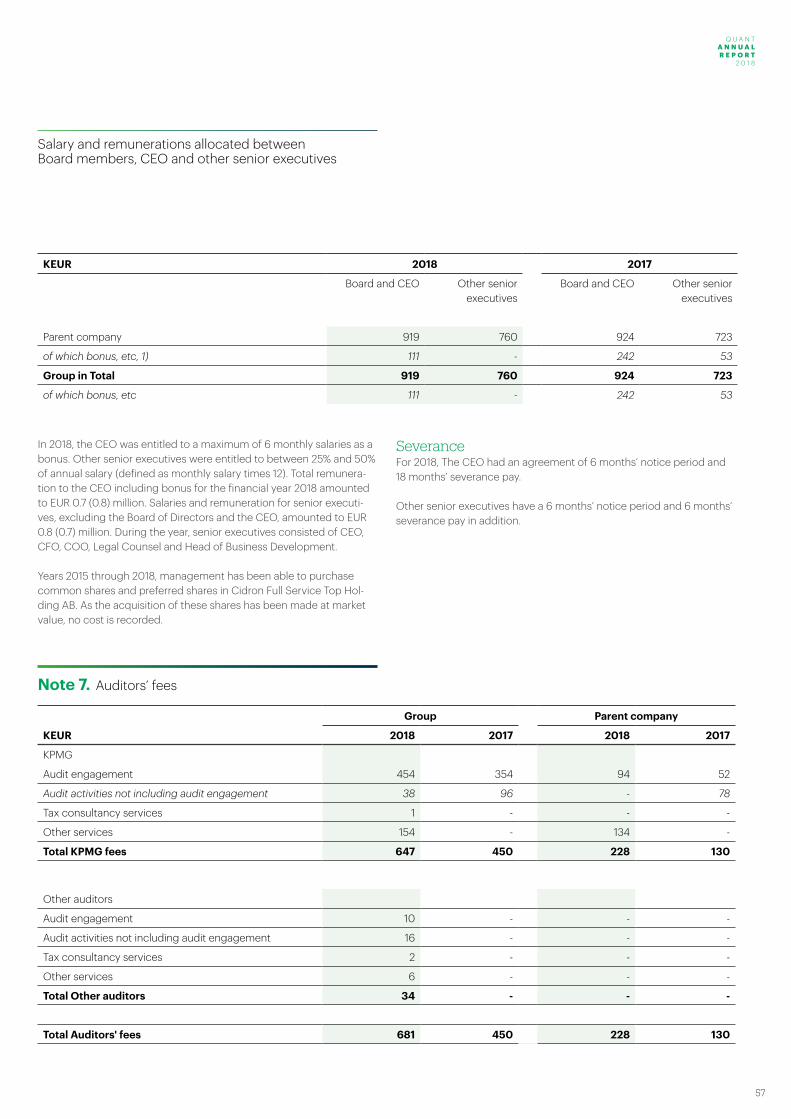
Q U A N T A N N U A L R E P O R T 2 0 1 8
Q U A N T A N N U A L R E P O R T
2 0 1 8
57
Gender distribution in on the Board of Directors and in Group management
2018 of which women, % 2017 of which women, %
Board of Directors 0% 0%
Other senior executives 40% 20%
KEUR 2018 2017
Board and CEO Other senior executives
Board and CEO Other senior executives
Parent company 919 760 924 723
of which bonus, etc, 1) 111 - 242 53
Group in Total 919 760 924 723
of which bonus, etc 111 - 242 53
In 2018, the CEO was entitled to a maximum of 6 monthly salaries as a bonus. Other senior executives were entitled to between 25% and 50% of annual salary (defined as monthly salary times 12). Total remunera-tion to the CEO including bonus for the financial year 2018 amounted to EUR 0.7 (0.8) million. Salaries and remuneration for senior executi-ves, excluding the Board of Directors and the CEO, amounted to EUR 0.8 (0.7) million. During the year, senior executives consisted of CEO, CFO, COO, Legal Counsel and Head of Business Development.
Years 2015 through 2018, management has been able to purchase common shares and preferred shares in Cidron Full Service Top Hol-ding AB. As the acquisition of these shares has been made at market value, no cost is recorded.
SeveranceFor 2018, The CEO had an agreement of 6 months’ notice period and 18 months’ severance pay.
Other senior executives have a 6 months’ notice period and 6 months’ severance pay in addition.
Note 7. Auditors’ fees
Group Parent company
KEUR 2018 2017 2018 2017
KPMG
Audit engagement 454 354 94 52
Audit activities not including audit engagement 38 96 - 78
Tax consultancy services 1 - - -
Other services 154 - 134 -
Total KPMG fees 647 450 228 130
Other auditors
Audit engagement 10 - - -
Audit activities not including audit engagement 16 - - -
Tax consultancy services 2 - - -
Other services 6 - - -
Total Other auditors 34 - - -
Total Auditors' fees 681 450 228 130
Salary and remunerations allocated between Board members, CEO and other senior executives
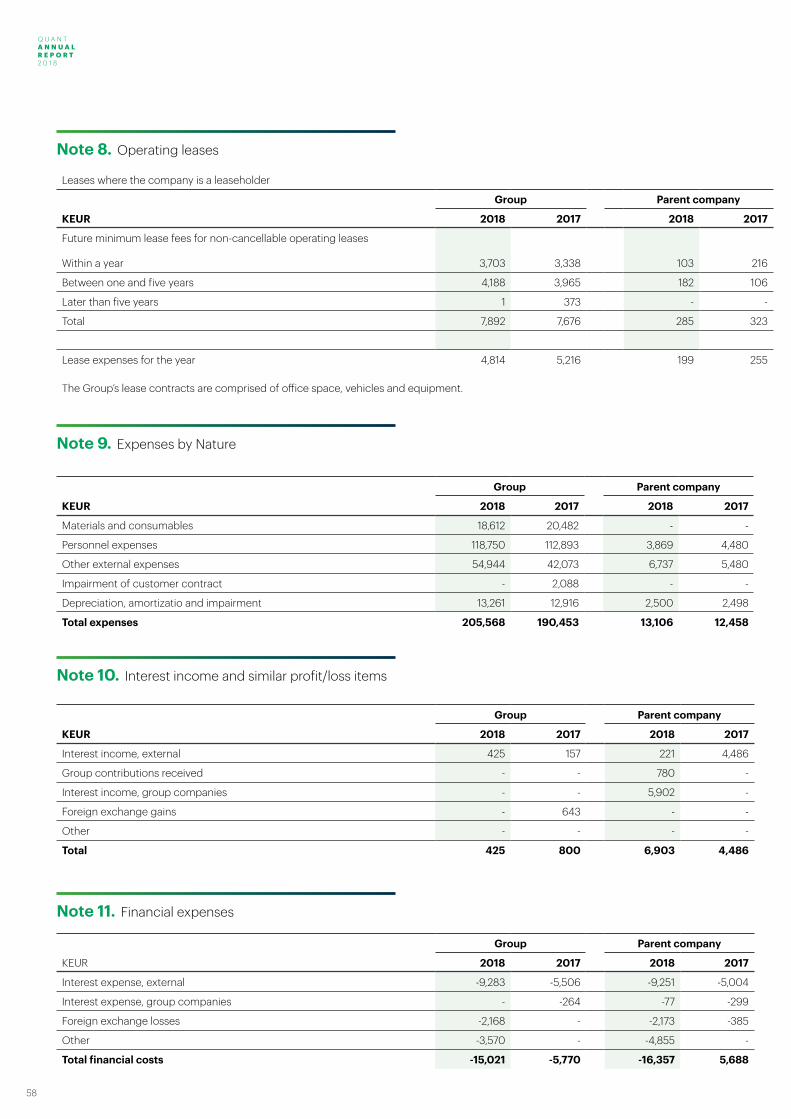
Q U A N T A N N U A L R E P O R T 2 0 1 8
58
Note 8. Operating leases
Leases where the company is a leaseholder
Group Parent company
KEUR 2018 2017 2018 2017
Future minimum lease fees for non-cancellable operating leases
Within a year 3,703 3,338 103 216
Between one and five years 4,188 3,965 182 106
Later than five years 1 373 - -
Total 7,892 7,676 285 323
Lease expenses for the year 4,814 5,216 199 255
The Group’s lease contracts are comprised of office space, vehicles and equipment.
Note 9. Expenses by Nature
Group Parent company
KEUR 2018 2017 2018 2017
Materials and consumables 18,612 20,482 - -
Personnel expenses 118,750 112,893 3,869 4,480
Other external expenses 54,944 42,073 6,737 5,480
Impairment of customer contract - 2,088 - -
Depreciation, amortizatio and impairment 13,261 12,916 2,500 2,498
Total expenses 205,568 190,453 13,106 12,458
Note 10. Interest income and similar profit/loss items
Group Parent company
KEUR 2018 2017 2018 2017
Interest income, external 425 157 221 4,486
Group contributions received - - 780 -
Interest income, group companies - - 5,902 -
Foreign exchange gains - 643 - -
Other - - - -
Total 425 800 6,903 4,486
Note 11. Financial expenses
Group Parent company
KEUR 2018 2017 2018 2017
Interest expense, external -9,283 -5,506 -9,251 -5,004
Interest expense, group companies - -264 -77 -299
Foreign exchange losses -2,168 - -2,173 -385
Other -3,570 - -4,855 -
Total financial costs -15,021 -5,770 -16,357 5,688
Q U A N T A N N U A L R E P O R T 2 0 1 8
Q U A N T A N N U A L R E P O R T
2 0 1 8
59
Note 12. Taxes
Group Parent company
KEUR 2018 2017 2018 2017
Current tax -2,000 234 - -29
Current tax attributable to previous year -115 - - -
Deferred tax 2,356 1,260 - -
Total taxes 241 1,494 - -29
Reconciliation of effective tax
Group
KEUR 2018% 2018 2017% 2017
Profit before tax -21,792 -10,889
Tax according to applicable tax rates for the parent 22% 4,794 22% 2,396
Effect of other tax rates on foreign subsidiaries 1% 253 -4% -390
Non-deductible costs -7% -1,482 -8% -827
Non-taxable income 4% 979 0% 23
Non-income related taxes 0% -7 - -
Increase in tax loss carryforwards without corresponding capitalization of deferred tax
-20% -4,426 0% -10
Utilization of tax loss carryf orwards not previously recognized 0% 8 - -
Tax attributable to previous years 1% 122 3% 302
Reported effective tax 1% 241 13.7% 1,494
Parent company
KEUR 2018% 2018 2017% 2017
Profit before tax -6,614 1,958
Tax according to applicable tax rates for the parent 22% 1,455 22% -431
Non-deductible costs -4% -287 13% -254
Increase in tax loss carryforwards without corresponding capitalization of deferred tax
-18% -1,168 - -
Utilization of tax loss carryforwards not previously recognized - - -34% 656
Reported effective tax 0% - 15 -29
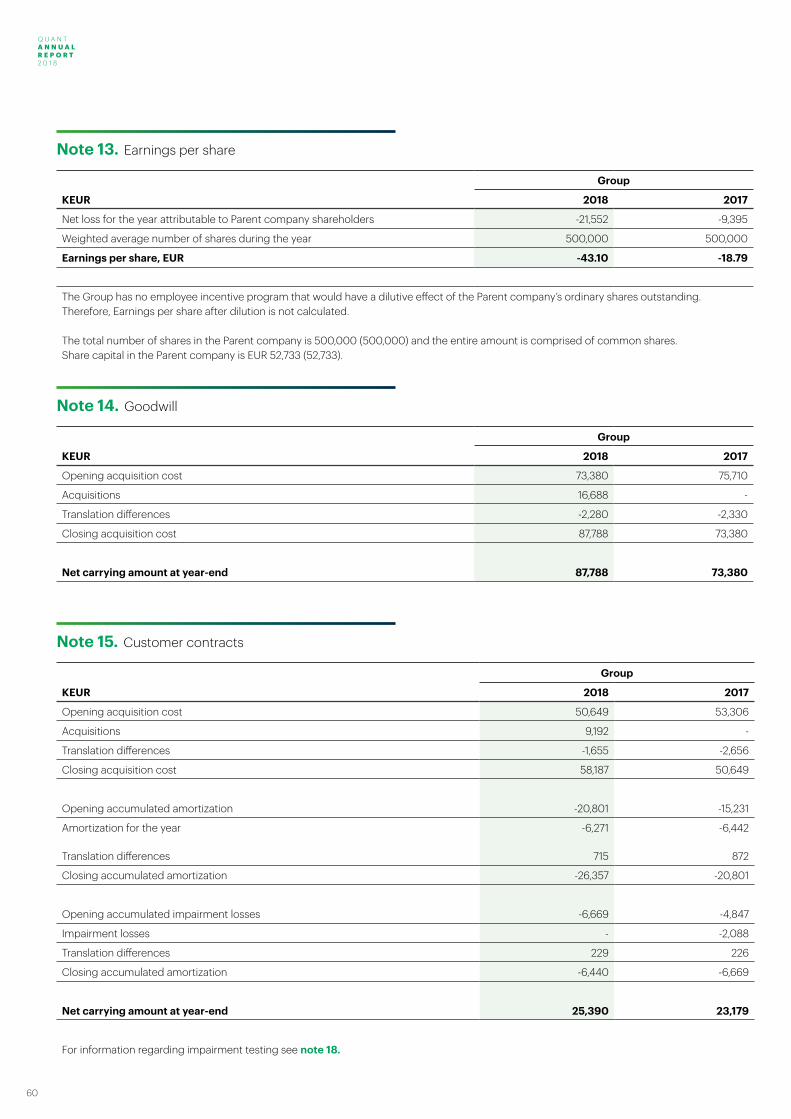
Q U A N T A N N U A L R E P O R T 2 0 1 8
60
Note 13. Earnings per share
Group
KEUR 2018 2017
Net loss for the year attributable to Parent company shareholders -21,552 -9,395
Weighted average number of shares during the year 500,000 500,000
Earnings per share, EUR -43.10 -18.79
The Group has no employee incentive program that would have a dilutive effect of the Parent company’s ordinary shares outstanding. Therefore, Earnings per share after dilution is not calculated.
The total number of shares in the Parent company is 500,000 (500,000) and the entire amount is comprised of common shares. Share capital in the Parent company is EUR 52,733 (52,733).
Note 14. Goodwill
Group
KEUR 2018 2017
Opening acquisition cost 73,380 75,710
Acquisitions 16,688 -
Translation differences -2,280 -2,330
Closing acquisition cost 87,788 73,380
Net carrying amount at year-end 87,788 73,380
Note 15. Customer contracts
Group
KEUR 2018 2017
Opening acquisition cost 50,649 53,306
Acquisitions 9,192 -
Translation differences -1,655 -2,656
Closing acquisition cost 58,187 50,649
Opening accumulated amortization -20,801 -15,231
Amortization for the year -6,271 -6,442
Translation differences 715 872
Closing accumulated amortization -26,357 -20,801
Opening accumulated impairment losses -6,669 -4,847
Impairment losses - -2,088
Translation differences 229 226
Closing accumulated amortization -6,440 -6,669
Net carrying amount at year-end 25,390 23,179
For information regarding impairment testing see note 18.
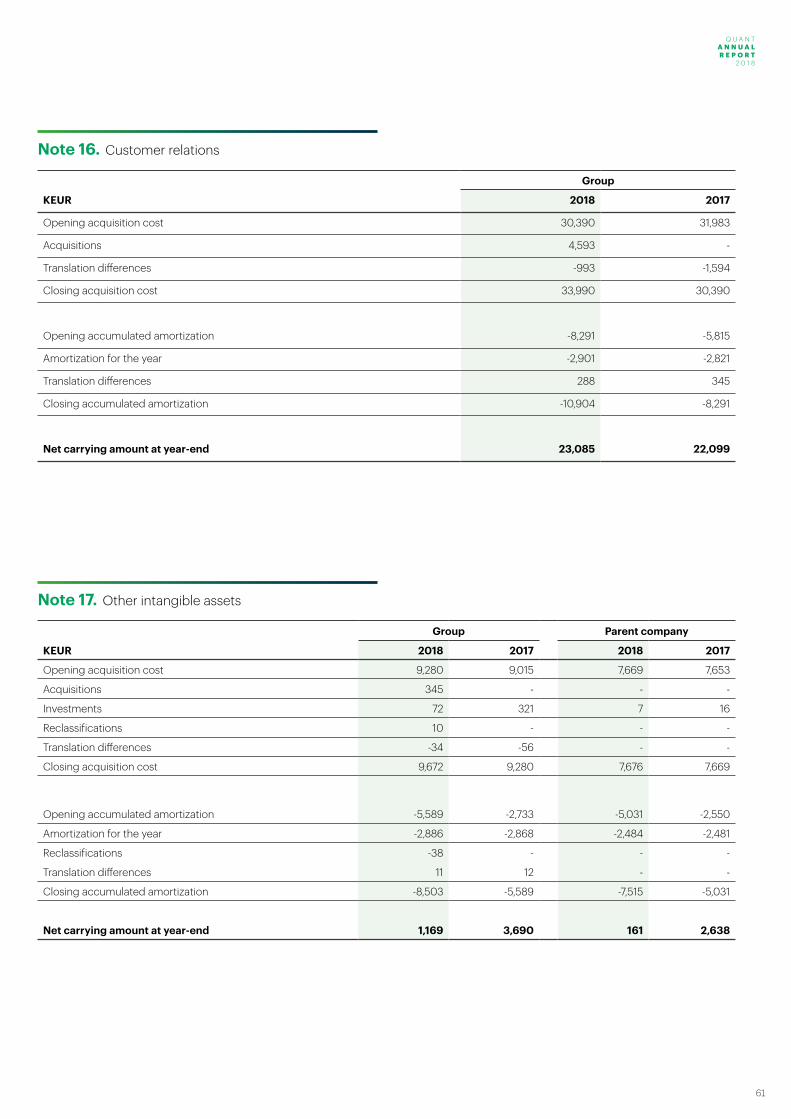
Q U A N T A N N U A L R E P O R T 2 0 1 8
Q U A N T A N N U A L R E P O R T
2 0 1 8
61
Note 16. Customer relations
Group
KEUR 2018 2017
Opening acquisition cost 30,390 31,983
Acquisitions 4,593 -
Translation differences -993 -1,594
Closing acquisition cost 33,990 30,390
Opening accumulated amortization -8,291 -5,815
Amortization for the year -2,901 -2,821
Translation differences 288 345
Closing accumulated amortization -10,904 -8,291
Net carrying amount at year-end 23,085 22,099
Note 17. Other intangible assets
Group Parent company
KEUR 2018 2017 2018 2017
Opening acquisition cost 9,280 9,015 7,669 7,653
Acquisitions 345 - - -
Investments 72 321 7 16
Reclassifications 10 - - -
Translation differences -34 -56 - -
Closing acquisition cost 9,672 9,280 7,676 7,669
Opening accumulated amortization -5,589 -2,733 -5,031 -2,550
Amortization for the year -2,886 -2,868 -2,484 -2,481
Reclassifications -38 - - -
Translation differences 11 12 - -
Closing accumulated amortization -8,503 -5,589 -7,515 -5,031
Net carrying amount at year-end 1,169 3,690 161 2,638
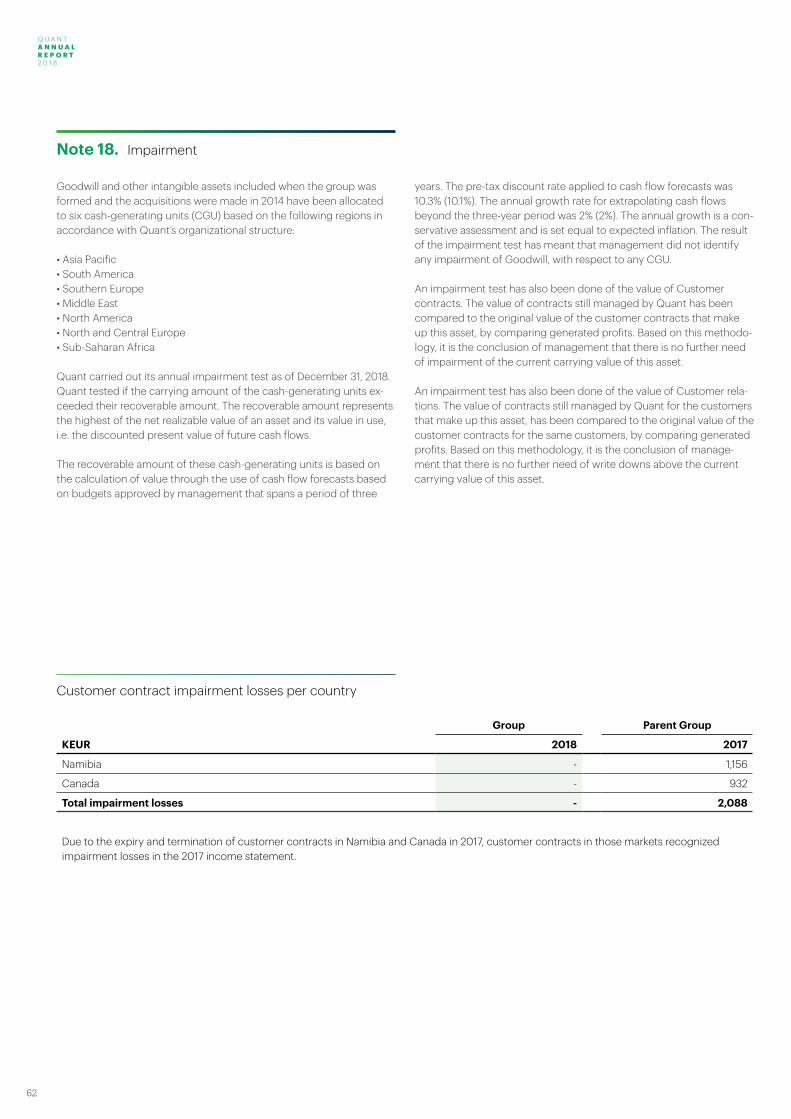
Q U A N T A N N U A L R E P O R T 2 0 1 8
62
Customer contract impairment losses per country
Group Parent Group
KEUR 2018 2017
Namibia - 1,156
Canada - 932
Total impairment losses - 2,088
Due to the expiry and termination of customer contracts in Namibia and Canada in 2017, customer contracts in those markets recognized impairment losses in the 2017 income statement.
Goodwill and other intangible assets included when the group was formed and the acquisitions were made in 2014 have been allocated to six cash-generating units (CGU) based on the following regions in accordance with Quant’s organizational structure:
• Asia Pacific • South America• Southern Europe• Middle East • North America• North and Central Europe• Sub-Saharan Africa
Quant carried out its annual impairment test as of December 31, 2018. Quant tested if the carrying amount of the cash-generating units ex-ceeded their recoverable amount. The recoverable amount represents the highest of the net realizable value of an asset and its value in use, i.e. the discounted present value of future cash flows.
The recoverable amount of these cash-generating units is based on the calculation of value through the use of cash flow forecasts based on budgets approved by management that spans a period of three
years. The pre-tax discount rate applied to cash flow forecasts was 10.3% (10.1%). The annual growth rate for extrapolating cash flows beyond the three-year period was 2% (2%). The annual growth is a con-servative assessment and is set equal to expected inflation. The result of the impairment test has meant that management did not identify any impairment of Goodwill, with respect to any CGU.
An impairment test has also been done of the value of Customer contracts. The value of contracts still managed by Quant has been compared to the original value of the customer contracts that make up this asset, by comparing generated profits. Based on this methodo-logy, it is the conclusion of management that there is no further need of impairment of the current carrying value of this asset.
An impairment test has also been done of the value of Customer rela-tions. The value of contracts still managed by Quant for the customers that make up this asset, has been compared to the original value of the customer contracts for the same customers, by comparing generated profits. Based on this methodology, it is the conclusion of manage-ment that there is no further need of write downs above the current carrying value of this asset.
Note 18. Impairment
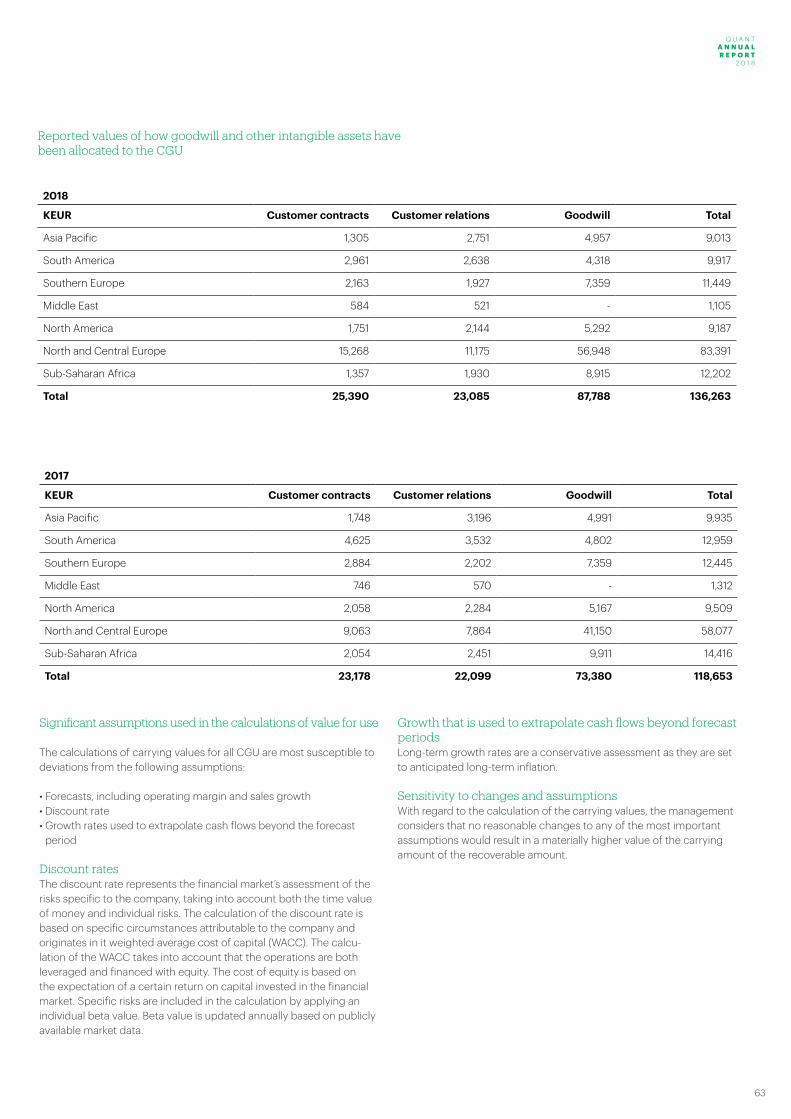
Q U A N T A N N U A L R E P O R T 2 0 1 8
Q U A N T A N N U A L R E P O R T
2 0 1 8
63
Reported values of how goodwill and other intangible assets have been allocated to the CGU
2018
KEUR Customer contracts Customer relations Goodwill Total
Asia Pacific 1,305 2,751 4,957 9,013
South America 2,961 2,638 4,318 9,917
Southern Europe 2,163 1,927 7,359 11,449
Middle East 584 521 - 1,105
North America 1,751 2,144 5,292 9,187
North and Central Europe 15,268 11,175 56,948 83,391
Sub-Saharan Africa 1,357 1,930 8,915 12,202
Total 25,390 23,085 87,788 136,263
2017
KEUR Customer contracts Customer relations Goodwill Total
Asia Pacific 1,748 3,196 4,991 9,935
South America 4,625 3,532 4,802 12,959
Southern Europe 2,884 2,202 7,359 12,445
Middle East 746 570 - 1,312
North America 2,058 2,284 5,167 9,509
North and Central Europe 9,063 7,864 41,150 58,077
Sub-Saharan Africa 2,054 2,451 9,911 14,416
Total 23,178 22,099 73,380 118,653
Significant assumptions used in the calculations of value for use
The calculations of carrying values for all CGU are most susceptible to deviations from the following assumptions:
• Forecasts, including operating margin and sales growth• Discount rate• Growth rates used to extrapolate cash flows beyond the forecast
period
Discount ratesThe discount rate represents the financial market’s assessment of the risks specific to the company, taking into account both the time value of money and individual risks. The calculation of the discount rate is based on specific circumstances attributable to the company and originates in it weighted average cost of capital (WACC). The calcu-lation of the WACC takes into account that the operations are both leveraged and financed with equity. The cost of equity is based on the expectation of a certain return on capital invested in the financial market. Specific risks are included in the calculation by applying an individual beta value. Beta value is updated annually based on publicly available market data.
Growth that is used to extrapolate cash flows beyond forecast periodsLong-term growth rates are a conservative assessment as they are set to anticipated long-term inflation.
Sensitivity to changes and assumptionsWith regard to the calculation of the carrying values, the management considers that no reasonable changes to any of the most important assumptions would result in a materially higher value of the carrying amount of the recoverable amount.
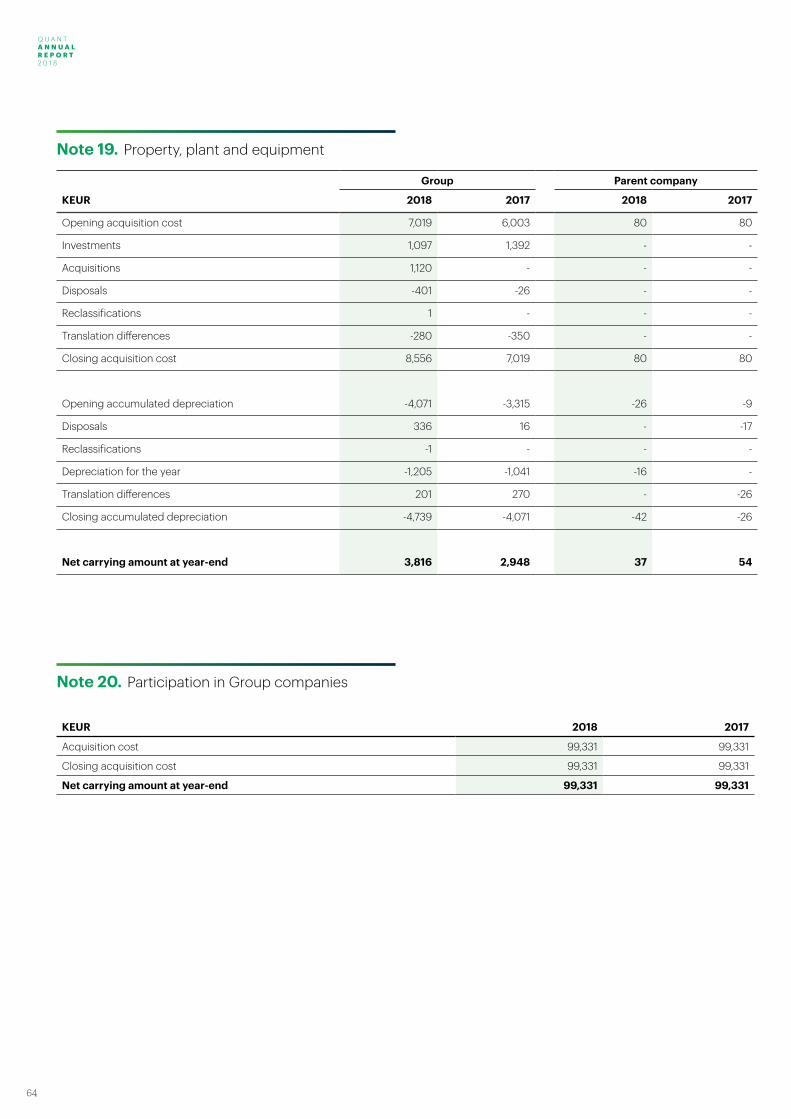
Q U A N T A N N U A L R E P O R T 2 0 1 8
64
Note 19. Property, plant and equipment
Group Parent company
KEUR 2018 2017 2018 2017
Opening acquisition cost 7,019 6,003 80 80
Investments 1,097 1,392 - -
Acquisitions 1,120 - - -
Disposals -401 -26 - -
Reclassifications 1 - - -
Translation differences -280 -350 - -
Closing acquisition cost 8,556 7,019 80 80
Opening accumulated depreciation -4,071 -3,315 -26 -9
Disposals 336 16 - -17
Reclassifications -1 - - -
Depreciation for the year -1,205 -1,041 -16 -
Translation differences 201 270 - -26
Closing accumulated depreciation -4,739 -4,071 -42 -26
Net carrying amount at year-end 3,816 2,948 37 54
KEUR 2018 2017
Acquisition cost 99,331 99,331
Closing acquisition cost 99,331 99,331
Net carrying amount at year-end 99,331 99,331
Note 20. Participation in Group companies
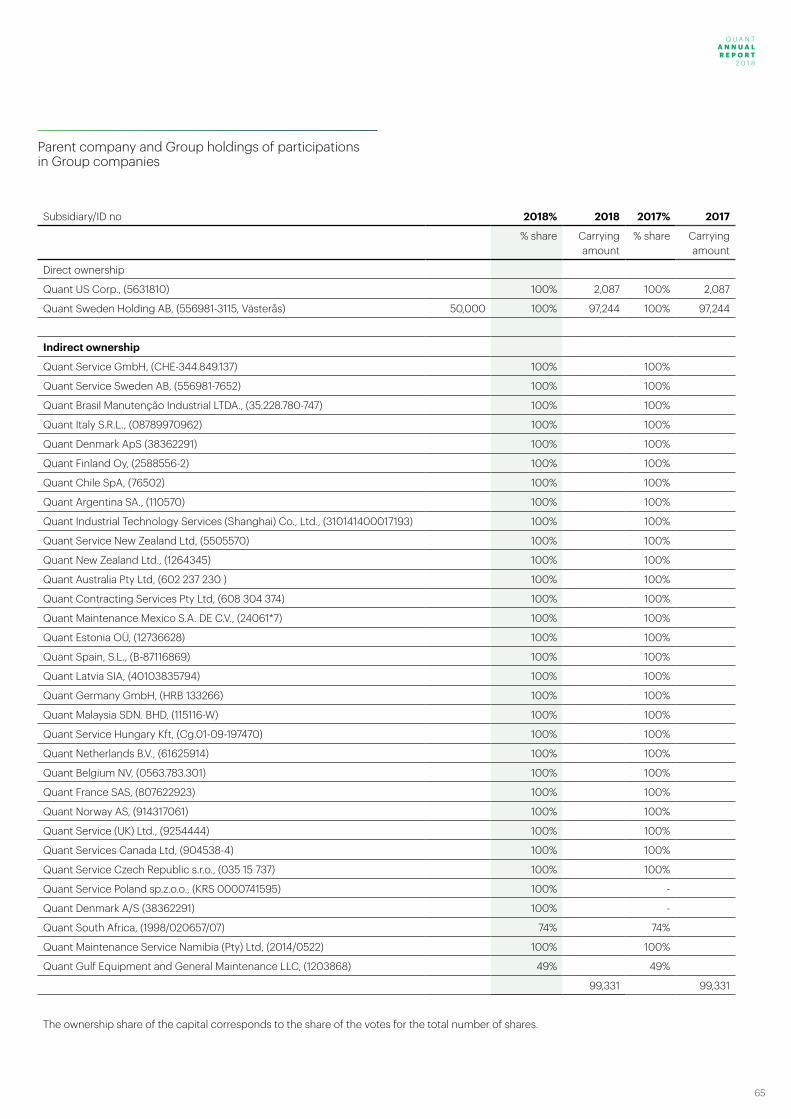
Q U A N T A N N U A L R E P O R T 2 0 1 8
Q U A N T A N N U A L R E P O R T
2 0 1 8
65
Parent company and Group holdings of participations in Group companies
Subsidiary/ID no 2018% 2018 2017% 2017
% share Carrying amount
% share Carrying amount
Direct ownership
Quant US Corp., (5631810) 100% 2,087 100% 2,087
Quant Sweden Holding AB, (556981-3115, Västerås) 50,000 100% 97,244 100% 97,244
Indirect ownership
Quant Service GmbH, (CHE-344.849.137) 100% 100%
Quant Service Sweden AB, (556981-7652) 100% 100%
Quant Brasil Manutenção Industrial LTDA., (35.228.780-747) 100% 100%
Quant Italy S.R.L., (08789970962) 100% 100%
Quant Denmark ApS (38362291) 100% 100%
Quant Finland Oy, (2588556-2) 100% 100%
Quant Chile SpA, (76502) 100% 100%
Quant Argentina SA., (110570) 100% 100%
Quant Industrial Technology Services (Shanghai) Co., Ltd., (310141400017193) 100% 100%
Quant Service New Zealand Ltd, (5505570) 100% 100%
Quant New Zealand Ltd., (1264345) 100% 100%
Quant Australia Pty Ltd, (602 237 230 ) 100% 100%
Quant Contracting Services Pty Ltd, (608 304 374) 100% 100%
Quant Maintenance Mexico S.A. DE C.V., (24061*7) 100% 100%
Quant Estonia OÜ, (12736628) 100% 100%
Quant Spain, S.L., (B-87116869) 100% 100%
Quant Latvia SIA, (40103835794) 100% 100%
Quant Germany GmbH, (HRB 133266) 100% 100%
Quant Malaysia SDN. BHD, (115116-W) 100% 100%
Quant Service Hungary Kft, (Cg.01-09-197470) 100% 100%
Quant Netherlands B.V., (61625914) 100% 100%
Quant Belgium NV, (0563.783.301) 100% 100%
Quant France SAS, (807622923) 100% 100%
Quant Norway AS, (914317061) 100% 100%
Quant Service (UK) Ltd., (9254444) 100% 100%
Quant Services Canada Ltd, (904538-4) 100% 100%
Quant Service Czech Republic s.r.o., (035 15 737) 100% 100%
Quant Service Poland sp.z.o.o., (KRS 0000741595) 100% -
Quant Denmark A/S (38362291) 100% -
Quant South Africa, (1998/020657/07) 74% 74%
Quant Maintenance Service Namibia (Pty) Ltd, (2014/0522) 100% 100%
Quant Gulf Equipment and General Maintenance LLC, (1203868) 49% 49%
99,331 99,331
The ownership share of the capital corresponds to the share of the votes for the total number of shares.
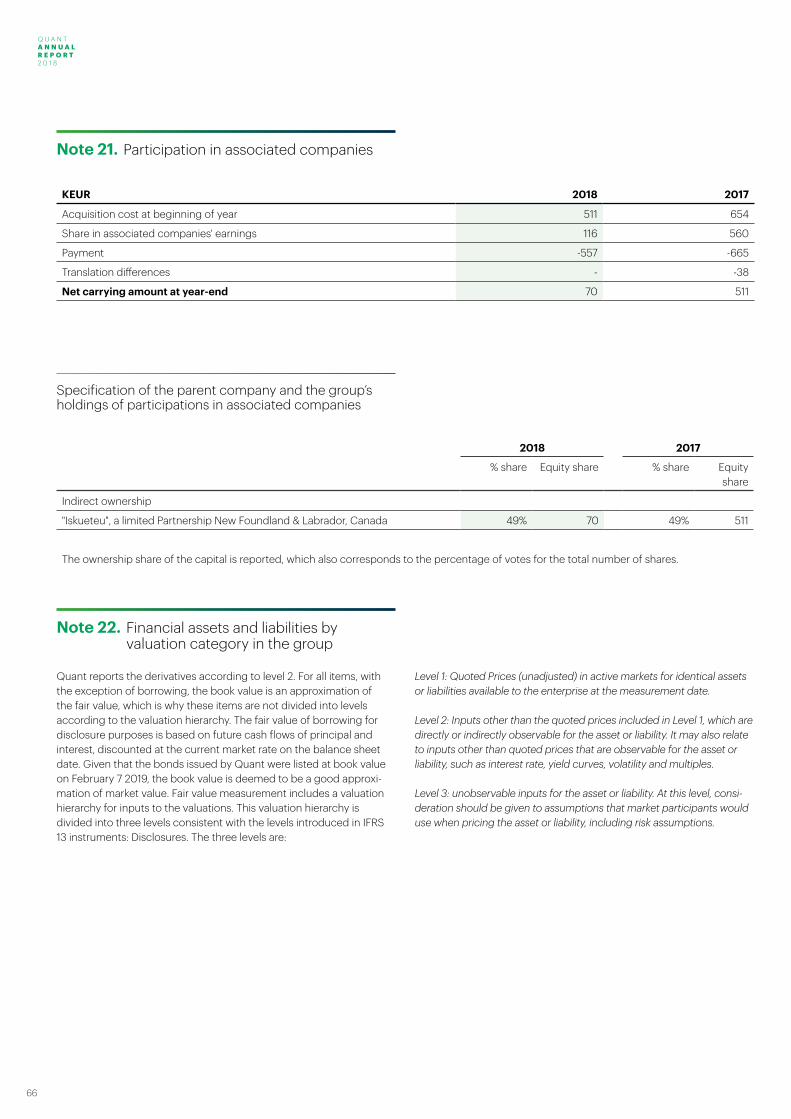
Q U A N T A N N U A L R E P O R T 2 0 1 8
66
KEUR 2018 2017
Acquisition cost at beginning of year 511 654
Share in associated companies' earnings 116 560
Payment -557 -665
Translation differences - -38
Net carrying amount at year-end 70 511
Note 21. Participation in associated companies
Specification of the parent company and the group’s holdings of participations in associated companies
Note 22. Financial assets and liabilities by valuation category in the group
Quant reports the derivatives according to level 2. For all items, with the exception of borrowing, the book value is an approximation of the fair value, which is why these items are not divided into levels according to the valuation hierarchy. The fair value of borrowing for disclosure purposes is based on future cash flows of principal and interest, discounted at the current market rate on the balance sheet date. Given that the bonds issued by Quant were listed at book value on February 7 2019, the book value is deemed to be a good approxi-mation of market value. Fair value measurement includes a valuation hierarchy for inputs to the valuations. This valuation hierarchy is divided into three levels consistent with the levels introduced in IFRS 13 instruments: Disclosures. The three levels are:
Level 1: Quoted Prices (unadjusted) in active markets for identical assets or liabilities available to the enterprise at the measurement date.
Level 2: Inputs other than the quoted prices included in Level 1, which are directly or indirectly observable for the asset or liability. It may also relate to inputs other than quoted prices that are observable for the asset or liability, such as interest rate, yield curves, volatility and multiples.
Level 3: unobservable inputs for the asset or liability. At this level, consi-deration should be given to assumptions that market participants would use when pricing the asset or liability, including risk assumptions.
2018 2017
% share Equity share % share Equity share
Indirect ownership
"Iskueteu", a limited Partnership New Foundland & Labrador, Canada 49% 70 49% 511
The ownership share of the capital is reported, which also corresponds to the percentage of votes for the total number of shares.
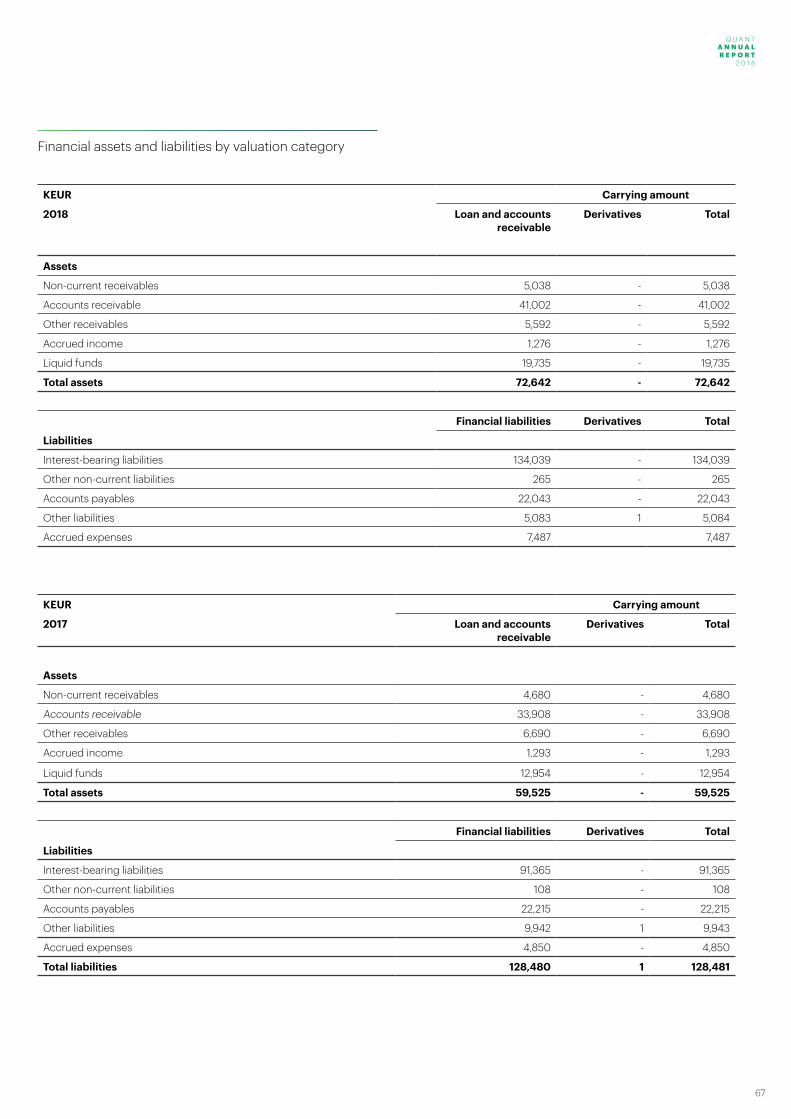
Q U A N T A N N U A L R E P O R T 2 0 1 8
Q U A N T A N N U A L R E P O R T
2 0 1 8
67
KEUR Carrying amount
2018 Loan and accounts receivable
Derivatives Total
Assets
Non-current receivables 5,038 - 5,038
Accounts receivable 41,002 - 41,002
Other receivables 5,592 - 5,592
Accrued income 1,276 - 1,276
Liquid funds 19,735 - 19,735
Total assets 72,642 - 72,642
Financial liabilities Derivatives Total
Liabilities
Interest-bearing liabilities 134,039 - 134,039
Other non-current liabilities 265 - 265
Accounts payables 22,043 - 22,043
Other liabilities 5,083 1 5,084
Accrued expenses 7,487 7,487
Financial assets and liabilities by valuation category
KEUR Carrying amount
2017 Loan and accounts receivable
Derivatives Total
Assets
Non-current receivables 4,680 - 4,680
Accounts receivable 33,908 - 33,908
Other receivables 6,690 - 6,690
Accrued income 1,293 - 1,293
Liquid funds 12,954 - 12,954
Total assets 59,525 - 59,525
Financial liabilities Derivatives Total
Liabilities
Interest-bearing liabilities 91,365 - 91,365
Other non-current liabilities 108 - 108
Accounts payables 22,215 - 22,215
Other liabilities 9,942 1 9,943
Accrued expenses 4,850 - 4,850
Total liabilities 128,480 1 128,481
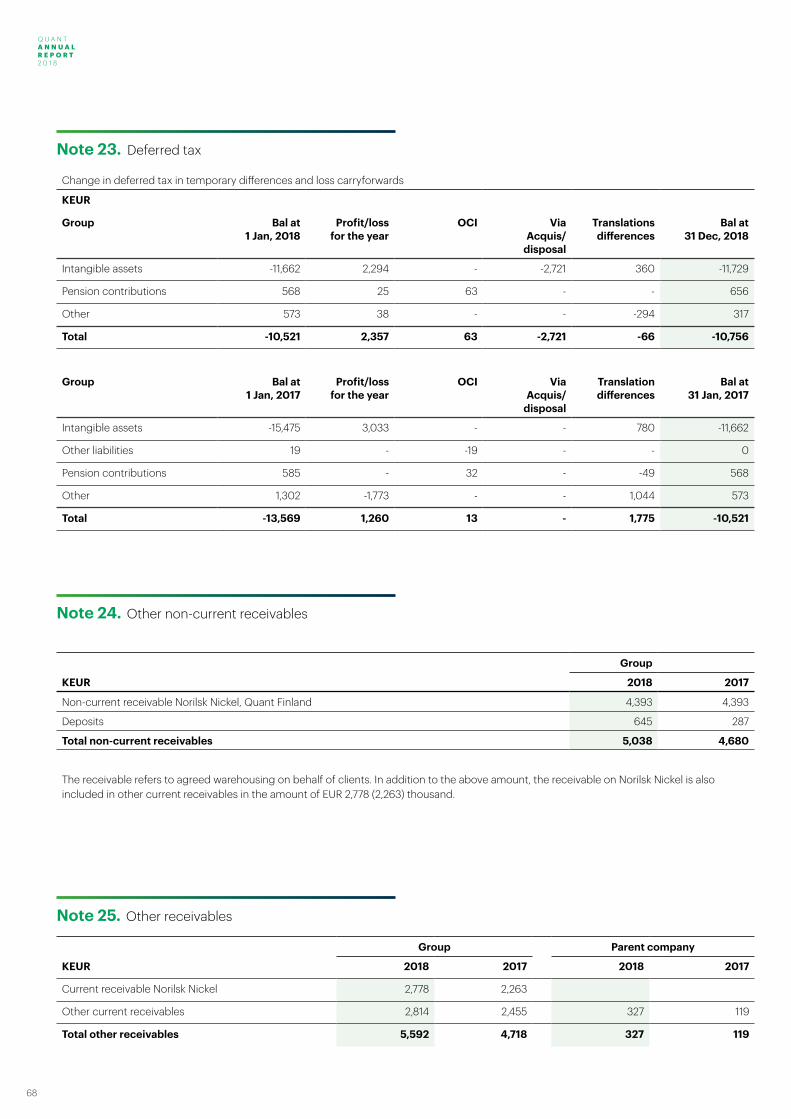
Q U A N T A N N U A L R E P O R T 2 0 1 8
68
Note 23. Deferred tax
Group
KEUR 2018 2017
Non-current receivable Norilsk Nickel, Quant Finland 4,393 4,393
Deposits 645 287
Total non-current receivables 5,038 4,680
The receivable refers to agreed warehousing on behalf of clients. In addition to the above amount, the receivable on Norilsk Nickel is also included in other current receivables in the amount of EUR 2,778 (2,263) thousand.
Note 24. Other non-current receivables
Note 25. Other receivables
Group Parent company
KEUR 2018 2017 2018 2017
Current receivable Norilsk Nickel 2,778 2,263
Other current receivables 2,814 2,455 327 119
Total other receivables 5,592 4,718 327 119
Change in deferred tax in temporary differences and loss carryforwards
KEUR
Group Bal at 1 Jan, 2018
Profit/lossfor the year
OCI ViaAcquis/
disposal
Translations differences
Bal at 31 Dec, 2018
Intangible assets -11,662 2,294 - -2,721 360 -11,729
Pension contributions 568 25 63 - - 656
Other 573 38 - - -294 317
Total -10,521 2,357 63 -2,721 -66 -10,756
Group Bal at 1 Jan, 2017
Profit/loss for the year
OCI Via Acquis/
disposal
Translation differences
Bal at 31 Jan, 2017
Intangible assets -15,475 3,033 - - 780 -11,662
Other liabilities 19 - -19 - - 0
Pension contributions 585 - 32 - -49 568
Other 1,302 -1,773 - - 1,044 573
Total -13,569 1,260 13 - 1,775 -10,521

Q U A N T A N N U A L R E P O R T 2 0 1 8
Q U A N T A N N U A L R E P O R T
2 0 1 8
69
Change in deferred tax in temporary differences and loss carryforwards
KEUR
Group Bal at 1 Jan, 2018
Profit/lossfor the year
OCI ViaAcquis/
disposal
Translations differences
Bal at 31 Dec, 2018
Intangible assets -11,662 2,294 - -2,721 360 -11,729
Pension contributions 568 25 63 - - 656
Other 573 38 - - -294 317
Total -10,521 2,357 63 -2,721 -66 -10,756
Group Bal at 1 Jan, 2017
Profit/loss for the year
OCI Via Acquis/
disposal
Translation differences
Bal at 31 Jan, 2017
Intangible assets -15,475 3,033 - - 780 -11,662
Other liabilities 19 - -19 - - 0
Pension contributions 585 - 32 - -49 568
Other 1,302 -1,773 - - 1,044 573
Total -13,569 1,260 13 - 1,775 -10,521
Note 26. Prepaid expenses and accrued income
Group Parent company
KEUR 2018 2017 2018 2017
Completed income not invoiced - 1,972 - -
Prepaid expenses 950 935 153 283
Accrued income 1,276 1,293 792 -
Total prepaid expenses and accrued income 2,226 4,200 945 283
Note 27. Cash and cash equivalents
The following subcomponents are included in cash:
Group Parent company
KEUR 2018 2017 2018 2017
Bank deposits 19,735 12,954 758 695
Total Cash and cash equivalents 19,735 12,954 758 695
KEUR 2018 2017
Provisions for Benefit Pensions Plans 2,932 2,413
Provisions for other pensions 643 265
Total provisions for pensions and similar obligations 3,575 2,677
Group defined benefit plans
Changes in the present value of the obligation for defined benefit plans
KEUR 2018 2017
Obligation for defined benefit plans as of 1 January 2,413 2,755
Paid compensation -223 -225
Cost recognized in profit for the year 294 230
Cost recognized in other comprehensive income 314 -166
Additional pensions during the year 51 -
Reclassification - -
Exchange rate differences 83 -181
Obligation for defined benefit plans as of 31 December 2,932 2,413
.
Note 28. Pensions
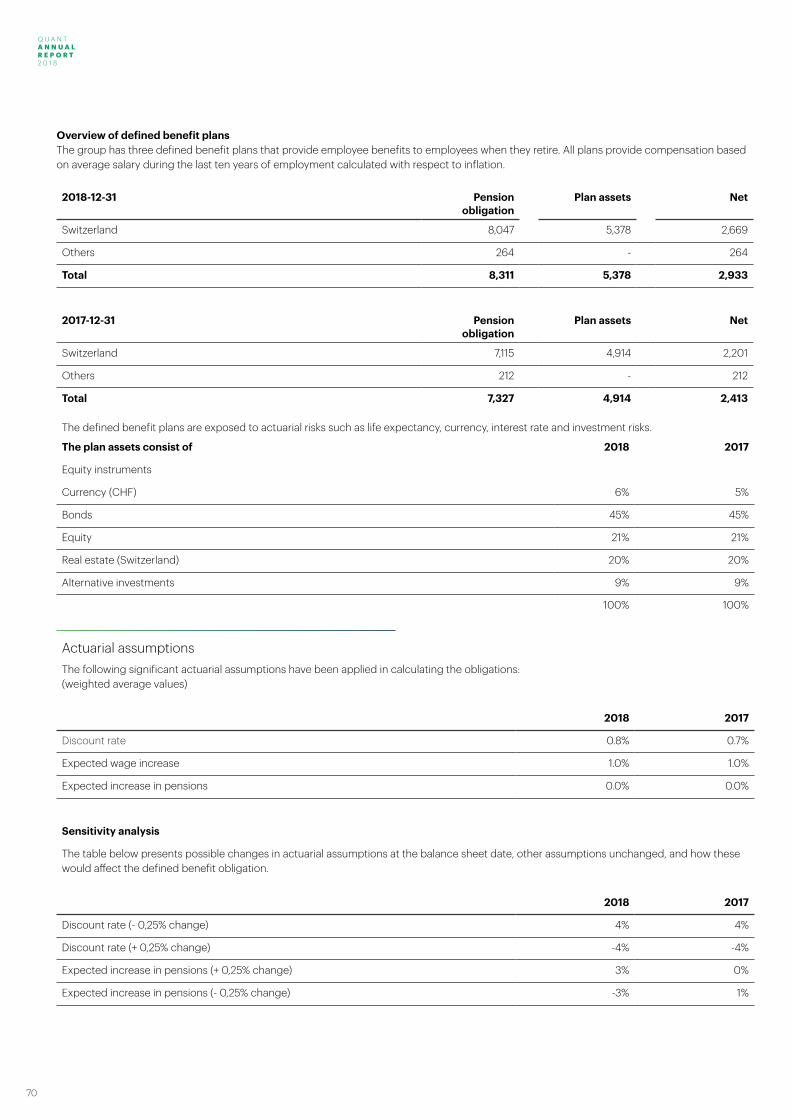
Q U A N T A N N U A L R E P O R T 2 0 1 8
70
2018-12-31 Pension obligation
Plan assets Net
Switzerland 8,047 5,378 2,669
Others 264 - 264
Total 8,311 5,378 2,933
2017-12-31 Pension obligation
Plan assets Net
Switzerland 7,115 4,914 2,201
Others 212 - 212
Total 7,327 4,914 2,413
The defined benefit plans are exposed to actuarial risks such as life expectancy, currency, interest rate and investment risks.
The plan assets consist of 2018 2017
Equity instruments
Currency (CHF) 6% 5%
Bonds 45% 45%
Equity 21% 21%
Real estate (Switzerland) 20% 20%
Alternative investments 9% 9%
100% 100%
Actuarial assumptionsThe following significant actuarial assumptions have been applied in calculating the obligations:(weighted average values)
2018 2017
Discount rate 0.8% 0.7%
Expected wage increase 1.0% 1.0%
Expected increase in pensions 0.0% 0.0%
Sensitivity analysis
The table below presents possible changes in actuarial assumptions at the balance sheet date, other assumptions unchanged, and how these would affect the defined benefit obligation.
2018 2017
Discount rate (- 0,25% change) 4% 4%
Discount rate (+ 0,25% change) -4% -4%
Expected increase in pensions (+ 0,25% change) 3% 0%
Expected increase in pensions (- 0,25% change) -3% 1%
Overview of defined benefit plans The group has three defined benefit plans that provide employee benefits to employees when they retire. All plans provide compensation based on average salary during the last ten years of employment calculated with respect to inflation.
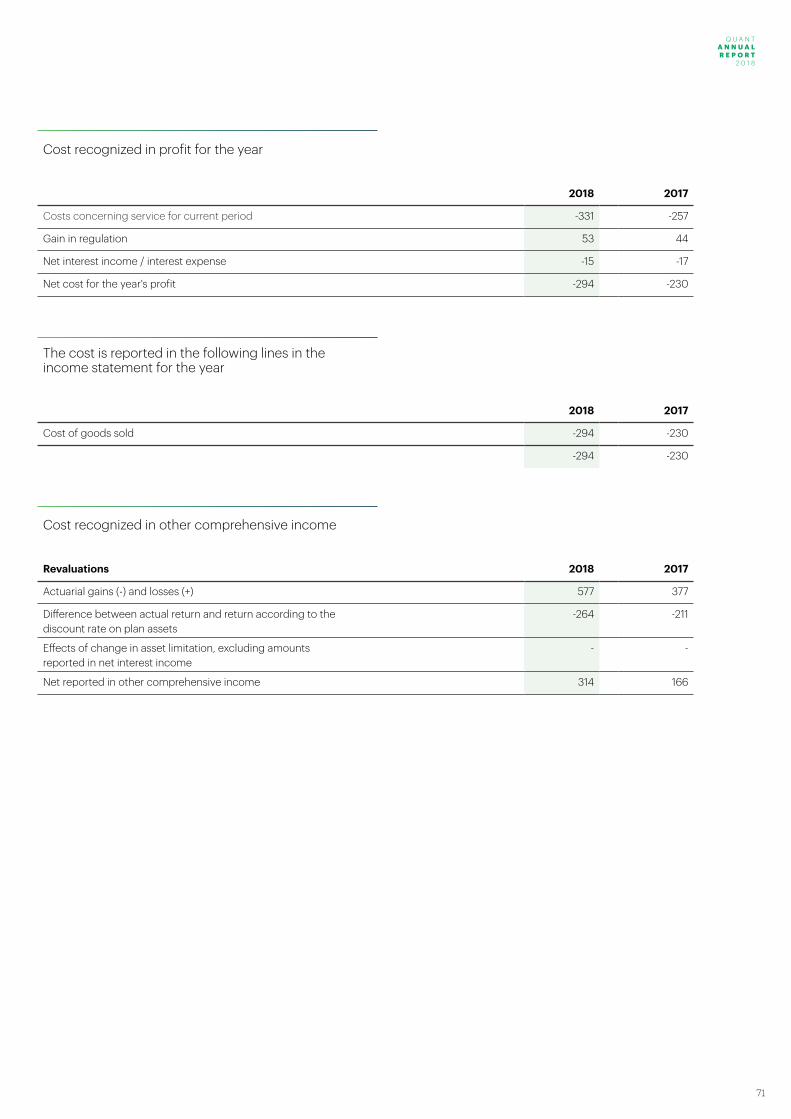
Q U A N T A N N U A L R E P O R T 2 0 1 8
Q U A N T A N N U A L R E P O R T
2 0 1 8
71
Cost recognized in profit for the year
2018 2017
Costs concerning service for current period -331 -257
Gain in regulation 53 44
Net interest income / interest expense -15 -17
Net cost for the year's profit -294 -230
The cost is reported in the following lines in the income statement for the year
2018 2017
Cost of goods sold -294 -230
-294 -230
Cost recognized in other comprehensive income
Revaluations 2018 2017
Actuarial gains (-) and losses (+) 577 377
Difference between actual return and return according to thediscount rate on plan assets
-264 -211
Effects of change in asset limitation, excluding amountsreported in net interest income
- -
Net reported in other comprehensive income 314 166
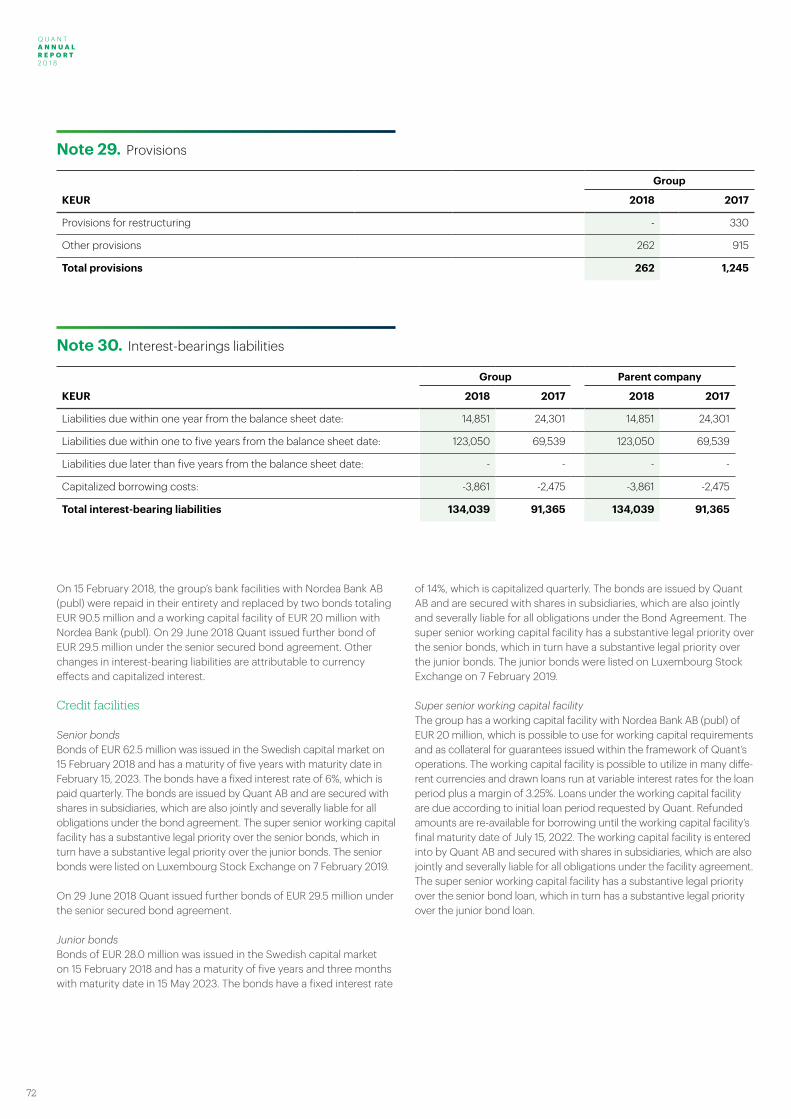
Q U A N T A N N U A L R E P O R T 2 0 1 8
72
Note 29. Provisions
Group
KEUR 2018 2017
Provisions for restructuring - 330
Other provisions 262 915
Total provisions 262 1,245
Note 30. Interest-bearings liabilities
Group Parent company
KEUR 2018 2017 2018 2017
Liabilities due within one year from the balance sheet date: 14,851 24,301 14,851 24,301
Liabilities due within one to five years from the balance sheet date: 123,050 69,539 123,050 69,539
Liabilities due later than five years from the balance sheet date: - - - -
Capitalized borrowing costs: -3,861 -2,475 -3,861 -2,475
Total interest-bearing liabilities 134,039 91,365 134,039 91,365
On 15 February 2018, the group’s bank facilities with Nordea Bank AB (publ) were repaid in their entirety and replaced by two bonds totaling EUR 90.5 million and a working capital facility of EUR 20 million with Nordea Bank (publ). On 29 June 2018 Quant issued further bond of EUR 29.5 million under the senior secured bond agreement. Other changes in interest-bearing liabilities are attributable to currency effects and capitalized interest.
Credit facilities
Senior bondsBonds of EUR 62.5 million was issued in the Swedish capital market on 15 February 2018 and has a maturity of five years with maturity date in February 15, 2023. The bonds have a fixed interest rate of 6%, which is paid quarterly. The bonds are issued by Quant AB and are secured with shares in subsidiaries, which are also jointly and severally liable for all obligations under the bond agreement. The super senior working capital facility has a substantive legal priority over the senior bonds, which in turn have a substantive legal priority over the junior bonds. The senior bonds were listed on Luxembourg Stock Exchange on 7 February 2019.
On 29 June 2018 Quant issued further bonds of EUR 29.5 million under the senior secured bond agreement.
Junior bondsBonds of EUR 28.0 million was issued in the Swedish capital market on 15 February 2018 and has a maturity of five years and three months with maturity date in 15 May 2023. The bonds have a fixed interest rate
of 14%, which is capitalized quarterly. The bonds are issued by Quant AB and are secured with shares in subsidiaries, which are also jointly and severally liable for all obligations under the Bond Agreement. The super senior working capital facility has a substantive legal priority over the senior bonds, which in turn have a substantive legal priority over the junior bonds. The junior bonds were listed on Luxembourg Stock Exchange on 7 February 2019.
Super senior working capital facilityThe group has a working capital facility with Nordea Bank AB (publ) of EUR 20 million, which is possible to use for working capital requirements and as collateral for guarantees issued within the framework of Quant’s operations. The working capital facility is possible to utilize in many diffe-rent currencies and drawn loans run at variable interest rates for the loan period plus a margin of 3.25%. Loans under the working capital facility are due according to initial loan period requested by Quant. Refunded amounts are re-available for borrowing until the working capital facility’s final maturity date of July 15, 2022. The working capital facility is entered into by Quant AB and secured with shares in subsidiaries, which are also jointly and severally liable for all obligations under the facility agreement. The super senior working capital facility has a substantive legal priority over the senior bond loan, which in turn has a substantive legal priority over the junior bond loan.
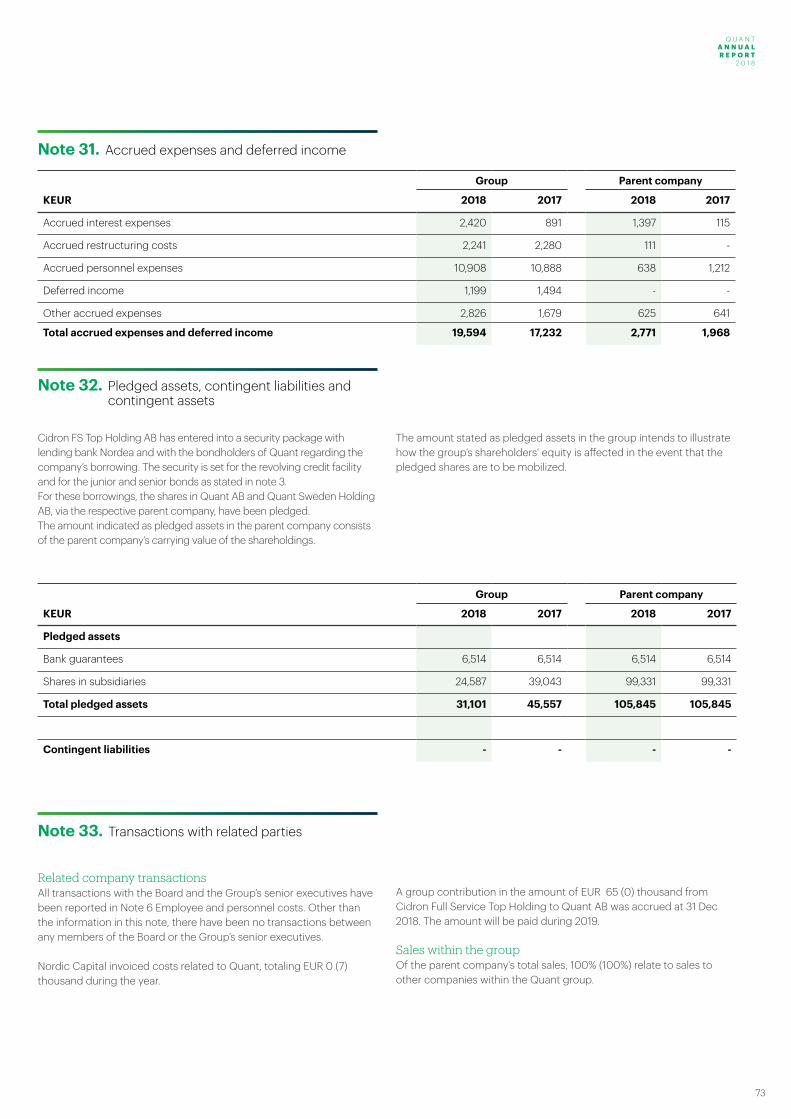
Q U A N T A N N U A L R E P O R T 2 0 1 8
Q U A N T A N N U A L R E P O R T
2 0 1 8
73
Note 31. Accrued expenses and deferred income
Group Parent company
KEUR 2018 2017 2018 2017
Accrued interest expenses 2,420 891 1,397 115
Accrued restructuring costs 2,241 2,280 111 -
Accrued personnel expenses 10,908 10,888 638 1,212
Deferred income 1,199 1,494 - -
Other accrued expenses 2,826 1,679 625 641
Total accrued expenses and deferred income 19,594 17,232 2,771 1,968
Cidron FS Top Holding AB has entered into a security package with lending bank Nordea and with the bondholders of Quant regarding the company’s borrowing. The security is set for the revolving credit facility and for the junior and senior bonds as stated in note 3.For these borrowings, the shares in Quant AB and Quant Sweden Holding AB, via the respective parent company, have been pledged.The amount indicated as pledged assets in the parent company consists of the parent company’s carrying value of the shareholdings.
The amount stated as pledged assets in the group intends to illustrate how the group’s shareholders’ equity is affected in the event that the pledged shares are to be mobilized.
Note 32. Pledged assets, contingent liabilities and contingent assets
Group Parent company
KEUR 2018 2017 2018 2017
Pledged assets
Bank guarantees 6,514 6,514 6,514 6,514
Shares in subsidiaries 24,587 39,043 99,331 99,331
Total pledged assets 31,101 45,557 105,845 105,845
Contingent liabilities - - - -
Related company transactionsAll transactions with the Board and the Group’s senior executives have been reported in Note 6 Employee and personnel costs. Other than the information in this note, there have been no transactions between any members of the Board or the Group’s senior executives.
Nordic Capital invoiced costs related to Quant, totaling EUR 0 (7) thousand during the year.
A group contribution in the amount of EUR 65 (0) thousand from Cidron Full Service Top Holding to Quant AB was accrued at 31 Dec 2018. The amount will be paid during 2019.
Sales within the groupOf the parent company’s total sales, 100% (100%) relate to sales to other companies within the Quant group.
Note 33. Transactions with related parties
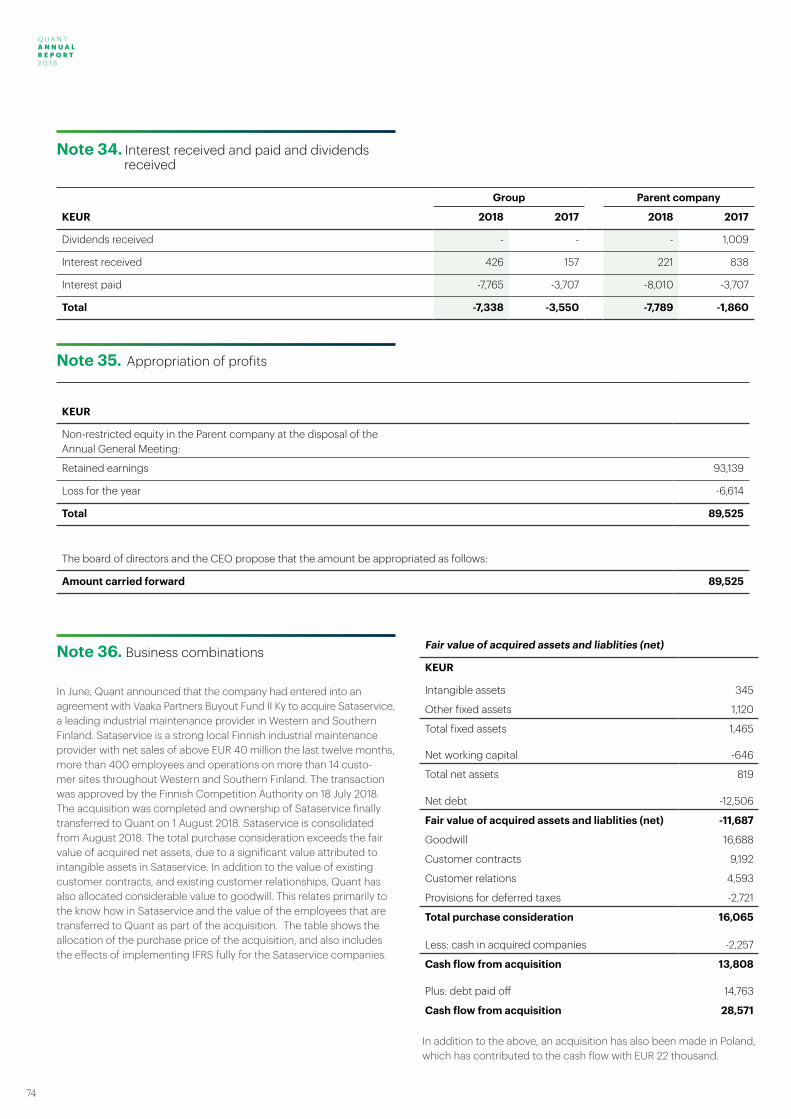
Q U A N T A N N U A L R E P O R T 2 0 1 8
74
Note 34. Interest received and paid and dividends received
Group Parent company
KEUR 2018 2017 2018 2017
Dividends received - - - 1,009
Interest received 426 157 221 838
Interest paid -7,765 -3,707 -8,010 -3,707
Total -7,338 -3,550 -7,789 -1,860
In June, Quant announced that the company had entered into an agreement with Vaaka Partners Buyout Fund II Ky to acquire Sataservice, a leading industrial maintenance provider in Western and Southern Finland. Sataservice is a strong local Finnish industrial maintenance provider with net sales of above EUR 40 million the last twelve months, more than 400 employees and operations on more than 14 custo-mer sites throughout Western and Southern Finland. The transaction was approved by the Finnish Competition Authority on 18 July 2018. The acquisition was completed and ownership of Sataservice finally transferred to Quant on 1 August 2018. Sataservice is consolidated from August 2018. The total purchase consideration exceeds the fair value of acquired net assets, due to a significant value attributed to intangible assets in Sataservice. In addition to the value of existing customer contracts, and existing customer relationships, Quant has also allocated considerable value to goodwill. This relates primarily to the know how in Sataservice and the value of the employees that are transferred to Quant as part of the acquisition. The table shows the allocation of the purchase price of the acquisition, and also includes the effects of implementing IFRS fully for the Sataservice companies.
Note 36. Business combinations Fair value of acquired assets and liablities (net)
KEUR
Intangible assets 345
Other fixed assets 1,120
Total fixed assets 1,465
Net working capital -646
Total net assets 819
Net debt -12,506
Fair value of acquired assets and liablities (net) -11,687
Goodwill 16,688
Customer contracts 9,192
Customer relations 4,593
Provisions for deferred taxes -2,721
Total purchase consideration 16,065
Less: cash in acquired companies -2,257
Cash flow from acquisition 13,808
Plus: debt paid off 14,763
Cash flow from acquisition 28,571
Note 35. Appropriation of profits
KEUR
Non-restricted equity in the Parent company at the disposal of the Annual General Meeting:
Retained earnings 93,139
Loss for the year -6,614
Total 89,525
The board of directors and the CEO propose that the amount be appropriated as follows:
Amount carried forward 89,525
In addition to the above, an acquisition has also been made in Poland, which has contributed to the cash flow with EUR 22 thousand.
Q U A N T A N N U A L R E P O R T 2 0 1 8
Q U A N T A N N U A L R E P O R T
2 0 1 8
75
On 11 January 2019 Quant announced the appointment of Mr. Johan Eriksson as its new CEO. Mr. Eriksson most recently served as CEO of Transcom Worldwide and joined Quant on 14 January 2019. Mr. Olof Sand, CEO, left Quant on 31 January 2019 to pursue other business interests, but maintains links to the company as an external advisor.
On 7 February 2019, the Senior and Junior bonds issued by Quant were successfully listed on the Luxembourg Stock Exchange.
On 6 March 2019 Quant reached an agreement with Oji Fibre Solu-tions (NZ) Limited to settle a dispute arising from a contract expiry in 2017. Under the terms of the agreement Quant New Zealand Limited will receive NZD 1.2 million (EUR 0.7 million) of contract termination redundancy cost and Oji Fibre Solutions (NZ) Limited revokes its NZD 8.4 million (EUR 5.1 million) claim on Quant New Zealand Limited.
No other significant events have occurred after the reporting period.
Note 37. Events after the reporting period
Q U A N T A N N U A L R E P O R T 2 0 1 8
76
Quant AB556975-5654
Stockholm, April 29, 2019
Johan ErikssonCEO
Mikael NorlinChairman of the board
Olof FaxanderDirector of the board
Per HalliusDirector of the board
Casper LercheDirector of the board
Vartan VartanlanDirector of the board
Joachim ZetterlundDirector of the board
Johan LundénDirector of the board
Jörgen BergqvistDirector of the board
Our audit report has been submitted, April 29, 2019
KPMG
Thomas ForslundAuthorized Public Accountant
KPMG
Erik GunnarssonAuthorized Public Accountant
Q U A N T A N N U A L R E P O R T 2 0 1 8
Q U A N T A N N U A L R E P O R T
2 0 1 8
77
To the general meeting of the shareholders of Quant AB (publ), corp. id 556975-5654
Report on the annual accounts and consolidated accountsOpinionsWe have audited the annual accounts and consolidated accounts of Quant AB (publ) for the year 2018. The annual accounts and consolidated accounts of the company are included on pages 28-29 and 33-76 in this document.
In our opinion, the annual accounts have been prepared in accordance with the Annual Accounts Act, and present fairly, in all material respects, the finan-cial position of the parent company as of 31 December 2018 and its financial performance and cash flow for the year then ended in accordance with the Annual Accounts Act. The consolidated accounts have been prepared in accordance with the Annual Accounts Act and present fairly, in all material respects, the financial position of the group as of 31 December 2018 and their financial performance and cash flow for the year then ended in accor-dance with International Financial Reporting Standards (IFRS), as adopted by the EU, and the Annual Accounts Act. The statutory administration report is consistent with the other parts of the annual accounts and consolidated accounts.
We therefore recommend that the general meeting of shareholders adopts the income statement and balance sheet for the parent company and the statement of comprehensive income and balance sheet for the group.
Basis for OpinionsWe conducted our audit in accordance with International Standards on Auditing (ISA) and generally accepted auditing standards in Sweden. Our responsibilities under those standards are further described in the Auditor’s Responsibilities section. We are independent of the parent company and the group in accordance with professional ethics for accountants in Sweden and have otherwise fulfilled our ethical responsibilities in accordance with these requirements.
We believe that the audit evidence we have obtained is sufficient and appro-priate to provide a basis for our opinions.
Other Information than the annual accounts and consolidated accounts This document also contains other information than the annual accounts and consolidated accounts and is found on pages 2-27 and 30-32. The Board of Directors and the Managing Director are responsible for this other information.
Our opinion on the annual accounts and consolidated accounts does not cover this other information and we do not express any form of assurance conclusion regarding this other information.
In connection with our audit of the annual accounts and consolidated accounts, our responsibility is to read the information identified above and consider whether the information is materially inconsistent with the annual accounts and consolidated accounts. In this procedure we also take into account our knowledge otherwise obtained in the audit and assess whether the information otherwise appears to be materially misstated.
If we, based on the work performed concerning this information, conclude that there is a material misstatement of this other information, we are requi-red to report that fact. We have nothing to report in this regard.
Responsibilities of the Board of Directors and the Managing Director The Board of Directors and the Managing Director are responsible for the preparation of the annual accounts and consolidated accounts and that they give a fair presentation in accordance with the Annual Accounts Act and, concerning the consolidated accounts, in accordance with IFRS as adopted
by the EU. The Board of Directors and the Managing Director are also respon-sible for such internal control as they determine is necessary to enable the preparation of annual accounts and consolidated accounts that are free from material misstatement, whether due to fraud or error.
In preparing the annual accounts and consolidated accounts The Board of Directors and the Managing Director are responsible for the assessment of the company’s and the group’s ability to continue as a going concern. They disclose, as applicable, matters related to going concern and using the going concern basis of accounting. The going concern basis of accounting is however not applied if the Board of Directors and the Managing Director intend to liquidate the company, to cease operations, or has no realistic alternative but to do so.
The Audit Committee shall, without prejudice to the Board of Director’s responsibilities and tasks in general, among other things oversee the compa-ny’s financial reporting process.
Auditor’s responsibility Our objectives are to obtain reasonable assurance about whether the annual accounts and consolidated accounts as a whole are free from material misstatement, whether due to fraud or error, and to issue an auditor’s report that includes our opinions. Reasonable assurance is a high level of assurance, but is not a guarantee that an audit conducted in accordance with ISAs and generally accepted auditing standards in Sweden will always detect a mate-rial misstatement when it exists. Misstatements can arise from fraud or error and are considered material if, individually or in the aggregate, they could reasonably be expected to influence the economic decisions of users taken on the basis of these annual accounts and consolidated accounts.As part of an audit in accordance with ISAs, we exercise professional judg-ment and maintain professional scepticism throughout the audit. We also:• Identify and assess the risks of material misstatement of the annual ac-
counts and consolidated accounts, whether due to fraud or error, design and perform audit procedures responsive to those risks, and obtain audit evidence that is sufficient and appropriate to provide a basis for our opini-ons. The risk of not detecting a material misstatement resulting from fraud is higher than for one resulting from error, as fraud may involve collusion, forgery, intentional omissions, misrepresentations, or the override of internal control.
• Obtain an understanding of the company’s internal control relevant to our audit in order to design audit procedures that are appropriate in the circum-stances, but not for the purpose of expressing an opinion on the effective-ness of the company’s internal control.
• Evaluate the appropriateness of accounting policies used and the reasona-bleness of accounting estimates and related disclosures made by the Board of Directors and the Managing Director.
• Conclude on the appropriateness of the Board of Directors’ and the Mana-ging Director’s, use of the going concern basis of accounting in preparing the annual accounts and consolidated accounts. We also draw a conclu-sion, based on the audit evidence obtained, as to whether any material uncertainty exists related to events or conditions that may cast significant doubt on the company’s and the group’s ability to continue as a going con-cern. If we conclude that a material uncertainty exists, we are required to draw attention in our auditor’s report to the related disclosures in the annual accounts and consolidated accounts or, if such disclosures are inadequ-ate, to modify our opinion about the annual accounts and consolidated accounts. Our conclusions are based on the audit evidence obtained up to the date of our auditor’s report. However, future events or conditions may cause a company and a group to cease to continue as a going concern.
• Evaluate the overall presentation, structure and content of the annual ac-counts and consolidated accounts, including the disclosures, and whether the annual accounts and consolidated accounts represent the underlying transactions and events in a manner that achieves fair presentation.
Auditor’s Report(Translation from the Swedish original)
A U D I T O R ’ S R E P O R T
2 0 1 8
Q U A N T A N N U A L R E P O R T 2 0 1 8
78
• Obtain sufficient and appropriate audit evidence regarding the financial information of the entities or business activities within the group to express an opinion on the consolidated accounts. We are responsible for the di-rection, supervision and performance of the group audit. We remain solely responsible for our opinions.
We must inform the Board of Directors of, among other matters, the planned scope and timing of the audit. We must also inform of significant audit findings during our audit, including any significant deficiencies in internal control that we identified.
Report on other legal and regulatory requirementsOpinionsIn addition to our audit of the annual accounts and consolidated accounts, we have also audited the administration of the Board of Directors and the Managing Director of Quant AB (publ) for the year 2018 and the proposed appropriations of the company’s profit or loss.We recommend to the general meeting of shareholders that the profit be appropriated in accordance with the proposal in the statutory administration report and that the members of the Board of Directors and the Managing Director be discharged from liability for the financial year.
Basis for OpinionsWe conducted the audit in accordance with generally accepted auditing standards in Sweden. Our responsibilities under those standards are further described in the Auditor’s Responsibilities section. We are independent of the parent company and the group in accordance with professional ethics for accountants in Sweden and have otherwise fulfilled our ethical responsibili-ties in accordance with these requirements.
We believe that the audit evidence we have obtained is sufficient and appro-priate to provide a basis for our opinions.
Responsibilities of the Board of Directors and the Managing Director The Board of Directors is responsible for the proposal for appropriations of the company’s profit or loss. At the proposal of a dividend, this includes an assessment of whether the dividend is justifiable considering the require-ments which the company’s and the group’s type of operations, size and risks place on the size of the parent company’s and the group’s equity, consolida-tion requirements, liquidity and position in general.
The Board of Directors is responsible for the company’s organization and the administration of the company’s affairs. This includes among other things continuous assessment of the company’s and the group’s financial
situation and ensuring that the company’s organization is designed so that the accounting, management of assets and the company’s financial affairs otherwise are controlled in a reassuring manner.
The Managing Director shall manage the ongoing administration according to the Board of Directors’ guidelines and instructions and among other matters take measures that are necessary to fulfill the company’s accounting in accordance with law and handle the management of assets in a reassuring manner.
Auditor’s responsibilityOur objective concerning the audit of the administration, and thereby our opinion about discharge from liability, is to obtain audit evidence to assess with a reasonable degree of assurance whether any member of the Board of Directors or the Managing Director in any material respect:• has undertaken any action or been guilty of any omission which can give
rise to liability to the company, or• in any other way has acted in contravention of the Companies Act, the
Annual Accounts Act or the Articles of Association.Our objective concerning the audit of the proposed appropriations of the company’s profit or loss, and thereby our opinion about this, is to assess with reasonable degree of assurance whether the proposal is in accordance with the Companies Act.
Reasonable assurance is a high level of assurance, but is not a guarantee that an audit conducted in accordance with generally accepted auditing standards in Sweden will always detect actions or omissions that can give rise to liability to the company, or that the proposed appropriations of the company’s profit or loss are not in accordance with the Companies Act.
As part of an audit in accordance with generally accepted auditing standards in Sweden, we exercise professional judgment and maintain professional scepticism throughout the audit. The examination of the administration and the proposed appropriations of the company’s profit or loss is based primarily on the audit of the accounts. Additional audit procedures perfor-med are based on our professional judgment with starting point in risk and materiality. This means that we focus the examination on such actions, areas and relationships that are material for the operations and where deviations and violations would have particular importance for the company’s situation. We examine and test decisions undertaken, support for decisions, actions taken and other circumstances that are relevant to our opinion concerning discharge from liability. As a basis for our opinion on the Board of Directors’ proposed appropriations of the company’s profit or loss we examined whether the proposal is in accordance with the Companies Act.
A U D I T O R ’ S R E P O R T 2 0 1 8
Stockholm, April 29, 2019
KPMG
Thomas ForslundAuthorized Public Accountant
KPMG
Erik GunnarssonAuthorized Public Accountant

Q U A N T A N N U A L R E P O R T 2 0 1 8
Q U A N T A N N U A L R E P O R T
2 0 1 8
79
quantservice.com
For further questions:[email protected]
This annual report is a translation from the original Swedish text. The Swedish text is the binding version and shall prevail in the event of any discrepancies.