the effectiveness of non-traditional training as it
TRANSCRIPT

Old Dominion University Old Dominion University
ODU Digital Commons ODU Digital Commons
OTS Master's Level Projects & Papers STEM Education & Professional Studies
2002
The Effectiveness of Non-Traditional Training as it Applies to the The Effectiveness of Non-Traditional Training as it Applies to the
Commands and Personnel of the U. S. Navy Who Have Utilized Commands and Personnel of the U. S. Navy Who Have Utilized
this Service in the Pacific Northwest Region this Service in the Pacific Northwest Region
Clint D. Brown Old Dominion University
Follow this and additional works at: https://digitalcommons.odu.edu/ots_masters_projects
Part of the Education Commons
Recommended Citation Recommended Citation Brown, Clint D., "The Effectiveness of Non-Traditional Training as it Applies to the Commands and Personnel of the U. S. Navy Who Have Utilized this Service in the Pacific Northwest Region" (2002). OTS Master's Level Projects & Papers. 192. https://digitalcommons.odu.edu/ots_masters_projects/192
This Master's Project is brought to you for free and open access by the STEM Education & Professional Studies at ODU Digital Commons. It has been accepted for inclusion in OTS Master's Level Projects & Papers by an authorized administrator of ODU Digital Commons. For more information, please contact [email protected].

THE EFFECTIVENESS OF NON-TRADITIONAL TRAINING AS IT APPLIES TO THE COMMANDS AND PERSONNEL OF THE U.S NA VY WHO HA VE
UTILIZED THIS SERVICE IN THE PACIFIC NORTHWEST REGION
THIS RESEARCH PAPER IS PRESENTED TO
THE GRADUATE FACULTY OF THE DEPARTMENT OF OCCUPATIONAL AND TECHNICAL STUDIES
OLD DOMINION UNIVERSITY
IN PARTIAL FULLFILLMENT OF THE REQUIREMENTS FOR THE DEGREE
MASTER OF SCIENCE IN BUSINESS AND INDUSTRY TRAINING
BY
APPROVAL PAGE
This research paper was prepared by Clint David Brown under the direction of Dr.
John M. Ritz in OTED 636, Problems in Occupational and Technical Studies. It was
submitted to the Graduate Program Director as partial fulfillment of the requirements for
the degree of Master of Science in Occupational and Technical Studies.
APPROVALBY:£".),,. ~ r. John M. Ritz
Advisor and Graduate Program Director
11
II- ~- 6 d----
Date

ACKNOWLEDGEMENTS
Without the assistance of the students, administrators and instructors of the
Navy's Non-Traditional training program, this study would not have been possible. I am
very grateful for the learning experience and new relations created because of this
research.
I would also like to thank Master Chief Leo Salonga for brainstorming with me to
come up with this particular survey topic. His wisdom and enthusiasm for my project and
success were invaluable. Additionally, both Mr. Eric Pfefferkorn from Olympic College
and Mr. Paul Vosseler, deserve specific recognition for being so willing in opening their
programs up for a close external evaluation. Thank you.
Finally, a special thanks to Dr. Ritz who is so efficient at empowering his
students, while maintaining the structure and support so important to young researchers.
Dr. Ritz's guidance and support throughout this long and arduous process was unfailing.
Clint D. Brown
111

TABLE OF CONTENTS
Page
Approval Page ..................................................................................... 1
Acknowledgements .............................................................................. .ii
Table of Tables ................................................................................... viii
CHAPTER
I. WTRODUCTION ............................................................... 1
Statement of the Problem ....................................................... 2
Research Goals ................................................................... 2
Background and Significance ................................................... 3
Limitations ............................................................ , ........... 3
Assumptions ..................................................................... 4
Procedures ........................................................................ 4
Definition of Terms .............................................................. 5
Overview of Chapters .......................................................... 6
II. REVIEW OF LITERATURE ................................................ 7
Non-Traditional Training ....................................................... 8
Quality of Life ................................................................... 9
Retention in the Navy ......................................................... 10
The Revolution in Training .................................................... 11
Summary ........................................................................ 13
IV

III. METHODS AND PROCEDURES ........................................... 14
Population ....................................................................... .14
Instrument Design ............................................................... 14
Data Collection Procedures .................................................... 15
Statistical Analysis .............................................................. 15
Summary .......................................................................... 16
IV. FINDINGS ........................................................................ 17
Survey Response .................................................................. 1 7
Table I-Combined, Initial/ End of Course survey common responses ... 18
Career Path . . . . . . . . . .. . . ........................................................... 18
Quality of Life ..................................................................... 21
Expectations I End result ....................................................... .22
Table 2-Combined, Initial survey unique responses ......................... 23
Career Path ........................................................................ 23
Quality of Life ..................................................................... 23
Open-ended response ............................................................ 26
Table 3-Combined, End of course survey unique responses ................ 26
Instruction ......................................................................... 28
Open-ended response ............................................................ 28
Table 4-Disbursing Clerk Afloat, Initial / End of Course survey common
responses .......................................................................... 28
Career Path ........................................................................ 31
Quality of Life ..................................................................... 32
V

Expectations / End result ........................................................ 33
Table 5- Disbursing Clerk Afloat, Initial survey unique responses
....................................................................................... 33
Career Path ........................................................................ 36
Quality of Life ..................................................................... 36
Open-ended response ............................................................ 36
Table 6-Disbursing Clerk Afloat, End of course survey unique responses
........................................................................................ 37
Instruction ......................................................................... 3 7
Open-ended response ............................................................. 3 7
Table 7-Food Service Administration, Initial/ End of Course survey
common responses ................................................................ 39
Career Path ........................................................................ 39
Quality of Life .................................................................... .42
Expectations/ End result ........................................................ .43
Table 8-Food Service Administration, Initial survey unique responses .. .44
Career Path ........................................................................ 44
Quality of Life ..................................................................... 44
Open-ended response ........................................................... .4 7
Table 9-Food Service Administration, End of course survey unique
responses ........................................................................... 4 7
Instruction ......................................................................... 49
Open-ended response ........................................................... .49
VI

Table 10-General Mess Operations, Initial / End of Course survey
common responses ................................................................ 49
Career Path ......................................................................... 52
Quality of Life ...................................................................... 52
Expectations/ End result .......................................................... 53
Table 11- General Mess Operations, Initial survey unique responses
....................................................................................... 54
Career Path ........................................................................ 57
Quality of Life ...................................................................... 57
Open-ended response ............................................................ 57
Table 12-General Mess Operations, End of course survey unique
responses .......................................................................... 58
Instruction ......................................................................... 58
Open-ended response ............................................................ 58
Summary ......................................................................... 60
V. SUMMARY, CONCLUSIONS, AND RECOMMENDATIONS ........ 61
Summary .......................................................................... 61
Conclusions ....................................................................... 62
Recommendations ................................................................ 63
BIBLIOGRAPHY .................................................................................. 65
Vll

APPENDICES ...................................................................................... 66
Appendix A: Sample Initial Course Research Survey .............................. 67
Appendix B: Sample End of Course Research Survey .............................. 68
Appendix C: Sample Cover Letter ..................................................... 69
vm

TABLE 1.
TABLE 2.
TABLE 3.
TABLE 4.
TABLE 5.
TABLE 6.
TABLE 7.
TABLE 8.
TABLE 9.
TABLE OF TABLES
PAGE
Table of Initial/ End of Course Survey Common Responses .............. 19
Table of Initial Survey Unique Responses ................................... 24
Table of End of Course Unique Responses .................................. 27
Table of Disbursing Clerk (DK) Afloat Initial/ End of Course Survey
Common Responses .............................................................. 29
Table of Disbursing Clerk (DK) Afloat Initial Unique Responses
. ...................................................................................... 34
Table of Disbursing Clerk (DK) Afloat End of Course Unique Responses
.. ...................................................................................... 38
Table of Food Service Administration (FSA) Initial/ End of Course
Survey Common Responses ................................................... .40
Table of Food Service Administration (FSA) hritial Unique Responses .45
Table of Food Service Administration (FSA) End of Course Unique
Responses ......................................................................... 48
TABLE 10. Table of General Mess Operations (GMO) Initial/ End of Course Survey
Common Responses ............................................................. 50
TABLE 11. Table of General Mess Operations (GMO) Initial Unique Responses .... 55
TABLE 12. Table of General Mess Operations (GMO) End of Course Unique
Responses ......................................................................... 59
IX

CHAPTER I
INTRODUCTION
Since the establishment of the United States Navy, training has been conducted
via on the job training or in traditional training facilities. Like many businesses and
corporations of today, the Navy sees the need for change and innovation as an essential
part of survival. The revolution will challenge old assumptions, implement new
processes, and create new tools that will make a real difference in the lives of sailors and
the Navy's war fighting capabilities (Kirchner, http://www.excel.navy.mil/pr04.htm). The
revolution in training is about realizing our Navy's human potential (Clark,
http://www.excel.navy.mil/word.htm). This need for change has occurred primarily
because of the end of the "Cold War" and the policy of the Clinton Administration of
reducing the military budget. As a result Non-Traditional training has become an
essential asset in improving service members quality of life while at the same time saving
the military a considerable sum of money.
A Non-Traditional training site (NTTS) may be a college, vocational school,
shipyard, private contractor, etc., which has been certified to provide training to Navy
personnel. The following is an example of the relevance of such a program. Picture
yourself as a Navy man or woman standing on the flight deck of an aircraft carrier
returning to port with a slight breeze blowing and maybe a sprinkle or two of rain as you
return to port in Bremerton, Washington. As you are scanning the crowd on the pier for
your family, anxiously awaiting your arrival since you left six months before, your
division officer comes up beside you and informs you that you will be flying to Norfolk,

2
Virginia, in two days for a three-week school. Now this is only an example, but situations
like this occur all too often. Not only is this sailor getting pulled away from his/her
family, the Navy is going to be paying a very high cost in monetary value as well as
impacting the sailors quality of life.
It is for this reason that in 1998 the Navy created the Local Training Authority
(LTA) to find and certify suitable training sites in the local area of the Navy's largest
ports. The LTA ensures the Non-Traditional training sites facility, curriculum, and
instructors are capable of providing training to strict Navy standards.
This study was conducted to determine if the local Non-Traditional training in the
Pacific Northwest Region is successfully completing its mission of improving the sailors'
quality oflife while saving the Navy money. The study will evaluate if the learning,
taking place, is relevant and beneficial to the sailor when he or she returns to the job.
Statement of the Problem
The purpose of this study was to determine the effectiveness of Non-Traditional
training as it applies to the personnel of the U.S. Navy who have utilized this service in
the Pacific Northwest Region.
Research Goals
The goals of this research were to answer the following questions:
1. Should completion of Non-Traditional training enhance rating advancement?
2. Does attendance of local Non-Traditional training effect the student's quality of
life?

3. Do graduates of Non-Traditional training who were initially opposed to
reenlisting or extending change their decision upon completion of the Non
Traditional training course?
Background and Significance
3
Since the inception of the Local Training Authority and subsequent non
traditional training sites in 1998, a large amount of data has been generated. The problem
is that the data have never been assembled in such a way to establish if the program is
accomplishing its goals. Is the program graduating better trained and motivated sailors?
Is training being brought to the sailor whenever possible vice sending the sailor away for
the training? Is there a return on investment?
This study will present a demographic profile of the typical sailor's attitude
toward the Navy and their aspirations of going into a non-traditional class for the first
time. This will be compared with their attitude as they graduate. Additionally, the sailors'
commands will be solicited for input as to the effectiveness of the training that they have
seen on their sailor's performance, advancement, and retention.
Both Navy and training site coordinators can utilize this information to refine any
weak areas noted while giving praise to those that are being most effective. If the
program is, in fact, having a significant impact on retention, advancement, quality of life,
and cost saving, this research could be a very powerful tool for attaining greater resources
and expansion of the program.
Limitations
The following limitations were established to facilitate this study:

4
1. The research was limited to Non-Traditional sites of the Pacific Northwest Region
of the United States.
2. The students of the study were enlisted in the United States Navy.
3. The information was gathered from surveys of students at the training sites.
4. The research period was from February 2002 to August of 2002.
Assumptions
The following assumptions have been made to assist in the completion of this
study.
1. Past and present students of Non-Traditional training courses for the Navy will be
willing to participate in the study.
2. Only those students who actually participated in Navy Non-Traditional courses
will complete the initial and final surveys.
3. The results of the study will be used to determine if the Non-Traditional students'
quality-of-life has been positively affected.
Procedures
This research was developed to determine if the goal of the Navy's Non
Traditional training program to bring resourceful, cost effective, training to the sailor
were being met. The data obtained to complete this research came from surveys. The
survey was constructed to display the overall outlook of students in Non-Traditional
training as they commenced the training compared to their outlook after completion of
the training.

The data collected were analyzed to draw conclusions and make
recommendations for refinement of the Navy's Non-Traditional training program. These
results were also utilized to further promote the use and value of the program.
Definition Of Terms
The following definitions will provide the reader with a better understanding of
the terms used in this study:
1. Non-Traditional training: Bringing the training to the sailor while addressing
quality of life issues and delivering effective, high quality training.
2. Non-Traditional training site: This site may be a college, vocational school,
shipyard, etc., which has been certified to train Navy personnel.
3. Local Training Authority: The LTA reviews a site's curriculum, facility, and
instructors to determine if the site is meeting Navy standards. The LTA also
certifies these sites and promotes their usage.
4. Retention: When the Navy retains the service of the sailor beyond the terms of
their initial contract.
5. General Mess Operations Course: The GMO course is a basic culinary arts
program.
6. Food Service Administration Course: The FSA course concentrates on
administrative and cleanliness requirements.
7. Disbursing Clerk Afloat Course: The DK Afloat course is an administrative
course that focuses primarily on travel funding and payroll.
5

6
8. Task Force EXCEL: Excellence through Commitment to Education and Leaming
is a program with the purpose of providing the tools and opportunities that will
enable people in the Navy to learn, grow, and develop in successful leaders.
Overview of Chapters
Chapter I introduces the reader to the principles and philosophies of the United
States Navy's Non-Traditional training program. How the program is being utilized as
well as the benefits provided by bringing training to the sailor vice sending him or her
away from home and family were also covered.
Chapter II reviews the literature providing information on non-traditional training.
Chapter III reviews the methods and procedures used to accumulate and analyze the data
used in this research study. Chapter IV contains the findings of the research. While
Chapter V summarizes what was learned, draws conclusions based on the findings, and
makes recommendations for the future use of these findings.

CHAPTER II
REVIEW OF LITERATURE
The Review of Literature provides a look at the research and publications
covering the integration, philosophy, and implementation of the Navy's innovative non
traditional training and related programs. Though the process of outsourcing and finding
unique delivery vehicles of training is a new addition to the rigid structure of the United
States Navy, this is nothing new to corporate America. Recent leadership changes in the
upper ranks of the Navy has provided the necessary incentive to push for and implement
new training programs such as Non-Traditional training through a designated local area
facilitator, the Local Training Authority (LTA).
The intent of Non-Traditional training is to provide diverse and cost effective
training. At the same time it is also intended to improve the sailor's general quality of
life, increase the average education level of today's sailor, improve advancement,
jumpstart post-secondary learning, as well as provide greater flexibility to commands for
scheduling purposes (Non-Traditional Training, http://www.ttf.navy.mil/lta.htm ).
Due in large part to the success of Non-Traditional training and a significantly
reduced budget, a new program has recently surfaced. This new program is Task Force
EXCEL. An excellent overview of this program, as stated by Chief of Naval Operations,
Admiral Vern Clark, is that "we are going to challenge all of our assumptions about
when, where, and how we train our professionals" (Kirchner,
http://www.excel.navy.mil/pr02.htm).
7

Non-Traditional Training
With the end of the "Cold War", America's military forces were dramatically
impacted. Significant cuts were evident in the drastic reduction in military forces and
funding. As a result, the "catch-all phrase" of the upper echelon was and is to this day
"Learn to do more with less". This shift in philosophy was difficult to adjust to and
resistance was understandably very high. Following the end of the Cold War came the
Clinton administration, compounding the reductions with even greater cuts to the
military. These cuts included an increase in manpower reductions and also the closing of
numerous bases of all branches of service.
8
Change is difficult, but if you can survive changes resulting in major reductions
the result can be very beneficial from an efficiency standpoint. Those in the Navy learned
the importance of reporting and eliminating overcharging of government contractors and
material suppliers. Most importantly, they had to maintain the aggressive and stringent
operational schedule while still getting our people trained to the level required for system
operations and personal growth.
These needs led to the birth of the Navy's Non-Traditional training program in
March of 1998. The Chief of Naval Education and Training officially formalized the
structure of the Local Training Authority (LTA). The role of the LTA has played a
critical role in the increased efficiency of Naval forces by giving commands greater
flexibility in ships scheduling in the attainment of both critical and non-critical school
quotas. The regional LT A's have the authorization to certify non-traditional sources of
training such as community colleges, vocational technical schools, and shipyards as Non
Traditional Training Sites (NTTS)(History, http://www.excel.navy.mil/ltad/history.html).

9
One significant advantage Non-Traditional training has over traditional Navy
training is the speed with which a course can be designated, approved, and put in service.
Since the regional LTA has the authority to both chose and certify a NTTS (non
traditional training site), much of the "red-tape" associated with traditional training
course implementation is eliminated. This capability has been utilized a number of times
to meet immediate training needs of the Navy.
Quality of Life
The Navy's Non-Traditional training program combined with its new partner
program, Task Force EXCEL (Excellence through Commitment to Education and
Leaming), will ultimately or if all goes as planned, result in the creation of a new learning
culture within the Navy. This learning culture will focus on greater use of sailor time,
personal development, and improved performance (Kirchner,
http://www.excel.navy.mil/pr03.htm).
The primary factors impacting a sailor's quality oflife is the amount of time spent
away from family, forced moves, promotion, transference of Navy Training to college
credits, and advancement. Non-Traditional training addresses each of these primary
factors to a certain degree. For example, by training locally, less time is spent away from
family since a number of certified Non-Traditional Training Sites are facilitated by
colleges or universities and college credits are received from these institutions. As a
result of this additional education, sailors have a better chance of advancement, resulting
in increased pay and responsibilities. Meeting these factors for the individuals assists the
Navy in meeting its goals ofrevolutionizing training and empowering its people to learn,

grow, and become successful leaders within the community and the structure of the
Navy.
An excellent example of the impact oflocal area training is the relocation of the
Navy's advanced welding course to fleet concentration areas. This relocation allows
sailors to spend more time with their families instead of away from home on temporary
assignment for the training. This relocation has also opened up instructor positions
allowing sailors greater flexibility in staying in the area of their choice. Benefits to the
Navy as a whole include improved morale and a significant reduction in travel costs
(Navy Welding, 2000).
Retention in the Navy
10
"Why is our military expending so much effort and time on the individual
sailor?" With the American military being an entirely volunteer force, it is imperative that
each individual receives the appropriate level of attention to keep them satisfied with
their job. If these sailors are having their needs met, the likelihood they will "Stay Navy"
is greatly increased. Although the economy is not "booming" as it was in the year 2000,
there are still a number of employers looking to hire prior military members. It is for this
reason that the Navy wants to be widely recognized as the "employer of choice" said
Vice Admiral Harms, Chief of Naval Education and Training (Kirchner,
http://www.excel.navy.mil/pr03 .htm).
This is why retention efforts and quality of life issues will forever be linked. In an
effort to get sailors to "Stay Navy" the Navy Personnel Command in Millington,
Tennessee, has created the Center for Career Development (CCD). This site has been
established to provide essential tools needed to keep the Navy's best sailors in uniform.

11
These tools include: extensive professional training for Career Counselors and Command
Retention teams; seminars and workshops for both the sailor and his family; consolidated
analysis reports of the Navy's retention; and quality of service to help senior leadership
members in making policy decisions.
The CCD is just another example of the Navy's continuing effort to balance the
sailors' quality of life and career development. Since 70 percent of sailors are married,
the Center for Career Development concentrates a good portion of its efforts on the
family members because career decisions of a married sailor belong as much to the
spouse and children as it does to the sea going sailor (Stay Navy, 2000).
The Revolution in Training
Currently much of the Navy's training is based in the traditional classroom format
where the instructor spends a substantial amount of time lecturing while the students just
sit there and listens. Of course, there is a time and a place for this method, such as
delivering basic information. A number of studies have concluded that a greater percent
of information is retained through student interaction (Science of Leaming,
http://www.excel.navy.mil/science.htm).
The Non-Traditional training program, specifically, the new Task Force EXCEL
program, is specifically concentrating in the area of relative, hands-on training. By
directly linking skills learned in training to a specific job, students are able to see the
importance of the information as it relates to their on-the-job success. When there is no
question to the validity and importance of the information being delivered, the level of
retention goes up dramatically (Science of Leaming,
http://www.excel.navy.mil/science.htm).

12
One of the key sub-programs of Task Force EXCEL is the Sailor Continuum
Program. This program is geared toward increasing the Navy's war-fighting capabilities
through the revolution of the education and training process. There are five distinctive
areas or vectors that are addressed as a means to the end. They include:
1. Professional development: This area concentrates on rating and community training
by correlating training to the standards of the private sector. This allows for greater
transferability of military training to college credits and workforce requirements.
2. Personal development: This area includes General Military Training, financial
planning and management, as well as college level courses.
3. Professional military education and leadership: This vector concentrates on relevant
real-world situations by providing all sailors with the tools and critical thinking skills
required of successful leaders.
4. Certifications and qualifications: This will focus on unit-level requirements and
correlating industry certifications that directly link to on-the-job proficiencies. This
ensures that Naval personnel get the college credit and certifications they deserve.
5. Performance: This area accounts for all personal development issues and determining
a sailors overall abilities.
When this program is fully implemented it will link directly to the advancement
process by promoting people based on accomplishment, performance, and what they have
learned (Kirchner, http://www.excel.navy.mil/pr04.htm). Currently the advancement
process is primarily based on time, duty stations, and advancement test scores.

13
Summary
From the literature review in this section, it is easy to see that the Navy has
realized the incredible potential and value of its personnel. The extreme effort to catch up
to corporate America in addressing the needs of its personnel is truly commendable.
It will be interesting to see if these actions and innovative programs being
implemented are having the desired effect. The following chapters are formatted to
answer these questions and give an indication as to the direction and impact of these
programs. Chapter III will describe the methods and procedures utilized to collect data
and analyze the necessary data required of this study.

CHAPTER III
METHODS AND PROCEDURES
14
The intention of this chapter is to outline, discuss, and explain the methods and
procedures utilized to assemble the data used to complete this study. The topics discussed
in this chapter include population, instrument design, data-collection methods, and data
analysis.
Population
The population for this study consisted of students of Navy Non-Traditional
training in the Pacific Northwest region of the United States. A total of 33 students
attended three different courses participating in the study. Eight students attended the
Disbursing Clerk (DK) Afloat course, 13 students attended the Food Service
Administration (FSA) course and the remaining 12 students attended the General Mess
Operations (GMO) course.
Instrument Design
The instruments utilized for the collection of data for this research were in the
form of a survey. The surveys combined both open and closed form responses and were
developed based on the researchers experience as a trainer and evaluator of instruction.
Additional input for the development of the surveys was gathered from those personnel
directly involved with the Navy's Non-Traditional training program in the Pacific
Northwest region. Specifically, these individuals included representatives from the Local
Training Authority, the community college administrator of the program, and the
instructors of several of the non-traditional training courses.

15
As a result of this valuable input, two individual surveys were created to collect
the required data for this research. The first survey was the initial course survey, designed
to obtain information about an individuals intended career path, aspirations, quality of life
issues, travel, lodging, and check-in process. This survey also encompassed questions
concerning expectations of the course and provided space for written comments. See
Appendix A. The end of course survey was very similar in design characteristics as the
initial course survey, although this particular survey was intended to determine if the
individual's behavior had changed as a result of the training. See Appendix B.
Data Collection Procedures
The initial course survey was administered to the students by the researcher on the
first day of class. The end of course survey was administered on the last day of class by
the researcher. See Appendix C for the cover letter that accompanied the surveys.
All data collected were compiled and tabulated at the end of the survey period. A
data based program was used to assimilate and categorize this data.
Statistical Analysis
Each of the student survey forms were processed using the data based program.
The student closed form responses were calculated and averaged into a single, master
table for each class as well as a table reflecting the results of the three courses combined.
Statistics used in these tables include the mode (most frequent) response, the percentage
that each answer was chosen, the mean ofresponses for each question on the initial and
exit surveys. The mean differential between the initial and exit survey is also tabulated.
The open form responses were compiled and grouped according to the nature of the
response. These groupings were then identified in a table by number of responses.

16
Summary
This chapter provided information regarding the process and tools used to collect
and tabulate the research data. Specifically discussed were the instrument design, target
population, and the basic flow path of the data collected from start to finish. In Chapter
IV of this study, the data collected will be presented.

CHAPTER IV
FINDINGS
17
The purpose of this study was to introduce the findings of the research study. The
studys purpose, to determine the effectiveness of the U.S Navy's Non-Traditional
training programs, was accomplished through the use of surveys.
The method of collecting data for this study was an initial and an exit survey. The
data were utilized to answer the following research goals:
1. Should completion of Non-Traditional training enhance rating advancement?
2. Does attendance oflocal Non-Traditional training effect the student's quality of
life?
3. Do graduates of Non-Traditional training who were initially opposed to
reenlisting or extending change their decision upon completion of the Non
Traditional training course?
Survey Response
Sixty-six out of 66 surveys were administered and returned, resulting in a 100
percent response rate. Courses participating in the study included the Disbursing Clerk
(DK) Afloat, General Mess Operations (GMO), and Food Service Administration (FSA)
classes. The initial course survey was a Likert type survey segmented into four parts. The
first, second and third segments contained closed ended responses. Possible responses
were, I strongly agree, I agree, does not apply, I disagree, and I strongly disagree. The
first segment pertained to questions on career intentions, such as, reenlistment and
advancement. The second asked questions concerning quality of life issues, such as,
lodging and transportation. The third segment concentrated on expectations, such as

relevancy of course and personal betterment. The final segment of the initial course
survey consisted of three open ended questions asking for course improvement and
general comments. The end of course survey contained essentially the same four
segments and questions as the initial course survey with an additional closed ended
segment on quality of instruction. The intention behind having an initial and an end of
course survey was to document any change in behavior or attitude.
Combined
Initial / End of Course Survey Common Responses
18
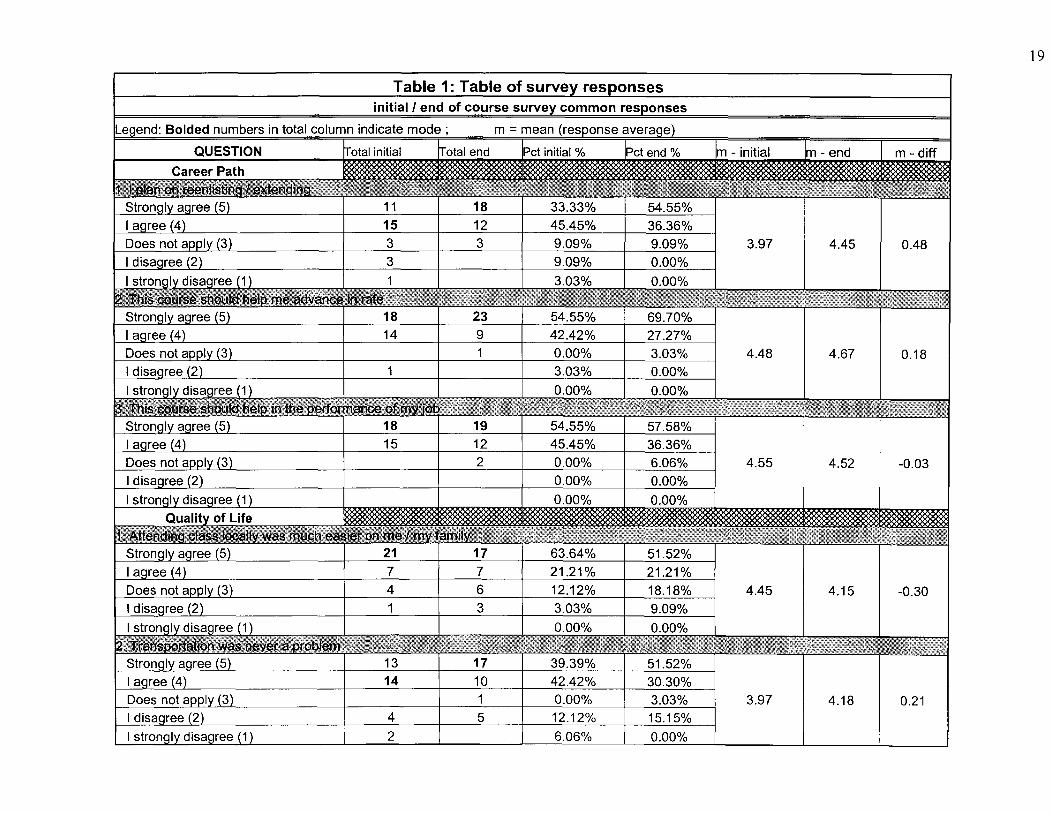
Table 1 depicts the responses common to both the initial and end of course
surveys of the three different courses combined. Responses were tabulated to determine
the percentage each possible response was chosen; a mean rating was also determined for
each question. The mean ratings are based on a scale of 1-5, with selection 5 representing
the answer "I strongly agree and selection 1 representing the answer "I strongly
disagree". The difference of the means from both the initial and end of course survey are
displayed. Additionally, the highlighted number in the total column depicts the mode
(most frequently chosen answer). Following is a description of the individual responses
as depicted in Table 1.
Career Path
Question 1. I plan on reenlisting I extending. The mode answer on the initial
survey was selection 4 (I agree) with 45% of the total responses. The end of course
survey mode was selection 5 (strongly agree) with 55% of the total responses. The mean
differential increased by .48 from 3.97 on the initial survey to 4.45 on the end of course
survey.
19
Table 1: Table of survev responses
Leqend: Bolded numbers in total column indicate mode ;
QUESTION
15 12 45.45% 36.36% 3 3 9.09% 9.09% 3.97 4.45 0.48 3 9.09% 0.00%
9 27.27%
3.03% 4.48 4.67 0.18 0.00%
12 45.45% 2 0.00%
0.00%
7 7 21.21% 21.21 % 4 6 12.12% 18.18% 4.45 4.15 -0.30
3 3.03% 9.09%
14 42.42% 30.30% 0.00% 3.03% 3.97 4.18 0.21
4 5 12.12% 15.15%
2 6.06% 0.00%

20
Pct end% Im - initial Im - end I m - diff
17 15 51.52% 45.45%
7 9 21.21% 27.27%
7 8 21.21 % 24.24% I 4.15 I 4.15 I 0.00
1 1 3.03% 3.03%
24 15 72.73% 45.45%
2 3.03% 6.06% 4.12 4.42 0.30 3.03% 0.00%
22 17 51.52%
2 3 9.09% 4.00 4.30 0.30 1 0.00%
22 13
1 I 4 3.03% 12.12% 4.15 I 4.27 I 0.12 1 0.00% 3.03%
3.03%
42.42% 45.45%
13 11 39.39% 33.33%
4 3 12.12% 9.09% 4.15 I 4.12 I -0.03 1 4 3.03% 12.12%
1) I 1 3.03% 0.00%

21
Question 2. This course should help me advance in rate. The mode answer on the
initial survey was selection 5 (strongly agree) with 55% of the total responses. The end of
course survey mode was selection 5 (strongly agree) with 70% of the total responses. The
mean differential increased by .18 from 4.48 on the initial survey to 4.67 on the end of
course survey.
Question 3. This course should help in the performance of my job. The mode
answer on the initial survey was selection 5 (strongly agree) with 55% of the total
responses. The end of course survey mode was selection 5 (strongly agree) with 58% of
the total responses. The mean differential decreased by -.03 from 4.55 on the initial
survey to 4.52 on the end of course survey. The drop in mean differential is due to a
greater number of responses of selection 3 ( does not apply).
Quality of Life
Question 1. Attending class locally was much easier on me I my family. The mode
answer on the initial survey was selection 5 (strongly agree) with 64% of the total
responses. The end of course survey mode was selection 5 (strongly agree) with 52% of
the total responses. The mean differential decreased by -.30 from 4.45 on the initial
survey to 4.12 on the end of course survey. The drop in mean differential was due to a
greater number of responses of selections 3 ( does not apply) and 2 (I disagree).
Question 2. Transportation was never a problem. The mode answer on the initial
survey was selection 4 (I agree) with 42% of the total responses. The end of course
survey mode was selection 5 (strongly agree) with 52% of the total responses. The mean
differential increased by .21 from 3 .97 on the initial survey to 4.18 on the end of course
survey.

Question 3. Lodging was adequate. The mode answer on the initial survey was
selection 5 (Strongly agree) with 52% of the total responses. The end of course survey
mode was selection 5 (strongly agree) with 46% of the total responses. The mean
differential between the initial and exit survey's was 0.00 with both initial and end of
course mean ratings of 4.15.
22
Question 4. School facilities are comfortable and well laid out. The mode answer
on the initial survey was selection 4 (I agree) with 73% of the total responses. The end of
course survey mode was selection 5 (strongly agree) with 48% of the total responses. The
mean differential increased by .30 from 4.12 on the initial survey to 4.42 on the end of
course survey.
Expectations / End Result
Question 1. This course was I will be relevant to the real world. The mode answer
on the initial survey was selection 4 (I agree) with 67% of the total responses. The end of
course survey mode was selection 4 (I agree) with 52% of the total responses. The mean
differential increased by .30 from 4.00 on the initial survey to 4.30 on the end of course
survey.
Question 2. I will be more marketable due to this course. The mode answer on the
initial survey was selection 4 (I agree) with 67% of the total responses. The end of course
survey mode was selection 5 (Strongly agree) with 45% of the total responses. The mean
differential increased by .12 from 4.15 on the initial survey to 4.27 on the end of course
survey.
Question 3. Attending class locally was I will be better for me financially. The
mode answer on the initial survey was selection 5 (Strongly agree) with 42% of the total

23
responses. The end of course survey mode was selection 5 (Strongly agree) with 45% of
the total responses. The mean differential decreased by -.03 from 4.15 on the initial
survey to 4.12 on the end of course survey. The drop in mean differential was due to a
greater number of responses of selection 2 (I disagree) selections.
Combined
Initial Survey Responses
Table 2 displays the responses unique to the initial survey of the three different
courses combined. Responses were tabulated to determine the percentage each possible
response was chosen and to determine a mean rating for each question. The mean ratings
are based on a scale of 1-5, with selection 5 representing the answer "I strongly agree and
selection 1 representing the answer "I strongly disagree". Additionally, the highlighted
number in the total column depicts the mode (most frequently chosen answer). The open
form responses were compiled and grouped according to the nature of the response.
These groupings were than identified in the table by number ofresponses. The following
is a narrative of the individual responses as depicted in Table 2:
Career Path
Question 1: It was my desire to take this course. The mode was selection 5
(Strongly agree) with 52% of the total responses. The mean was 4.27.
Quality of Life
Question 1: I didn't have any problems finding my classroom (1 st day). The
modes were selections 5 (Strongly agree) and 4 (I agree) with 36% of the total responses
divided between the two. The mean was 3.79.

24
Table 2: Table of survev responses Combined Initial survey unique responses
Legend: Bolded numbers in total column indicate mode ; mean (response average)
QUESTION h"otal Pct% mean
Career Path 1. It was my desire to take this course
Strongly aaree (5) 17 51.52%
I aaree (4) 12 36.36% Does not apply (3) 1 3.03% 4.27
I disagree (2) 2 6.06% I strongly disagree (1) 1 3.03%
Quality of Life - - -1. I didn't have anv problems finding mv classsroom {1st dav) Strongly agree (5) 12 36.36%
I agree (4) 12 36.36% Does not aooly (3) 2 6.06% 3.79
I disagree (2) 4 12.12% I strongly disagree (1) 3 9.09%
2. Gettina settled into the classroom was very comfortable Strongly aaree (5) 11 33.33% I agree (4) 21 63.64%
Does not aoolv (3) 0.00% 4.24
I disaaree (2) 0.00%
I stronaly disaQree (1) 1 3.03% 3. I knew of the uniform & materials reauired ahead of time
Strongly agree (5) 6 18.18%
I aQree (4) 15 45.45%
Does not aooly (3) 1 3.03% 3.39
I disagree (2) 8 24.24%
I stronQIY disagree (1) 3 9.09%

25
Table 2: Table of survey responses Open ended responses initial survev (common)
1. What recommendations do vou have to make the class I check-in process more efficient? a. Better course information(@ TTF BanQor (1) b.Parkina (3) c.Reauired uniform information (1)
d. e. f.
'
2. · If vou could aive one piece of career advice to assist a iunior Person in vour rate what would it be? a.Get as much trainina as possible (3) b.Take oride in vour work (1)
c.Studv hard (6) d.Give 100% effort (2) e.Stav in Iona enouah to take advantaQe of shore duty (1) f.Take resoonsibilitv for your actions/ work (2)
3. Other comments I sunnestions aoolicable to course or instructors: a.Advertise better (1)
b.Authorize civilian clothes (4) c.Verv presentable/ knowledqable instructors (2) d.Offer courses in Everrett (1)
a.Students shouldn't have to stand duty (3)

Question 2: Getting settled into the classroom was very comfortable. The mode
was selection 4 (I agree) with 64% of the total responses. The mean was 4.24.
Question 3: J knew of the uniform and materials required ahead of time. The
mode was 4 (I agree) with 46% of the total responses. The mean was 3.39.
Open - ended responses
Question 1: What recommendations do you have to make the class I check-in
process more efficient? a) Better course information - one response. b) Parking - Three
responses. c) Required uniform information - one response.
26
Question 2: If you could give one piece of career advice to assist a junior person
in your rate, what would it be? a) Get as much training as possible - three responses. b)
Take pride in your work - one response. c) Study hard - six responses. d) Give 100%
effort - two responses. e) Stay in long enough to take advantage of shore duty - one
response. f) Take responsibility for your actions / work - two responses.
Question 3: Other comments I suggestions applicable to course or instructors: a)
Advertise better - one response. b) Authorize civilian clothes - four responses. c) Very
presentable I knowledgeable instructors - two responses. d) Offer courses in Everett, Wa.
- One response. e) Students shouldn't have to stand duty - three responses.
Combined
End of Course Survey Unique Responses
Table 3 displays the responses unique to the end of course survey of the three
different courses combined. Responses were tabulated to determine the percentage each
possible response was chosen and to determine a mean rating for each question. The

27
Table 3: Table of survey responses Combined Exit survey unique responses
Legend: Bolded numbers in total column indicate mode ; mean (response average)
QUESTION Total Pct% mean
Instruction -1. Quality of classroom instruction Stronqly aqree (5) 19 57.58% I aqree (4) 12 36.36% Does not apply (3) 2 6.06% 4.52 I disagree (2) 0.00% I strongly disagree (1) 0.00%
2. Quality of instruction in the laboratory Strongly aqree (5) 16 48.48% I aqree (4) 12 36.36% Does not aooly (3) 4 12.12% 4.30 I disagree (2) 1 3.03% I strongly disagree ( 1) 0.00%
Exit survey open ended responses (common) Imm 1. Other comments specific to course improvement and Quatitv of instruction:
a. Very knowledqeable instructor (3) b. Applying what was learned is very helpful (2) c. Great experience (2) d. Very well done (2) e. All people in the rate should attend the course (2)

28
mean ratings are based on a scale of 1-5, with selection 5 representing the answer "I
strongly agree and selection 1 representing the answer "I strongly disagree".
Additionally, the highlighted number in the total column depicts the mode (most
frequently chosen answer). The open form responses were compiled and grouped
according to the nature of the response. These groupings were than identified in the table
by number ofresponses. The following is a narrative of the individual responses as
depicted in Table 3.
Instruction
Question 1: Quality of classroom instruction. . The mode was selection 5
(Strongly agree) with 58% of the total responses. The mean was 4.52.
Question 2: Quality of instruction in the laboratory. The mode was selection 5
(Strongly agree) with 48% of the total responses. The mean was 4.30.
Open - ended responses
Question 1: Other comments specific to course improvement and quality of
instruction. a) Very knowledgeable instructor - three responses. b) Applying what was
learned is very helpful - two responses. c) Great experiences - two responses. d) Very
well done - two responses. e) All people in the rate should attend the course - two
responses.
Disbursing Clerk Afloat (DK)
Initial/ End of Course Survey Common Responses
Table 4 depicts the responses common to both the initial and end of course
surveys of the Disbursing Clerk Afloat (DK) course. Responses were tabulated to
determine the percentage each possible response was chosen; a mean rating was also

29
DK Afloat initial / end of course surve onses
LeQend: Balded numbers in total column indicate mode ;
QUESTION
3 5 37.50% 62.50% 2 25.00% 12.50% 3.75 4.13 0.38
12.50% 0.00%
2 37.50% 25.00% 0.00% 0.00% 4.63 4.75 0.13 0.00% 0.00%
25.00% 37.50% 0.00% 0.00% 4.75 4.63 -0.13 0.00% 0.00%
5 5 62.50% 62.50% 0.00% 12.50% 4.00 4.13 0.13
12.50% 0.00% 0.00% 0.00%

30
Pct end% m - initial m-end m - diff
3 1 37.50% 12.50%
5 1 62.50% 12.50% 2 6 25.00% 75.00% 5.13 I 3.38 I -1.75
0.00%
0.00%
3 12.50% 37.50% 6 4 75.00% 50.00% 1 1 12.50% 12.50% 4.00 I 4.25 I 0.25
0.00% 0.00%
75.00% 12.50% 3.75 4.00 0.25 0.00%
6 75.00% 75.00%
12.50% 12.50% 4.00 4.00 0.00 0.00% 0.00%
2 2 25.00% 25.00% 2 25.00% 12.50% 4.25 4.13 -0.12
0.00% 12.50%
0.00% 0.00%

31
determined for each question. The mean ratings are based on a scale of 1-5, with
selection 5 representing the answer "I strongly agree and selection 1 representing the
answer "I strongly disagree". The difference of the mean averages from both the initial
and end of course survey are displayed. Additionally, the highlighted number in the total
column depicts the mode (most frequently chosen answer). Following is a description of
the individual responses as depicted in Table 4.
Career Path
Question 1. I plan on reenlisting I extending. The mode answer on the
initial survey was selection 4 (I agree) with 38% of the total responses. The end of course
survey mode was selection 4 (I agree) with 63% of the total responses. The mean
differential increased by .38 from 3.75 on the initial survey to 4.13 on the end of course
survey.
Question 2. This course should help me advance in rate. The mode answer on the
initial survey was selection 5 (strongly agree) with 63% of the total responses. The end of
course survey mode was selection 5 (strongly agree) with 75% of the total responses. The
mean differential increased by .13 from 4.63 on the initial survey to 4.75 on the end of
course survey.
Question 3. This course should help in the performance of my job. The mode
answer on the initial survey was selection 5 (strongly agree) with 75% of the total
responses. The end of course survey mode was selection 5 (strongly agree) with 63% of
the total responses. The mean differential decreased by-.13 from 4.75 on the initial
survey to 4.63 on the end of course survey. The drop in mean differential is due to a
greater number of responses of selection 4 (I agree).

32
Quality of Life
Question 1. Attending class locally was much easier on me I my family. The mode
answer on the initial survey was selection 5 (strongly agree) with 63% of the total
responses. The end of course survey mode was selection 5 (strongly agree) with 63% of
the total responses. The mean differential between the initial and exit survey's was 0.00
with both initial and end of course mean ratings of 4.38.
Question 2. Transportation was never a problem. The mode answer on the initial
survey was selection 4 (I agree) with 63% of the total responses. The end of course
survey mode was selection 5 (strongly agree) with 63% of the total responses. The mean
differential increased by .13 from 4.00 on the initial survey to 4.13 on the end of course
survey.
Question 3. Lodging was adequate. The mode answer on the initial survey was
selection 4 (I agree) with 63% of the total responses. The end of course survey mode was
selection 3 (Does not apply) with 75% of the total responses. The mean differential
between the initial and exit survey's was -1.75. The drop in mean differential was due to
a greater number ofresponses of selection 3 (Does not apply).
Question 4. School facilities are comfortable and well laid out. The mode answer
on the initial survey was selection 4 (I agree) with 75% of the total responses. The end of
course survey mode was selection 4 (strongly agree) with 50% of the total responses. The
mean differential increased by .25 from 4.00 on the initial survey to 4.25 on the end of
course survey.

33
Expectations / End Result
Question 1. This course was I will be relevant to the real world. The mode answer
on the initial survey was selection 4 (I agree) with 75% of the total responses. The end of
course survey mode was selection 4 (I agree) with 75% of the total responses. The mean
differential increased by .25 from 3.75 on the initial survey to 4.00 on the end of course
survey.
Question 2. I will be more marketable due to this course. The mode answer on the
initial survey was selection 4 (I agree) with 75% of the total responses. The end of course
survey mode was selection 5 (Strongly agree) with 75% of the total responses. The mean
differential was 0.00 with both initial and end of course mean ratings of 4.00.
Question 3. Attending class locally was I will be better for me financially. The
mode answer on the initial survey was selection 5 (Strongly agree) with 50% of the total
responses. The end of course survey mode was selection 5 (Strongly agree) with 50% of
the total responses. The mean differential decreased by -.12 from 4.25 on the initial
survey to 4.13 on the end of course survey. The drop in mean differential was due to a
greater number of responses of selection 2 (I disagree).
Disbursing Clerk Afloat (DK)
Initial Survey Unique Responses
Table 5 displays the responses unique to the initial survey of the Disbursing Clerk
Afloat (DK) course. Responses were tabulated to determine the percentage each possible
response was chosen and to determine a mean rating for each question. The mean ratings
are based on a scale of 1-5, with selection 5 representing the answer "I strongly agree and
selection 1 representing the answer "I strongly disagree". Additionally, the highlighted

34
Table 5: Table of survey responses DK Afloat Initial survev uniaue resoonses
Legend: Bolded numbers in total column indicate mode; mean (response averaae)
QUESTION Total Pct% mean
Career Path mm 1. It was mv desire to take this course
Stronalv aaree (5) 5 62.50% I aqree (4) 2 25.00% Does not aoolv (3) 0.00% 4.38
I disaaree (2) 1 12.50% I stronaly disaaree (1) 0.00%
Quality of Life mm 1. I didn't have any problems findinQ mv classsroom (1st dav)
Stronalv aaree (5) 5 62.50% I aaree (4) 3 37.50% Does not apply (3) 0.00% 4.63 I disaaree (2) 0.00% I stronaly disaaree (1) 0.00%
2. Gettina settled into the classroom was verv comfortable StronalY aaree (5) 3 37.50% I aaree (4) 5 62.50% Does not apply (3) 0.00% 4.38 I disagree (2) -· 0.00% I strongly disaaree (1) 0.00%
3. I knew of the uniform & materials required ahead of time StronalY aaree (5) 1 12.50%
I agree (4) 7 87.50%
Does not apply (3) 0.00% 4.13
I disaaree (2) 0.00%
I stronaly disaaree (1) 0.00%
35
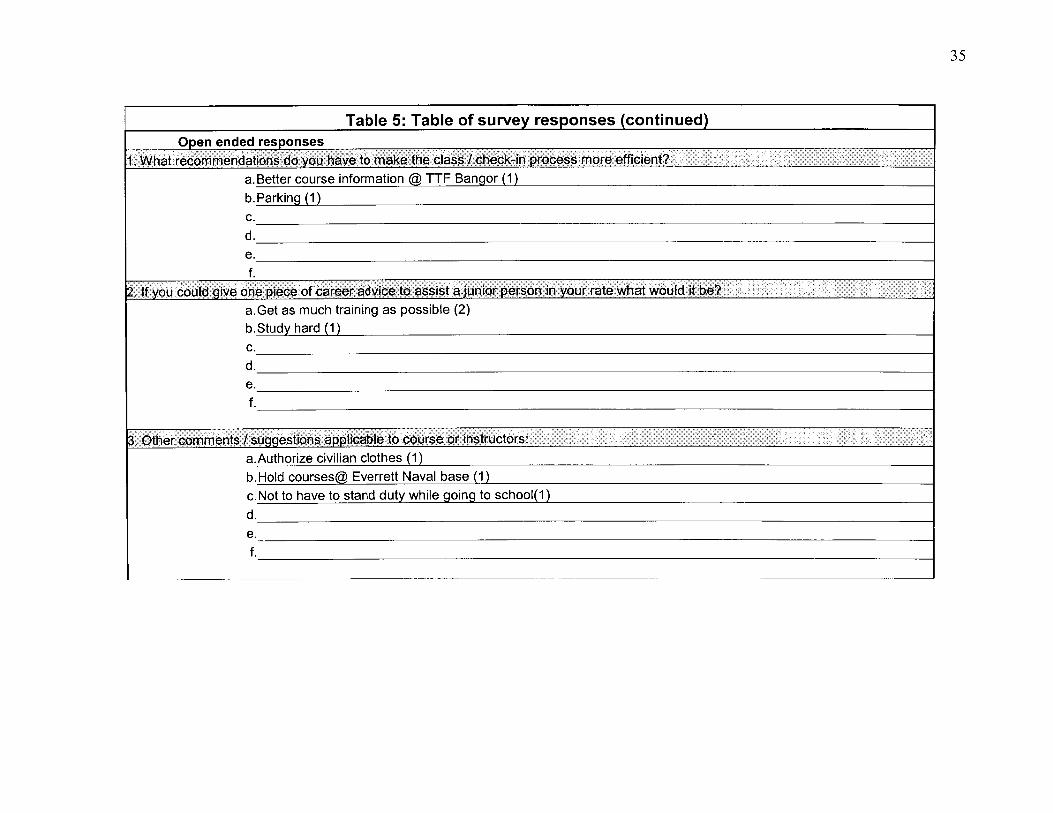
Table 5: Table of survey responses (continued) Open ended responses
1. What recommendations do vou have to make the class I check-in process more efficient? a.Better course information@ TTF Bangor (1)
b.Parkina (1)
C.
d. e.
f. 2. If vou could aive one oiece ofcareer advice to assist a junior oerson in vour rate what would it be?
a.Get as much training as possible (2) b.Studv hard (1)
C.
d. e. f.
3. Other comments I sunnestions aoolicable to course or instructors: a.Authorize civilian clothes (1) b.Hold courses@ Everrett Naval base (1)
c. Not to have to stand duty while going to school(1)
d.
e.
f.
__ " ____ .. - ---------~------·--···

36
number in the total column depicts the mode (most frequently chosen answer). The open
form responses were compiled and grouped according to the nature of the response.
These groupings were than identified in the table by number of responses. The following
is a narrative of the individual responses as depicted in Table 5.
Career Path
Question 1: It was my desire to take this course. The mode was selection 5
(Strongly agree) with 63% of the total responses. The mean was 4.38.
Quality of Life
Question 1: I didn't have any problems finding my classroom (1 st day). The mode
was selection 5 (Strongly agree) with 63% of the total responses. The mean was 4.63.
Question 2: Getting settled into the classroom was very comfortable. The mode
was selection 4 (I agree) with 63% of the total responses. The mean was 4.38.
Question 3: I knew of the uniform and materials required ahead of time. The
mode was selection 4 (I agree) with 86% of the total responses. The mean was 4.13.
Open - ended responses
Question 1: What recommendations do you have to make the class I check-in
process more efficient? a) Better course information at TTF Bangor - one response. b)
Parking - one response.
Question 2: If you could give one piece of career advice to assist a junior person
in your rate, what would it be? a) Get as much training as possible - two responses. b)
Study hard - one response.

37
Question 3: Other comments I suggestions applicable to course or instructors: a)
Authorize civilian clothes- one response. b) Offer courses in Everett, Wa .- One
response. e) Students shouldn't have to stand duty- One response.
Disbursing Clerk Afloat (DK)
End of Course Survey Unique Responses
Table 6 displays the responses unique to the Disbursing Clerk Afloat (DK) end of
course surveys. Responses were tabulated to determine the percentage each possible
response was chosen and to determine a mean rating for each question. The mean ratings
are based on a scale of 1-5, with selection 5 representing the answer "I strongly agree and
selection 1 representing the answer "I strongly disagree". Additionally, the highlighted
number in the total column depicts the mode (most frequently chosen answer). The open
form responses were compiled and grouped according to the nature of the response.
These groupings were than identified in the table by number of responses. The following
is a narrative of the individual responses as depicted in Table 6:
Instruction
Question 1: Quality of classroom instruction . . The mode was selection 5
(Strongly agree) with 63% of the total responses. The mean was 4.63.
Question 2: Quality of instruction in the laboratory. The mode was selection 5
(Strongly agree) with 38% of the total responses. The mean was 4.00.
Open - ended responses
Question 1: Other comments specific to course improvement and quality of
instruction. a) Very knowledgeable instructor - one response. b) Applying what was
learned is very helpful - one response. c) Great school - one response.

38
Table 6: Table of survey responses DK Afloat exit survey unique responses
Legend: Bolded numbers in total colum, indicate mcx:le ; mean (response averaae) QUESTION Total Pct% mean
Instruction -1 ~ Q.Jality of dassroom instruction Strongly aaree (5) 5 62.50% I aaree (4) 3 37.50%
Does not aoolv (3) 0.00% 4.63 I disaoree (2) 0.00%
I strongly disaaree ( 1) 0.00% 2. Quality of instruction in the laboratory
Strongly aaree (5) 3 37.50% I aaree (4) 2 25.00% Does not apply (3) 3 37.50% 4.00 I disaoree (2) 0.00% I strongly disagree ( 1) 0.00%
Open ended responses ~m 1. Othercx:xm,ents soecific to course irrprovement and quality of instruction:
/
a. Very kllOV'Jiedaable i nstrudor ( 1) b. Great school (1) c. Doing the various forms everyday was a great way of applying \Mlat we had learned ( 1)

39
Food Service Administration (FSA)
Initial/ End of Course Survey Common Responses
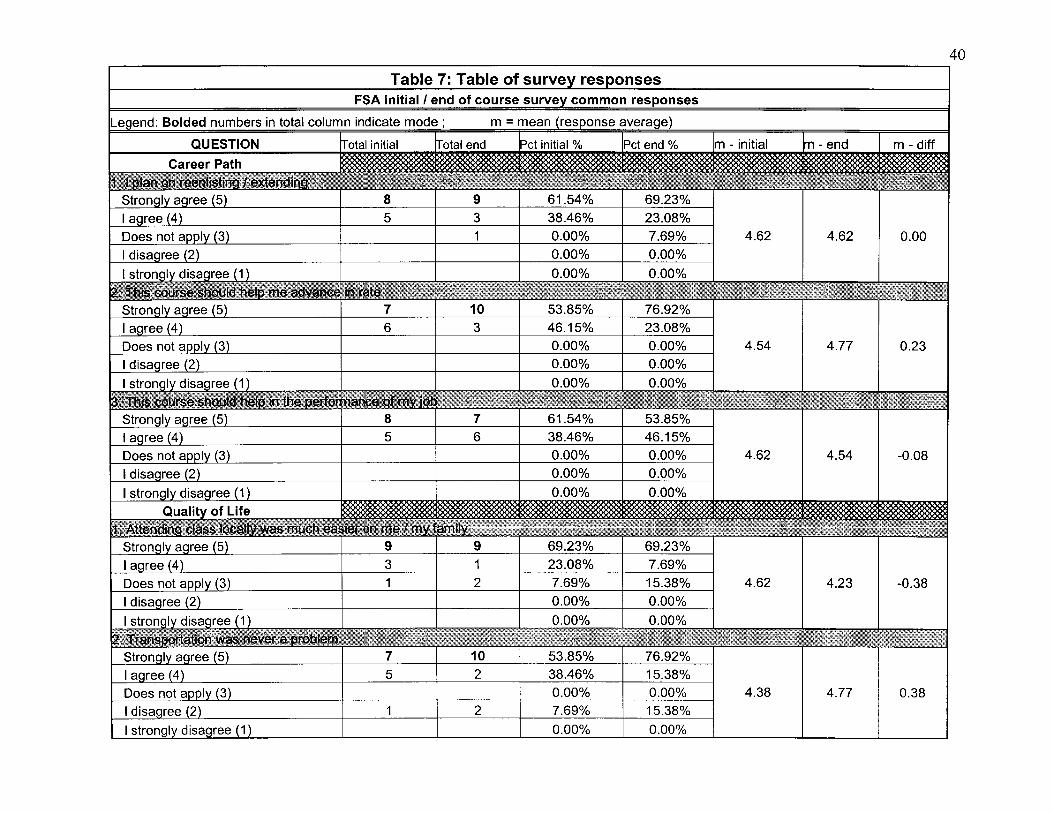
Table 7 depicts the responses common to both the initial and end of course
surveys of the Food Service Administration (FSA) course. Responses were tabulated to
determine the percentage each possible response was chosen; a mean rating was also
determined for each question. The mean ratings are based on a scale of 1-5, with
selection 5 representing the answer "I strongly agree and selection 1 representing the
answer "I strongly disagree". The difference of the means from both the initial and end
of course survey are displayed. Additionally, the highlighted number in the total column
depicts the mode (most frequently chosen answer). Following is a description of the
individual responses as depicted in Table 7.
Career Path
Question 1. I plan on reenlisting I extending. The mode answer on the initial
survey was selection 5 (Strongly agree) with 62% of the total responses. The end of
course survey mode was selection 5 (strongly agree) with 69% of the total responses. The
mean differential increased by 0.00 with both initial and end of course mean ratings of
4.62.
Question 2. This course should help me advance in rate. The mode answer on the
initial survey was selection 5 (strongly agree) with 54% of the total responses. The end of
course survey mode was selection 5 (strongly agree) with 77% of the total responses. The
mean differential increased by .23 from 4.54 on the initial survey to 4.77 on the end of
course survey.
40
FSA initial / end of course survey common res_eonses
Le_g_end: Bolded numb_t3rs in total column indicate mode; m = mean (response average)
QUESTION
38.46% 23.08% 0.00% 7.69% 4.62 4.62 0.00 0.00% 0.00%
46.15% 23.08% 0.00% 0.00% 4.54 4.77 0.23 0.00% 0.00%
38.46% 46.15%
0.00% 0.00% 4.62 4.54 -0.08 0.00% 0.00%
7.69%
15.38% 4.62 4.23 -0.38 0.00%
5 2 38.46% 15.38% 0.00% 0.00% 4.38 4.77 0.38
2 7.69% 15.38%
0.00% 0.00%

41
Pct end% Im - initial - end m - diff
8 8 61.54% 61.54% 2 5 15.38% 38.46% 3 23.08% 0.00% 4.38 4.62 0.23
0.00% 0.00%
69.23% 38.46% 0.00% 7.69% 4.31 4.46 0.15 0.00% 0.00%
10 6 76.92% 2 0.00%
0.00%
30.77% 15.38% 4.38 4.38 0.00 0.00%
4 46.15% 30.77% 0.00% 7.69% 4.54 4.31 -0.23 0.00% 7.69%
0.00% 0.00%
42
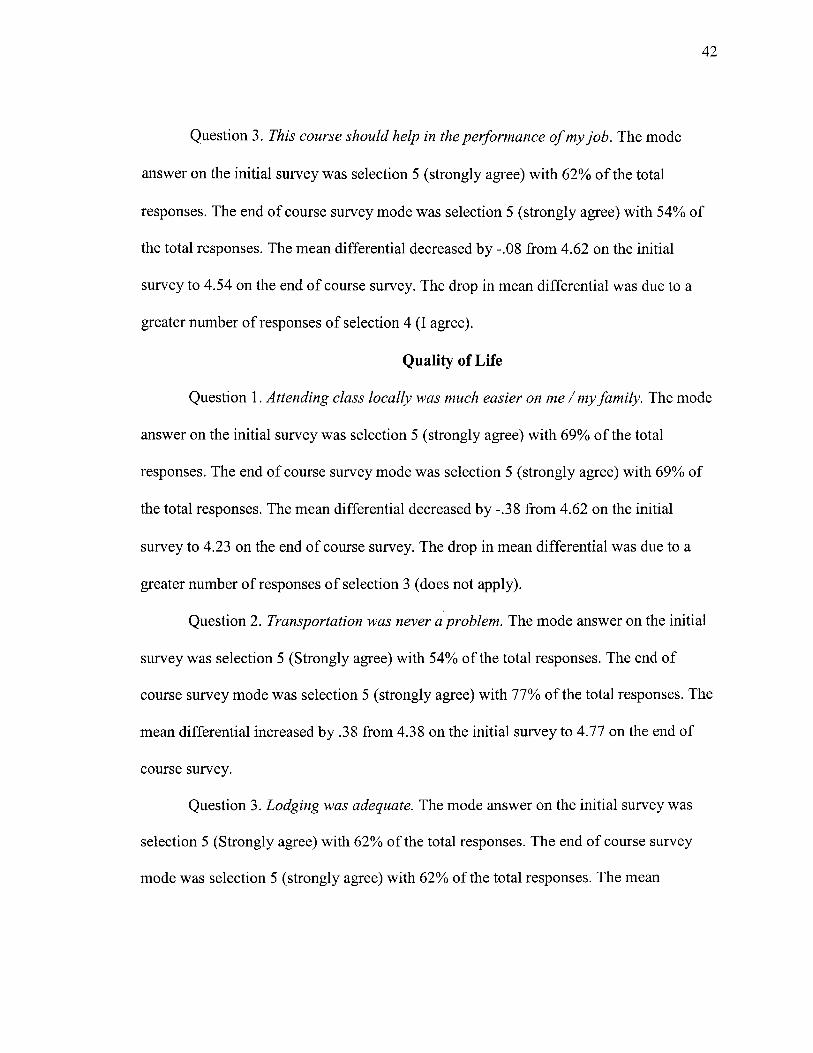
Question 3. This course should help in the performance of my job. The mode
answer on the initial survey was selection 5 (strongly agree) with 62% of the total
responses. The end of course survey mode was selection 5 (strongly agree) with 54% of
the total responses. The mean differential decreased by -.08 from 4.62 on the initial
survey to 4.54 on the end of course survey. The drop in mean differential was due to a
greater number of responses of selection 4 (I agree).
Quality of Life
Question 1. Attending class locally was much easier on me I my family. The mode
answer on the initial survey was selection 5 (strongly agree) with 69% of the total
responses. The end of course survey mode was selection 5 (strongly agree) with 69% of
the total responses. The mean differential decreased by -.38 from 4.62 on the initial
survey to 4.23 on the end of course survey. The drop in mean differential was due to a
greater number of responses of selection 3 ( does not apply).
Question 2. Transportation was never a problem. The mode answer on the initial
survey was selection 5 (Strongly agree) with 54% of the total responses. The end of
course survey mode was selection 5 (strongly agree) with 77% of the total responses. The
mean differential increased by .38 from 4.38 on the initial survey to 4.77 on the end of
course survey.
Question 3. Lodging was adequate. The mode answer on the initial survey was
selection 5 (Strongly agree) with 62% of the total responses. The end of course survey
mode was selection 5 (strongly agree) with 62% of the total responses. The mean

differential increased by .23 from 4.38 on the initial survey to 4.62 on the end of course
survey.
43
Question 4. School facilities are comfortable and well laid out. The mode answer
on the initial survey was selection 4 (I agree) with 69% of the total responses. The end of
course survey mode was selection 5 (strongly agree) with 54% of the total responses. The
mean differential increased by .15 from 4.31 on the initial survey to 4.46 on the end of
course survey.
Expectations / End Result
Question 1. This course was I will be relevant to the real world. The mode answer
on the initial survey was selection 4 (I agree) with 77% of the total responses. The end of
course survey mode was selection 4 (I agree) with 46% of the total responses. The mean
differential was 0.00 with both initial and end of course mean ratings of 4.23.
Question 2. I will be more marketable due to this course. The mode answer on the
initial survey was selection 4 (I agree) with 62% of the total responses. The end of course
survey mode was selection 5 (Strongly agree) with 54% of the total responses. The mean
differential was 0.00 with both initial and end of course mean ratings of 4.38.
Question 3. Attending class locally was I will be better for me financially. The
mode answer on the initial survey was selection 5 (Strongly agree) with 54% of the total
responses. The end of course survey mode was selection 5 (Strongly agree) with 54% of
the total responses. The mean differential decreased by -.23 from 4.54 on the initial
survey to 4.31 on the exit survey. The drop in mean differential was due to a greater
number ofresponses of selections 3 (Does not apply) and 2 (I disagree).

Food Service Administration (FSA)
Initial Survey Unique Responses
44
Table 8 displays the responses unique to the initial survey of the Food Service
Administration (FSA) course. Responses were tabulated to determine the percentage that
each possible response was chosen and to determine a mean rating for each question. The
mean ratings are based on a scale of 1-5, with selection 5 representing the answer "I
strongly agree and selection 1 representing the answer "I strongly disagree".
Additionally, the highlighted number in the total column depicts the mode (most
frequently chosen answer). The open form responses were compiled and grouped
according to the nature of the response. These groupings were than identified in the table
by number ofresponses. The following is a narrative of the individual responses as
depicted in Table 8.
Career Path
Question 1: It was my desire to take this course. The mode was selection 5
(Strongly agree) with 54% of the total responses. The mean was 4.31.
Quality of Life
Question 1: I didn't have any problems finding my classroom (1 st day). The mode
was selection 5 (Strongly agree) with 38% of the total responses. The mean was 3.77.
Question 2: Getting settled into the classroom was very comfortable. The mode
was selection 4 (I agree) with 69% of the total responses. The mean was 4.31.
Question 3: I knew of the uniform and materials required ahead of time. The
mode was 2 (I disagree) with 38% of the total responses. The mean was 3.46.

45
Table 8: Table of survey responses FSA Initial survey unique responses
Legend: Bolded numbers in total column indicate mode ; mean (response average)
QUESTION Total Pct% mean
Career Path ~ -1. It was mv desire to take this course Stronqly aqree (5) 7 53.85% I aqree (4) 5 38.46% Does not apply (3) 0.00% 4.31 I disagree (2) 0.00% I strongly disaqree (1) 1 7.69%
Quality of Life -1. I didn't have any problems findina mv classsroom (1st dav) -
Strongly agree (5) 5 38.46% I aqree (4) 3 23.08% Does not apply (3) 2 15.38% 3.77 I disagree (2) 3 23.08% I strongly disaqree (1) 0.00%
2. Gettinq settled into the classroom was very comfortable StronQIY aQree (5) 4 30.77% I agree (4) 9 69.23% Does not apply (3) 0.00% 4.31 I disaqree (2) 0.00% I stronQIY disaQree (1) 0.00%
3. I knew of the uniform &materials reauired ahead of time Strongly agree (5) 4 30.77% I agree (4) 3 23.08% Does not apply (3) 1 7.69% 3.46 I disaqree (2) 5 38.46% I stronQly disagree (1) 0.00%

46
Table 8: Table of survey responses (continued) Open ended responses
1. What recommendations do you have to make the class I check*in orocess more efficient? a. Better course information@ TTF Banaor (1) b.Parking (3) C.
d. e. f.
r2. If you could give one oiece of career advice to assist a iunior oerson in vour rate what would it be? a.Get as much trainina as possible (1)
b. Do the job right the first time(1) c.Study hard (4) d.Stav in Iona enouah to ao to shore dutv (1) e. Take responsibility (1) f.
3. Other comments I suaaestions aoolicable to course or instructors: a. Instructor was very presentable and knowledgable (1) b.Authorize civilian clothes (1) c.Advertise the course better (1) d. e. f.

Open - ended responses
Question 1: What recommendations do you have to make the class I check-in
process more efficient? a) Better course information - one response. b) Parking - Three
responses.
47
Question 2: If you could give one piece of career advice to assist a junior person
in your rate, what would it be? a) Get as much training as possible - one response. b)
Study hard - four responses. d) Stay in long enough to take advantage of shore duty - one
response. f) Take responsibility for your actions / work - one responses.
Question 3: Other comments I suggestions applicable to course or instructors: a)
Advertise better - one response. b) Authorize civilian clothes - one response. c) Very
presentable/ knowledgeable instructors - one response.
Food Service Administration (FSA)
End of Course Survey Unique Responses
Table 9 displays the responses unique to the end of course survey of the Food
Service Administration (FSA) course. Responses were tabulated to determine the
percentage each possible response was chosen and to determine a mean rating for each
question. The mean ratings are based on a scale of 1-5, with selection 5 representing the
answer "I strongly agree and selection 1 representing the answer "I strongly disagree".
Additionally, the highlighted number in the total column depicts the mode (most
frequently chosen answer). The open form responses were compiled and grouped
according to the nature of the response. These groupings were than identified in the table
by number ofresponses. The following is a narrative of the individual responses as
depicted in Table 9.

48
Table 9: Table of survey responses FSA end of course survey unique responses
ncl: Bolded numbers in total column indicate mode; mean (response average)
QUESTION -ct% I mean
7 53.85% 6 46.15%
0.00% I 4.54 0.00% 0.00%
7 53.85% 6 46.15%
Does not 0.00% I 4.54 I disaoree (2 0.00% I strongly disagree ( 1) 0.00%
Open ended resoonses 1. Other oorrments specific to rourse improvement and quality of instruction:
a. NAV SUP 486 is inoomplete and not up-to date (1) b. 5 VI.eek format V1,0Uld 'M)J"!< better ( 1 · c. Take a full day on the FSM portion (1) d. lndude information on sanitation from manual P 5010 (1) e. fvlore parking (2) f. Ovilian dothes (2) g. Mr. Puniesto knovvs the subject veryvvell,_ outstanding job! (1)

49
Instruction
Question 1: Quality of classroom instruction. The mode was selection 5 (Strongly
agree) with 54% of the total responses. The mean was 4.54.
Question 2: Quality of instruction in the laboratory. The mode was selection 5
(Strongly agree) with 54% of the total responses. The mean was 4.54.
Open - ended responses
Question 1: Other comments specific to course improvement and quality of
instruction. a) Very knowledgeable instructor - one response. b) NA V SUP 486 is
incomplete and not up-to-date - one response. c) A five - week format would work better
- one response. d) Include information on sanitation from manual P 5010 - one response.
e) More parking - two responses. f) Civilian clothes - two responses. g) Take a full day
on the FSM portion - one response.
General Mess Operations (GMO)
Initial/ End of Course Survey Common Responses
Table 10 depicts the responses common to both the initial and end of course
surveys of the General Mess Operations (GMO) course. Responses were tabulated to
determine the percentage each possible response was chosen; a mean rating was also
determined for each question. The mean ratings are based on a scale of 1-5, with
selection 5 representing the answer "I strongly agree and selection 1 representing the
answer "I strongly disagree". The difference of the mean from both the initial and end of
course survey are displayed. Additionally, the highlighted number in the total

50
LeQend: Bolded numbers in total column indicate mode ;
QUESTION
7 58.33% 33.33%
8.33% 8.33% 3.42 4.50 1.08 2 16.67% 0.00%
33.33% 8.33% 4.33 4.50 0.17 0.00%
66.67% 25.00% 0.00% 16.67% 4.33 4.42 0.08 0.00% 0.00%
5 25.00% 2 8.33% 2 8.33%
4 I 3 I 33.33% 25.00% 0.00% 8.33% 3.50 3.83 I 0.33
2 3 16.67% 25.00% 1) 2 16.67% 0.00%

51
Continued Pct end% Im - initial Im -end I m -diff
6 6 50.00% 50.00% I I
2 3 16.67% 25.00% 2 2 16.67% 16.67% I 3.92 I 4.17 I 0.25 1 1 8.33% 8.33%
9 6 75.00% 50.00% 8.33% 0.00% 4.08 4.50 0.42
0.00% 0.00%
6 5 50.00% 41.67% 0.00% 0.00% 3.92 4.58 0.67 8.33% 0.00%
25.00%
8.33% 4.00 4.33 0.33 8.33%
5 5 41.67% 41.67% 2 16.67% 8.33% 3.67 3.92 0.25
2 8.33% 16.67%
8.33% 0.00%

52
column depicts the mode (most frequently chosen answer). Following is a description of
the individual responses as depicted in Table 10.
Career Path
Question 1. I plan on reenlisting I extending. The mode answer on the initial
survey was selection 4 (I agree) with 45% of the total responses. The end of course
survey mode was selection 5 (strongly agree) with 58% of the total responses. The mean
differential increased by 1.08 from 3.42 on the initial survey to 4.50 on the end of course
survey.
Question 2. This course should help me advance in rate. The mode answer on the
initial survey was selection 5 (strongly agree) with 50% of the total responses. The end of
course survey mode was selection 5 (strongly agree) with 58% of the total responses. The
mean differential increased by .17 from 4.33 on the initial survey to 4.50 on the end of
course survey.
Question 3. This course should help in the performance of my job. The mode
answer on the initial survey was selection 4 (I agree) with 67% of the total responses. The
end of course survey mode was selection 5 (strongly agree) with 58% of the total
responses. The mean differential increased by .09 from 4.33 on the initial survey to 4.42
on the end of course survey.
Quality of Life
Question 1. Attending class locally was much easier on me I my family. The mode
answer on the initial survey was selection 5 (strongly agree) with 58% of the total
responses. The end of course survey mode was selection 4 (I agree) with 42% of the total
responses. The mean differential decreased by -.58 from 4.33 on the initial survey to 3.75

53
on the end of course survey. The drop in mean differential was due to a greater number of
responses of selections 3 ( does not apply) and 2 (I disagree).
Question 2. Transportation was never a problem. The mode answers on the initial
survey were selections 5 (Strongly agree) and 4 (I agree) with 33% of the total responses.
The end of course survey mode was selection 5 (strongly agree) with 42% of the total
responses. The mean differential increased by .33 from 3.50 on the initial survey to 3.83
on the end of course survey.
Question 3. Lodging was adequate. The mode answer on the initial survey was
selection 5 (Strongly agree) with 50% of the total responses. The end of course survey
mode was selection 5 (strongly agree) with 50% of the total responses. The mean
differential increased by .25 from 3.92 on the initial survey to 4.17 on the end of course
survey.
Question 4. School facilities are comfortable and well laid out. The mode answer
on the initial survey was selection 4 (I agree) with 75% of the total responses. The end of
course survey modes were selections 5 (strongly agree) and 4 (I agree) with 50% of the
total responses. The mean differential increased by .42 from 4.08 on the initial survey to
4.50 on the end of course survey.
Expectations / End Result
Question 1. This course was I will be relevant to the real world. The mode answer
on the initial survey was selection 4 (I agree) with 50% of the total responses. The end of
course survey mode was selection 5 (Strongly agree) with 58% of the total responses.
The mean differential increased by .67 from 3.92 on the initial survey to 4.58 on the end
of course survey.

54
Question 2. I will be more marketable due to this course. The mode answer on the
initial survey was selection 4 (I agree) with 67% of the total responses. The end of course
survey mode was selection 5 (Strongly agree) with 58% of the total responses. The mean
differential increased by .33 from 4.00 on the initial survey to 4.33 on the end of course
survey.
Question 3. Attending class locally was I will be better for me financially. The
mode answer on the initial survey was selection 4 (I agree) with 42% of the total
responses. The end of course survey mode was selection 4 (I agree) with 42% of the total
responses. The mean differential increased by .25 from 3.67 on the initial survey to 3.92
on the end of course survey.
General Mess Operations (GMO)
Initial Survey Unique Responses
Table 11 displays the responses unique to the initial survey of the General Mess
Operations (GMO) course. Responses were tabulated to determine the percentage each
possible response was chosen and to determine a mean rating for each question. The
mean ratings are based on a scale of 1-5, with selection 5 representing the answer "I
strongly agree and selection 1 representing the answer "I strongly disagree".
Additionally, the highlighted number in the total column depicts the mode (most
frequently chosen answer). The open form responses were compiled and grouped
according to the nature of the response. These groupings were than identified in the table
by number ofresponses. The following is a narrative of the individual responses as
depicted in Table 11.

55
Table 11: Table of survev responses GMO Initial survey unique responses
Legend: Bolded numbers in total column indicate mode ; mean (response averaae)
QUESTION • I Pct% Mean
Career Path - --1. It was mv desire to take this course Stronqlv aqree (5) 5 41.67% I aqree (4) 5 41.67% Does not apply (3) 1 8.33% 4.17
I disagree (2) 1 8.33% I stronalv disaaree (1) 0.00%
Quality of Life - - m LAJ(,J\Jv
1. I didn't have any problems finding my classsroom (1st dav) Strongly agree (5) 2 16.67% I aqree (4) 6 50.00% Does not apply (3) 0.00% 3.25
I disagree (2) 1 8.33% I strongly disaaree (1) 3 25.00%
2. Gettina settled into the classroom was very comfortable Strongly aqree (5) 4 33.33% I agree (4) 7 58.33% Does not aoolv (3) 0.00% 4.08
I disaqree (2) 0.00% I stronalv disaqree (1) 1 8.33%
3. I knew of the uniform & materials reouired ahead of time Strongly agree (5) 1 8.33%
I aqree (4) 5 41.67%
Does not aoolv (3) 0.00% 2.83
I disagree (2) 3 25.00%
I strongly disagree (1) 3 25.00%

56
Table 11: Table of survey responses (continued) Open ended responses 1. What recommendations do vol.I have to make the class I check-in orocess more efficient?
a. Better course information (ci) TTF Banqor ( 1)
b.Parkinq (1)
c. Reau ired uniform information (1)
d.
e.
f. 2. If you could qive one piece of career advice to assist a iunior person in your rate what would if be?
a.Get as much training as possible (1)
b.Take oride in vour work (1)
c. Studv hard ( 1) d.Give 100% effort (2)
e.
f.
13. Other comments / suaaestions anolicable to course or instructors: a.Offer better student lunches (3)
b.Authorize civilian clothes (1)
C.
d.
e.
f.

Career Path
Question 1: It was my desire to take this course. The mode selections were 5
(Strongly agree) and 4 (I agree) with 42% of the total responses. The mean was 4.17.
Quality of Life
57
Question 1: I didn't have any problems finding my classroom (1 st day). The mode
was selection 4 (I agree) with 50% of the total responses divided between the two. The
mean was 3.25.
Question 2: Getting settled into the classroom was very comfortable. The mode
was selection 4 (I agree) with 58% of the total responses. The mean was 4.08.
Question 3: / knew of the uniform and materials required ahead of time. The
mode was 4 (I agree) with 42% of the total responses. The mean was 2.83.
Open - ended responses
Question 1: What recommendations do you have to make the class I check-in
process more efficient? a) Better course information - one response. b) Parking - one
response. c) Required uniform information - one response.
Question 2: If you could give one piece of career advice to assist a junior person
in your rate, what would it be? a) Get as much training as possible - one response. b)
Take pride in your work - one response. c) Study hard - six responses. d) Give 100%
effort - two responses
Question 3: Other comments I suggestions applicable to course or instructors: a)
Offer better student lunches - three responses. b) Authorize civilian clothes - one
response.

General Mess Operations (GMO)
End of Course Survey Unique Responses
58
Table 12 displays the responses unique to the end of course survey of the General
Mess Operations (GMO) course. Responses were tabulated to determine the percentage
each possible response was chosen and to determine a mean rating for each question. The
mean ratings are based on a scale of 1-5, with selection 5 representing the answer "I
strongly agree and selection 1 representing the answer "I strongly disagree".
Additionally, the highlighted number in the total column depicts the mode (most
frequently chosen answer). The open form responses were compiled and grouped
according to the nature of the response. These groupings were then identified in the table
by number of responses. The following is a narrative of the individual responses as
depicted in Table 12.
Instruction
Question 1: Quality of classroom instruction. The mode was selection 5
(Strongly agree) with 58% of the total responses. The mean was 4.42.
Question 2: Quality of instruction in the laboratory. The mode was selection 5
(Strongly agree) with 50% of the total responses. The mean was 4.25.
Open - ended responses
Question 1: Other comments specific to course improvement and quality of
instruction. a) Course should be longer, 7-8 weeks - two responses. b) Very well done -
two responses. c) Great experience - one response. d) All Mess Specialists should attend
the course - one response.
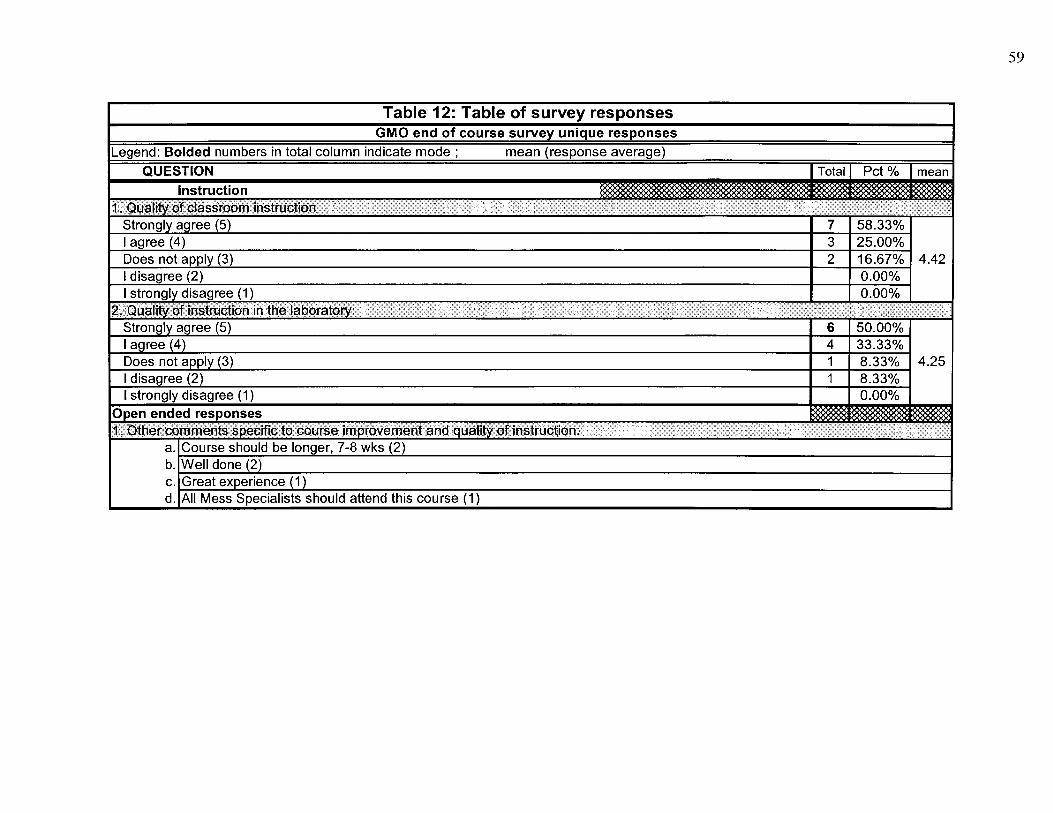
59
Table 12: Table of survey responses GMO end of course survey unique responses
Legend: Bolded numbers in total column indicate mode ; mean (response average)
QUESTION Total Pct% mean
Instruction 1 . Quality of classroom instruction
Strongly agree (5) 7 58.33% I agree (4) 3 25.00% Does not apply (3) 2 16.67% 4.42 I disagree (2) 0.00% I strongly disagree (1) 0.00%
2. Quality of instruction in the laboratory Strongly agree (5) 6 50.00% I agree (4) 4 33.33% Does not apply (3) 1 8.33% 4.25 I disagree (2) 1 8.33% I strongly disagree (1) 0.00%
Open ended responses ---1. Other comments specific to course improvement and quality of instruction: a. Course should be longer, 7-8 wks (2) b. Well done (2) C. Great experience (1) d. All Mess Specialists should attend this course (1)

60
Summary
Chapter IV illustrated the findings of this study by utilizing 12 tables compiling
information from the two surveys given to 33 students who have actively participated in
the Navy's Non-Traditional training program in the Pacific Northwest. In Chapter V, the
research will be summarized, conclusions of the data gathered will be presented, and
recommendations will be given on how the research can be of value to course managers
and instructors.

CHAPTERV
SUMMARY, CONCLUSIONS AND RECOMMENDATIONS
The purpose of this study was to determine the effectiveness of Non-Traditional
training as it applies to the personnel of the U.S. Navy who have utilized this service in
the Pacific Northwest Region. This chapter summarizes the procedures used in the
research study, draws conclusions based on the findings of the study, and provides
recommendations supported by the research findings.
Summary
61
The ultimate goal of Non-Traditional training is to provide diverse and cost
effective training while at the same time improving the sailor's quality of living. The
more training that sailors can attain, the better their performance will be on the job.
Along with improved performance, possibilities for advancements will be increased
because the primary means of advancement within the Navy is based on advancement
test scores. With advancement, comes increased pay, which generally coincides with an
improved attitude towards the job and the Navy as a whole. The thrust of the Navy at
present is to put every effort towards the retention of its most productive sailors. What
this means is a "win-win" situation between the individual and the Navy. In order for this
to occur, the Navy needs to make a concentrated effort at improving the chances for
meaningful, affordable and convenient training. Tracking the effectiveness of this local
Non-Traditional training is vital toward providing these needs efficiently and effectively.
Due in large part to the success of the Non-Traditional training program, a new
program is beginning to surface. This program is called Task Force EXCEL. It is

62
intended to challenge and revise the way the Navy trains its sailors through every step of
their career. The goal is to make the Navy highly regarded as the employer of choice.
The survey instruments used in this study were designed with extensive input
from both the course managers and instructors. The intent of having both an initial course
survey and an end of course survey was to ascertain behavioral and attitudinal changes
from exposure to the course material and instruction. In order to attain a well-rounded
estimation, the surveys were segmented into three primary categories. The first category
included questions on the intended career path and the students' thoughts on how the
course might assist in advancement. The second category concentrated on quality of life
issues that might be impacting student learning. The final category focused on
expectations and end results, depending on whether it was an initial or exit survey. The
questions concentrated on relevance and self-improvement. There were also several
open-ended questions, allowing the students to freely express their opinions. Of the 66
surveys the researcher personally administered, 66 were returned.
Conclusions
Utilizing the data collected through this research study, several conclusions can be
made based on the research goals of this study.
1. Should completion of Non-Traditional training enhance rating
advancement?
It is the conclusion of this study that Navy Non-Traditional training will indeed
enhance rating advancement of its participants. The initial survey concerning this
question was answered strongly agree by 55.55 percent of the participants. When asked
the same question on the end of course survey, the result in the strongly agree category

63
advanced to 69.70 percent. Additionally, the mean differential between initial and end of
course surveys increased by .18 to 4.67 of a possible 5 ( 5 = strongly agree, 1 = strongly
disagree).
2. Does attendance of local Non-Traditional training effect the student's quality
of life?
The study concludes that students are satisfied with the quality of life issues
questioned on both of the surveys. The mean ratings of the four questions in this section
of the survey were 4.23 of a possible 5 (5 = strongly agree, 1 = strongly disagree).
However, there was a slight decrease between initial and end of course survey mean
ratings, as related to the question concerning local class attendance being easier on the
student and family.
3. Do graduates of Non-Traditional training who were initially opposed to
reenlisting or extending change their decision upon completion of the Non
Traditional training course?
Of the population surveyed on this specific question, only 33.33 percent of the
students were in strong agreement at the beginning of the course. By the end of the
course that percentage had increased to 54.55 percent in the strongly agree category. The
mean rating also showed a marked increase from 3.97 initially to 4.45 of a possible 5 (5
= strongly agree, 1 = strongly disagree).
Recommendations
Based on the findings and conclusions of this research study, the following
recommendations are provided:

64
1. Continue to pursue the establishment of additional courses to replace those only
offered outside the Pacific Northwest region. The addition of new courses for
various Navy ratings will enhance the best form of advertisement of the program,
word of mouth, by the people that have attended courses associated with the
program.
2. Based on several open-ended responses, clear details of the course location and
requirements need to be made available to the students assigned and their parent
commands. Specifically, it was identified that the primary training center of the
region, Trident Training Facility, at the Bangor Submarine base did not have the
details necessary to direct Non-Traditional training students to their off-base
locations.
3. Increase the emphasis on the quality oflife issue concerning the benefits of
attending class locally. The overall mean differential dropped into the negative
between the initial and exit surveys. Of the three courses, the GMO course
experienced the largest drop in this area, going from an initial 4.33 rating to a
3.75 end of course mean rating.
4. In order to maintain the success of the Navy's Non-Traditional training program
in the region, the researcher recommends the continued tracking and
accumulation of data similar to this research. The continued data collection will
allow for rapid identification of problems or weak areas within the program.

BIBLIOGRAPHY
Clark, Vern. (n.d.). From the Chief of Naval Operations .... Retrieved February 12, 2002, from http://www.excel.navy.mil/word.htm
Kirchner, Gary. (n.d.). CNO Launches Maior Training Initiative. Retrieved February 28, 2002, from http://www.excel.navy.mil/pr02.htm
Kirchner, Gary. (n.d.). Task Force EXCEL Announces Pilot Projects. Retrieved February 12, 2002, from http://www.excel.navy.mil/pr03.htm
Kirchner, Gary. (n.d.). Task Force EXCEL Introduces "Sailor Continuum". Retrieved February 12, 2002, from http://www.excel.navy.mil/pr04.htm
History. (n.d.). Retrieved February 10, 2002, from http://www.cnet.navy.mil/ltad/history.html
Non-Traditional Training. Retrieved February 10, 2002, from http://www. ttf.navy .mil/lta.htm
65
(2000). Navy Welding Course Moves to the Fleet. Retrieved March 2, 2002, from http://www.mediacen.navy.mil/pubs/ allhands/ aprOO/p g6c.htm
Science of Leaming. (n.d.). Retrieved February 12, 2002, from http://www.excel.navy.mil/science.htm
(2000). Stay Navy. Retrieved March 2, 2002, from http://www.mediacen.navy.mil/pubs/ allhands/nov00/pg6f.htm

APPENDICES
Appendix A: Sample Initial Course Research Survey
Appendix B: Sample End of Course Research Survey
Appendix C: Sample Cover Letter
66

Appendix A 67
INITIAL COURSE SURVEY
Course: loate: .::>lUOent 1aent1t1cat1on number to be entered by researcher I
::>tuaent 1aemmcauon numoer - I ... Grade each item on checklist as follows
I stronql; disagree I 2
I Does n~t apply I 4
I 5
I disagree I agree I strongly a~ ree
When evaluating place an "X" to the right of the item 1 2 3 4 5 Career path
A. I plan on reenlisting B. This course should help me advance in rate C. This course should help in performance of my job D. It was my desire to take this course Quality of Life
A. Attending class locally is easier on me / my family B. Transportation is not a problem C. Lodging is adequate D. I didn't have any problems finding my classroom (1st day) E. Getting settled into the classroom was very comfortable F. I knew of the uniform & materials required ahead of time G. School facilities are comfortable and well laid out Expectations
A. This course will be relavent to the real world B. This course will make me more marketable C. Attending class locally is better for me financially
Totals of columns Grand total
1 IWhat recommendations do you have to make the class/ area check-in process more efficient?
21 If you could give one piece of career advice to assist a junior person in your rate what would it be? (constructive comments only please)
3IOther comments I suggestions applicable to course or instructors

Appendix B 68
END of COURSE SURVEY Course: Date:
"Luaem 1aemmcat1on numoer to oe emerea oy me researc er I ~tuaent iaentmcauon numoer - I ~
Grade each item on checklist as follows
I strong!; disagree I 2 I Does n~t apply I 4
I 5
I disagree I agree I strongly a~ ree
When evaluating place an "X" to the right of the item 1 2 3 4 5 Career path
A. I plan on reenlisting / extending B. This course should help me advance in rate C. This course should help in the performance of my job Quality of Life
A. Attending class locally was much easier on me / my family B. Transportation was never a problem C. Lodging was adequate D. School facilities were comfortable and well laid out End result
A. This course was relavent to the real world B. I will be more marketable due to this course C. Attending class locally was better for me financially Instruction
A. Quality of classroom instruction B. Quality of instruction in the laboratory
Totals of columns Grand total
Other comments specific to course improvement and quality of instruction

TO:
From:
Subject:
Appendix C
Study Participants
Clint D. Brown, ODU Graduate Student
Research Study on the Effectiveness of Non-Traditional Training in the Pacific Northwest Region.
69
Dear participants I am a graduate student pursuing a M.S. degree through Old Dominion University. One of the requirements that I must complete in order to graduate is a research study. The purpose of this survey is to provide data to complete the study in determining the effectiveness of Navy Non-Traditional training in the Pacific Northwest Region.
To protect the privacy of the participants, this data will be kept strictly confidential, used only for the purpose of the study and destroyed when no longer required. I appreciate your assistance in this study.
Respectfully
Clint D. Brown