non-traditional crops, traditional constraints:...
TRANSCRIPT
1
Non-traditional Crops, Traditional Constraints:
Long-Term Welfare Impacts of Export Crop Adoption
among Guatemalan Smallholders
Calogero Carletto
a*, Talip Kilic
a and Angeli Kirk
b
aDevelopment Research Group, Mail Stop MC3-306, The World Bank
1818 H Street NW, Washington DC, 20433, USA
bInnovations for Poverty Action
101 Whitney Avenue New Haven, CT, 06510, USA
*Corresponding author. E-mail address: [email protected].
Tel: 001-202-473-1377. Fax: 001-202-522-1153.
Abstract
This study documents the long-term welfare effects of household non-traditional
agricultural export (NTX) adoption. We use a unique panel dataset, which spans
the period 1985-2005, and employ difference-in-differences estimation to
investigate the long-term impact of non-traditional agricultural export adoption on
changes in household consumption status and asset position in the Central
Highlands of Guatemala. Given the heterogeneity in adoption patterns, the
analysis differentiates the impact estimates based on a classification of households
that takes into account the timing and duration of non-traditional agricultural
export adoption. The results show that while, on average, welfare levels have
improved for all households irrespective of adoption status and duration, the
extent of improvement has varied across groups. Long-term adopters exhibit the
smallest increase in the lapse of two decades, in spite of some early gains.
Conversely, early adopters who withdrew from non-traditional agricultural export
production after reaping the benefits of the boom period of the 1980s are found to
have fared better and shown greater improvements in durable asset position and
housing conditions than any other category.
JEL Codes: C23, I31, O12, Q13.
Keywords: Smallholders, Non-Traditional Export Crops, Long-Term Welfare
Effects.
The findings, interpretations, and conclusions expressed in this paper are entirely those of the authors. They do not
necessarily represent the views of the World Bank and its affiliated organizations, or those of the Executive
Directors of the World Bank or the governments they represent. The authors would like to thank Peter Lanjouw and
the participants of the 111th
EAAE-IAAE Seminar: “Small Farms: Decline or Persistence?” (Canterbury, UK) for
their insightful comments, and INCAP for granting access to the baseline dataset and providing logistical and
technical support during the second wave of data collection.
2
1 INTRODUCTION
Agricultural growth can be more effective in poverty alleviation compared to growth in
secondary and tertiary sources of GDP (Ravallion and Chen, 2004) and especially beneficial for
the poorest households (Ligon and Sadoulet, 2007). This insight is important in the light of
predominantly rural nature of most developing countries where 57 percent of the population is
estimated to be residing in rural areas (UNPD, 2007). In this respect, increased
commercialization of agriculture and diversification into high-value, labor-intensive non-
traditional export crops (NTXs) has often been advocated as a viable strategy for developing
countries to stabilize balance of payments, stimulate growth in the agricultural sector, lower
unemployment and record significant poverty gains.
Between 1992 and 2001, the worldwide trade in non-traditional fruits and vegetables
increased by 68 percent, reaching US$15.5 billion. The share of non-traditional agricultural
exports (NTXs) from developing countries stood at 56 percent in 2001, compared to 48 percent
in 1992. Much of the upsurge in the worldwide trade in NTXs originated from Central America
and the Caribbean, which consistently exported highest shares of regional production of high-
value vegetables and counter-seasonal fruits from 1997 to 2001. Guatemala in particular has
surfaced as one of the leading producer of NTXs in the region since the early 1980s.1 The
country more than doubled the volume of its fruit and vegetable exports in the period of 1992-
2001, reaching 1.3 million tons by 2001. The value of its NTXs went up from US$ 146 million
to 262 million during the same period (FAO, 2004).
1 The promotion of NTX production in Guatemala was a central component of the U.S. economic assistance policy
in the 1980s, as exemplified by the favorable provisions of the Caribbean Basin Initiative that enabled the duty-free
export of a wide range of NTXs, and several private production- and export-related agencies that benefited from the
U.S. Agency for International Development (USAID) loans (Barham et. al., 1992).
3
Proponents of increased commercialization of agriculture assert that resource-poor
smallholders have a comparative advantage in NTX production through substantial cost savings
as labor-intensive production processes can absorb abundant family labor at below market
wages. The utilization of family labor on small farms would also be subject to fewer agency
problems in ensuring a high-quality effort from workers and farm management (Binswanger et.
al., 1995). International donors, policy makers and researchers, who have perceived the spread of
NTX adoption as a viable rural development strategy, have traditionally propagated the
expectation that relatively higher prices for NTXs and cost-effective production process on small
farms would combine to foster increases in rural living standards, and that NTX production
would generate local employment directly on farms and indirectly through forward and
backward linkages and multiplier effects of increased incomes spent on local goods and services
(von Braun et al., 1989a; Barham et al., 1995, Carter and Barham, 1996).2
However, the extent to which the economic gains from NTX adoption or the resulting
spillovers actually reach the poor and whether such anti-poverty strategies have been successful
in the long run remain open empirical questions. “It cannot be presumed that family labor
advantages guarantee the competitive dominance of small-scale farming and broadly based
growth[,]” particularly in the long-run (Carter and Barham, 1996: 1144). Given information
asymmetries between agents, the adoption of capital-intensive, high-risk, high-reward crop
technologies among smallholders may be constrained due to their limited risk-bearing ability,
access to credit, asset position, and level of human capital and management skills (Carter and
Barham, 1996). Even in rare cases in which adoption is more inclusive of the poor in the short-
term, cumulative risks materializing in the production and marketing of NTXs may not favor the
more vulnerable in the medium- and long-term.
2 For potential negative externalities associated with NTX production, see Carter, Barham, Mesbah (1996).
4
A well-studied experience that, at least initially, appeared to overcome various obstacles
to NTX adoption is the diffusion of snow pea cultivation among smallholder members of the
Cuatro Pinos agricultural cooperative in Guatemala‟s Santiago Sacatepéquez municipality,
whose well-known problems of poverty and malnutrition3, proximity to Guatemala city and
location along the Pan American Highway featured it as a suitable candidate for increased
commercialization to take effect and facilitate improvements in living standards. Thanks to
strong foreign demand for NTXs and extensive financial and technical support provided by the
cooperative, the area under investigation experienced a significant boom in NTX production in
the 1980s. Snow pea cultivation, at the onset, translated into substantial improvements in
consumption levels and noteworthy positive spillovers in staple food production among adopters
(von Braun et al, 1989a). However, throughout the 1990s, a wide range of agronomic, market-
based, and institutional problems led to a significant drop in the profitability of snow pea
production and caused a sizeable number of smaller and resource-poor farmers to withdraw from
export crop production. These problems included the severe decline in the availability and
quality of services offered by Cuatro Pinos due to pervasive management problems, reduction in
soil quality due to land and agrochemical overuse, upsurge in pesticide resistance, rising input
costs, detention of snow pea shipments at U.S. ports due to unauthorized pesticide residues,
ensuing import bans, and the imposition of more stringent quality standards (Carletto et. al.,
1999).
While the immediate/short-term effects of NTX/snow pea adoption and medium-term
problems in the 1990s have been documented, empirical studies that systematically measure the
extent to which cash crop adoption has impacted the welfare of smallholders in the long-term are
3 In Santa Maria Cauque, one of the communities under study, a cohort analysis between 1964 and 1969 indicated
that 13 percent of 1-year-old children, 27 percent of 2-year-old children, and 9 percent of 3-year-old children were
affected by protein calorie malnutrition (von Braun et. al. 1989a).
5
virtually non-existent. Given the arguments, and continued effort, in favor of increased
agricultural commercialization and NTX adoption in developing countries, the estimation of
long-term welfare effects of NTX production maintains its policy-relevance. This is especially
true in Guatemala, where the national poverty rate stood at 51 percent in 2006 and 72 percent of
the country‟s poor were living in rural areas (World Bank, 2009). Despite exhibiting poverty
rates below the national average, at 49 percent in 2000 (SEGEPLAN, 2005), poverty in the area
remains widespread, and malnutrition levels particularly high. As 87 percent of the rural
Guatemalan poor are estimated to depend on agriculture either as subsistence farmers or
agricultural day laborers, it is important to assess the long-term viability of development
strategies, including crop diversification into high-value non-traditional export crops that are
aimed at fostering pro-poor agricultural growth. Furthermore, despite the inconsistent
performance of Cuatro Pinos over time, its longevity makes it a unique case in the literature,
warranting a closer investigation to put observed changes associated with NTX adoption in a
historical and institutional perspective.
To fill these lacunae, this study takes advantage of a unique panel dataset, which spans
the period of 1985-2005, and employs difference-in-differences estimation to investigate the
long-term effect of snow pea adoption on changes in household consumption status and asset
position in Santiago Sacatepéquez. The NTX of interest is snow pea given that from early on and
during the 1990s, the crop emerged as the main product promoted and marketed by Cuatro
Pinos.
More than 20 years after the onset of the NTX boom in the area, the agricultural
configuration and socio-economic make-up of the communities appear to have changed quite
dramatically. Many farmers have succeeded in continuing to grow snow peas over the years, but
6
many more have abandoned its cultivation. Others have entered snow pea production
significantly later, with mixed success. Over 80 percent of the farmers in the sample adopted
snow pea at some point, and the majority of ever-adopters adopted within the first few years of
exposure, primarily due to the credit, technical assistance and marketing support provided by
Cuatro Pinos. By 1985, 62 percent of the sample, or close to three-quarters of ever-adopters, had
already adopted. However, less than 40 percent of the early adopters have continued to produce
snow peas over the past two decades. The vast majority grew snow peas only for a few years,
and most had withdrawn from production by the mid 1990s. Given the heterogeneity in adoption
patterns, it is impractical, and potentially misleading, to schematize the process into a dichotomy
of adopters vis a vis non-adopters. For this reason, we explore the heterogeneity of impact based
on a classification of households that takes into account the timing and duration of snow pea
adoption.
Our results show that while, on average, welfare levels have improved for all households
irrespective of adoption status and duration, the extent of improvement varied across groups,
with long-term adopters exhibiting the smallest increase in the lapse of two decades, in spite of
some early gains. Conversely, early adopters that withdrew from NTX production after reaping
the benefits of the boom period of the 1980s are found to have fared better and shown greater
improvements in durable asset position and housing conditions than any other category.
The paper is organized as follows. Section 2 offers a brief history of Cuatro Pinos and
NTX production in the surveyed communities. Section 3 reviews the available literature on the
impact of commercial crop cultivation on welfare. Section 4 describes the dataset and provides
descriptive statistics. The empirical model and regression results are presented in sections 5 and
6, respectively. Section 7 concludes.
7
2 HISTORY OF CUATRO PINOS AND AGRICULTURAL COMMERCIALIZATION IN
SANTIAGO SACATEPEQUEZ
The primary institutional arrangement to shield smallholders in central highlands of
Guatemala from various risks associated with NTX production was the establishment of the
Cuatro Pinos agricultural cooperative. Cuatro Pinos was founded in 1979 with financial and
technical assistance from a coalition of Swiss development organizations that initially arrived in
Guatemala for the purpose of rebuilding ravaged villages following the 1976 earthquake (Saenz
de Tejada, 2002). The cooperative was set out to provide field-level extension, input credit, and
agricultural produce collection, processing, storage and marketing services for small holders
engaged in the production of new export crops (von Braun et al., 1989a). From early on, snow
pea emerged as the main crop promoted and marketed by the cooperative, which also started
promoting the cultivation of broccoli, cauliflower, and parsley by 1985 (von Braun et al., 1989a).
Contrary to previous agro-export booms in Guatemala4, NTX cultivation spread among
all types of farmers but the very smallest, potentially surfacing as an effective, nearly all-
inclusive poverty alleviation mechanism. The cooperative membership increased from 177 in
1979 to 1,600 by 19895, and between 1980 and 1985, the area under export vegetable production
quadrupled (von Braun and Immink, 1994).6 Cuatro Pinos attempted to counteract production
4 Williams (1986) documents cotton and cattle booms that proved to be devastating to the rural poor.
5 Following the establishment and expansion of Cuatro Pinos, a number of intermediaries, locally known as coyotes,
emerged to take advantage of the booming industry. Coyotes, who were known to follow lower quality standards,
hosted auctions in Santiago Sacatepéquez and other surrounding communities where the payments were immediate
and in cash. Despite their commitments to the cooperative, it was common for Cuatro Pinos farmers, even board
members, to sell to coyotes, especially when prices offered by coyotes were higher than the upper limit of the price
band guaranteed by the cooperative (Carter and Barham, 1996). This presented an on-going problem for the Cuatro
Pinos management who were at times forced to buy produce from coyotes at higher prices to comply with its
agreements with export companies. 6 Although adoption was widespread, nearly all NTX producers preferred to maintain diversified crop portfolio by
combining NTX production with milpa, i.e. the traditional intercropping of maize and beans. This practice remained
unchanged over time. The survey data indicates that among those that have not stopped growing snow peas since the
introduction of the crop in the region, the average area allocated to NTX crops increased from 0.24 to 0.43 hectares
between 1985 and 2005. Within the same group of farmers, the average area under staple crop cultivation was 0.37
and 0.39 hectares in 1985 and 2005, respectively. Von Braun, Hotckiss, and Immink (1989) hypothesize that this
8
risks with the management of a price band system and provided insurance through limited
liability on loans (Carletto et al., 1999). The 48-member cooperative board was renewed every 2
years, allowing a sizeable number of members to have management and leadership experience
(Saenz de Tejada, 2002). In 1985, Cuatro Pinos also began channeling 10 percent of its annual
profits for the provision of basic education and health services for its members. As part of its
sector social activities, the cooperative set up night schools for its members to complete
elementary education, awarded scholarships to its members‟ children for the completion of
secondary education, and kept a team of four physicians giving consultations in villages where
the cooperative was active. The provision of educational incentives for the members‟ children
was in part for the purpose of counteracting reliance on child labor in NTX production (Saenz de
Tejada, 2002).
The multifaceted support provided by Cuatro Pinos was instrumental in reducing
transaction costs of coordination, and enabling smallholders to escape information asymmetries
about marketing opportunities and overcome financial and human capital constraints that would
have otherwise hampered NTX adoption. The competitiveness of smallholders of Santiago
Sacatepéquez was also due to their familiarity with horticultural production (von Braun et. al.,
1989a) and the highly fragmented pre-boom land distribution that has insulated them from direct
competition from larger farms (Carter and Barham, 1996). They were also able to utilize
available family labor at below market remuneration in NTX production, which required close to
600 person-days per hectare over a four month period (von Braun et al., 1989a).
production behavior provides a level of insurance against the high risks of NTX production, and indicates the desire
of farmers for food security. Likewise, Barham, Carter and Sigelko (1995) demonstrate that there is a ceiling to
small farm NTX adoption and that expected land under NTX cultivation levels off at 0.35 hectares as farm size
approaches 2 hectares and does not increase until farm size exceeds 4 hectares. “By default, the size-related NTX
adoption pattern of a ceiling followed by an upturn seems best explained by wealth and farm size related differences
in risk bearing capacity and in access to other factor and product markets.” (pp. 98)
9
At least initially, NTX production led to large increases in earnings among cooperative
members whose total expenditures were 20 percent higher than those of non-members (von
Braun et. al., 1989a).7 On a per capita basis, cooperative members were found to spend more on
both food and nonfood items, and the average value of their consumption of own-production was
also higher than the comparable figure for non-members.8 The positive spillover effects of NTX
adoption on staple food production, mainly through higher fertilizer and labor use per hectare,
seemed temporarily to put to rest concerns over the potentially negative impact of NTX
production on food security.
Since “comparative advantage may not be a „given‟ but rather the product of land tenure,
investment, state policies, and institutional arrangements” (Barham et. al., 1992: 54), numerous
risks to the sustainability of NTX production among smallholders were identified in the midst of
the boom. These risks included (i) increased dependence on market conditions for farm inputs
and outputs, (ii) potential crop failures and agronomic problems, (iii) heightened price variability
and deterioration due to increased regional competition as well as market saturation for export
crops, and (iv) breakdown of institutions that smallholders rely on for credit, technical assistance
and marketing of agricultural produce (von Braun et. al., 1989a; von Braun and Immink, 1994;
Thrupp et. al., 1995; Barham et. al., 1995; Carter and Barham, 1996). Throughout the 1990s, the
simultaneous realization of several aforementioned risks strained the risk-bearing ability of
Santiago Sacatepéquez‟s NTX producers, raising concerns about the sustainability of the
development impact of NTX production.
7 In 1985, the net returns per hectare of snow peas were, on average, 15 times greater than those of maize, which is
the staple crop in the surveyed communities, and 60 percent higher than net returns from traditional vegetables
produced for local markets The high capital-intensity of NTX production, hence the importance of rural credit, was
also evident from the fact that per hectare input costs of snow peas were 13 times as high as those of maize (von
Braun et. al., 1989a). 8 Despite the higher levels of food expenditures among cooperative members cooperative membership did not lead
to significant improvements in children‟s nutritional status and it was not a statistically significant determinant of
household food budget share (von Braun et. al., 1989a; von Braun and Immink, 1994)
10
Starting in the late 1980s, farm-gate prices for NTXs started to decline in real terms due
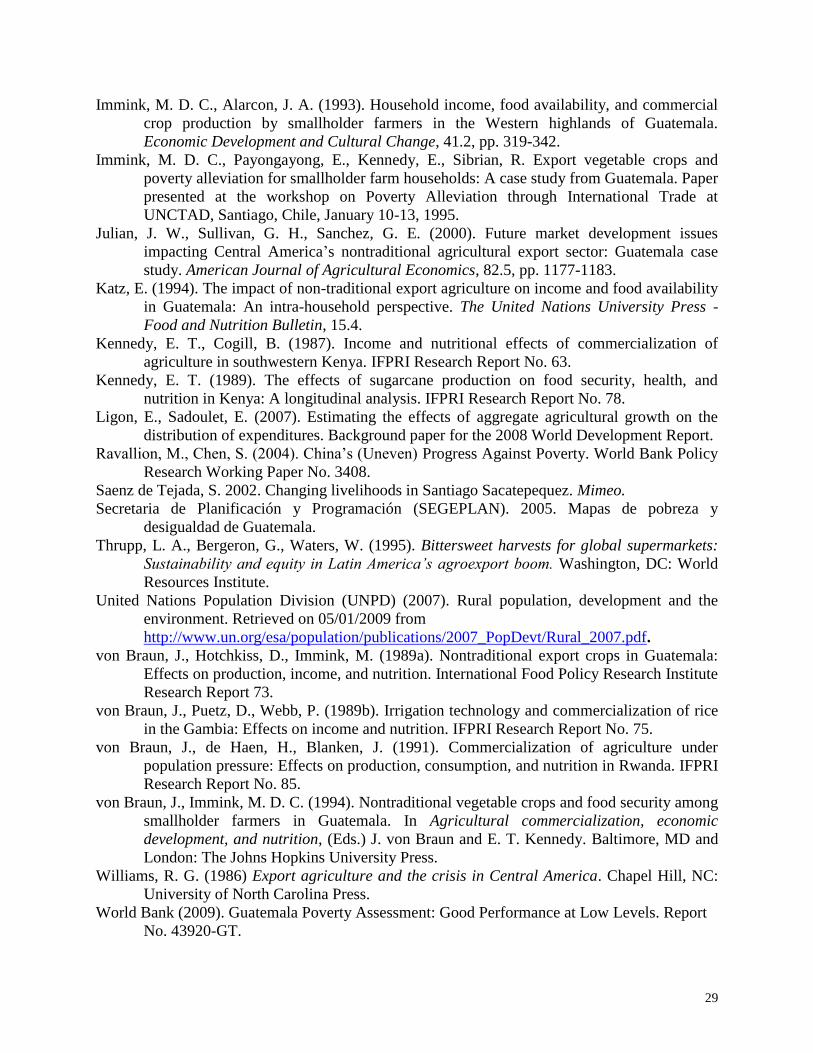
to increased regional competition and high rates of domestic inflation. As seen in Figure 1, this
trend continued throughout the 1990s and into recent years. In particular, the 2005 survey
indicates that close to 60 percent of the former adopters cited uncertain and low prices as their
primary reason to stop cultivating snow peas. Production costs also surged in the medium-term,
in part due to the currency devaluation and elimination of implicit import subsidies for
agricultural inputs (Immink et. al., 1995). The excessive use of pesticides led to increased
pesticide resistance that required more pesticide applications, leading to a substantial increase in
the cost of NTX production. Excessive agrochemical use also contributed to increasing soil
degradation and lower productivity which, paradoxically, led to the curtailing of plot rotation
practices – a natural method to eliminate pest and increase yields – resulting in even lower
productivity.9
In addition, Guatemalan NTX shipments were detained 3,081 times between 1990 and
1994 due to pesticide residue violations. Given the highly perishable nature of export crops, the
detentions resulted in aggregate losses close to US$ 18 million. 1,755 detentions took place in
1993 alone, almost entirely due to the presence of an unregistered pesticide (chlorothalanil) used
in snow pea production. Inevitably, the crop losses left the snow pea farmers of Santiago
Sacatepéquez shortchanged, and led many of them to suspend or permanently abandon NTX
production. The developments also underlined the importance of accurate marketing information
transmission to smallholders that already faced high risks associated with high-value agricultural
export production and could generally not afford crop losses in the magnitudes that were
witnessed in the 1990s. Subsequent to the pesticide residue crisis, the Guatemalan government
9 The survey data indicates that while the average pounds of snow peas production per hectare was 4,906 in 1985,
the respective figure was 3,537 by 2005, representing close to 30 percent decline.
11
required residue analyses to be conducted prior to export shipments (Thrupp et. al., 1995), and
the U.S. imposed an automatic quarantine on all Guatemalan snow pea imports (Julian et. al.,
2000). The quarantine lasted until April 1997 and further exacerbated price and agricultural
income volatility.10
Since the ability of smallholders to accommodate the fixed costs of ensuring
accepted levels of pesticide residues was limited11
, export companies increasingly started
distancing themselves from contract-farming arrangements with smallholders (Barham et al.,
1995).
Although the rise in agronomic problems, input costs and the U.S. phytosanitary
standards should have prompted the Cuatro Pinos leadership to be pro-active in shielding the
members from growing risks associated with NTX production, the cooperative was dealing with
untimely problems of its own. Throughout the 1990s, waning support from international donors,
inefficient management practices, and increased default on agricultural credit due to crop losses
from agronomic problems and detentions at the U.S. ports led to a near-bankruptcy of Cuatro
Pinos, a general management crisis and unrest among its members. The provision of technical
and marketing assistance, credit, and social services, which was indisputably critical for the
initial success of NTX farmers, was subsequently scaled back (Carletto et. al., 1999).12
Cuatro
Pinos was also ineffective in promoting environmentally sustainable agricultural practices,
diversifying marketing outlets and enriching its product portfolio in search of more profitable
10
Despite the efforts of the USAID Integrated Pest Management Collaborative Support Program and the U.S.
Department of Agriculture Foreign Agricultural Service to spread the practice of integrated pest management and
reduce the reliance on chemical pesticides in the central highlands of Guatemala, their sphere of influence has
remained limited and the qualitative evidence indicates that the NTX farmers in the surveyed communities are not
knowledgeable in alternative pest control practices (Saenz de Tejada, 2002). 11
The fixed costs of ensuring accepted levels of pesticide residues on snow peas exports reportedly exceeded the
average weekly value of sales (Barham et. al., 1995). 12
Using duration models to explain the adoption and withdrawal process pertaining to snow pea production in the
same communities as in this study, Carletto et. al. (1999; 2007) show that adverse institutional and market
environment since the late 1980s, global process of growing toxicity and crowding out at village level, and price
deterioration are among the factors reducing the likelihood of adoption, while boosting the probability of withdrawal
subsequent to adoption.
12
export crops that the snow pea farmers could rapidly embrace. The resulting institutional vacuum
was not filled by any other arrangement.
While the 1990s came to be known as “the lost decade,” Cuatro Pinos was revitalized
with the return of the original cooperative management in 2000 and a grant from the Canadian
Cooperative Association in 2001. Even though the scope of cooperative membership was
significantly restricted following the management overhaul (560 members by 2004), Cuatro
Pinos’ basic functions in terms of technical assistance, credit provision, and social services have
been restored, signaling a potential reversal of the trends in the 1990s. Cuatro Pinos is slowly
moving away from its traditional emphasis on snow pea production, giving more importance to
the production of French beans, whose prices has been subject to less fluctuation over time in
comparison to snow peas. The cooperative also invested in a phytosanitary laboratory that allows
for the fulfillment of export standards with ease and added new crops to its portfolio, including
zucchini, baby carrots, yellow French beans, and radicchio. In addition to its members from the
central highlands, Cuatro Pinos is now engages in contract farming with non-member farmer
groups from more remote locations in Guatemala.
3 REVIEW OF THE LITERATURE ON NTX PRODUCTION AND WELFARE CHANGES
AT THE MICRO-LEVEL
Available empirical studies on the NTX-household welfare nexus tend to focus on the
short-term implications of NTX production. Several articles from a diverse array of international
settings have concluded that the immediate impact of crop diversification into non-traditional
export products on household income or consumption was positive (The Gambia: von Braun et.

13
al., 1989b; Kenya: Kennedy and Cogill, 1989; Philippines: Bouis and Haddad, 1990; India:
Birthal et. al., 2005).13
In Guatemala, research efforts based on cross-sectional data collected in the mid-1980s
and early 1990s have shown that initially, the NTX boom led to increased land access among
households that entered their lifecycles with the least amount of land (Barham et. al., 1995), and
that NTX production substantially increased annual household consumption and income levels
(von Braun et. al., 1989a; Katz, 1994). On the other hand, Immink and Alarcon (1993) report that
in spite of substantial income differentials in favor of commercial crop production, growers of
export vegetables or farmers engaged in the production of other cash crops were not generally
better off than maize farmers in terms of adequacy of dietary energy and protein intake. Immink,
Kennedy and Sibrian (1995) show that in comparison to traditional farm or off-farm orientation,
being export orientated does not exert a statistically significant impact on child nutritional
outcomes.14
In the medium-term, concerns about the sustainability of NTX production by
smallholders were raised in the face of increasing institutional and marketing risks that
surrounded resource-poor farmers with limited risk bearing ability (Carletto et. al., 1999). In
particular, Carletto (2000) hints at the potential unsustainability of previous patterns of land
accumulation in the long-term by providing evidence for significantly lower rates of
accumulation in the 1990s compared to the trends observed in the 1980s.
13
Potentially adverse effects of increased agricultural commercialization on household calorie consumption have
been noted in various settings (Kenya: Kennedy, 1989; Rwanda: von Braun et. al., 1991). 14
It should be noted that with the exception of Katz (1994) and Carletto et. al. (1999), previous research on the
impact of NTX production on various dimensions of household and child welfare in Guatemala did not expend any
effort to account for the non-random nature of cooperative membership or NTX adoption.
14
Moving beyond the studies on the short-term impacts and medium-term concerns related to
NTX/snow pea production, empirical studies on the long-term welfare effects of non-traditional
export crop cultivation do not exist. The expectations about the potential impacts of snow pea
adoption in Guatemala have so far been informed by qualitative studies. Saenz de Tejada‟s
(2002) qualitative work in Santiago and Pacul indicates that while some export crop producers
accumulated more land with NTX earnings, others used their savings to improve housing
conditions and purchase livestock and durable goods, including pick-up trucks. Her findings also
uncover nostalgia for the boom period and the smallholder view that the best approach to snow
pea cultivation was to adopt early, grow intensively, and invest the returns in ways that would
allow for withdrawal as the profitability plummeted.15
On the other hand, Hamilton and Fischer (2003; 2005) demonstrate positive local
perceptions of economic and social change subsequent to the diffusion of non-traditional export
crops through qualitative studies of small-scale NTX farmers in Chimaltenango. Their
arguments, however, are largely based on answers given to a subjective set of questions
concerning the overall changes in the economic situation, educational attainment, nutrition and
health-care of the surveyed families, regardless of their NTX adoption status, throughout the last
fifteen-to-twenty year period of NTX production in the communities. Moreover, the perception
15
Over time, non-farm incomes and employment have gained increasing importance over time in the livelihood
strategies of resource-poor households in Santiago Sacatepéquez. Recent qualitative evidence indicates that sizeable
number of smaller and resource-poor farmers, whose risk bearing ability could not meet the challenges of growing
price uncertainty and volatility in agricultural incomes in the medium-term either temporarily abandoned snow peas,
placed greater emphasis on the production of traditional vegetables, and increased their reliance on non-farm income
or abandoned agriculture altogether and sought off-farm employment. While the changes in household livelihood
strategies was partly necessitated by the rise and persistence of extensive problems associated with snow peas
production that taxed the adopters‟ risk bearing ability, it was also fostered by the emergence of alternative non-farm
employment options that have increased the opportunity cost of family and hired labor involvement in a stagnant
agricultural sector. Although non-farm wage labor options until the late 1980s were mainly in the construction and
security sectors for men and in weaving, petty trade and domestic service sectors for women, the alternatives were
enriched with the establishment of maquilas, i.e. factories that assemble previously manufactured parts of various
exports, including textiles and electronics (Golding, 2001), along the Pan-American highway, in the nearby area of
Manzanales and municipalities of San Pedro Sacatepéquez, San Lucas Sacatepéquez, and Santa Lucia Milpas Atlas
(Katz, 1995; Saenz de Tejada, 2002).

15
of NTX production as a viable income generation strategy in these communities may be a
manifestation of a form of bounded rationality on the part of the survey respondents in the
absence of alternative livelihood strategies.16
In the face of overwhelming production, marketing, and institutional concerns associated
with snow pea production during the 1990s, and the qualitative evidence on the links between
snow pea adoption paths and changes in welfare and livelihood strategies over time in Santiago
Sacatepéquez, we hypothesize that although surveyed communities are likely to have
experienced welfare improvements in the period of 1985-2005, the extent of improvement
among those that stuck with snow pea cultivation or later adopted the crop in the post-boom era
is expected to be inferior to the comparable trends among those that either never engaged in
export crop production or withdrew from snow pea cultivation following the boom period of the
1980s.
4 DATA
Our analysis is based on a unique panel dataset spanning a 20-year period. The second
wave of the survey, conducted in 2004/05 by the authors, revisited the same households of a
1985 study by the International Food Policy Research Institute (IFPRI) and Instituto de Nutrición
de Centro América y Panama (INCAP) on a sample of NTX adopters and non-adopters.17
The
1985 survey was administered to 399 households from six communities in the municipality of
Santiago Sacatepéquez, and collected information on household composition, education, health
16
The difference between the communities that inform Hamilton and Fischer‟s analysis and the ones tracked in this
study is that while non-farm employment opportunities are not available to farmers that reside in their communities
of interest, ample opportunities for off-farm labor emerged and persisted in and around Santiago Sacatepéquez since
the early 1990s. This difference is likely to alter impact perceptions of NTXs across communities and has
implications for the differences in opportunity cost of family labor engaged in agriculture. 17
See von Braun, Hotchkiss, and Immink (1989) for the original survey design.
16
and anthropometric measurements, employment, dwelling conditions, consumption and income,
land holdings, cultivation patterns, cooperative membership, and technical assistance. The six
communities served by Cuatro Pinos were Pachalí, San José Pacúl, Santa Maria Cauqué, San
Mateo Milpas Altas, El Rejón, and Santiago, where the cooperative is located. The region‟s
proximity to the Pan-American Highway is notable, as access to infrastructure has not been a
constraint on the sustainability of NTX production by smallholders.
Prior to the follow-up, extensive fieldwork was carried out in 2004 in the Cuatro Pinos
communities of interest in order to locate original sample households and identify the names and
locations of each original household member for a follow-up interview.18
Subsequently, 314
original-households were located, and the sample used for this study includes 293 original-
households.19
The 2004 listing operation also revealed that the vast majority of the individuals
that have left original-households since 1985 and formed separate households were living in the
same or surrounding communities. Hence, in addition to original-household interviews, the 2005
survey was administered to one “split-off” household, randomly chosen among former household
members still living in the survey communities.
18
The full listing exercise was necessary, since with the exception of the household head, the names of each member
of the original household were missing from the dataset, and paper questionnaires were no longer available. For
these individuals, the information was available only on the age, gender and relation to the household head, which
required tracking and collection of the missing names prior to the survey fieldwork. 19
Out of the original sample of households, 15 could not be identified since neither the name of the household head
nor address information were recorded in the 1985 survey. In 54 cases, the heads of households had died, and
another 16 were known to have moved from the community. Only the original households with original heads are
used for this study. Further data cleaning eliminated households with insufficient or suspect information, yielding a
final sample size of 293. To test for the existence of endogenous attrition, we follow Galasso et. al. (2004) and
regress the attrition indicator, which is a dichotomous variable equal to 1 if an observation was not resurveyed in
2005, on the 1985 value of any outcome of interest and other baseline characteristics of the household, including
community fixed-effects with Santiago being the reference category; the age and years of education of household
head and his/her spouse; the number of household members in the age category of [0,14]; and the separate counts of
male and female household members in the age category of [15,64]. The test for attrition bias is equivalent to testing
whether the baseline value of the outcome of interest is statistically significant. Following this approach, we were
not able to detect any sign of attrition bias. The results, which are available upon request, were not sensitive to the
choice of OLS vs. Probit to fit the model with a binary dependent variable, i.e. the attrition indicator.
17
While the same set of 1985 modules were administered in 2005 to ensure comparability,
additional recall modules on full histories of cooperative membership, NTX cultivation, land
transactions, agricultural and durable assets, and perception of economic wellbeing were also
included.20
Information for a money-metric welfare indicator and several non-monetary welfare
measures were available in both surveys. Following to the same time frame for the
administration of the 1985 survey, the 2005 fieldwork was conducted between November 2004
and February 2005 in order to eliminate seasonality effects that may affect over-time
comparisons. In order to differentiate the impact of NTX production based on timing and
duration of adoption, we rely on 1985 and 2005 production figures and retrospective information
collected in 2005 concerning annual NTX cultivation patterns dating back to 1979 to define
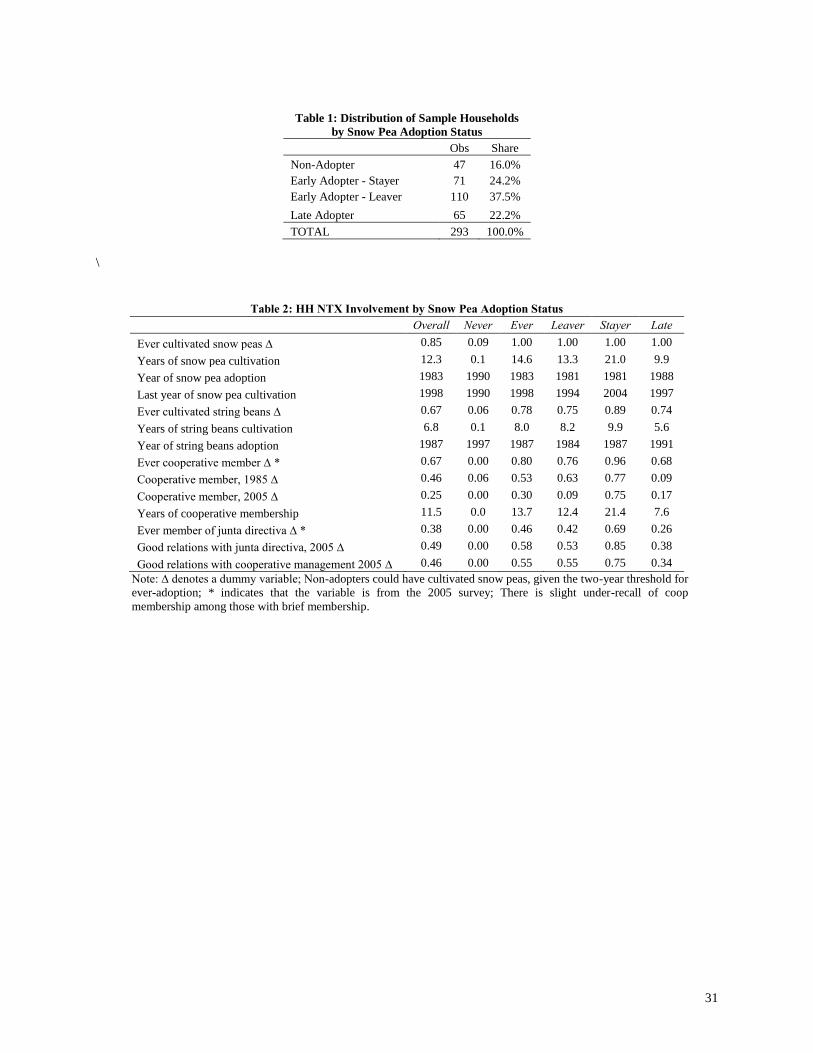
adoption categories. Table 1 presents the distribution of the sample households according to their
snow pea adoption status.
Adoption is defined by having cultivated snow peas for at least 2 agricultural seasons in
the period of 1979-2005, and early adoption is equivalent to snow pea adoption by the 1984-
1985 agricultural season, i.e. the season on which the baseline survey collected data and by when
the majority of smallholders had already adopted. We further distinguish between early adopter
leavers, i.e. early adopters that have not cultivated snow peas in the two seasons preceding 2005,
and early adopter stayers, who adopted snow peas by 1985 and continued its production through
20
In addition to the careful design of all recall modules, all enumerators were trained extensively on collecting recall
data in order to minimize the impact on our results of inevitable errors of recollection.
18
2005.21
Henceforth, we refer to early adopter stayers and early adopter leavers as stayers and
leavers, respectively.22
Tables 2 and 3 present descriptive statistics by household snow pea adoption status.
Never refers to non-adopters, Ever accounts for snow pea adoption at any point between 1979
and 2005 for at least 2 years, and Late identifies late adopters. Table 2 depicts household
involvement in NTX production over time. We observe that, on average, early adopters started
cultivating snow peas by 1981. While the average years of cultivation among stayers exceeded
20 years in the period of 1979-2005, the comparable figure was just above 13 years for leavers,
who, on average, left snow pea production by 1994. For late adopters, the average figure for the
first year of snow pea cultivation was 1988. Trends in cooperative membership often mirror
NTX adoption histories, particularly in the early years when NTX adoption was possible almost
exclusively through the coop. While withdrawal from snow pea production generally implied
severance from the cooperative, consistent cultivation of the crop, generally reflected sustained
involvement in Cuatro Pinos and good relations with, or participation in, its management.
Table 3 reports changes in household characteristics pertaining to human capital,
consumption status, and asset position. A finding that is perhaps consistent with the implications
of different snow pea adoption pathways is that over time, stayers increased their landholdings
by close to 30 percent, while the average amount of land owned by leavers declined by 17
percent between 1985 and 2005. In the same period, the trends in land ownership among non-
adopters and late adopters were rather stagnant. Furthermore, the comparisons of household
21
If a similar rule to distinguish between leavers and stayers is imposed among late adopters, approximately two-
thirds of the late adopters would belong to the late adopter leaver category, potentially rendering the size of the late
adopter stayer sample too restrictive for meaningful comparisons. Hence, we choose not to distinguish between
leavers and stayers within the group of late adopters. 22
In order to respond possible concerns about a degree of discretion introduced by this classification, we tried
different thresholds with no substantive changes in the results.

19
highest and average years of education across adoption categories reveals that in comparison to
non-adopters, the changes in the average values for both variables were positive and statistically
significant among leavers, who, on average, also recorded the highest levels of educational
attainment in 2005.
In addition, leavers demonstrated highest levels of real per capita consumption in both
years. However, their 1985-2005 change in the outcome of interest is not statistically different
than the comparable figure for non-adopters, who also exhibited significant consumption gains
across time. By 2005, non-adopters had fully closed the initial gap in welfare with stayers, which
was the group with the smallest gain in consumption over time. While the average increase in
real per capita consumption for non-adopters was 2,757 Quetzales, the respective figure for
stayers was only 1,507 Quetzales (1 US$ = 7.58 Quetzales, 12/31/2005).
Consistent with the available qualitative evidence (Saenz de Tejada, 2002), the surveyed
communities have experienced dramatic improvements in living conditions, irrespective of
adoption status. Despite some initial differences between adopters and non-adopters, adopters
exhibited more substantial improvements in dwelling conditions by 2005. In terms of asset
accumulation, although increases were registered for all groups, leavers exhibited the highest
gains. Another noteworthy set of differences among household groups in 2005 was in terms of
having access to a landline or a cell phone, with leavers recording the highest average values.
Finally, Table 4 aims to depict the changes in access to household income components
between 1985 and 2005. We see that on the whole, the average share of households with
agricultural income declined somewhat in the period of 1985-2005. While household agricultural
participation reached 100 percent among stayers and increased marginally within the late
adopters category, the opposite was true concerning leavers and non-adopters. Overall, the
20
percentage of households with non-farm labor income increased by 78 percent. The surge was
fueled by the changes in economic portfolios of leavers, for whom the number of households
with non-farm labor income doubled in the same period. Looking separately at household access
to non-farm wage labor and self-employment income, we see that much of the rise in household
access to non-farm labor income on the whole and across adoption groups was fostered by
changes in the incidence of self-employment. The number of households engaged in self-
employment more than tripled in the surveyed communities between 1985 and 2005. Nearly 40
percent of non-adopters were self-employed in 2005, while the comparable figure was 64 and 48
percent among leavers and stayers, respectively. As also noted by the qualitative studies (Saenz
de Tejada, 2002; Goldin, 2001, 2005), we find the share of households with farm wage labor
opportunities to have declined on the whole and across all categories. The percentage of
households with non-farm non-labor income increased marginally for all groups, but the
differences among them were not statistically significant.
5 MODEL
Given the non-random nature of snow pea adoption and the panel nature of our dataset,
we employ a difference-in-difference (DD) model that compares changes in outcomes over time,
accounts for selection bias due to time-invariant and additive unobservable differences among
adoption groups between 1985 and 2005, and controls for potential observable differences in
1979. The model is specified linearly as follows:
yi = α + θ t + β1 stayeri + Γ1 t*stayeri + β2 leaveri + Γ2 t*leaveri + β3 latei + Γ3 t*latei + γ Zi + εi
21
where i denotes household, y is the welfare outcome of interest; t is a dummy variable equal to 1
if the survey period is 2005, θ captures changes the occur over time that are independent of snow
pea adoption; stayer, leaver and late are dummy variables accounting for a household‟s snow
pea adoption classification23
; their respective coefficients capture the initial differences in y
between non-adopters and adopter groups; the coefficients on the interactions of t with stayer,
leaver, and late are expected to isolate the effect of each adoption path on y for the period of
1985-2005.24
This point is important, as survey data prior to 1979, i.e. the first year of possible
adoption and the ideal baseline year for the DD estimation, are not available. If there are
differences in y between non-adopters and early adopters that may have materialized by 1985,
selection bias in early adoption may in part be responsible for these differences.
On the other hand, Z includes exogenous observable covariates through which we attempt
to capture pre-NTX observable differences in household human and physical capital. These
variables, which are either time invariant or have been reconstructed to 1979, are (i) the age and
years of education of household head and his/her spouse; (ii) the number of household members
in the age group of 0-6; (iii) the numbers of male and female members in the age group of 15-
23
Although the NTX adoption classification in this paper is based on the cultivation histories of snow peas, which
was one of the first and certainly the most representative NTX for most of the period under consideration, we also
constructed an alternative classification based on both snow peas and string beans, i.e. the two export crops for
which full adoption histories were collected as part of the 2005 survey. In this process, we assumed that being an
adopter (stayer) of one crop overrides being a non-adopter (leaver) of another, leading a household classified as an
adopter (stayer). After this assumption is enforced, being an early adopter of one crop would override being a late
adopter of another. As a result, the distribution of households across NTX adoption categories was only marginally
different than the one reported in Table 1, and running all our regressions according to the alternative classification
yielded virtually identical results, which are available upon request. 24
The impact of NTX adoption as conceptualized in this paper should be understood as the impact of NTX adoption
as mediated by a cooperative such as Cuatro Pinos, thus potentially capturing the benefits of various services
provided to the cooperative members and their families. This is particularly true for the 1980‟s when NTX adoption
and cooperative membership were strongly correlated. Moreover, if benefits from having snow peas in the
community after 1985 exhibit strong spillover effects, these would be captured by θ, underestimating the impacts for
growers.
22
64;25
(iv) total amount of land owned in hectares and its squared term26
; (v) amount of land
owned in hectares that is considered as good quality by the farmer for snow peas production and
its squared term; (vi) two-way interactions of all covariates with variables pertaining to the age
and years of education of household head and his/her spouse; and (vii) community fixed-effects
with Santiago being the reference community.
While considering the impact of snow pea adoption on changes in household
consumption and asset position, we focus on several outcome variables including the logarithmic
values of household real annual per capita total and food consumption; durable asset count and
index27
; and dichotomous variables accounting for residence with (i) cement walls, (ii) cement or
tile floor, (iii) modern kitchen28
, and (iv) indoor toilet.
6 RESULTS29
Table 5 reports the results from the DD models of snow pea adoption effects on
household consumption and asset status. In terms of household consumption status, we see that
over the period of 1985-2005, the surveyed communities witnessed a significant growth across
the board, independent of snow pea adoption, as indicated by θ. Focusing on the difference-in-
difference estimates of snow pea adoption effects, we see that although the level of consumption
increased for all groups between 1985 and 2005, the change seems to have been smaller for
25
All of the household age groups pertaining to 1979 is constructed from the 1985 survey, taking into the account
living household members in 1985 that would have been born by 1979, and information on the household members
that died by 1985. 26
The amount of land owned in 1979 is calculated by using the 1985 roster of plots owned by the household and the
history of land transactions that was solicited as part of the 1985 survey. 27
The durable asset index is constructed via principal component analysis and by using dichotomous variables that
account for the ownership of (i) mill, (ii) refrigerator, (iii) electric iron, (iv) sewing machine, (v) television, (vi)
radio, (vii) cassette player/recorder, (viii) camera, (ix) personal computer, (x) automobile/pick-up truck, (xi)
motorcycle, (xii) bicycle, (xiii) telephone, (xiv) cell phone, and (xv) other. The 1985 value of the index is calculated
from the 2005 survey, based on the recall data on asset ownership 20 years ago. 28
Modern kitchen is defined a dwelling room that is equipped with a stove and designated solely for cooking. 29
The findings reported in Tables 5 and 6 stem from estimations that included the complete set of exogenous
observable variables, as reported in Section 5. Full regression results are available upon request.
23
stayers in comparison to those that never adopted snow peas, as indicated by Γ1. While Γ2 and Γ3
are negative, they are not statistically significant, indicating that the welfare improvements over
the two decades for both leavers and late adopters were not significantly different than the
improvements exhibited by non-adopters in the same period.
Moreover, β1 and β2 suggest that by 1985, the level of consumption was significantly
higher for adopters (i.e. for both stayers and leavers) in comparison to non-adopters. On the other
hand, β3 implies that the 1985 differences in household consumption status between non-adopters
and late adopters were not statistically significant. Although this is what we would expect based
on the findings of the earlier IFPRI baseline study (von Braun et al., 1989a), we cannot be certain
that selection bias in early adoption is not partly responsible for the 1985 differences. Had we
had access to survey data dating back to the pre-1979 period, our results would have painted the
most comprehensive picture concerning the impact of NTX adoption, as it materialized between
1979, i.e the first year in which the export crops were introduced in the region, and 2005. Since
the 1985 differences in welfare levels between stayers and leavers (i.e. the adopters by 1985) and
between non-adopters and late adopters (i.e. the non-adopters by 1985) were not statistically
significant, the DD estimation could be interpreted as the welfare impact of adoption in the 1985-
2005 period only, given a degree of pre-1985 differences between the early adopters on the one
hand and non-adopters and late adopters on the other.
In terms of durable assets, we observe that household asset positions improved
significantly for non-adopters and adopters alike throughout the period of 1985-2005. Regardless
of the way that the outcome variable is defined, early adopting but leaving snow pea cultivation
by 2005 exerts a positive and statistically significant effect on durable asset accumulation. Even
24
though Γ1 for stayers and Γ3 for late adopters are positive, they are not statistically significant.30
We also see that Γ2 for leavers is statistically different from Γ1 when we use the durable asset
index as the dependent variable. Table 6 shows that various measures of favorable dwelling
conditions have improved in the survey communities over time, regardless of snow pea adoption
status.31
Γ1, Γ2, and Γ3 in the first column indicate that with respect to non-adopters, all adopter
categories are more likely to reside in a dwelling with improved walls by 2005. The differences
among adopter groups, however, are not statistically significant. Finally, the likelihood of having
access to an improved cooking facility is significantly higher among leavers compared to non-
adopters.32
7 CONCLUSION
This paper is a recent and unique contribution to the literature on the impact of non-
traditional export crop adoption on household welfare. Different from the studies that have so far
used cross-sectional data and focused on the short-term impacts of interest, we employ a unique
panel data set that spans 20 years (1985-2005) and allows us to control for the non-random
nature of NTX adoption in order to estimate the long-term impact of snow pea cultivation on
household consumption status and asset position in Guatemala‟s Santiago Sacatepéquez
municipality. Due to the dramatic changes in the agricultural and socio-economic make-up of the
30
When we differentiate between leavers and stayers among the late adopters, and estimate durable asset
regressions, we see that the increase in durable assets appears to be lower among late adopter stayers in comparison
to non-adopters, while the opposite result surfaces from the comparison of late adopter leavers with non-adopters. 31
As demonstrated by Ai and Norton (2003), the coefficient of the interaction term in nonlinear models, such as
Probit or Logit for dichotomous dependent variables, is not equivalent to the marginal effect that is calculated by the
statistical software. We estimated the marginal effects of the interaction terms reported in Table 6 using the inteff
command in Stata and obtained results that were qualitatively similar to those from the linear probability models.
These results are available upon request. 32
When we differentiate between leavers and stayers among the late adopters, and estimate regressions of various
dwelling characteristics, the positive impact of late adoption on the likelihood of residing in a dwelling with cement
walls is driven by the late adopter stayers.
25
surveyed communities throughout the last 2 decades and the heterogeneity in NTX cultivation
histories, we explore the heterogeneity of impact based on a classification of households that
takes into account the timing and duration of snow pea adoption.
With robust foreign demand for NTXs and extensive financial, marketing, and technical
support provided by the Cuatro Pinos cooperative, the area under investigation experienced a
significant boom in NTX production in the 1980s. Snow pea cultivation, at the onset, translated
into substantial improvements in consumption levels and noteworthy positive spillovers in staple
food production among adopters. However, throughout the 1990s, a wide range of agronomic,
market-based, and institutional problems led to a significant drop in the profitability of snow pea
production, causing a sizeable number of smaller and resource-poor farmers to withdraw from
export crop production and raising concerns about the sustainability of the development impact
of NTX production in the long run.
In line with the medium-term expectations and the recent qualitative evidence on the
association of snow pea adoption paths and changes in household welfare and livelihood
strategies, we find that while consumption status improved for all household groups in the
surveyed communities between 1985 and 2005, the extent of improvement among long-term
adopters, i.e. those that adopted early and stayed on until 2005, was lower when compared with
the changes experienced by non-adopters. Conversely, early adopters who withdrew from snow
pea production by the early 1990s and increased their reliance on off-farm income sources have
shown the largest improvements in durable asset position and housing conditions with respect to
both stayers and non-adopters.

26
Fischer and Benson‟s (2005) qualitative study offers interesting insights to understand the
rationale for continued NTX production, particularly among early adopters that enjoyed the most
rewarding era of export crop production in the Central Highlands of Guatemala. According to the
authors, growers tend to rationalize their continued involvement in the NTX cultivation in the
midst of high production and marketing risks by referring to the higher potential rates of return in
comparison to the subsistence production.33
They also show that among those that have produced
NTXs with some continuity over the past two decades, there exists a degree of illusion of higher
prices to come, as some anticipate that going forward, the rock-bottom prices can only rise.
Somewhat in line with our findings, the authors assert that the NTX farmers end up expending
extensive effort “for algo mas (something better or more) that never seems to arrive, or at least
always comes up short, providing only a small amount of extra money and little chance for
substantive economic change.” (pp. 4)
As mentioned above, despite the uniqueness of the dataset spanning a period of two
decades, the lack of data pertaining to the outcomes of interest in the pre-1979 period warrants
some caution in interpreting the findings. However, we believe that this study underscores the
possibility of increased agricultural commercialization and diversification into high-value, non-
traditional export crops to deliver less prosperity to growers than initially promised. The results,
particularly among stayers, originate in part from the medium-term failure of Cuatro Pinos,
which had been the primary catalyst for the initial diffusion of NTXs among smallholders in
Santiago Sacatepéquez. In this respect, the endurance of the positive welfare impacts of NTX
production is a function of the sustainability of viable institutional arrangements that mitigate
33
Despite the high risks associated with NTX production, some still perceive it as an instrument to maintain
affective ties to land and reinforce family unity (Hamilton and Fischer, 2005).
27
NTX marketing and production risks that would otherwise hamper the diffusion of capital-
intensive, high-value non-traditional crops among smallholders.
In particular, the negative welfare impact of deterioration in snow pea prices and
profitability, which was partly due to increased regional competition and market saturation,
might have been mitigated to a degree, had the cooperative held a more diversified product
portfolio and been more active in the rapid promotion of alternative export crops among NTX
growers. It is, therefore, important for crop diversification strategies to provide accurate
information on market demand and profitability, and foster the differentiation of product
portfolios and marketing outlets in order to sustain growth and poverty alleviation effects of
NTX production.
Given the empirical evidence on the long-term welfare impact of NTX cultivation and the
emergence of alternative non-farm activities in the region concurrent with the medium-term woes
associated with NTX production, analysis of household access to non-farm income sources in
relation NTX adoption will be instrumental to gain a better understanding of the alternative
pathways that have been taken by non-adopters and former NTX adopters, and the role that the
NTX production might have played in bringing about radical changes in household livelihoods.
Research in this area is currently being pursued using the same dataset.
28
REFERENCES
Ai, D., Norton, E. C. (2003). Interaction terms in logit and probit models. Economics Letters, 80,
pp. 123-129.
Barham, B., Clark, M., Katz, E., Schurman, R. (1992). Nontraditional agricultural exports in
Latin America. Latin American Research Review, 27.2, pp. 43-82.
Barham, B., Carter, M. R., Sigelko, W. (1995). Agro-export production and peasant land access:
Examining the dynamic between adoption and accumulation. Journal of Development
Economics, 46, pp. 85-107.
Binswanger, H., Feder, Gershon, Deininger, K. (1995). Power distortions and reform in
agricultural land relations. In Handbook of development economics, Vol. 3, (Eds.) J.
Behrman and T. N. Srinivasan, Amsterdam: North Holland.
Birthal, P. S., Joshi, P. K., Gulati, A. (2005). Vertical coordination in high-value food
commodities: Implications for smallholders. IFPRI MTID Discussion Paper No. 85
Bouis, H. E., Haddad, L. J. (1990). Effects of agricultural commercialization on land tenure,
household resource allocation, and nutrition in the Philippines. IFPRI Research Report
No. 79.
Carletto, C., de Janvry, A., Sadoulet, E. (1999). Sustainability in the diffusion of innovations :
Smallholder non-traditional agro-exports in Guatemala. Economic Development and
Cultural Change, 47.2, pp. 345-369.
Carletto, C. (2000). Nontraditional crops and land accumulation among Guatemalan
smallholders. IFPRI FCND Discussion Paper No. 80.
Carletto, C., Kirk., A., Winters, P., Davis, B. (2007). Non-traditional crops, traditional
constraints: The adoption and diffusion of export crops among Guatemalan smallholders.
World Bank Policy Research Working Paper No. 4347.
Carter, M., Barham, B. L. (1996). Level playing fields and laissez faire: Postliberal development
strategy in inegalitarian agrarian economies. World Development, 24.7, pp. 1133-1149.
Carter, M., Barham, B. L., Mesbah, D. (1996). Agricultural export booms and the rural poor in
Chile, Guatemala, and Paraguay. Latin American Research Review, 31.1, pp. 33-65.
FAO (2004). The market for non-traditional agricultural exports. FAO Commodities and Trade
Technical Paper No. 3.
Fischer, E. F., Benson, P. (2005). Something better: Hegemony, development, and desire in
Guatemalan export agriculture. Social Analysis, 49.1, pp. 3-20.
Galasso, E., Ravallion, M., Salvia, A. (2004). Assisting the transition from workfare to work: A
randomized experiment. Industrial and Labor Relations Review, 58.1, pp. 128-142.
Goldin, L. (2001). Maquila age Maya: Changing households and communities of the central
highlands of Guatemala. Journal of Latin American Anthropology, 6.1, pp. 30-57.
Goldin, L. R. (2005). Labor ideologies in the international factories of rural Guatemala. Latin
American Perspectives, 32, pp. 59-79.
Hamilton, S., Fischer, E. (2003). Non-traditional agricultural exports in Highland Guatemala:
Understandings of risk and perceptions of change. Latin American Research Review,
38.3, pp. 82-110.
Hamilton, S., Fischer, E. F. (2005). Maya farmers and export agriculture in highland Guatemala:
Implications for development and labor relations. Latin American Perspectives, 32.5, pp.
33-58.
29
Immink, M. D. C., Alarcon, J. A. (1993). Household income, food availability, and commercial
crop production by smallholder farmers in the Western highlands of Guatemala.
Economic Development and Cultural Change, 41.2, pp. 319-342.
Immink, M. D. C., Payongayong, E., Kennedy, E., Sibrian, R. Export vegetable crops and
poverty alleviation for smallholder farm households: A case study from Guatemala. Paper
presented at the workshop on Poverty Alleviation through International Trade at
UNCTAD, Santiago, Chile, January 10-13, 1995.
Julian, J. W., Sullivan, G. H., Sanchez, G. E. (2000). Future market development issues
impacting Central America‟s nontraditional agricultural export sector: Guatemala case
study. American Journal of Agricultural Economics, 82.5, pp. 1177-1183.
Katz, E. (1994). The impact of non-traditional export agriculture on income and food availability
in Guatemala: An intra-household perspective. The United Nations University Press -
Food and Nutrition Bulletin, 15.4.
Kennedy, E. T., Cogill, B. (1987). Income and nutritional effects of commercialization of
agriculture in southwestern Kenya. IFPRI Research Report No. 63.
Kennedy, E. T. (1989). The effects of sugarcane production on food security, health, and
nutrition in Kenya: A longitudinal analysis. IFPRI Research Report No. 78.
Ligon, E., Sadoulet, E. (2007). Estimating the effects of aggregate agricultural growth on the
distribution of expenditures. Background paper for the 2008 World Development Report.
Ravallion, M., Chen, S. (2004). China‟s (Uneven) Progress Against Poverty. World Bank Policy
Research Working Paper No. 3408.
Saenz de Tejada, S. 2002. Changing livelihoods in Santiago Sacatepequez. Mimeo.
Secretaria de Planificación y Programación (SEGEPLAN). 2005. Mapas de pobreza y
desigualdad de Guatemala.
Thrupp, L. A., Bergeron, G., Waters, W. (1995). Bittersweet harvests for global supermarkets:
Sustainability and equity in Latin America’s agroexport boom. Washington, DC: World
Resources Institute.
United Nations Population Division (UNPD) (2007). Rural population, development and the
environment. Retrieved on 05/01/2009 from
http://www.un.org/esa/population/publications/2007_PopDevt/Rural_2007.pdf.
von Braun, J., Hotchkiss, D., Immink, M. (1989a). Nontraditional export crops in Guatemala:
Effects on production, income, and nutrition. International Food Policy Research Institute
Research Report 73.
von Braun, J., Puetz, D., Webb, P. (1989b). Irrigation technology and commercialization of rice
in the Gambia: Effects on income and nutrition. IFPRI Research Report No. 75.
von Braun, J., de Haen, H., Blanken, J. (1991). Commercialization of agriculture under
population pressure: Effects on production, consumption, and nutrition in Rwanda. IFPRI
Research Report No. 85.
von Braun, J., Immink, M. D. C. (1994). Nontraditional vegetable crops and food security among
smallholder farmers in Guatemala. In Agricultural commercialization, economic
development, and nutrition, (Eds.) J. von Braun and E. T. Kennedy. Baltimore, MD and
London: The Johns Hopkins University Press.
Williams, R. G. (1986) Export agriculture and the crisis in Central America. Chapel Hill, NC:
University of North Carolina Press.
World Bank (2009). Guatemala Poverty Assessment: Good Performance at Low Levels. Report
No. 43920-GT.
30
ANNEX
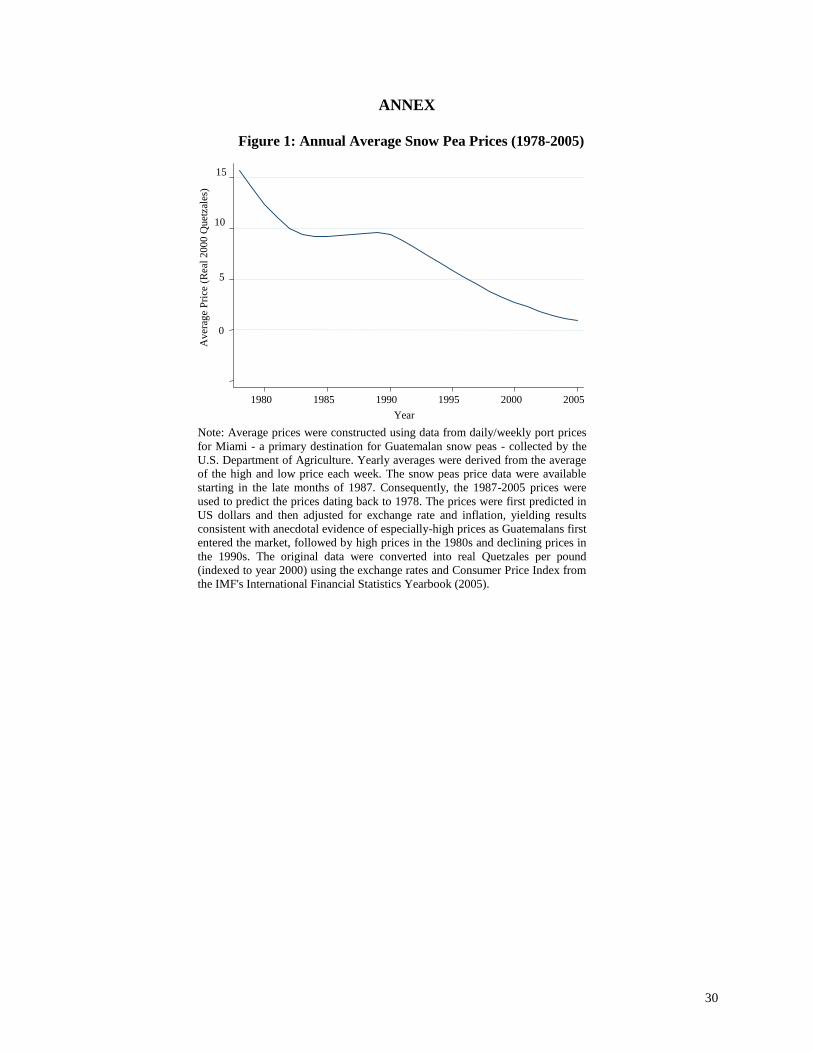
Note: Average prices were constructed using data from daily/weekly port prices
for Miami - a primary destination for Guatemalan snow peas - collected by the
U.S. Department of Agriculture. Yearly averages were derived from the average
of the high and low price each week. The snow peas price data were available
starting in the late months of 1987. Consequently, the 1987-2005 prices were
used to predict the prices dating back to 1978. The prices were first predicted in
US dollars and then adjusted for exchange rate and inflation, yielding results
consistent with anecdotal evidence of especially-high prices as Guatemalans first
entered the market, followed by high prices in the 1980s and declining prices in
the 1990s. The original data were converted into real Quetzales per pound
(indexed to year 2000) using the exchange rates and Consumer Price Index from
the IMF's International Financial Statistics Yearbook (2005).
0
5
10
15
Figure 1: Annual Average Snow Pea Prices (1978-2005)
Av
erag
e P
rice
(R
eal
200
0 Q
uet
zale
s)
2005 2000 1995 1990 1985 1980 Year
31
Table 1: Distribution of Sample Households
by Snow Pea Adoption Status
Obs Share
Non-Adopter 47 16.0%
Early Adopter - Stayer 71 24.2%
Early Adopter - Leaver 110 37.5%
Late Adopter 65 22.2%
TOTAL 293 100.0%
\
Table 2: HH NTX Involvement by Snow Pea Adoption Status
Overall Never Ever Leaver Stayer Late
Ever cultivated snow peas ∆ 0.85 0.09 1.00 1.00 1.00 1.00
Years of snow pea cultivation 12.3 0.1 14.6 13.3 21.0 9.9
Year of snow pea adoption 1983 1990 1983 1981 1981 1988
Last year of snow pea cultivation 1998 1990 1998 1994 2004 1997
Ever cultivated string beans ∆ 0.67 0.06 0.78 0.75 0.89 0.74
Years of string beans cultivation 6.8 0.1 8.0 8.2 9.9 5.6
Year of string beans adoption 1987 1997 1987 1984 1987 1991
Ever cooperative member ∆ * 0.67 0.00 0.80 0.76 0.96 0.68
Cooperative member, 1985 ∆ 0.46 0.06 0.53 0.63 0.77 0.09
Cooperative member, 2005 ∆ 0.25 0.00 0.30 0.09 0.75 0.17
Years of cooperative membership 11.5 0.0 13.7 12.4 21.4 7.6
Ever member of junta directiva ∆ * 0.38 0.00 0.46 0.42 0.69 0.26
Good relations with junta directiva, 2005 ∆ 0.49 0.00 0.58 0.53 0.85 0.38
Good relations with cooperative management 2005 ∆ 0.46 0.00 0.55 0.55 0.75 0.34
Note: ∆ denotes a dummy variable; Non-adopters could have cultivated snow peas, given the two-year threshold for
ever-adoption; * indicates that the variable is from the 2005 survey; There is slight under-recall of coop
membership among those with brief membership.

32
Table 3: Various Dimensions of HH Characteristics by Snow Pea Adoption Status
Overall Never Ever Leaver Stayer Late
HH size, 1985 6.29 6.17 6.31
6.37
6.63
5.85
HH size, 2005 6.02 5.66 6.09
5.97
5.99
6.40
Change(2005-1985) -0.27 -0.51 -0.22
-0.40
-0.65
0.55
# of members [0-14], 1985 3.64 3.36 3.69
3.73
3.96 * 3.34
# of members [0-14], 2005 1.61 1.49 1.63
1.37
1.52
2.18 *
Change(2005-1985) -2.03 -1.87 -2.06
-2.35
-2.44
-1.15
# of female members [15-64], 1985 1.28 1.32 1.27
1.26
1.31
1.23
# of female members [15-64], 2005 2.13 1.89 2.18
2.24
2.15
2.11
Change(2005-1985) 0.86 0.57 0.91
0.97
0.85
0.88
# of male members [15-64], 1985 1.32 1.43 1.30
1.34
1.31
1.23
# of male members [15-64], 2005 2.13 1.89 2.18
2.24
2.15
2.11
Change(2005-1985) 0.81 0.47 0.88 * 0.90
0.85
0.88
# of members [64+], 1985 0.05 0.06 0.05
0.05
0.06
0.05
# of members [64+], 2005 0.30 0.47 0.27 ** 0.28 * 0.32
0.20 **
Change(2005-1985) 0.25 0.40 0.22 * 0.24
0.27
0.15 **
HH highest years of education, 1985 4.70 4.65 4.72
5.01
4.73
4.21
HH highest years of education, 2005 6.51 5.53 6.69 ** 7.55 *** 6.04
5.97
Change(2005-1985) 1.83 0.92 2.00 * 2.58 ** 1.34
1.76
HH average years of education, 1985 2.12 2.14 2.11
2.14
2.18
1.97
HH average years of education, 2005 4.03 3.61 4.11
4.49 ** 3.87
3.75
Change(2005-1985) 1.93 1.47 2.02
2.36 ** 1.70
1.79
HH head: Not working, 1985 0.02 0.00 0.02
0.04
0.01
0.02
HH head: Not working, 2005 0.10 0.15 0.09
0.15
0.03 ** 0.05 *
Change(2005-1985) 0.08 0.15 0.06 * 0.11
0.01 ** 0.03 **
HH head: Farmer, 1985 0.66 0.30 0.73 *** 0.73 *** 0.86 *** 0.58 ***
HH head: Farmer, 2005 0.55 0.28 0.61 *** 0.45 ** 0.90 *** 0.54 ***
Change(2005-1985) -0.11 -0.02 -0.12
-0.27 ** 0.04
-0.05
HH head: Low-skilled blue collar worker, 1985 0.26 0.60 0.19 *** 0.18 *** 0.08 *** 0.32 ***
HH head: Low-skilled blue collar worker, 2005 0.14 0.34 0.10 *** 0.11 *** 0.04 *** 0.14 **
Change(2005-1985) -0.12 -0.26 -0.09 ** -0.07 ** -0.04 ** -0.18
HH head: High-skilled blue collar worker, 1985 0.05 0.11 0.04 ** 0.03 ** 0.01 ** 0.08
HH head: High-skilled blue collar worker, 2005 0.13 0.17 0.12
0.15
0.01 *** 0.18
Change(2005-1985) 0.08 0.06 0.08
0.12
0.00
0.11
HH head: White collar worker, 1985 0.02 0.00 0.02
0.03
0.03
0.00
HH head: White collar worker, 2005 0.09 0.06 0.09
0.15
0.01
0.09
Change(2005-1985) 0.07 0.06 0.07
0.12
-0.01
0.09
Land owned [Ha], 1979 0.25 0.16 0.26
0.29
0.34 ** 0.14
Land owned [Ha], 1983 0.33 0.18 0.36 ** 0.38 ** 0.51 *** 0.18
Land owned [Ha], 1985 0.48 0.26 0.53 *** 0.59 *** 0.61 *** 0.33
Land owned [Ha], 2005 0.49 0.23 0.54 *** 0.49 *** 0.78 *** 0.36 *
Change(2005-1985) 0.00 -0.03 0.01
-0.10
0.17 * 0.02
Land rented/borrowed/shared [Ha], 1985 0.11 0.08 0.12
0.12
0.11
0.11
Land rented/borrowed/shared [Ha], 2005 0.08 0.06 0.09
0.03
0.09
0.18 **
Change(2005-1985) -0.03 -0.03 -0.03
-0.09
-0.02
0.07
% of land irrigated, 2005 0.06 0.02 0.07 ** 0.05 * 0.10 *** 0.06
Cooperative member, 1985 0.46 0.06 0.53 *** 0.63 *** 0.77 *** 0.09
Cooperative member, 2005 0.25 0.00 0.30 *** 0.09 ** 0.75 *** 0.17 ****
Change(2005-1985) -0.20 -0.06 -0.23 * -0.54 *** -0.03
0.08 *
Real per capita consumption, 1985 3,580 2,932 3,704 ** 4,031 *** 3,815 * 3,030
Real per capita consumption, 2005 6,059 5,690 6,130
7,002 ** 5,322
5,535
Change(2005-1985) 2,479 2,757 2,426
2,971
1,507 * 2,506
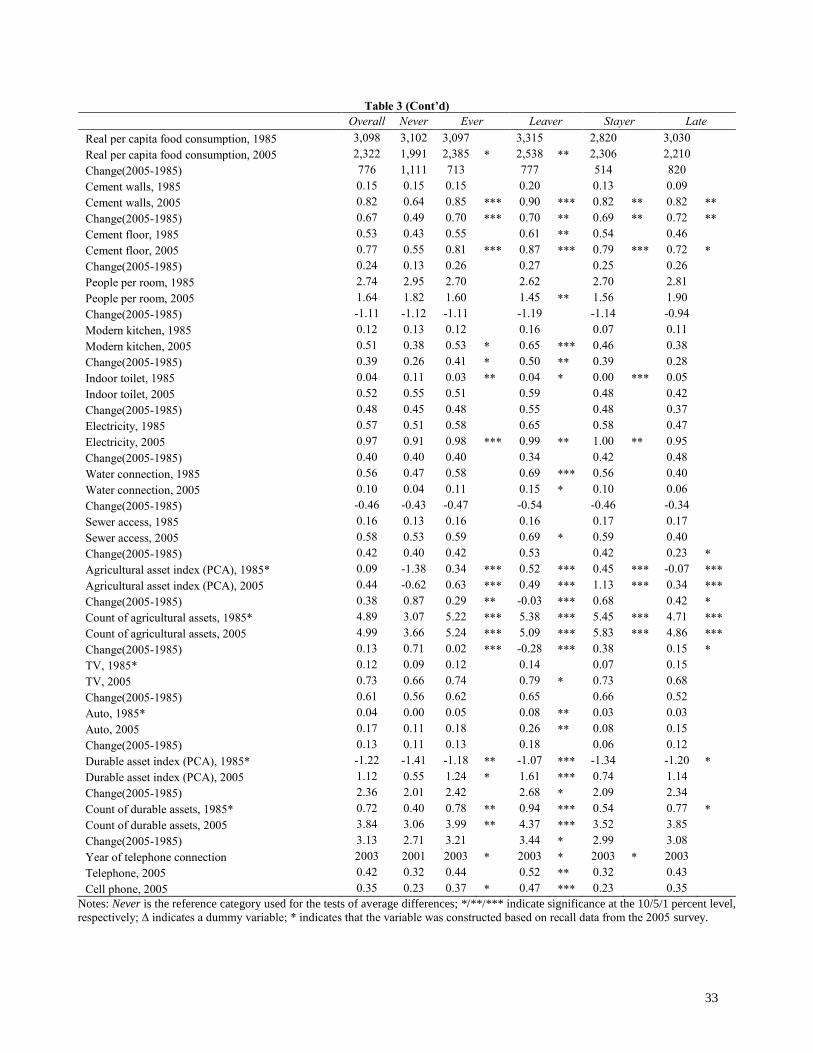
33
Table 3 (Cont’d)
Overall Never Ever Leaver Stayer Late
Real per capita food consumption, 1985 3,098 3,102 3,097
3,315
2,820
3,030
Real per capita food consumption, 2005 2,322 1,991 2,385 * 2,538 ** 2,306
2,210
Change(2005-1985) 776 1,111 713
777
514
820
Cement walls, 1985 0.15 0.15 0.15
0.20
0.13
0.09
Cement walls, 2005 0.82 0.64 0.85 *** 0.90 *** 0.82 ** 0.82 **
Change(2005-1985) 0.67 0.49 0.70 *** 0.70 ** 0.69 ** 0.72 **
Cement floor, 1985 0.53 0.43 0.55
0.61 ** 0.54
0.46
Cement floor, 2005 0.77 0.55 0.81 *** 0.87 *** 0.79 *** 0.72 *
Change(2005-1985) 0.24 0.13 0.26
0.27
0.25
0.26
People per room, 1985 2.74 2.95 2.70
2.62
2.70
2.81
People per room, 2005 1.64 1.82 1.60
1.45 ** 1.56
1.90
Change(2005-1985) -1.11 -1.12 -1.11
-1.19
-1.14
-0.94
Modern kitchen, 1985 0.12 0.13 0.12
0.16
0.07
0.11
Modern kitchen, 2005 0.51 0.38 0.53 * 0.65 *** 0.46
0.38
Change(2005-1985) 0.39 0.26 0.41 * 0.50 ** 0.39
0.28
Indoor toilet, 1985 0.04 0.11 0.03 ** 0.04 * 0.00 *** 0.05
Indoor toilet, 2005 0.52 0.55 0.51
0.59
0.48
0.42
Change(2005-1985) 0.48 0.45 0.48
0.55
0.48
0.37
Electricity, 1985 0.57 0.51 0.58
0.65
0.58
0.47
Electricity, 2005 0.97 0.91 0.98 *** 0.99 ** 1.00 ** 0.95
Change(2005-1985) 0.40 0.40 0.40
0.34
0.42
0.48
Water connection, 1985 0.56 0.47 0.58
0.69 *** 0.56
0.40
Water connection, 2005 0.10 0.04 0.11
0.15 * 0.10
0.06
Change(2005-1985) -0.46 -0.43 -0.47
-0.54
-0.46
-0.34
Sewer access, 1985 0.16 0.13 0.16
0.16
0.17
0.17
Sewer access, 2005 0.58 0.53 0.59
0.69 * 0.59
0.40
Change(2005-1985) 0.42 0.40 0.42
0.53
0.42
0.23 *
Agricultural asset index (PCA), 1985* 0.09 -1.38 0.34 *** 0.52 *** 0.45 *** -0.07 ***
Agricultural asset index (PCA), 2005 0.44 -0.62 0.63 *** 0.49 *** 1.13 *** 0.34 ***
Change(2005-1985) 0.38 0.87 0.29 ** -0.03 *** 0.68
0.42 *
Count of agricultural assets, 1985* 4.89 3.07 5.22 *** 5.38 *** 5.45 *** 4.71 ***
Count of agricultural assets, 2005 4.99 3.66 5.24 *** 5.09 *** 5.83 *** 4.86 ***
Change(2005-1985) 0.13 0.71 0.02 *** -0.28 *** 0.38
0.15 *
TV, 1985* 0.12 0.09 0.12
0.14
0.07
0.15
TV, 2005 0.73 0.66 0.74
0.79 * 0.73
0.68
Change(2005-1985) 0.61 0.56 0.62
0.65
0.66
0.52
Auto, 1985* 0.04 0.00 0.05
0.08 ** 0.03
0.03
Auto, 2005 0.17 0.11 0.18
0.26 ** 0.08
0.15
Change(2005-1985) 0.13 0.11 0.13
0.18
0.06
0.12
Durable asset index (PCA), 1985* -1.22 -1.41 -1.18 ** -1.07 *** -1.34
-1.20 *
Durable asset index (PCA), 2005 1.12 0.55 1.24 * 1.61 *** 0.74
1.14
Change(2005-1985) 2.36 2.01 2.42
2.68 * 2.09
2.34
Count of durable assets, 1985* 0.72 0.40 0.78 ** 0.94 *** 0.54
0.77 *
Count of durable assets, 2005 3.84 3.06 3.99 ** 4.37 *** 3.52
3.85
Change(2005-1985) 3.13 2.71 3.21
3.44 * 2.99
3.08
Year of telephone connection 2003 2001 2003 * 2003 * 2003 * 2003
Telephone, 2005 0.42 0.32 0.44
0.52 ** 0.32
0.43
Cell phone, 2005 0.35 0.23 0.37 * 0.47 *** 0.23 0.35
Notes: Never is the reference category used for the tests of average differences; */**/*** indicate significance at the 10/5/1 percent level,
respectively; ∆ indicates a dummy variable; * indicates that the variable was constructed based on recall data from the 2005 survey.
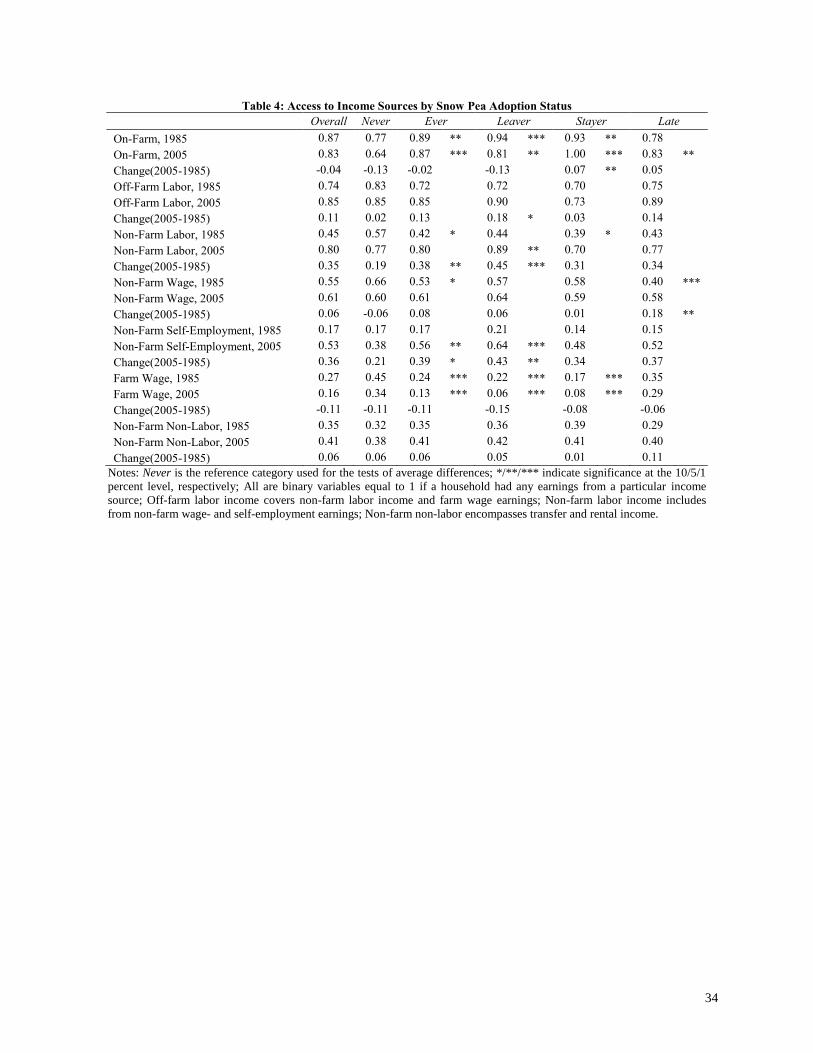
34
Table 4: Access to Income Sources by Snow Pea Adoption Status
Overall Never Ever Leaver Stayer Late
On-Farm, 1985 0.87 0.77 0.89 ** 0.94 *** 0.93 ** 0.78
On-Farm, 2005 0.83 0.64 0.87 *** 0.81 ** 1.00 *** 0.83 **
Change(2005-1985) -0.04 -0.13 -0.02
-0.13
0.07 ** 0.05
Off-Farm Labor, 1985 0.74 0.83 0.72
0.72
0.70
0.75
Off-Farm Labor, 2005 0.85 0.85 0.85
0.90
0.73
0.89
Change(2005-1985) 0.11 0.02 0.13
0.18 * 0.03
0.14
Non-Farm Labor, 1985 0.45 0.57 0.42 * 0.44
0.39 * 0.43
Non-Farm Labor, 2005 0.80 0.77 0.80
0.89 ** 0.70
0.77
Change(2005-1985) 0.35 0.19 0.38 ** 0.45 *** 0.31
0.34
Non-Farm Wage, 1985 0.55 0.66 0.53 * 0.57
0.58
0.40 ***
Non-Farm Wage, 2005 0.61 0.60 0.61
0.64
0.59
0.58
Change(2005-1985) 0.06 -0.06 0.08
0.06
0.01
0.18 **
Non-Farm Self-Employment, 1985 0.17 0.17 0.17
0.21
0.14
0.15
Non-Farm Self-Employment, 2005 0.53 0.38 0.56 ** 0.64 *** 0.48
0.52
Change(2005-1985) 0.36 0.21 0.39 * 0.43 ** 0.34
0.37
Farm Wage, 1985 0.27 0.45 0.24 *** 0.22 *** 0.17 *** 0.35
Farm Wage, 2005 0.16 0.34 0.13 *** 0.06 *** 0.08 *** 0.29
Change(2005-1985) -0.11 -0.11 -0.11
-0.15
-0.08
-0.06
Non-Farm Non-Labor, 1985 0.35 0.32 0.35
0.36
0.39
0.29
Non-Farm Non-Labor, 2005 0.41 0.38 0.41
0.42
0.41
0.40
Change(2005-1985) 0.06 0.06 0.06 0.05 0.01 0.11
Notes: Never is the reference category used for the tests of average differences; */**/*** indicate significance at the 10/5/1
percent level, respectively; All are binary variables equal to 1 if a household had any earnings from a particular income
source; Off-farm labor income covers non-farm labor income and farm wage earnings; Non-farm labor income includes
from non-farm wage- and self-employment earnings; Non-farm non-labor encompasses transfer and rental income.

35
Notes for Tables 5 and 6: */**/*** indicate significance at the 10/5/1 percent level, respectively; Constant term and the
coefficients for all baseline controls reported in Section 5 estimated but not presented; Robust standard errors in parentheses.
Table 5: DD Models of Snow Pea Adoption Effects on HH Consumption & Asset Position
Log Real Per Capita
Consumption
Log Real Per Capita
Food Consumption
Durable Asset
Count
Durable Asset
Index (PCA)
t (θ) 0.634*** 0.328*** 2.674*** 1.969***
(0.105) (0.095) (0.337) (0.295)
Early Adopter-Stayer (β1) 0.238** 0.132* 0.194 0.112
(0.093) (0.076) (0.199) (0.149)
t*Early Adopter-Stayer (Γ1) -0.242* -0.132 0.296 0.108
(0.135) (0.124) (0.417) (0.366)
Early Adopter-Leaver (β2) 0.302*** 0.194*** 0.514*** 0.330**
(0.085) (0.068) (0.199) (0.142)
t*Early Adopter-Leaver (Γ2) -0.074 -0.035 0.759* 0.709*
(0.125) (0.113) (0.429) (0.374)
Late Adopter (β3) 0.053 0.071 0.271 0.144
(0.091) (0.072) (0.233) (0.167)
t*Late Adopter (Γ3) -0.048 -0.024 0.403 0.372
(0.140) (0.124) (0.483) (0.416)
Observations 586 581 582 582
R2 0.332 0.211 0.506 0.446
Adjusted R2 0.288 0.159 0.474 0.410
P-values from Wald Tests
H0: β1 = β2 = β3 0.009 0.178 0.179 0.203
H0: β1 = β2 0.438 0.378 0.068 0.086
H0: β1 = β3 0.042 0.425 0.720 0.837
H0: β2 = β3 0.002 0.065 0.278 0.243
H0: Γ1 = Γ2 = Γ3 0.213 0.548 0.422 0.161
H0: Γ1 = Γ2 0.124 0.331 0.199 0.056
H0: Γ1 = Γ3 0.125 0.334 0.801 0.468
H0: Γ2 = Γ3 0.827 0.911 0.413 0.367
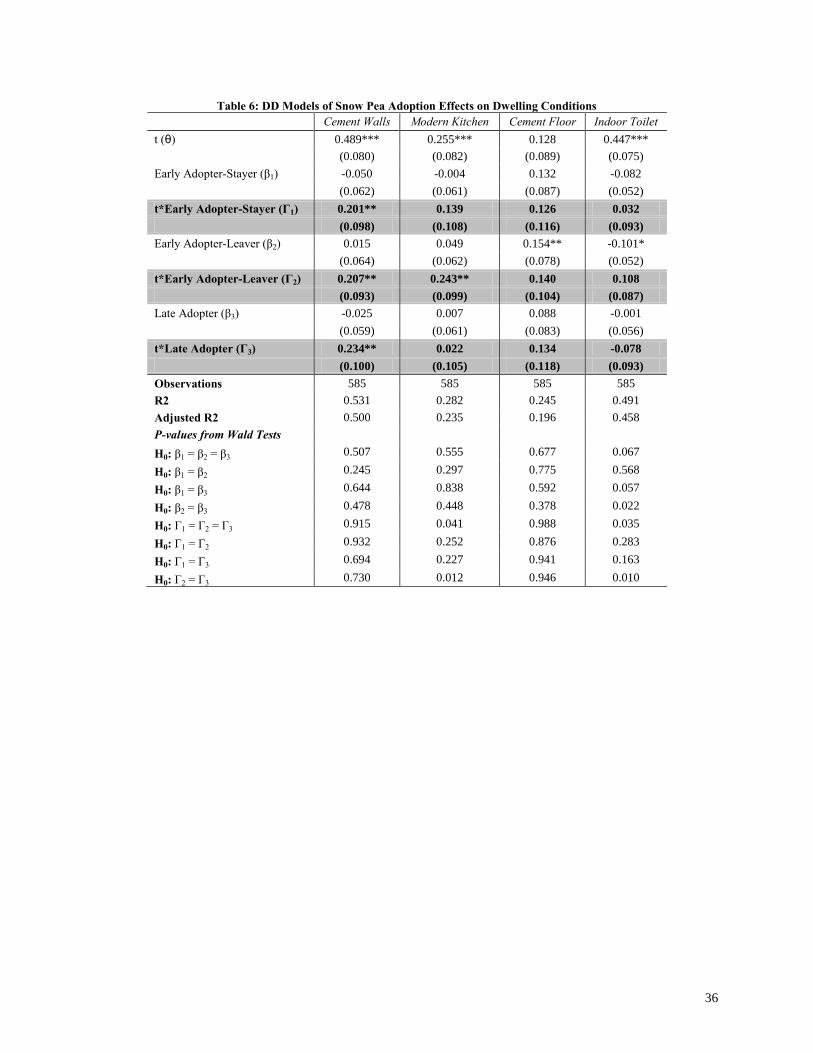
36
Table 6: DD Models of Snow Pea Adoption Effects on Dwelling Conditions
Cement Walls Modern Kitchen Cement Floor Indoor Toilet
t (θ) 0.489*** 0.255*** 0.128 0.447***
(0.080) (0.082) (0.089) (0.075)
Early Adopter-Stayer (β1) -0.050 -0.004 0.132 -0.082
(0.062) (0.061) (0.087) (0.052)
t*Early Adopter-Stayer (Γ1) 0.201** 0.139 0.126 0.032
(0.098) (0.108) (0.116) (0.093)
Early Adopter-Leaver (β2) 0.015 0.049 0.154** -0.101*
(0.064) (0.062) (0.078) (0.052)
t*Early Adopter-Leaver (Γ2) 0.207** 0.243** 0.140 0.108
(0.093) (0.099) (0.104) (0.087)
Late Adopter (β3) -0.025 0.007 0.088 -0.001
(0.059) (0.061) (0.083) (0.056)
t*Late Adopter (Γ3) 0.234** 0.022 0.134 -0.078
(0.100) (0.105) (0.118) (0.093)
Observations 585 585 585 585
R2 0.531 0.282 0.245 0.491
Adjusted R2 0.500 0.235 0.196 0.458
P-values from Wald Tests
H0: β1 = β2 = β3 0.507 0.555 0.677 0.067
H0: β1 = β2 0.245 0.297 0.775 0.568
H0: β1 = β3 0.644 0.838 0.592 0.057
H0: β2 = β3 0.478 0.448 0.378 0.022
H0: Γ1 = Γ2 = Γ3 0.915 0.041 0.988 0.035
H0: Γ1 = Γ2 0.932 0.252 0.876 0.283
H0: Γ1 = Γ3 0.694 0.227 0.941 0.163
H0: Γ2 = Γ3 0.730 0.012 0.946 0.010