the art of the chart - a guide to knowing when and … guide to knowing when and why to buy &...
TRANSCRIPT
TheART
Of TheCHART
By Joseph E. Majocha
Founder of Selective Chartists
A Guide To KnowingWhen and Why
To Buy & Sell Stocks
R
Contents
• How This Book Is Unique From Other Stock Market Books i And How It Can Help You
• Dedication iv
• Acknowledgments v
• Credits vi
• Introduction vii
• Biography ix
Some of the most common terminologies applied to the study of charts are discussed and shown with examples. The information is easy to read, to understand, and ultimately should enhance your future investment decisions.
Chapter 1 Fundamental & Technical Analysis 1
Chapter 2 Charts 3 - Why They Are Important - Types of Charts
Chapter 3 The 4 Stages of a Stock Cycle 7
- Basing - Advancing - Topping - Declining
Chapter 4 Volume 12
Chapter 5 Relative Strength 15
Chapter 6 Moving Averages 17
Chapter 7 Moving Average Convergence Divergence (MACD) 21
Chapter 8 Support 25
Chapter 9 Resistance 27
Chapter 10 Trendlines & Channels 29
- Basing Channel - Uptrend Channel - Downtrend Channel
Chapter 11 Pivot Point 36
Chapter 12 Breakout 40
Chapter 13 Price Gaps 43 - Breakaway Gap - Continuation Gap - Exhaustion Gap
Chapter 14 Reversal Day 47
Chapter 15 Applications Utilizing Indicators 50
Chapter 16 Stock Splits 67
Chapter 17 Limit Order 68
Chapter 18 Market Order 69
Chapter 19 Stop Loss Order 70
Chapter 20 Buying on Margin 72
Chapter 21 Short Selling 74
Chapter 22 Cost to Trade 75
– Discount vs. Full-Service Brokerage Houses
Chapter 23 Indexes 76
Chapter 24 IndExchange Trackers – Stocks That Mirror a Major Index 79 Chapter 25 iShares 86
Chapter 26 Rules of Investing 89
• Sources For Stock Market Information 96
• Recommended Investment Library 101
• Glossary 102
• Index 115

How This Book Is Unique From Other Stock Market Books and How It Can Help You
The ART Of The CHART is written for those who have a desire to invest in stocks and perform their own analyses, but have not found resources that can instruct them in an easy to read, to understand and apply methodology. This book introduces investors to invaluable essential concepts of stock market investing utilizing technical analysis. A visualization of conditions, descriptive usage of technical indicators and an explanation of terminologies applied to chart analysis are displayed and discussed. Practical applications with examples are presented via color charts with annotations providing insight to the decision making process of buying & selling stocks. Why This Book Was Written: Many of my friends and associates know that I have been an active and successful investor. There have been many occasions where they have asked the question: “I want to learn about the stock market. What book can you recommend that will teach what I need to know about buying and selling stocks, and is easy to read and understand?” As an experienced investor and collector of many publications related to the stock market, I am aware of the frustration that exists among investors seeking to find easy to read, to understand and apply sources of information. It is difficult to find a publication that visually describes the decision making process of buying & selling stocks. Common Frustrations In Seeking Stock Market Learning Sources Are:
Investors seeking to learn about the stock market have a difficult time finding a single source of information that provides the essential concepts of stock market investing. Material is typically sought from a variety of sources. The investor eventually becomes confused as the information resides in different formats from various publications. Each author has their own writing style and communicate in a manner unique to their own methodology. The investor ideally would like to maintain a continuity of information flow so as to digest the material in a logical manner. Due to the quantity of sources that become referenced, the investor eventually becomes discouraged and typically loses interest in continuing to pursue the knowledge they had originally set out to acquire.
Content of text in various publications is often written in a manner that is complicated and
technical. Therefore, the reader finds difficulty in comprehending the subject matter and does not acquire the knowledge in order to apply the information to actual market conditions.
Many publications provide explanation of technical detail, but do not display applications
for buy & sell decision-making considerations. The majority of books are printed in black & white, as the cost of publishing in color is cost prohibitive. The study of technical related material and detail of charts when printed in black & white typically becomes tedious to view when reading for elongated periods of time.
i

The ART Of The CHART Eliminates The Frustration Of Alternate Sources: The approach of this book is to provide the investor with knowledge of the most essential concepts of technical analysis, and provide visualization via color charts with annotations to enhance the learning of the material.
The primary focus of this book is to educate the investor about the most common and essential ingredients of technical analysis that are required for knowledgable successful investing. This book provides a logical flow of text as material is presented in a structured manner. A building process of knowledge is accomplished as progression of information occurs from one chapter to the next, providing a graduated learning curve.
This book does not attempt to provide discussions of mathematical formulas defining the
calculations associated with technical indicators. Only the most essential ingredients for successful investing related to technical analysis as applied to charts are presented and discussed.
This book presents an abundance of applications and examples with usage of 8 ½ x 11
color charts. Explanative comments on the charts provide insight to the considerations associated with the buy & sell decision-making process. The color graphics provide a visual stimulation for viewing the chapter contents and the descriptive annotations provide a methodology for enhanced learning.
This publication provides investors with knowledge of the essential concepts that every investor should be aware of when investing in the stock market.
How This Book Is Unique:
• The chapters of this book present a visualization of conditions as technical indicators are applied to chart analysis. The most commonly used terminologies are discussed to enhance an understanding as to why stocks may be poised for an advance, decline or sideways price movement.
• Information is presented in an easy to read, understand and apply format.
• The text flows logically from one chapter to another developing a building process of knowledge.
This book presents the most essential concepts of technical analysis with display and discussion of practical applications and examples in a manner that a novice investor can understand.
• Content is concise and to the point. Unlike many publications that use a lot of words and you then need to figure out what
is trying to be communicated, this book provides focus on the topic and presents the discussion in an easy to read manner.
ii
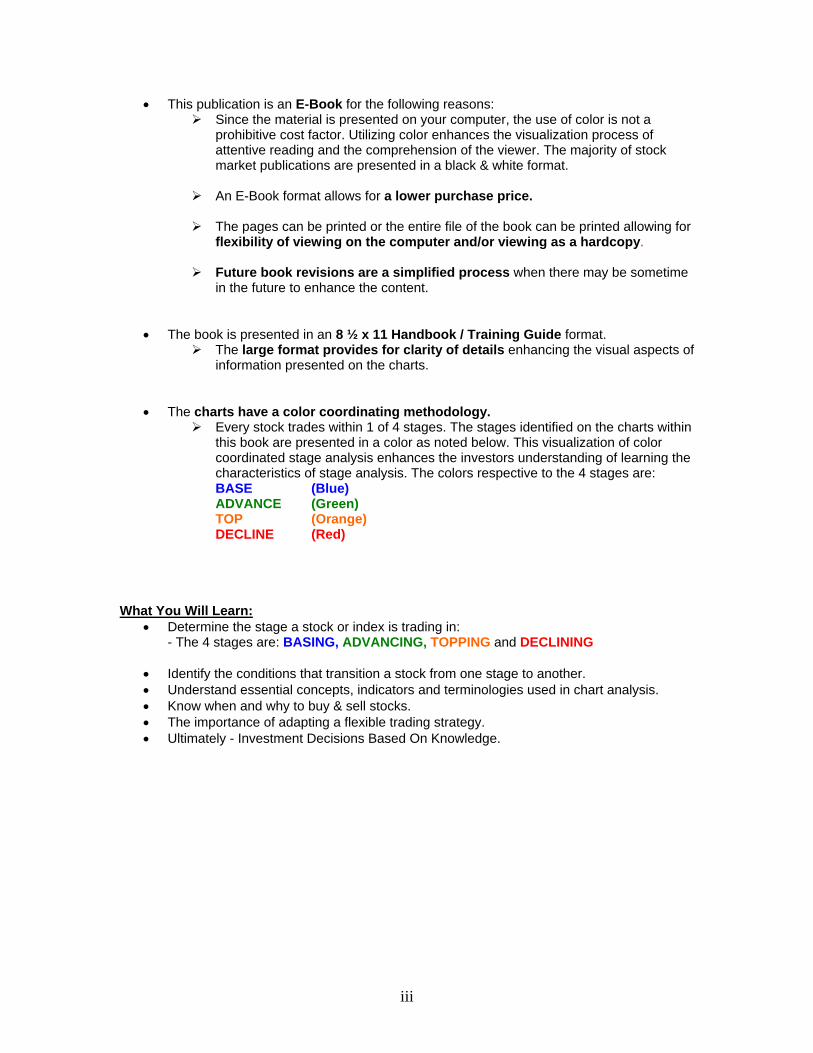
• This publication is an E-Book for the following reasons: Since the material is presented on your computer, the use of color is not a
prohibitive cost factor. Utilizing color enhances the visualization process of attentive reading and the comprehension of the viewer. The majority of stock market publications are presented in a black & white format.
An E-Book format allows for a lower purchase price.
The pages can be printed or the entire file of the book can be printed allowing for
flexibility of viewing on the computer and/or viewing as a hardcopy.
Future book revisions are a simplified process when there may be sometime in the future to enhance the content.
• The book is presented in an 8 ½ x 11 Handbook / Training Guide format. The large format provides for clarity of details enhancing the visual aspects of
information presented on the charts.
• The charts have a color coordinating methodology. Every stock trades within 1 of 4 stages. The stages identified on the charts within
this book are presented in a color as noted below. This visualization of color coordinated stage analysis enhances the investors understanding of learning the characteristics of stage analysis. The colors respective to the 4 stages are: BASE (Blue) ADVANCE (Green) TOP (Orange) DECLINE (Red)
What You Will Learn:
• Determine the stage a stock or index is trading in: - The 4 stages are: BASING, ADVANCING, TOPPING and DECLINING
• Identify the conditions that transition a stock from one stage to another. • Understand essential concepts, indicators and terminologies used in chart analysis. • Know when and why to buy & sell stocks. • The importance of adapting a flexible trading strategy. • Ultimately - Investment Decisions Based On Knowledge.
iii
Introduction The ART Of The CHART could not be a more meaningful title for this book, as having access to market information and data is only beneficial if the investor knows what to do with them. Charts provide a picture of where a stock has historically been and where it is currently trading. They can also provide insight to where a stock may be heading. Charts can be used to time buy and sell price points, maximizing gains and minimizing losses, and to warn the investor that something may be changing in the performance of the stock. As the title implies, chart analysis can be extremely valuable as proper interpretation can greatly enhance the performance of your investment decisions. That said, why haven’t more investors taken advantage of chart analysis? Answer - Technical analysis can be a complex discipline, and most publications present the material in a manner that is difficult for novice investors to understand. Writing this book has resulted in a guide to help investors become knowledgeable of essential concepts, indicators and terminologies applied to technical analysis. The chapters of this book will introduce you to the basics of reading charts and generating investment ideas. Topics are introduced one at a time, and the base of knowledge is built from one chapter to the next, presented in a format that is easy to read, understand, and apply. As an active and successful investor for many years, I have endeavored to fine-tune my investment decisions by analyzing conditions that led to gains and losses of investments in good and bad markets. Market conditions and climates vary. There is no guarantee that a certain method will work time after time, as many variables influence the direction of the market and the performance of stocks. No one can predict the markets’ future, and if forecasting were easy, everyone would be rich. I am satisfied if I can identify a market trend, implement a trading strategy accordingly, and stay with the trend for as long as it lasts. Most people do not realize that the buy and hold investment philosophy adhered to by many investors imposes greater risks than employing a FLEXIBLE TRADING STRATEGY. This book does not offer any information that is not already known to the experienced investor or the market professional. It is directed primarily to investors seeking to acquire an introductory knowledge of technical analysis and, from time to time, perform their own analyses. For them, this book provides an easy-to-understand methodology to initiate a way of thinking from which to draw independent conclusions, and not rely solely on the investment advice provided by others.
• Chapter 1 Explains the distinction between fundamental and technical analysis.
• Chapter 2
Displays the most popular types of charts available.
• Chapter 3 Examines the 4 stages of a stock cycle.
• Chapters 4 – 14
Introduces and explains essential tools, concepts and terminologies of technical analysis.
• Chapter 15 Applies the technical tools learned in chapters 4 – 14 to charts in each of the 4 stages. Applications and examples of patterns and concepts that occur in every day trading are provided for study.
vii
• Chapter 16 Describes the division of stock that occurs when companies declare price splits.
• Chapters 17 – 21
Discusses the various methods of placing orders to buy & sell, limiting losses to protect capital, and methods of trading using borrowed money.
• Chapter 22
Defines the differences between discount and full-service brokers.
• Chapters 23 – 25 Introduces methods of investing in the stock market employing broad diversification.
• Chapter 26
Presents general rules every investor should consider prior to investing enhancing the probabilities of successful investment decisions.
The ART Of The CHART focuses on how to develop a specific set of technical tools into a unified strategy for selecting short-term flexible trading opportunities in all market environments. SUMMARY: To succeed in the market, you must have discipline, adopt a flexible trading strategy, and employ patience so as to wait for indicators to trigger buy and sell considerations. No one can be right one hundred percent of the time. A successful investor is one who is right more often than wrong; minimizing losses and maximizing gains. By applying the information in this book, waiting for trends to develop, and utilizing indicators to eliminate the emotions of greed and fear, you can make money. The ultimate goal of this publication is to provide investors with knowledge of essential tools utilized in technical analysis, which will lead to PROFITABLE trading decisions. I hope the knowledge gained from reading this book will lead to more success than you ever thought possible.
For access to my website, please visit: www.selectivechartists.com
Selective Chartists communicates key concepts, terminologies and information that are essential to becoming a knowledgeable successful investor. Practical applications and examples of why stocks may be poised for an advance, decline or sideways price movement are provided for our subscribers to view and study. Joseph E. Majocha Founder of Selective Chartists & Author of the book: The ART Of The CHART
viii
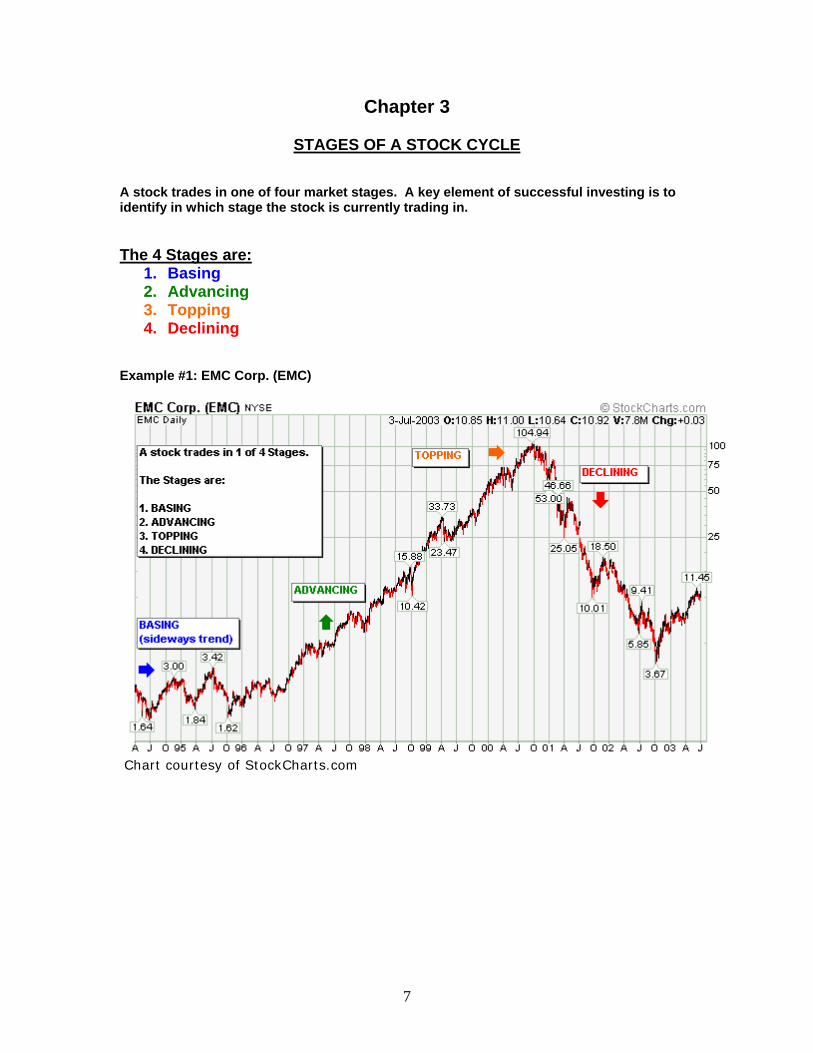
Chapter 3
STAGES OF A STOCK CYCLE A stock trades in one of four market stages. A key element of successful investing is to identify in which stage the stock is currently trading in. The 4 Stages are:
1. Basing 2. Advancing 3. Topping 4. Declining
Example #1: EMC Corp. (EMC)
Chart courtesy of StockCharts.com
7
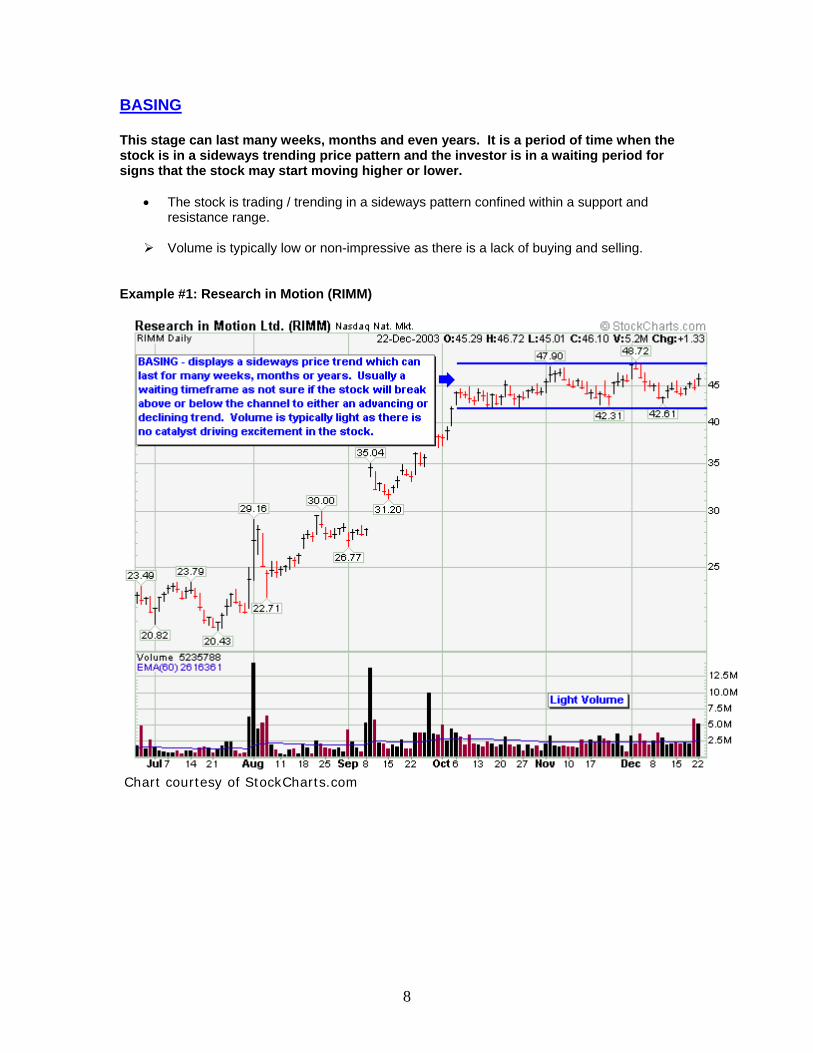
BASING This stage can last many weeks, months and even years. It is a period of time when the stock is in a sideways trending price pattern and the investor is in a waiting period for signs that the stock may start moving higher or lower.
• The stock is trading / trending in a sideways pattern confined within a support and resistance range.
Volume is typically low or non-impressive as there is a lack of buying and selling.
Example #1: Research in Motion (RIMM)
Chart courtesy of StockCharts.com
8
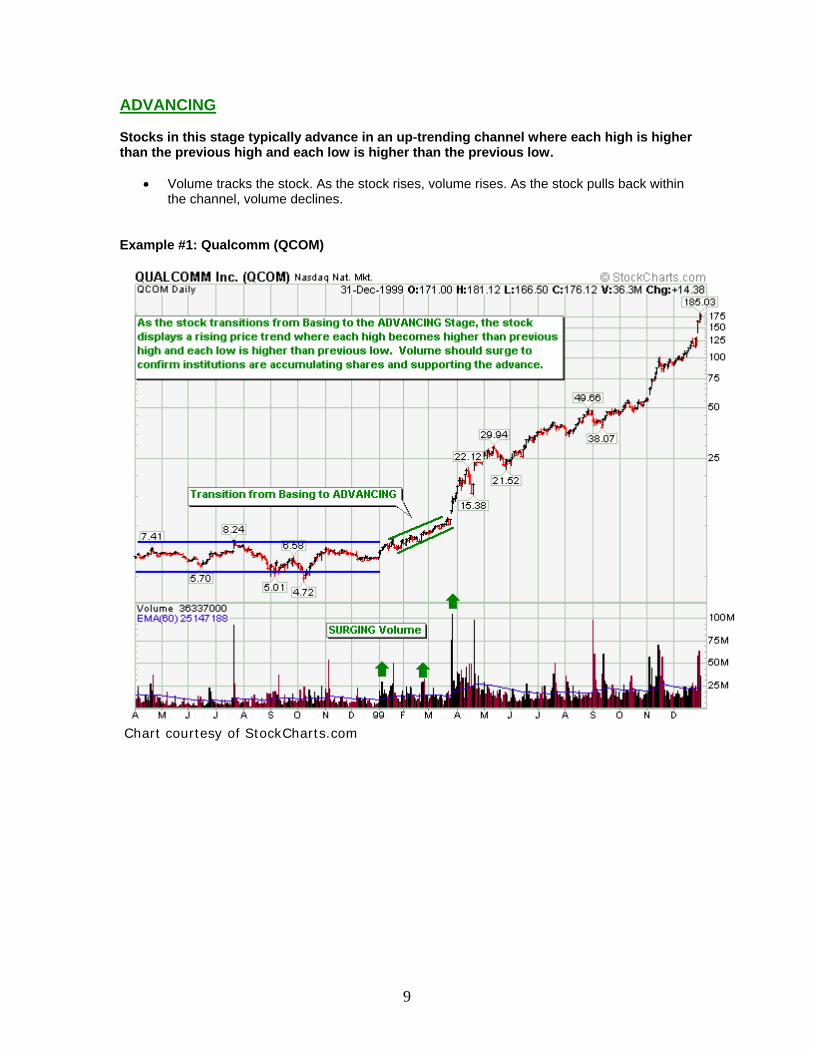
ADVANCING Stocks in this stage typically advance in an up-trending channel where each high is higher than the previous high and each low is higher than the previous low.
• Volume tracks the stock. As the stock rises, volume rises. As the stock pulls back within the channel, volume declines.
Example #1: Qualcomm (QCOM)
Chart courtesy of StockCharts.com
9
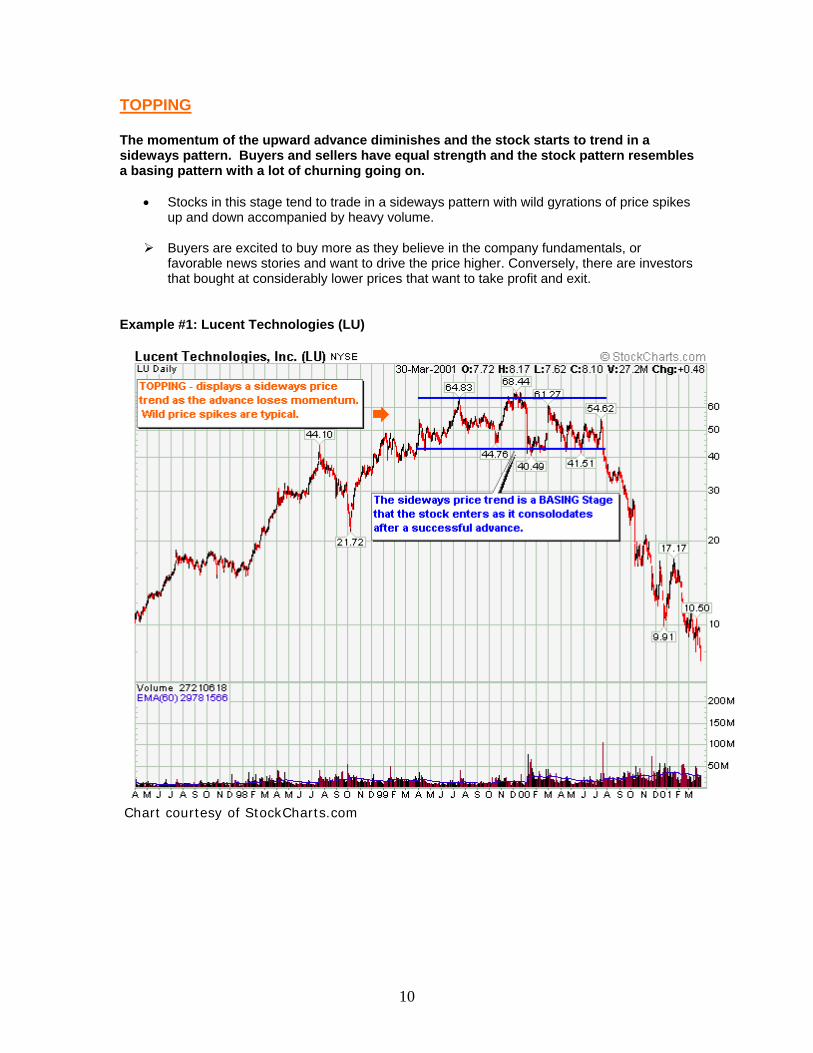
TOPPING The momentum of the upward advance diminishes and the stock starts to trend in a sideways pattern. Buyers and sellers have equal strength and the stock pattern resembles a basing pattern with a lot of churning going on.
• Stocks in this stage tend to trade in a sideways pattern with wild gyrations of price spikes up and down accompanied by heavy volume.
Buyers are excited to buy more as they believe in the company fundamentals, or
favorable news stories and want to drive the price higher. Conversely, there are investors that bought at considerably lower prices that want to take profit and exit.
Example #1: Lucent Technologies (LU)
Chart courtesy of StockCharts.com
10
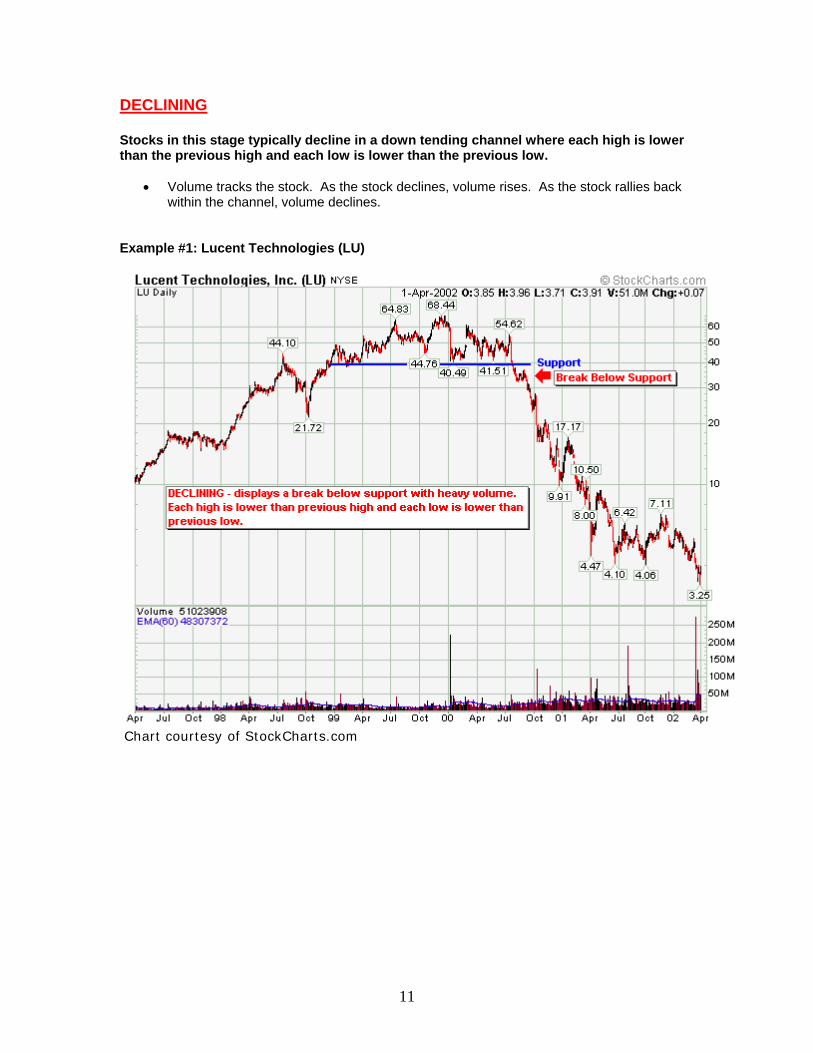
DECLINING Stocks in this stage typically decline in a down tending channel where each high is lower than the previous high and each low is lower than the previous low.
• Volume tracks the stock. As the stock declines, volume rises. As the stock rallies back within the channel, volume declines.
Example #1: Lucent Technologies (LU)
Chart courtesy of StockCharts.com
11