supplementary appendix cell count was obtained by multiplying the percentage of cd14/cd16 staining...
TRANSCRIPT

Supplementary appendixThis appendix formed part of the original submission and has been peer reviewed. We post it as supplied by the authors.
Supplement to: Isidori A M, Venneri M A, Graziadio C,et al. Effect of once-daily, modified-release hydrocortisone versus standard glucocorticoid therapy on metabolism and innate immunity in patients with adrenal insufficiency (DREAM): a single-blind, randomised controlled trial. Lancet Diabetes Endocrinol 2017; published online Dec 8. http://dx.doi.org/10.1016/S2213-8587(17)30398-4.

1
Supplementary online to:
The circadian rhythm of glucocorticoid administration regulates metabolism and the innate immunity of adrenally insufficient patients: results from the DREAM randomised controlled trial
Andrea M Isidori*1§, Mary Anna Venneri*1, Chiara Graziadio1, Chiara Simeoli2, Daniela Fiore1, Valeria Hasenmajer1, Emilia Sbardella1, Daniele Gianfrilli1, Carlotta Pozza1 MD PhD, Patrizio Pasqualetti3, Stefania Morrone1, Angela Santoni4, Fabio Naro5, Anna Maria Colao2, Rosario Pivonello2 & Andrea Lenzi1§
Supplementary content:
1. eMethods.
2. eFigure 1. Gating strategy for monocytes and lymphocytes.
3. eFigure 2. Gating strategies for natural killer cells.
4. eTable 1. Total daily exposure to glucocorticoids.
5. eFigure 3. Body weight and HbA1c treatment difference.
6. eTable 2. Immune characteristics of the full analysis set.
7. eFigure 4. Time course of CD16+ PBMC and NK cells.
8. eFigure 5. Infection score in the full analysis set.
9. eFigure 6. Correlation between immune changes and infection score.
10. eTable 3. Subgroup analysis.
11. eReferences.

2
Supplementary Methods
Key exclusion criteria
Key exclusion criteria were pregnancy, acute primary or secondary adrenal insufficiency, any episode of severe illness, including adrenal crisis (AC), severe infections, surgery, trauma requiring hospitalisation within 3 months before study entry, BMI greater than 40 kg/m², treatment with systemic GC therapy other than hydrocortisone (HC) or cortone acetate (CA), use of medication that interferes with cortisol metabolism within 1 month before study entry, heart disease with a class III or class IV functional capacity, any active hematological or rheumatological disorders, history of renal insufficiency and clinical or laboratory signs of significant cerebral, cardiovascular, respiratory, haepatobiliary or pancreatic disease, previous radiotherapy or chemotherapy, severe psychiatric or sleep disorders.
Assessment of infections
Rate, duration and severity of infections were investigated at baseline and 24 weeks according to the German National Cohort Questionnaire (GNC)1, 2.
In 2014, the working group of the GNC prospective study developed and validated a new infectious disease questionnaire 2, partially based on the previous immune system assessment questionnaire, to identify individuals at risk of immune dysfunction 3. The questionnaire was developed as a self-administered, self-reported tool measuring rate, resistance, and susceptibility to infections with a good test-retest reliability1.
The only modification or adaptation to the DREAM trial protocol was a conversion from the original 12-month to a 6-month cumulative incidence rate, and the addition of a question addressing flu or flu-like symptoms.
We weighted the frequency score according to the Immune System Assessment Questionnaire (ISAQ) score, a questionnaire-based risk score to identify patients suffering from immunodeficiency or systemic autoimmunity. Infectious disease frequency (Item 11 of the ISAQ) was one of the strongest predictors of immune impairment in the retrospective validation of ISAQ score. The weighting process validated for ISAQ was as follows: a negative response always received a 0.5 weight, while ordinal frequency answers were reduced to a trichotomous item (i.e. 1-2 times, 3 times, more than 3 times) and then further reduced for weight assignment to binary items (i.e. 1-2 times and 3 times or more). According to the ISAQ score, those items received a weight of 2 and 4 respectively. The sum of the weighted score attributed to each item determined the total score.

3
Infectious diseases/infections
The following section (questions IN1 to IN5) assesses the frequency of different infections in the past 6 months. Please sum up how often you suffered from these infections. If you had, for example, a cold 2 times and a middle ear infection once, then you had 3 upper respiratory tract infections (so you should choose the option “3 times”). If you had a cold 4 times and no other upper respiratory tract infection, then choose the option ‘More than 3 times’. If you are not sure answer ‘Don’t know’.
IN1 How often have you had an infection of the upper respiratory tract (e.g. a cold or an infection of the sinus, tonsils, middle ear, throat or larynx) in the past 6 months?
None 1 time 2 times 3 times More than 3 times Don’t know
IN2 How often have you had bronchitis or pneumonia in the past 6 months?
None 1 time 2 times 3 times More than 3 times Don’t know
IN3 How often have you had an infection of the gastrointestinal tract (‘stomach flu’) in the past 6 months?
None 1 time 2 times 3 times More than 3 times Don’t know
IN4
How often have you had an infection of the skin or mucosa in the past 6 months?
a) Cold sore, genital herpes, new warts
None 1 time 2 times 3 times More than 3 times Don’t know
How often have you had an infection of the skin or mucosa in the past 6 months?
b) Boil or abscess
None 1 time 2 times 3 times More than 3 times Don’t know
IN5 How often have you had a lower urinary tract infection (e.g. bladder infection) in the past 6 months?
None 1 time 2 times 3 times More than 3 times Don’t know
FLU How often have you had the flu or flu-like symptoms (i.e. fever, or feeling feverish/chills, muscle or body aches, headaches, severe fatigue accompanying an acute respiratory or gastrointestinal tract infection) in the past 6 months?
None 1 time 2 times 3 times More than 3 times Don’t know

4
Cytometry analysis & Gating strategy
Blood samples were collected from each participant in the morning. Peripheral blood mononuclear cells (PBMCs) were freshly isolated from fresh whole blood using Ficoll-Hypaque density gradient centrifugation; 106 Fc-blocked PBMCs were stained with the following monoclonal antibodies (1-5 gamma/mL): Fc-blocked PBMCs were stained with the following monoclonal antibodies (1-5 gamma/mL): anti-CD14, anti-CD16 , anti-CD3, anti-CD56 and anti-CD19. All samples were collected by a CyAn™ ADP cytometer (DAKO, Glostrup, Denmark). The bi-exponential analysis was performed using Summit V4.3 software (Beckman Coulter, CA, USA) and FlowJo X (Treestar, Ashland, OR, USA).
Cells were first gated for singlets (FSC-H vs. FSC-A) and monocytes and lymphocytes based on the physical parameter (SSC-A vs. FSC-A). The events within the gate were analysed for expression markers. In order to accurately identify the positive dataset appropriate controls such as isotype, fluorescence minus one (FMO) and single and unstained controls were used. The gate was set for each patient at each sampling and was based on IgG staining. The monocyte and lymphocyte gate was further analysed for expression of CD14 and CD16. To accurately define the CD14 monocytes in enrolled subjects all CD14+cells were included, providing a wider and more reliable gate. CD14+CD16−monocyte cells, CD14+CD16+ monocytes, and CD16+CD14−non-monocyte cells were then identified. Absolute cell count was obtained by multiplying the percentage of CD14/CD16 staining of cell subgroups by the absolute number of monocytes plus lymphocytes, determined using the haematological analyser (SYSMEX Roche, Indianapolis, IN, USA). For NK cell analysis, the lymphocyte gate was evaluated for expression of CD3 and CD56. NK cells were defined as CD14−CD19−CD3−CD56+ cells. CD3 vs CD56 plot enabled the identification of CD56+CD3− NK cells, CD56−CD3+ T lymphocytes, and CD3+CD56+ cells. NK cells were further divided into two subsets: CD3-CD56dim (CD56dim NK) and CD3-CD56bright NK (CD56bright NK) cell subsets on the basis of CD56 density. The CD3−CD56+ gate was further analysed for CD16 expression, to identify CD3−CD56+CD16+ NK cells and CD16-NK cells. NK cell count was obtained by multiplying the percentage of CD56+CD3- NK cells, CD56-CD3+ T lymphocytes, and CD3+CD56+ cell subgroups by the absolute lymphocyte count. CD56dim NK and CD56bright NK cell counts were derived by multiplying the percentage of a given cell subset by the total CD56+CD3- NK cells number. For B cell quantification, the lymphocyte gate was evaluated for CD19 expression and cell count was obtained by multiplying the percentage by the absolute lymphocyte count determined using the haematological analyser.
Staining was performed using the following reagents:
Marker Analyte Detector Fluorochrome Vendor Dilution/Assay concentration
CD14 Anti-CD14 APC eBioscience (San Diego, CA, USA)
1:50
CD16 Anti-CD16 eFluor-450 eBioscience 1:50 CD3 Anti-CD3 PE eBioscience 1:100 CD56 Anti-CD56 APC eBioscience 1:100 CD19 Anti-CD19 FITC eBioscience 1:50
5
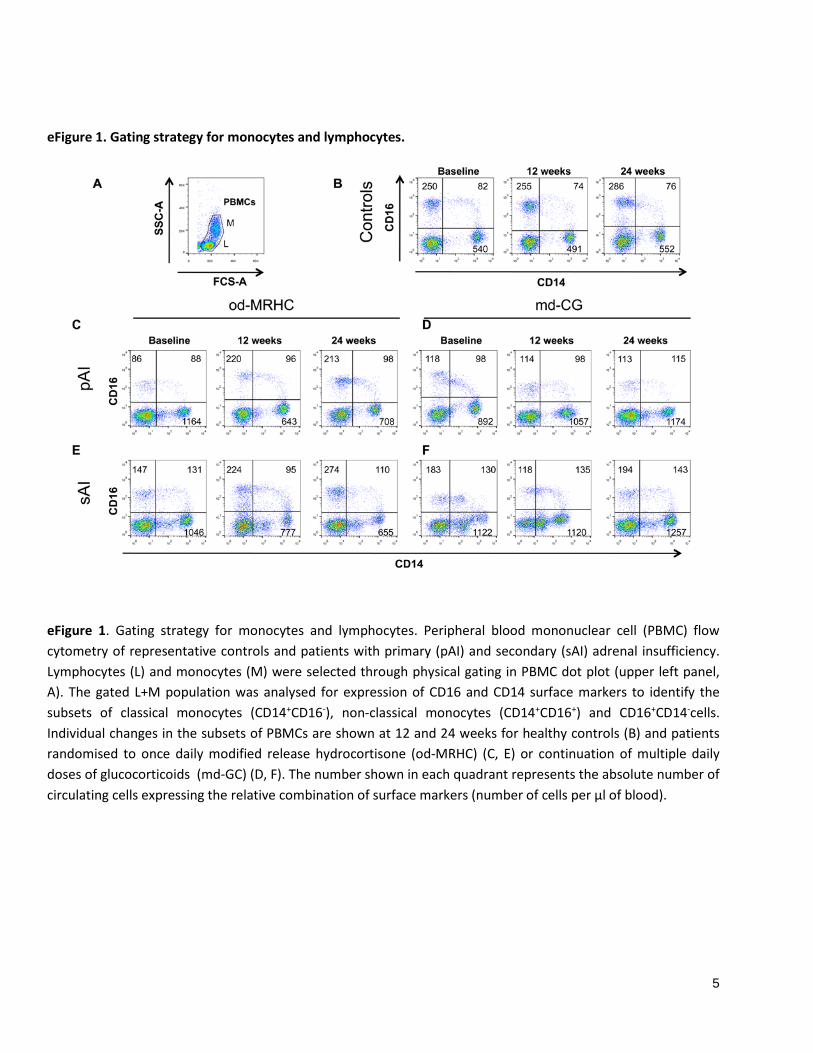
eFigure 1. Gating strategy for monocytes and lymphocytes.
eFigure 1. Gating strategy for monocytes and lymphocytes. Peripheral blood mononuclear cell (PBMC) flow cytometry of representative controls and patients with primary (pAI) and secondary (sAI) adrenal insufficiency. Lymphocytes (L) and monocytes (M) were selected through physical gating in PBMC dot plot (upper left panel, A). The gated L+M population was analysed for expression of CD16 and CD14 surface markers to identify the subsets of classical monocytes (CD14+CD16-), non-classical monocytes (CD14+CD16+) and CD16+CD14-cells. Individual changes in the subsets of PBMCs are shown at 12 and 24 weeks for healthy controls (B) and patients randomised to once daily modified release hydrocortisone (od-MRHC) (C, E) or continuation of multiple daily doses of glucocorticoids (md-GC) (D, F). The number shown in each quadrant represents the absolute number of circulating cells expressing the relative combination of surface markers (number of cells per µl of blood).

6
eFigure 2. Gating strategies for natural killer cells.
eFigure 2. Gating strategy for natural killer cells. Lymphocytes (L) were selected through physical gating in peripheral blood mononuclear cell (PBMCs) dot plot (upper left panel, A). The gated cell population was analysed for expression of CD3 and CD56 surface markers to identify natural killers (CD56+CD3-). CD3-CD56bright and CD3-
CD56dim cells subsets were identified by gated cells on the basis of CD56 density. The CD56+ CD3- gated cell population was further analysed for expression of CD16 markers (CD16+NK). Individual changes in the subsets of NKs are shown at 12 and 24 weeks for controls (B) and AI patients randomised to once daily modified release hydrocortisone (od-MRHC)(C, E) or continuation of multiple daily doses of glucocorticoids (md-GC) (D , F). The number shown above the inner square of each plot represents the absolute number of circulating CD16+NK (number of cells per µl of blood).

7
Supplementary Results
eTable 1. Total daily exposure to glucocorticoids. od-MRHC (46) md-GC (43) Independent sample T-test
Mean (95% CI) Mean (95% CI) Mean Difference (95% CI) P value
Baseline HC equivalent dose (mg/24h)
25.2 (22.7 to 27.8) 27.9 (24.2 to 31.7) -2.7 (-7.1 to 1.7) .219
BSA-adjusted* baseline HC equivalent dose (mg/m2/24h)
13.7 (12.3 to 15.2) 15.8 (13.6 to 18.0) -2.1 (-4.6 to 0.5) .118
End-of- study HC equivalent dose (mg/24h)
25.3 (22.7 to 27.8) 27.9 (24.2 to 31.7) -2.7 (-7.1 to 1.7) .223
BSA-adjusted§ end-of-study HC equivalent dose (mg/m2/24h)
13.9 (12.5 to 15.4) 15.6 (13.5 to 17.8) -1.7 (-4.1 to 0.8) .179
* , § : BSA calculated according to the Mosteller formula: BSA (m2) = SQRT ([Height(cm) x Weight(kg) ]/ 3600), weight in the formula is respectively week 0 for the baseline (*) and week 24 (§) for the end-of-study.
eFigure 3. Body weight and HbA1c treatment difference.
eFigure 3. Least-square mean estimated treatment difference for body weight (red, left panel) and HbA1c (green, right panel) between active treatments (once-daily modified release hydrocortisone, (od-MRHC) vs. multiple daily doses of glucocorticoids, md-GC). Means and 95% CI are presented as data markers and error bars. The mean estimated difference was derived for all ITT participants taking the study medications (od-MRHC minus md-GC) from a mixed-effect analysis of covariance after adjusting for age, sex, type of adrenal insufficiency, diabetes mellitus, smoking and the outcome at baseline.

8
eTable 2. Immune characteristics of the full analysis set.
Outcome Adrenally sufficient Adrenally insufficient Independent sample t–test
Number of subjects 25 89 P value
Circulating blood cells (mean, 95% CI)
Neutrophils (%)a 58 (55 to 61) 55 (53 to 57) .093
Cell count (n) 3510 (3196 to 3824) 4149 (3669 to 4629) .246
Lymphocytes (%)a 30 (28 to 32) 34 (32 to 36) .012
Cell count (n) 1852 (1694 to 2011) 2351 (2213 to 2490) .034
Monocytes (%)a 6.6 (5.8 to 7.4) 6.5 (6.1 to 7.0) .871
Cell count (n) 424 (373 to 474) 476 (442 to 509) .162
Eosinophils (%)a 2.8 (1.7 to 3.9) 2.3 (2.0 to 2.7) .451
Cell count (n) 182 to (102 to 262) 177 (155 to 200) .869
Basophils (%)a 0.5 (0.4 to 0.7) 0.6 (0.5 to 0.7) .590
Cell count (n) 33 to (26 to 39) 54 (37 to 71) .240
CD14+CD16- (%) (classical) b 24 (22 to 25) 37 (34 to 40) <.001
Cell count (n) 540 (478 to 601) 1052 (947 to 1157) <.001
CD14+CD16+ (%) (non-classical) b 3.6 (3.1 to 4.0) 4.1 (3.6 to 4.6) .157
Cell count (n) 82 (69 to 95) 112 (98 to 126) .002
CD16+CD14- (%)b 11 (10 to 12) 4.8 (3.9 to 5.7) <.001
Cell count (n) 250 (213 to 288) 130 (107 to 153) <.001
CD16+NK (CD3-CD56+CD16+) (%)b 94 (92 to 95) 71 (65 to 76) <.001
Cell count (n) 228 (201 to 254) 128 (107 to 149) <.001
CD3+ (%)b 54 (52 to 56) 54 (51 to 57) .818
Cell count (n) 1212 (1122 to 1302) 1540 (1403 to 1677) <.001
CD19+ (%)b 8.8 (7.9 to 9.8) 9.6 (8.6 to 10.6) .247
Cell count (n) 199 (179 to 219) 281 (240 to 322) .001
Infectionsc
Total score (IN1 to IN5) (mean, 95% CI)
4.1 (3.6 to 4.8) 7. 0 (6.4 to 7.6) <.001
Flu and Flu-like (events in 6 months, (median, IQR)
0.5 (0 to 1) 2 (1 to 3) <.001
Group comparisons between adrenally sufficient and adrenally insufficient subjects. Values are expressed as mean (lower-upper limit of 95% CI) or median and interquartile range (25th to 75th percentiles) as appropriate.
a, Values from haematological analyser; b, Values from FAC analyses; c, Score calculated as for ref 1-3.

9
Table e3. Subgroup analysis for the primary and secondary outcomes.
Outcome od-MRHC, Mean (95% CI) (n=46) md-GC, Mean (95% CI) (n=43) Treatment-related difference
Treatment by Subgroup Interaction
Baseline (n=46) 24 weeks (n=43) Baseline (n=43) 24 weeks (n=35) Baseline to 24 weeks P values
Anthropometrics a
BMI, kg/m2 0.081 Primary AI 24.0 (22.2 to 25.8) 23.8 (21.4 to 26.1) 24.6 (22.1 to 27.0) 25.1 (20.7 to 29.5) -0.6 (-2.1 to 1.0) 0.369 Secondary AI 29.1 (26.5 to 31.7) 26.8 (24.5 to 29.1) 26.7 (23.7 to 29.7) 26.9 (23.2 to 30.6) -2.5 (-4.2 to -0.7) 0.007
Body weight, kg 0.074 Primary AI 68 (61 to 75) 67 (59 to 75) 65 (56 to 74) 67 (53 to 80) -1.3 (-6.7 to 3.9) 0.401 Secondary AI 83 (75 to 91) 77 (69 to 85) 75 (65 to 84) 74 (63 to 85) -6.2 (2.5 to 10.0) 0.002
Waist, cm 0.508 Primary AI 85 (77 to 93) 83 (75 to 90) 81 (73 to 90) 79 (67 to 89) -2.1 (-6.1 to 1.9) 0.207 Secondary AI 95 (88 to 103) 90 (83 to 97) 94 (84 to 104) 91 (80 to 103) -3.0 (0.8 to 5.2) 0.006
Glucose Metabolism b
HbA1c (%) 0.328 Primary AI 5.3 (4.9 to 5.8) 5.2 (4.8 to 5.6) 5.6 (5.1 to 6.1) 5.7 (5.0 to 6.3) -0.3 (-0.5 to 0.0) 0.019
Secondary AI 5.6 (5.3 to 6.0) 5.3 (4.9 to 5.7) 5.5 (5.1 to 6.0) 5.7 (5.2 to 6.2) -0.4 (-0.7 to -0.1) 0.009
Fasting blood glucose (mg/dL) 0.722 Primary AI 90 (73 to 108) 96 (76 to 116) 79 (73 to 86) 83 (73 to 92) 4.7 (-3.2 to 12.7) 0.228 Secondary AI 87 (78 to 97) 95 (84 to 106) 79 (71 to 87) 86 (70 to 102) 2.5 (-11.2 to 6.3) 0.568
Insulin (µIU/ml) 0.304 Primary AI 10 (6 to 15) 9 (6 to 11) 10 (6 to 13) 10 (4 to 16) -0.8 (-7.4 to 5.7) 0.790 Secondary AI 10 (8 to 12) 12 (7 to 17) 9 (6 to 12) 9 (5 to 13) 0.5 (-4.7 to 3.7 0.810
HOMAi 0.280 Primary AI 2.0 (1.1 to 3.0) 1.8 (1.2 to 2.4) 1.9 (1.2 to 2.6) 1.9 (0.5 to 3.4) -0.1 (-1.5 to 1.3) 0.912 Secondary AI 2.2 (1.7 to 2.8) 2.9 (1.4 to 4.4) 1.8 (1.0 to 2.7) 2.0 (0.9 to 3.2)0 0.3 (-1.5 to 1.0) 0.645
Lipids b
Total Cholesterol (mg/dL) 0.957 Primary AI 208 (189 to 228) 206 (186 to 225) 211 (186 to 237) 218 (186 to 250) -2 (-29 to 24) 0.859 Secondary AI 222 (201 to 243) 215 (191 to 238) 198 (180 to 215) 201 (182 to 219) -3 (-26 to 21) 0.817
HDL Cholesterol (mg/dL) 0.905 Primary AI 70 (56 to 83) 59 (51 to 67) 76 (59 to 92) 72 (59 to 85) -12 (-22 to -2) 0.022 Secondary AI 58 (52 to 65) 52 (45 to 59) 61 (53 to 70) 64 (54 to 75) -8 (-15 to -1) 0.023
Triglycerides (mg/dL) 0.509 Primary AI 124 (77 to 171) 103 (84 to 121) 109 (87 to 131) 120 (66 to 174) -7 (-61 to 46) 0.777 Secondary AI 150 (96 to 203) 127 (93 to 162) 144 (67 to 220) 109 (72 to 146) -7 (-32 to 18) 0.570

10
…. eTable 3 continued...
Outcome od-MRHC, Mean (95% CI) (n=46)
md-GC, Mean (95% CI) (n=43)
Treatment-related difference a, b
Treatment by Subgroup Interaction
Baseline (n=46) 24 weeks (n=43) Baseline (n=43) 24 weeks (n=35) Baseline to 24 weeks
Immune cells b (cells/µL)
CD14+CD16- (classical) 0.563 Primary AI 1164(968 to1360) 708 (572 to 844) 890 (673 to 1107) 1125 (860 to 1390) -458 (-773 to -142) 0.006 Secondary AI 1046(881to1211) 655 (563 to 747) 1122 (795 to 1450) 1208 (762 to 1654) -483 (-814 to -151) 0.006
CD16+CD14+ (non-classical) 0.760 Primary AI 88 (72 to 105) 98 (64 to 133) 99 (63 to 134) 115 (73 to 157) -1 (-59 to 56) 0.967 Secondary AI 132 (110 to 153) 111 (82 to 139) 131 (91 to 171) 144 (100 to 188) -32 (-83 to 18) 0.201
CD16+CD14- 0.368 Primary AI 81 (44 to 117) 201 (162 to 241) 118 (75 to 162) 113 (65 to 161) 113 (47 to 180) 0.002 Secondary AI 147 (112 to 183) 274 (225 to 323) 183 (111 to 255) 200 (141 to 260) 76 (2 to 150) 0.043
NK (CD3-CD56+) 0.547 Primary AI 171 (114 to 228) 178 (148 to 209) 167 (115 to 220) 171 (115 to 228) 12 (-68 to 91) 0.765 Secondary AI 189 (140 to 238) 247 (201 to 294) 179 (140 to 217) 183 (134 to 232) 39 (-26 to 105) 0.225
CD16+NK (CD3-CD56+CD16+) 0.554 Primary AI 122 (73 to 170) 146 (121 to 171) 110 (67 to 153) 108 (68 to 149) 27 (-39 to 92) 0.361
Secondary AI 142 (86 to 198) 197 (149 to 244) 142 (102 to 183) 126 (79 to 173) 52 (-28 to 133) 0.147 Infections b Total score (IN1 to IN5) 0.737
Primary AI 6.7 (5.5 to 8.0) 6.0 (5.1 to 6.8) 7.3 (6.1 to 8.5) 7.9 (6.7 to 9.1) -1.5 (-2.8 to -0.3) 0.016 Secondary AI 7.0 (5.8 to 8.1) 5.2 (4.0 to 6.3) 7.0 (5.6 to 8.4) 7.1 (5.9 to 8.4) -1.9 (-3.4 to -0.4) 0.013
Flu/Flu-like (events in 6 months) 0.156 Primary AI 1.8 (1.1 to 2.6) 0.3 (-0.1 to 0.7) 1.8 (0.9 to 2.7) 1.6 (0.7 to 2.5) -1.6 (-2.6 to -0.6) 0.004 Secondary AI 1.7 (1.0 to 2.4) 0.8 (0.3 to 1.3) 1.9 (1.2 to 2.6) 1.2 (0.4 to 2.0) -0.5 (-1.3 to 0.2) 0.135
AddiQoL b Total score 0.121
Primary AI 83 (76 to 89) 89 (84 to 94) 83 (74 to 93) 83 (73 to 92) 8 (2 to 14) 0.008 Secondary AI 81 (75 to 86) 88 (82 to 93) 82 (72 to 91) 87 (77 to 96) 2 (-4 to 8) 0.558 a, b Covariates in the ANCOVA model: a age, sex, diabetes mellitus and outcome at baseline; b age, sex, body mass index (BMI), diabetes mellitus and outcome at baseline.

11/14
page 11
eFigure 4. Time course of CD16+ PBMC and NK cells.
eFigure 4. Time courses (repeated measure analysis) of changes in CD16+CD14- cells and CD16+NK cells for adrenally insufficient patients (green, AI patients randomised to once-daily modified release hydrocortisone; orange, AI patients randomised to multiple daily doses of glucocorticoids) measured at baseline and 4, 8, 12, and 24 weeks after randomisation. Means and standard errors are presented as data markers and error bars; changes within subject are presented as lines. Estimates were from a subset of the ITT population and are mixed-model repeated measurements, adjusted for age, sex, body mass index (BMI), type of adrenal insufficiency, diabetes mellitus and total white blood count.

12/14
page 12
eFigure 5. Infection score in the full analysis set.
eFigure 5. Frequency of infection score at baseline and week 24 for all groups (grey, adrenally-sufficient controls, n=25; green, AI patients randomised to once-daily modified release hydrocortisone, od-MRHC, n=46; orange, AI patients randomised to multiple daily doses of glucocorticoids, md-GC, n=43).

13/14
page 13
eFigure 6. Correlation between immune changes and infection score.
eFigure 6. Correlation between changes in CD16+CD14- cells (upper panel) and infection scores (lower panel) with variation in log10 scale of soluble CD16 (s) CD16 (grey circles) and ADAMD17 (black circles) in all AI subjects (n=89) allocated to treatment groups.

14/14
page 14
eReference List
1. Castell S, Akmatov MK, Obi N, Flesh-Janys D, Nieters A, Kemmling Y, Pessler F and Krause G. Test-retest reliability of an infectious disease questionnaire and evaluation of self-assessed vulnerability to infections : findings of Pretest 2 of the German National Cohort. Bundesgesundheitsblatt, Gesundheitsforschung, Gesundheitsschutz. 2014;57:1300-7.
2. Sievers C, Akmatov MK, Kreienbrock L, Hille K, Ahrens W, Gunther K, Flesch-Janys D, Obi N, Michels KB, Fricke J, Greiser KH, Kaaks R, Peter HH, Pessler F, Nieters A and Krause G. Evaluation of a questionnaire to assess selected infectious diseases and their risk factors : findings of a multicenter study. Bundesgesundheitsblatt, Gesundheitsforschung, Gesundheitsschutz. 2014;57:1283-91.
3. Peter HH, Goldacker S, Haraldseide J, Großmann K, Gross W, Warnatz K, Grimbacher B, Rusch S, Nieters A and Vach W. Construction and Clinical Validation of a Questionnaire-based Risk Score to Identify Patients Suffering from Immunodeficiency or Systemic Autoimmunity. Br J Med Med Res 2014;4:4751-4769.