study no. 132 march 2013 - ceri
TRANSCRIPT

CANADIAN ENERGY RESEARCH INSTITUTE
POTENTIAL ECONOMIC IMPACTS
OF DEVELOPING QUÉBEC’S
SHALE GAS
Study No. 132 March 2013
Canadian Energy Research Institute | Relevant • Independent • Objective

POTENTIAL ECONOMIC IMPACTS OF DEVELOPING
QUÉBEC’S SHALE GAS

Potential Economic Impacts of Developing Québec’s Shale Gas
Copyright © Canadian Energy Research Institute, 2013 Sections of this study may be reproduced in magazines and newspapers with acknowledgement to the Canadian Energy Research Institute ISBN 1-927037-11-9 Author: Anthony Mersich
Acknowledgements:
The author wishes to acknowledge Paul Kralovic of Kralovic Economics Inc. and Dr. Afshin Honarvar of the Alberta Energy Resources Conservation Board for his economic modeling; as well as those involved in the production, reviewing, and editing of the material, including but
not limited to Peter Howard and Megan Murphy.
CANADIAN ENERGY RESEARCH INSTITUTE 150, 3512 – 33 Street NW Calgary, Alberta T2L 2A6 Canada www.ceri.ca March 2013 Printed in Canada
Front cover photo courtesy of Junex.

Potential Economic Impacts of Developing Québec’s Shale Gas iii
March 2013
Table of Contents LIST OF FIGURES ............................................................................................................. v
LIST OF TABLES .............................................................................................................. vii
INTRODUCTION ............................................................................................................. 1
SHALE GAS PRIMER ........................................................................................................ 2 Background ........................................................................................................................ 2 Where is North American Shale Gas Located? .................................................................. 7 Shale Gas in Canada ........................................................................................................... 8
THE UTICA SHALE, QUÉBEC ............................................................................................. 10
Geology and Basin Metrics ................................................................................................ 11 Utica Shale Exploration & Production Companies ............................................................ 13 Regulatory Considerations ................................................................................................. 18
ECONOMIC IMPACTS OF DEVELOPING SHALE GAS IN QUÉBEC ......................................... 20
Methodology ...................................................................................................................... 22 Key Findings ....................................................................................................................... 23 Supply Cost and NPV .......................................................................................................... 24 Royalties ............................................................................................................................. 26 Capital Investment ............................................................................................................. 28 GDP, Employment and Tax ................................................................................................ 28

iv Canadian Energy Research Institute
March 2013
Potential Economic Impacts of Developing Québec’s Shale Gas v
March 2013
List of Figures 1.1 Schematic Geology of Natural Gas Resources ............................................................. 2 1.2 Multiple Horizontal Wells Drilled from a Single Well Pad ........................................... 4 1.3 A Typical Horizontal Well and Multi-stage Frac ........................................................... 5 1.4 Composition of a Frac Fluid ......................................................................................... 6 1.5 Major Shale Gas Basins in North America ................................................................... 7 1.6 Location of the Horn River Basin ................................................................................. 9 1.7 Shale Plays in Eastern North America .......................................................................... 11 1.8 Map of the Utica Shale................................................................................................. 12 1.9 Oil and Gas Projects Permits Map in the St. Lawrence Lowlands ............................... 14 1.10 Location of Lone Pine’s Land Holdings ........................................................................ 15 1.11 Questerre’s Land Holdings ........................................................................................... 17 1.12 Gastem’s Land Holdings in the St. Lawrence Lowlands ............................................... 17 1.13 Junex’s Land Holdings .................................................................................................. 18 1.14 Geologic Map of the St. Lawrence Lowlands ............................................................... 21 1.15 Production Profiles of Two Production Scenarios ....................................................... 22 1.16 Production Profiles and Cumulative Production for Type Well IP Variations ............. 23 1.17 Change in Variable vs. Change in NPV for Base Case, $2012 ...................................... 25 1.18 Change in Variable vs. Change in NPV for Highly Productive Case, $2012 ................. 25 1.19 Change in Variable vs. Change in NPV for Poorly Productive Case, $2012 ................. 26 1.20 Jobs Created and Preserved in Canada as a Result of Utica Shale Development in Québec, 500 MMCFPD Scenario, 2012-2036 ........................................................... 30 1.21 Jobs Created and Preserved in Canada as a Result of Utica Shale Development in Québec, 1,500 MMCFPD Scenario, 2012-2036 ........................................................ 30

vi Canadian Energy Research Institute
March 2013
Potential Economic Impacts of Developing Québec’s Shale Gas vii
March 2013
List of Tables 1.1 Horn River Basin Shale Geological Characteristics ...................................................... 9 1.2 Montney Basin Shale Geological Characteristics ......................................................... 10 1.3 Utica Shale Geological Characteristics ......................................................................... 13 1.4 Drilling Intensity for Various Production Profiles ........................................................ 23 1.5 Québec Royalty Revenues for 500 MMCFPD Scenario at Constant Prices and the IEA Forecast .......................................................................... 27 1.6 Québec Royalty Revenues for 1,500 MMCFPD Scenario at Constant Prices and the IEA Forecast .......................................................................... 27 1.7 Economic Impacts of Utica Shale Development in Québec 500 MMCFPD Scenario, 2012-2036 ............................................................................. 29 1.8 Economic Impacts of Utica Shale Development in Québec 1,500 MMCFPD Scenario, 2012-2036 .......................................................................... 29 1.9 Tax Receipts as a Result of Utica Shale Development in Québec 2012-2036, 500 MMCFPD ............................................................................................ 31 1.10 Tax Receipts as a Result of Utica Shale Development in Québec 2012-2036, 1,500 MMCFPD ......................................................................................... 31

viii Canadian Energy Research Institute
March 2013
Potential Impacts of Developing Québec’s Shale Gas 1
March 2013
Potential Economic Impacts of Developing Que bec’s Shale Gas
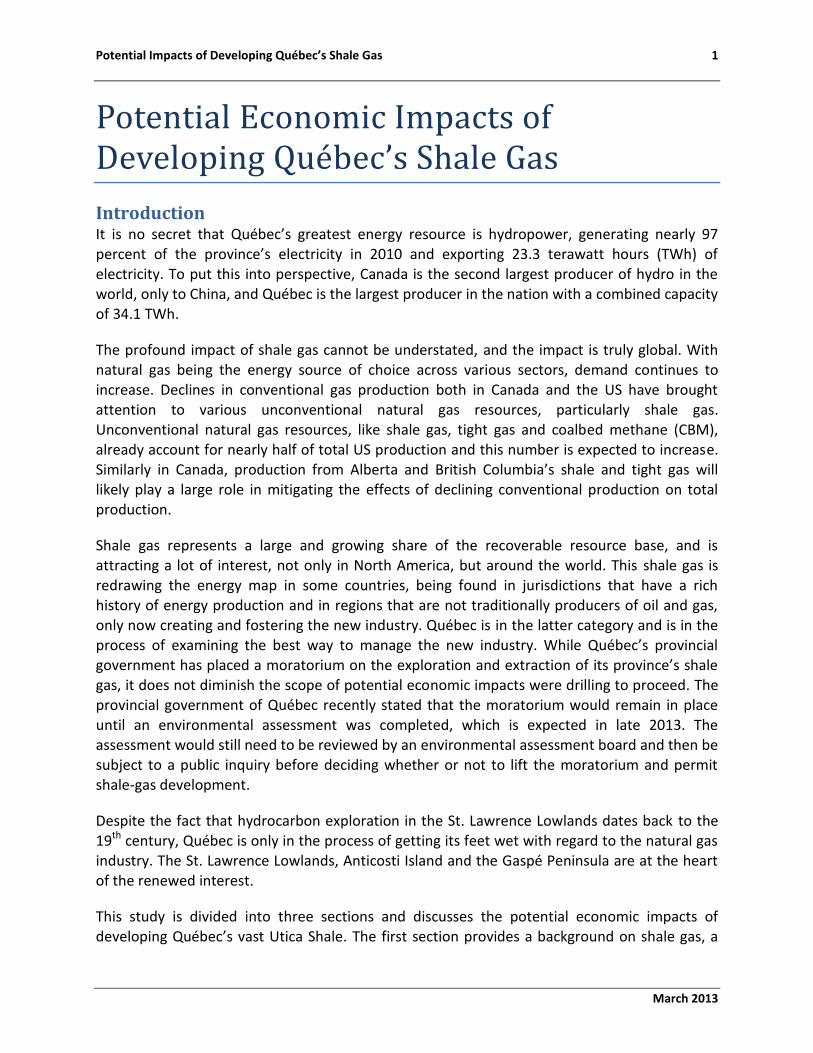
Introduction It is no secret that Québec’s greatest energy resource is hydropower, generating nearly 97 percent of the province’s electricity in 2010 and exporting 23.3 terawatt hours (TWh) of electricity. To put this into perspective, Canada is the second largest producer of hydro in the world, only to China, and Québec is the largest producer in the nation with a combined capacity of 34.1 TWh.
The profound impact of shale gas cannot be understated, and the impact is truly global. With natural gas being the energy source of choice across various sectors, demand continues to increase. Declines in conventional gas production both in Canada and the US have brought attention to various unconventional natural gas resources, particularly shale gas. Unconventional natural gas resources, like shale gas, tight gas and coalbed methane (CBM), already account for nearly half of total US production and this number is expected to increase. Similarly in Canada, production from Alberta and British Columbia’s shale and tight gas will likely play a large role in mitigating the effects of declining conventional production on total production.
Shale gas represents a large and growing share of the recoverable resource base, and is attracting a lot of interest, not only in North America, but around the world. This shale gas is
redrawing the energy map in some countries, being found in jurisdictions that have a rich history of energy production and in regions that are not traditionally producers of oil and gas, only now creating and fostering the new industry. Québec is in the latter category and is in the process of examining the best way to manage the new industry. While Québec’s provincial government has placed a moratorium on the exploration and extraction of its province’s shale gas, it does not diminish the scope of potential economic impacts were drilling to proceed. The provincial government of Québec recently stated that the moratorium would remain in place until an environmental assessment was completed, which is expected in late 2013. The assessment would still need to be reviewed by an environmental assessment board and then be subject to a public inquiry before deciding whether or not to lift the moratorium and permit shale-gas development.
Despite the fact that hydrocarbon exploration in the St. Lawrence Lowlands dates back to the 19th century, Québec is only in the process of getting its feet wet with regard to the natural gas industry. The St. Lawrence Lowlands, Anticosti Island and the Gaspé Peninsula are at the heart of the renewed interest.
This study is divided into three sections and discusses the potential economic impacts of developing Québec’s vast Utica Shale. The first section provides a background on shale gas, a
2 Canadian Energy Research Institute
March 2013
primer to review what shale gas is, how to develop it and where it is found. The second section
focuses on the Utica Shale in Québec, reviewing its geology and basin metrics, exploration and production companies, and a brief discussion on the moratorium currently in place. The third section reviews the potential economic impacts on the province and the rest of Canada if Québec’s Utica Shale is developed. In particular, impacts associated with investment and operations are presented. Total impacts regarding GDP, employment, and federal and provincial taxes are also discussed.
Shale Gas Primer
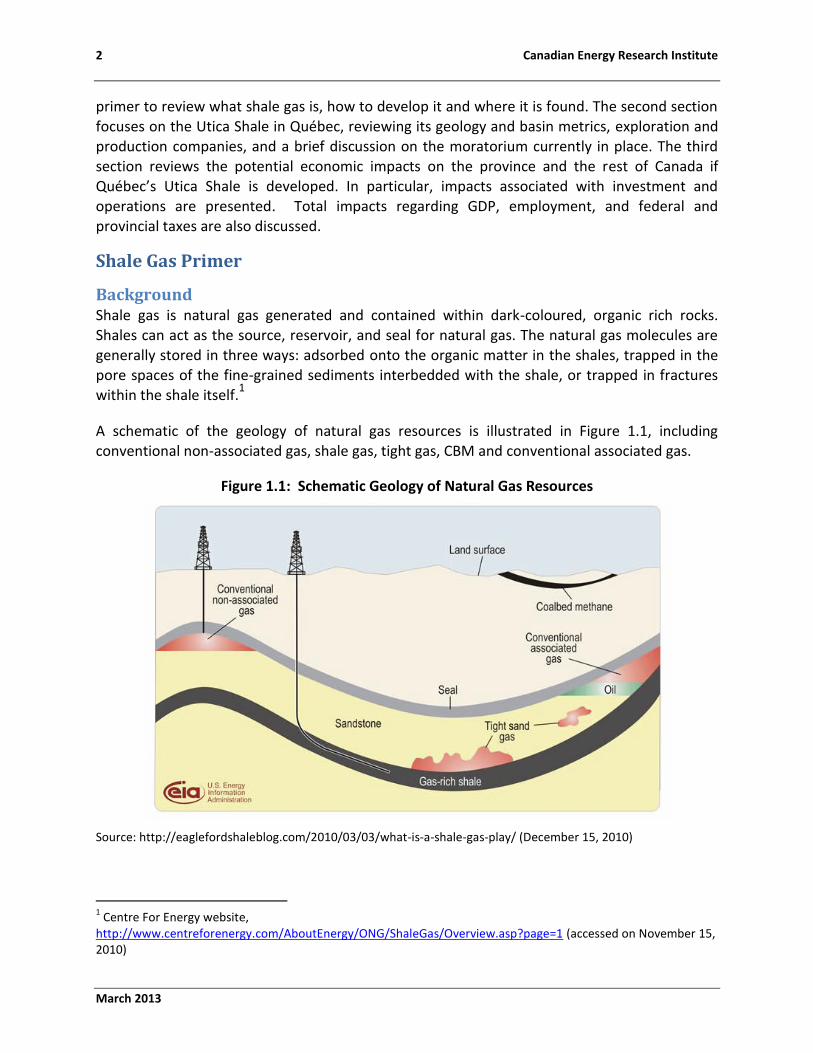
Background Shale gas is natural gas generated and contained within dark-coloured, organic rich rocks. Shales can act as the source, reservoir, and seal for natural gas. The natural gas molecules are
generally stored in three ways: adsorbed onto the organic matter in the shales, trapped in the pore spaces of the fine-grained sediments interbedded with the shale, or trapped in fractures within the shale itself.
1
A schematic of the geology of natural gas resources is illustrated in Figure 1.1, including conventional non-associated gas, shale gas, tight gas, CBM and conventional associated gas.
Figure 1.1: Schematic Geology of Natural Gas Resources
Source: http://eaglefordshaleblog.com/2010/03/03/what-is-a-shale-gas-play/ (December 15, 2010)
1 Centre For Energy website,
http://www.centreforenergy.com/AboutEnergy/ONG/ShaleGas/Overview.asp?page=1 (accessed on November 15, 2010)

Potential Impacts of Developing Québec’s Shale Gas 3
March 2013
While each shale formation has its own unique properties and characteristics, most shale plays
are characterized by low permeability, with low production rates from the natural fracture system. To improve the low permeability of the shale reservoirs, exploration and production (E&P) companies in shale gas basins across North America are relying on advances in horizontal drilling and hydraulic fracturing of the reservoir.
Producing shale gas is by no means a new concept. The first commercial natural gas well in the US tapped into the Devonian-aged shale in Fredonia, New York in 1821, and the first large-scale commercial field in the US was first developed in the 1880s. Michigan’s Antrim Shale was also being produced as early as the 1940s.
2 However, horizontal drilling and hydraulic fracturing are
considered game changers in the development of shale gas.
Figure 1.1 also illustrates two wells: a vertical well drilling into a conventional gas field, and a
horizontal well, in which the wellbore is drilled vertically, and is then steered horizontally through the target formation.
3 Vertical drilling is more common when developing relatively
porous and permeable reservoirs. This is not typically the case with shale gas. Horizontal drilling exposes the wellbore to more of the reservoir, increasing recovery rates for gas bearing shale.
4
The orientation of the drill path is perpendicular to the regional direction of maximum stress in order to intersect a maximum number of natural fractures in the reservoir.
5 While the cost of
drilling a horizontal well exceeds the cost of drilling a vertical well, advances in technology are reducing drilling costs, and horizontal wells tend to be more productive, which makes horizontal drilling more favourable. Horizontal drilling, which has been around since the 1930s, also lowers the surface disturbance and land use dramatically.
6 Development of a section (one
square mile) could require 16 vertical wells, each situated on their own well pad.7 In contrast,
more than 20 horizontal wells could be drilled from a single well pad using horizontal drilling techniques.
8 In the Barnett Shale, drillers are planning to drill up to 24 wells from a single well
pad.
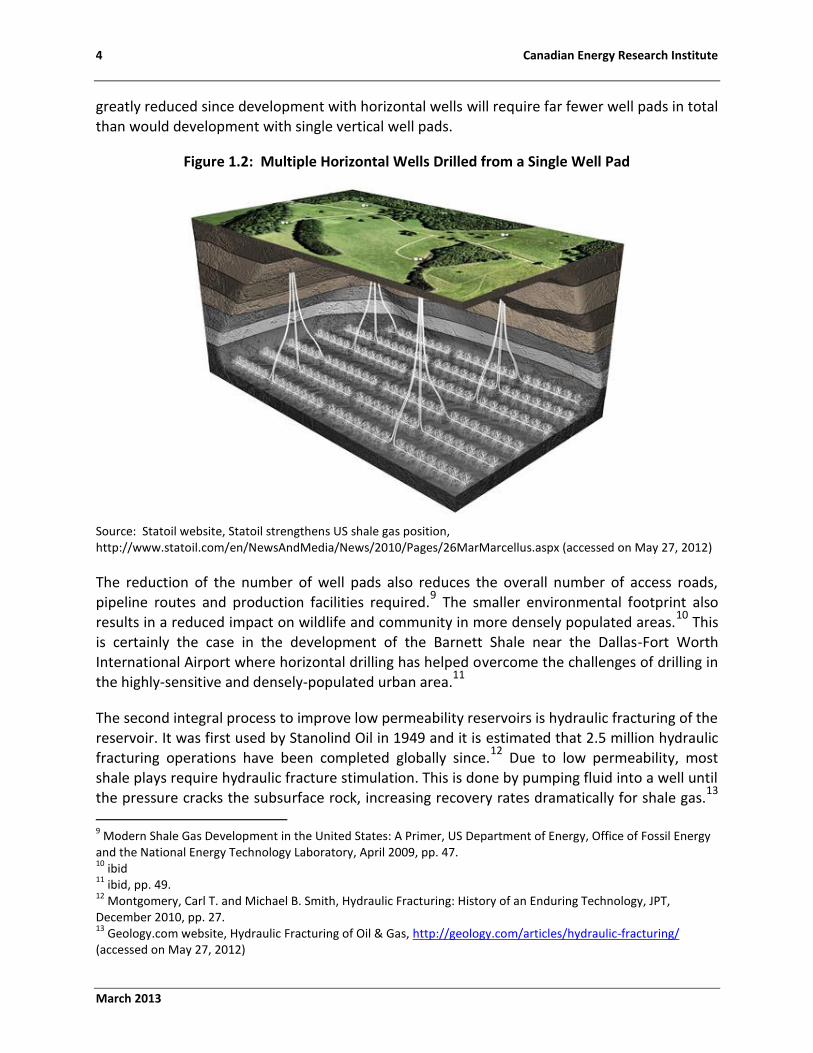
Figure 1.2 illustrates the concept of multiple horizontal wells from a single well pad and the resulting impact on land use. While the well pad containing well-heads for multiple horizontal wells is larger than a well pad for a single vertical well, the cumulative surface disturbance is
2 Gas Strategies website, Shale Gas in Europe: A Revolution in the Making?,
http://www.gasstrategies.com/files/files/euro%20shale%20gas_final.pdf (pp. 2)(accessed on June 4, 2012) html/comp3n6s.cfm (accessed on September 23, 2010) 3 Modern Shale Gas Development in the United States: A Primer, US Department of Energy, Office of Fossil Energy
and the National Energy Technology Laboratory, April 2009, pp. 82. 4 Centre for Energy website, http://www.centreforenergy.com/AboutEnergy/ONG/ShaleGas/Overview.asp?page=2
(accessed on June 4, 2012) 5 National Energy Board, “A Primer for Understanding Canadian Shale Gas - Energy Briefing Note”,
http://www.neb-one.gc.ca/clf-nsi/rnrgynfmtn/nrgyrprt/ntrlgs/prmrndrstndngshlgs2009/prmrndrstndngshlgs2009-eng.html#s7 (accessed on May 27, 2012) 6 Modern Shale Gas Development in the United States: A Primer, US Department of Energy, Office of Fossil Energy
and the National Energy Technology Laboratory, April 2009, pp. 46. 7 ibid, pp. 47.
8 ibid
4 Canadian Energy Research Institute
March 2013
greatly reduced since development with horizontal wells will require far fewer well pads in total
than would development with single vertical well pads.
Figure 1.2: Multiple Horizontal Wells Drilled from a Single Well Pad
Source: Statoil website, Statoil strengthens US shale gas position, http://www.statoil.com/en/NewsAndMedia/News/2010/Pages/26MarMarcellus.aspx (accessed on May 27, 2012)
The reduction of the number of well pads also reduces the overall number of access roads, pipeline routes and production facilities required.
9 The smaller environmental footprint also
results in a reduced impact on wildlife and community in more densely populated areas.10
This is certainly the case in the development of the Barnett Shale near the Dallas-Fort Worth International Airport where horizontal drilling has helped overcome the challenges of drilling in
the highly-sensitive and densely-populated urban area.11
The second integral process to improve low permeability reservoirs is hydraulic fracturing of the reservoir. It was first used by Stanolind Oil in 1949 and it is estimated that 2.5 million hydraulic fracturing operations have been completed globally since.
12 Due to low permeability, most
shale plays require hydraulic fracture stimulation. This is done by pumping fluid into a well until the pressure cracks the subsurface rock, increasing recovery rates dramatically for shale gas.
13
9 Modern Shale Gas Development in the United States: A Primer, US Department of Energy, Office of Fossil Energy
and the National Energy Technology Laboratory, April 2009, pp. 47. 10
ibid 11
ibid, pp. 49. 12
Montgomery, Carl T. and Michael B. Smith, Hydraulic Fracturing: History of an Enduring Technology, JPT, December 2010, pp. 27. 13
Geology.com website, Hydraulic Fracturing of Oil & Gas, http://geology.com/articles/hydraulic-fracturing/ (accessed on May 27, 2012)

Potential Impacts of Developing Québec’s Shale Gas 5
March 2013
Often, sand (or other propping agents) is injected into the formation to hold open the channels.
The technology has evolved dramatically and hydraulic fracturing now plays a key role in the development of unconventional oil and gas resources.
14 In the 1990s, Mitchell Energy began
using the technique in the Barnett Shale and changed the outlook and role of shale gas in North America.
15 When multiple hydraulic fracture operations are performed within the same well-
bore, the process is known as “multi-stage frac’ing”. This is very common in horizontal well drilling.
Figure 1.3 illustrates a typical horizontal and multi-stage frac well.
Figure 1.3: A Typical Horizontal Well and Multi-stage Frac
Source: http://www.hydraulicfracturing.com/Process/Pages/information.aspx
Figure 1.3 also illustrates the steel casing and cement that protect the groundwater from contamination. It is important to note the depth. Most hydraulic fracture operations are performed at several thousand feet, which is far below the depth of potable groundwater.
The fluids used in each hydraulic fracturing operation will differ depending on factors such as the geology and mineralogy for each particular shale. Also, each service company will have their own proprietary additives to add to the hydraulic fracture fluid. With that being said,
14
IOGCC website, Hydraulic Fracturing, http://www.iogcc.state.ok.us/hydraulic-fracturing (accessed on May 27, 2012) 15
Geology.com website, Hydraulic Fracturing of Oil & Gas, http://geology.com/articles/hydraulic-fracturing/ (accessed on May 27, 2012)

6 Canadian Energy Research Institute
March 2013
hydraulic fracturing fluids are typically composed of approximately 99 percent water and sand
but may also contain other materials, such as gelling agents to make the fluid more viscous.16
Figure 1.4 provides an example of the fluid composition for an operation in the Fayetteville Shale in Arkansas. Water and sand account for 99.51 percent of fluid composition. The remaining 0.49 percent includes other chemicals such as friction reducers, corrosion inhibitors, gelling agents and scale inhibitors.
Figure 1.4: Composition of a Frac Fluid
Source: Arthur, J. Daniel and Jon W. Seekins, “Water and Shale Gas Development”, ALL Consulting, Presentation at the National Association of Royalty Owners, Pittsburgh, October 7, 2010, pp. 20.
With the bulk of hydraulic facture fluid being composed of water, water is critical to developing shale gas. For this reason, water usage and management issues – from managing withdrawals, to transporting large volumes, to disposal issues – are important to regulators, whether they are at the federal, state/provincial or regional level.
The volume of fluid and water used in each hydraulic fracture operation depends on the unique geological qualities of the particular shale and the size and number of stages of the frac operations.
17 It is common to use between 924,600 gallons (3,500 m3) and 3,962,580 gallons
(15,000 m3) of water in a deep, multi-stage horizontal frac, whereas a shallow single zone may
only require 20 m3 to 100 m3 of water.18
16
American Petroleum Institute (API), Hydraulic Fracturing at a Glance, 2008. http://www.api.org/policy/exploration/upload/hydraulic_fracturing_at_a_glance.pdf 17
“Understanding Hydraulic Fracturing”, Canadian Society for Unconventional Resources (CSUR), January 2011, pp. 18. 18
ibid
Water and Sand 99.51%

Potential Impacts of Developing Québec’s Shale Gas 7
March 2013
Where is North American Shale Gas Located? Figure 1.5 illustrates major shale gas basins in North America, but there are dozens more that are considered minor and are only now being studied for their gas potential.
Figure 1.5: Major Shale Gas Basins in North America
Source: NEB website, http://www.neb.gc.ca/clf-nsi/rnrgynfmtn/nrgyrprt/nrgyvrvw/cndnnrgyvrvw2009/mg/fg5_5-eng.jpg (accessed on November 23, 2010)
Currently, the Antrim Shale (Northern Michigan), the Barnett Shale (Fort Worth Basin, North Texas), the Devonian/Ohio Shales (Appalachia), the Fayetteville Shale (Arkansas), the Haynesville Shale (Louisiana), the Marcellus Shale (Appalachia), the New Albany (Illinois/Indiana), the Woodford Shale (Oklahoma), the Horn River (British Columbia), and the Montney (British Columbia/Alberta) are all established and commercially-producing plays.
However, there are at least two dozen additional shale plays covering 20 states and provinces that are being categorized as major, and are being developed or are in the exploratory phase of development. While production volumes from shale gas resources in Canada are currently smaller compared to those in the United States, there is substantial potential for future growth in Canada. In order of size of resource, the five largest shale plays in the United States are the Marcellus, Haynesville, Barnett, Fayetteville and Woodford.
8 Canadian Energy Research Institute
March 2013
Shale Gas in Canada Shale gas is attracting interest across North America, and in Canada, northeastern British Columbia is in the heart of the action, while Québec’s Utica Shale is beginning to gain attention and will be discussed later in this study.
Energy companies – spurred by shale gas discoveries – have added to British Columbia’s land sale revenues in recent years. According to the Ministry of Energy, Mines and Petroleum Resources, British Columbia closed out the 2008-09 fiscal year with an all-time high of $2.4 billion in land sale revenues – more than doubling the previous record set in 2007.
19 Shale gas
and tight gas hold enormous supply potential in British Columbia since two of the most promising and active shale plays in Canada are both located in northeastern British Columbia – the Horn River Basin and the Montney Shale.
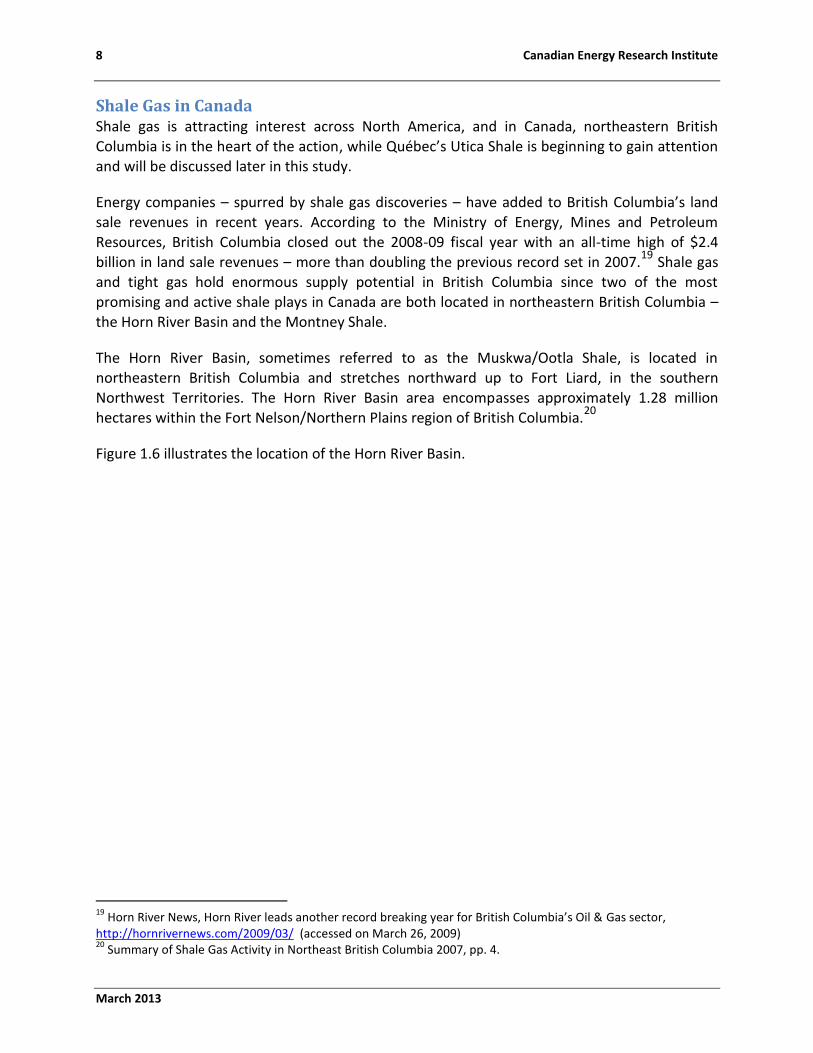
The Horn River Basin, sometimes referred to as the Muskwa/Ootla Shale, is located in northeastern British Columbia and stretches northward up to Fort Liard, in the southern Northwest Territories. The Horn River Basin area encompasses approximately 1.28 million hectares within the Fort Nelson/Northern Plains region of British Columbia.
20
Figure 1.6 illustrates the location of the Horn River Basin.
19
Horn River News, Horn River leads another record breaking year for British Columbia’s Oil & Gas sector, http://hornrivernews.com/2009/03/ (accessed on March 26, 2009) 20
Summary of Shale Gas Activity in Northeast British Columbia 2007, pp. 4.
Potential Impacts of Developing Québec’s Shale Gas 9
March 2013
Figure 1.6: Location of the Horn River Basin
Source: http://www.ogfj.com/index/unconventional/horn-river-shale.html
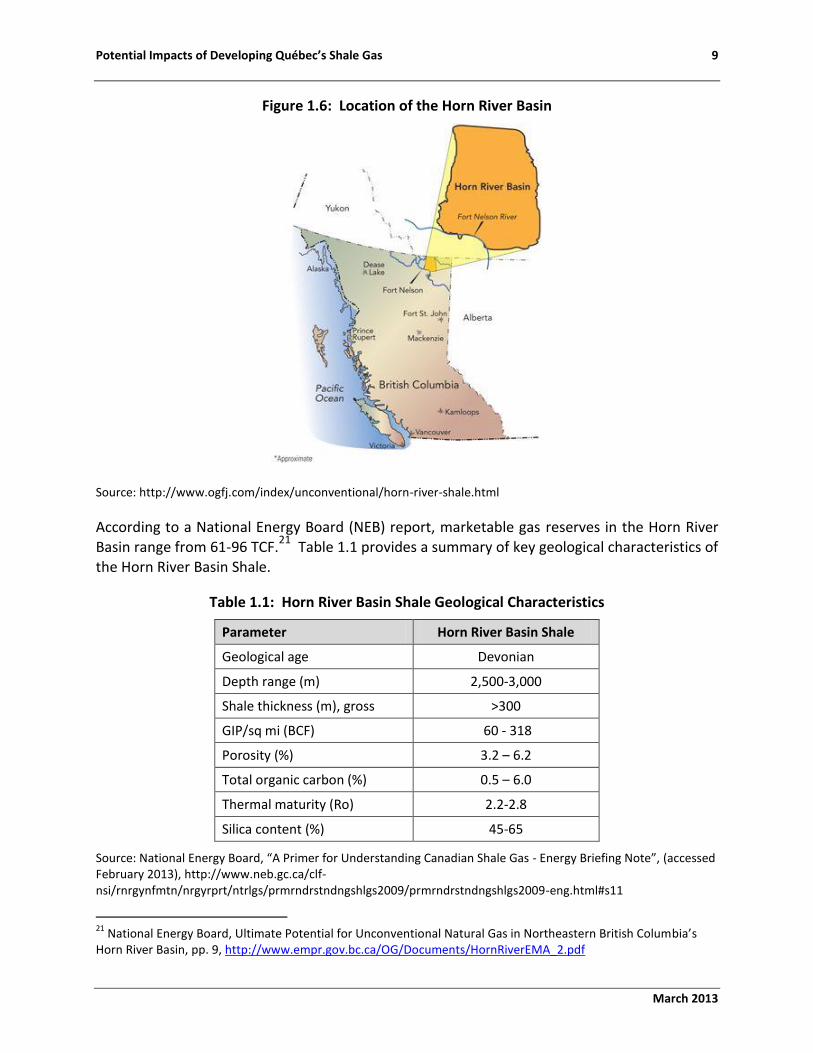
According to a National Energy Board (NEB) report, marketable gas reserves in the Horn River Basin range from 61-96 TCF.
21 Table 1.1 provides a summary of key geological characteristics of
the Horn River Basin Shale.
Table 1.1: Horn River Basin Shale Geological Characteristics
Parameter Horn River Basin Shale
Geological age Devonian
Depth range (m) 2,500-3,000
Shale thickness (m), gross >300
GIP/sq mi (BCF) 60 - 318
Porosity (%) 3.2 – 6.2
Total organic carbon (%) 0.5 – 6.0
Thermal maturity (Ro) 2.2-2.8
Silica content (%) 45-65
Source: National Energy Board, “A Primer for Understanding Canadian Shale Gas - Energy Briefing Note”, (accessed February 2013), http://www.neb.gc.ca/clf-nsi/rnrgynfmtn/nrgyrprt/ntrlgs/prmrndrstndngshlgs2009/prmrndrstndngshlgs2009-eng.html#s11
21
National Energy Board, Ultimate Potential for Unconventional Natural Gas in Northeastern British Columbia’s Horn River Basin, pp. 9, http://www.empr.gov.bc.ca/OG/Documents/HornRiverEMA_2.pdf
10 Canadian Energy Research Institute
March 2013
The potential of the Horn River Basin is attracting large independent producers, as well as
several mid-sized E&P companies. Currently, the top landholders in the region are Encana Corp., Apache Corp., EOG Resources and Nexen Inc., together holding exploration rights to over 760,000 net acres of Horn River land. The Montney formation, on the other hand, is a mature tight-shale gas hybrid gas play in northeast British Columbia, extending into northwest Alberta. The Montney underlies the Doig Formation and is divided into four distinct intervals: Upper, Middle, Middle-Lower and Lower.
22 The Upper, with nearly 90 percent of the drilling activity,
and Lower Montney are considered the most prolific.23
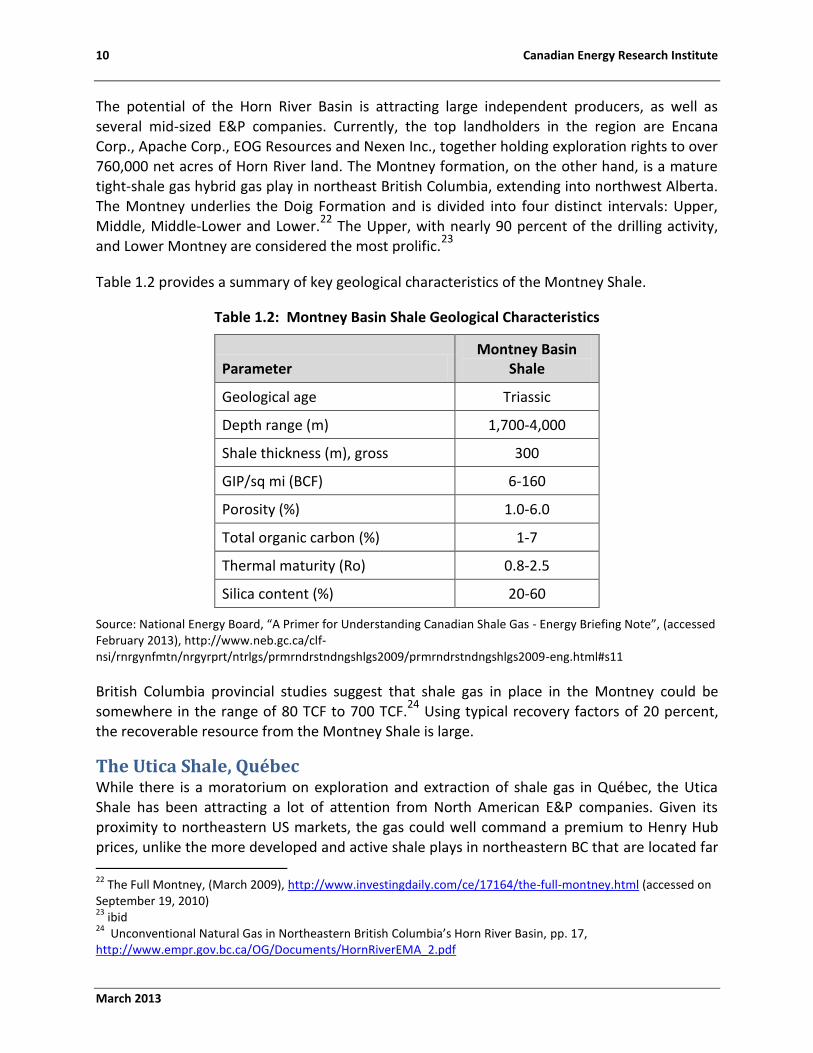
Table 1.2 provides a summary of key geological characteristics of the Montney Shale.
Table 1.2: Montney Basin Shale Geological Characteristics
Parameter Montney Basin
Shale
Geological age Triassic
Depth range (m) 1,700-4,000
Shale thickness (m), gross 300
GIP/sq mi (BCF) 6-160
Porosity (%) 1.0-6.0
Total organic carbon (%) 1-7
Thermal maturity (Ro) 0.8-2.5
Silica content (%) 20-60
Source: National Energy Board, “A Primer for Understanding Canadian Shale Gas - Energy Briefing Note”, (accessed February 2013), http://www.neb.gc.ca/clf-nsi/rnrgynfmtn/nrgyrprt/ntrlgs/prmrndrstndngshlgs2009/prmrndrstndngshlgs2009-eng.html#s11
British Columbia provincial studies suggest that shale gas in place in the Montney could be somewhere in the range of 80 TCF to 700 TCF.
24 Using typical recovery factors of 20 percent,
the recoverable resource from the Montney Shale is large.
The Utica Shale, Québec While there is a moratorium on exploration and extraction of shale gas in Québec, the Utica
Shale has been attracting a lot of attention from North American E&P companies. Given its proximity to northeastern US markets, the gas could well command a premium to Henry Hub prices, unlike the more developed and active shale plays in northeastern BC that are located far 22
The Full Montney, (March 2009), http://www.investingdaily.com/ce/17164/the-full-montney.html (accessed on September 19, 2010) 23
ibid 24
Unconventional Natural Gas in Northeastern British Columbia’s Horn River Basin, pp. 17, http://www.empr.gov.bc.ca/OG/Documents/HornRiverEMA_2.pdf
Potential Impacts of Developing Québec’s Shale Gas 11
March 2013
from consuming markets. The Utica Shale holds enormous potential for the province, but is also
a source of controversy.
The following section will discuss the geology and basin metrics, E&P companies, and additional information regarding shale gas in Québec. While this report focuses on the Utica Shale, the Macasty Shales of Anticosti Island, located in the Gulf of St. Lawrence, also hold potential for oil and gas development in Québec.
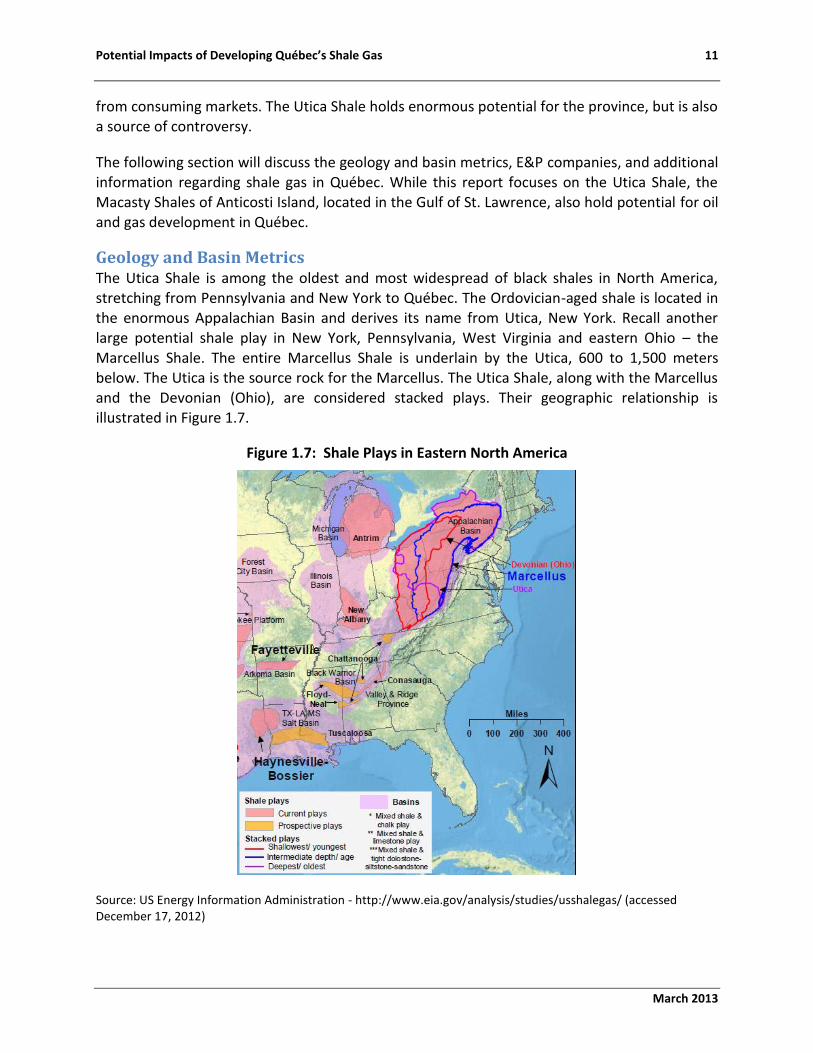
Geology and Basin Metrics The Utica Shale is among the oldest and most widespread of black shales in North America, stretching from Pennsylvania and New York to Québec. The Ordovician-aged shale is located in the enormous Appalachian Basin and derives its name from Utica, New York. Recall another large potential shale play in New York, Pennsylvania, West Virginia and eastern Ohio – the
Marcellus Shale. The entire Marcellus Shale is underlain by the Utica, 600 to 1,500 meters below. The Utica is the source rock for the Marcellus. The Utica Shale, along with the Marcellus and the Devonian (Ohio), are considered stacked plays. Their geographic relationship is illustrated in Figure 1.7.
Figure 1.7: Shale Plays in Eastern North America
Source: US Energy Information Administration - http://www.eia.gov/analysis/studies/usshalegas/ (accessed December 17, 2012)

12 Canadian Energy Research Institute
March 2013
The Utica is the deepest and oldest of the three shale plays, with the Devonian/Ohio shales
being the shallowest and youngest. The Marcellus Shale is of intermediate age and depth, and is the largest subset of the enormous Appalachian Basin, which is the largest hydrocarbon-bearing basin in the lower-48 states.
The Devonian Shales are black organic-rich shales in the Appalachian Basin and have long been famous for their shale gas and coal-bearing qualities. The USGS estimates that the Utica shales in the US contain 35.6 TCF of gas, 9 million barrels of gas liquids and 911 million barrels of oil.
25
The Utica Shale, the oldest and most widespread of black shales, is characterized as Deep Utica and Shallow Utica. Much of the exploration and development of the Deep Utica occurs in Ohio while the Shallow Utica is located in Québec, with the best prospects lying within a corridor that runs parallel with the St. Lawrence River southeast of Montréal up to Québec City.
Figure 1.8 shows the location of the Utica Shale. Québec’s Utica is shown in the top right of the graphic. A summary of the geological characteristics of the Utica Shale are displayed in Table 1.3.
Figure 1.8: Map of the Utica Shale
Source: Utica Shale News and Maps, http://www.uticashalenews.com/wp-content/uploads/2011/08/utica-shale-map-3.gif (accessed May 24, 2012)
25
Assessment of Undiscovered Oil and Gas Resources of the Ordovician Utica Shale of the Appalachian Basin Province, 2012, http://pubs.usgs.gov/fs/2012/3116/FS12-3116.pdf

Potential Impacts of Developing Québec’s Shale Gas 13
March 2013
Table 1.3: Utica Shale Geological Characteristics
Parameter Utica Shale
Geological age Ordovician
Depth range (m) 500-3300
Shale thickness (m), gross 90-300
GIP/sq mi (BCF) 25-210
Porosity (%) 2.2-3.7
Total organic carbon (%) 0.3-2.25
Thermal maturity (Ro) 1.1-4.0
Silica content (%) 5-25
Source: National Energy Board, “A Primer for Understanding Canadian Shale Gas - Energy Briefing Note”, (accessed February 2013), http://www.neb.gc.ca/clf-nsi/rnrgynfmtn/nrgyrprt/ntrlgs/prmrndrstndngshlgs2009/prmrndrstndngshlgs2009-eng.html#s11
Utica Shale Exploration & Production Companies While the play is still in the exploration stage, the Utica Shale has attracted attention from oil and gas companies in recent years. Figure 1.9 illustrates the oil and gas projects permits along the St. Lawrence Lowlands. Currently, the largest landholders are Lone Pine Resources (formerly Canadian Forest Oil Ltd.), Talisman Energy Inc., Questerre Energy, Gastem Inc., Junex Inc., and X-Terra Resource Corporation. Questerre’s CEO Michael Binnion recently noted that
while the geology is similar to the Barnett in East Texas, it is much more expensive to drill in Québec.26 Mr. Binnion attributed this to a lack of service sector in the province and the need to import drilling rigs and their crews.27 He also suggested that companies would need to invest upwards of C$500 million to complete 50 wells, to gain economies of scale, and bring the costs down.28 With a moratorium currently in place, this is unlikely to occur.
26
The Globe and Mail website, Quebec Shale Gas Project Grinds to a Halt, http://m.theglobeandmail.com/report-on-business/industry-news/energy-and-resources/quebec-shale-gas-project-grinds-to-halt/article1757870/?service=mobile (accessed on June 5, 2012) 27
ibid 28
ibid

14 Canadian Energy Research Institute
March 2013
Figure 1.9: Oil and Gas Projects Permits Map in the St. Lawrence Lowlands
Source: Brownstone Energy website, Projects: Québec, http://brownstoneenergy.com/projects/quebec/, (accessed on June 5, 2012)
In June 2011, the Québec National Assembly passed Bill 18 “An Act to Limit Oil and Gas Activities”. This Bill had the effect of revoking rights which had already been granted to explore and produce oil and gas in the St. Lawrence River and halted oil and gas activity in the area. Consequently, some companies have pulled out of Québec altogether, and one company, Lone Pine, has announced their plan to pursue legal action against the Canadian government in order to receive compensation for the expropriation of mineral rights without compensation under the provisions of Article 11 of the North American Free Trade Agreement (NAFTA).
Lone Pine Resources, formerly known as Forest Oil, was the first E&P to explore in the Utica Shale. In April 2008, Forest Oil announced the discovery of the new gas play in the Utica Shale in the St. Lawrence basin.
29 Lone Pine spent the previous several years defining the play and
acquiring acreage. They also formed joint-venture partnerships early in the process with Québec-based companies, Junex Inc. and Gastem.
30 Lone Pine Resources drilled three vertical
29
Utica Shale Play in Quebec–Forest Oil Announced New Trend, Canaccord-Adams, April 2008, pp.2. 30
ibid, pp.3.
Potential Impacts of Developing Québec’s Shale Gas 15
March 2013
wells in 2006 and 2007, including the Bécancour No. 8 (with Junex), St-François-du-Lac No. 1
(with Gastem) and St-Louis-de-Richelieu No. 1 (with Gastem).31
The Bécancour No. 8 and the St-François-du-Lac No. 1 were fracture stimulated.
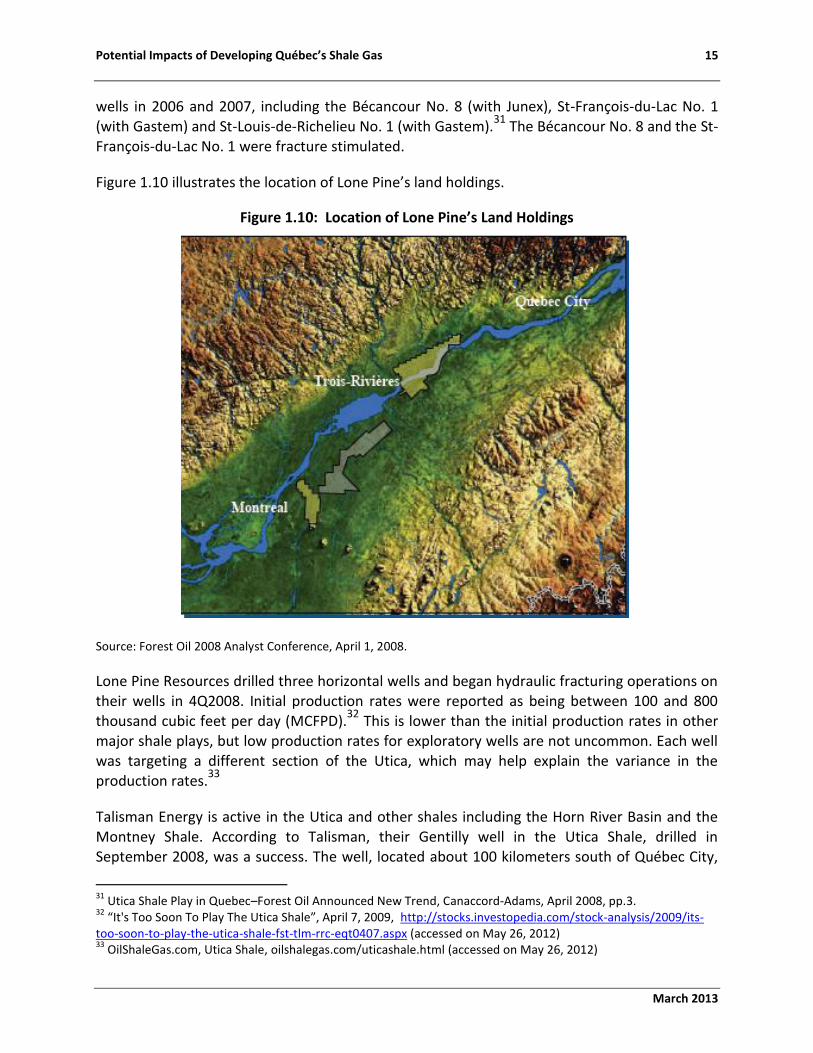
Figure 1.10 illustrates the location of Lone Pine’s land holdings.
Figure 1.10: Location of Lone Pine’s Land Holdings
Source: Forest Oil 2008 Analyst Conference, April 1, 2008.
Lone Pine Resources drilled three horizontal wells and began hydraulic fracturing operations on their wells in 4Q2008. Initial production rates were reported as being between 100 and 800 thousand cubic feet per day (MCFPD).
32 This is lower than the initial production rates in other
major shale plays, but low production rates for exploratory wells are not uncommon. Each well was targeting a different section of the Utica, which may help explain the variance in the production rates.
33
Talisman Energy is active in the Utica and other shales including the Horn River Basin and the Montney Shale. According to Talisman, their Gentilly well in the Utica Shale, drilled in September 2008, was a success. The well, located about 100 kilometers south of Québec City,
31
Utica Shale Play in Quebec–Forest Oil Announced New Trend, Canaccord-Adams, April 2008, pp.3. 32
“It's Too Soon To Play The Utica Shale”, April 7, 2009, http://stocks.investopedia.com/stock-analysis/2009/its-too-soon-to-play-the-utica-shale-fst-tlm-rrc-eqt0407.aspx (accessed on May 26, 2012) 33
OilShaleGas.com, Utica Shale, oilshalegas.com/uticashale.html (accessed on May 26, 2012)
16 Canadian Energy Research Institute
March 2013
flowed at 800 MCFPD.34
Following this success, Talisman drilled three more wells in 2008.35
Production tests ranged from 200 to 900 MCFPD in Talisman’s wells.36
By 2Q2010, Talisman had drilled four horizontal wells, with a fifth in early August 2010.37
The company expected to have three producing wells by the end of 3Q2010 and five by the end of 2010.
38 Québec’s subsequent moratorium and 2-year period of assessment, has halted the
company’s development plans. Consequently, Talisman suspended operations in the Utica Shale in 2011.
39
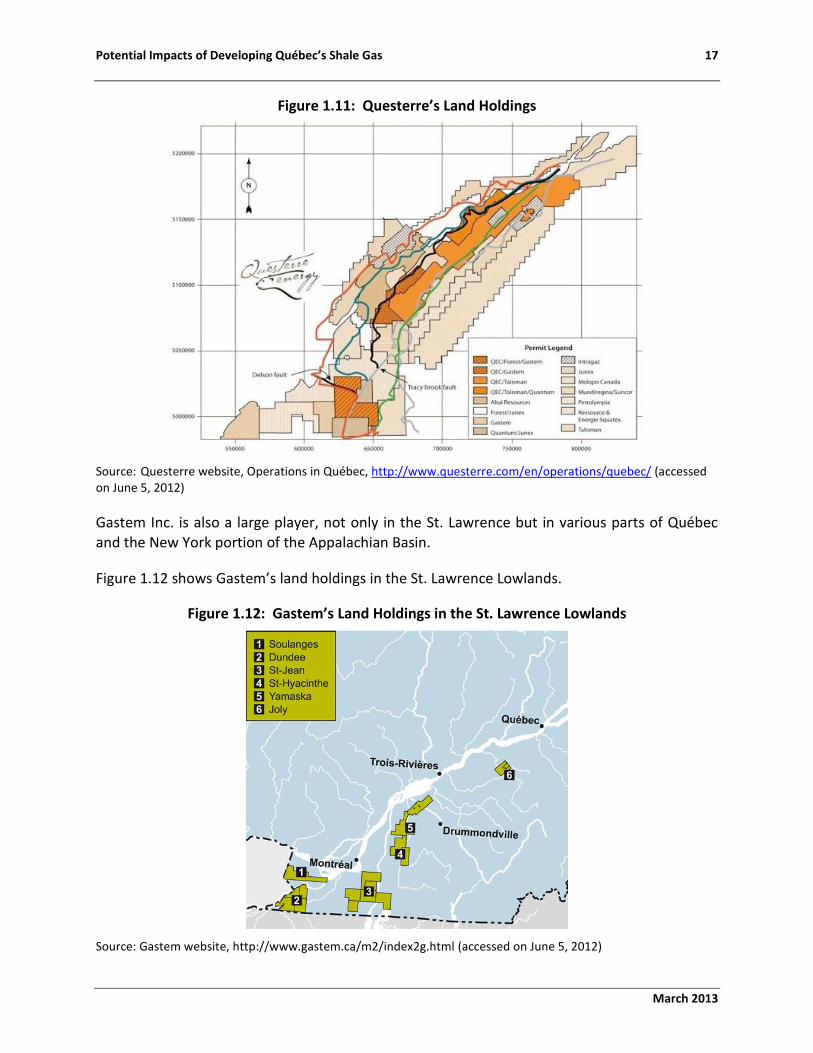
Calgary-based Questerre Energy operates mostly in the fairways between Logan’s Line and the Yamaska growth fault (see Figure 1.11).40 The company began its drilling program in late 2009, following the vertical test wells in 2008 and 2009 with Talisman.41 The St. Edouard No. 1A and the Gentilly No. 2 were drilled in late 2009, while the St. Gertrude No. 1 and Fortierville No. 1
were drilled in 2010.42
34
OilShaleGas.com, Utica Shale, oilshalegas.com/uticashale.html (accessed on May 26, 2012) 35
ibid 36
“The Utica Shale Gains Ground”, September 7, 2010, http://stocks.investopedia.com/stock-analysis/2010/The-Utica-Shale-Gains-Ground-TLM-FST-RRC-ATLS0907.aspx (accessed on June 5, 2012) 37
ibid 38
ibid 39
Talisman Energy, Operations: Quebec http://www.talisman-energy.com/operations/north_america/quebec/ (accessed on June 5, 2012) 40
Questerre website, Quebec Operations, http://www.questerre.com/en/operations/quebec/ (accessed on June 5, 2012) 41
ibid 42
ibid
Potential Impacts of Developing Québec’s Shale Gas 17
March 2013
Figure 1.11: Questerre’s Land Holdings
Source: Questerre website, Operations in Québec, http://www.questerre.com/en/operations/quebec/ (accessed on June 5, 2012)
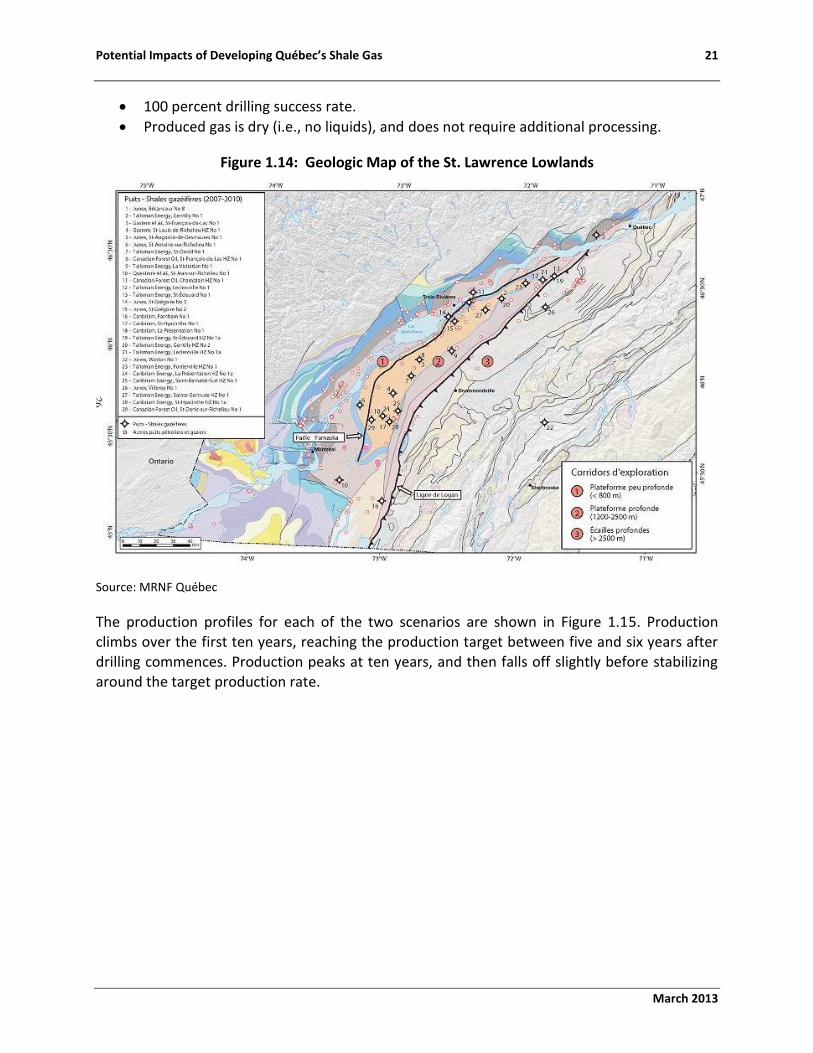
Gastem Inc. is also a large player, not only in the St. Lawrence but in various parts of Québec and the New York portion of the Appalachian Basin.
Figure 1.12 shows Gastem’s land holdings in the St. Lawrence Lowlands.
Figure 1.12: Gastem’s Land Holdings in the St. Lawrence Lowlands
Source: Gastem website, http://www.gastem.ca/m2/index2g.html (accessed on June 5, 2012)

18 Canadian Energy Research Institute
March 2013
Recall that Gastem partnered with Lone Pine Resources in 2006 and 2007 to drill the St-
François-du-Lac No. 1 and the St-Louis-de-Richelieu No. 1 wells.43 Both wells are located in the Yamaska Property, indicated in Figure 1.12.
Québec-based Junex Inc. is the largest landholder in Québec, province-wide, with respect to oil and gas mineral rights.44 The company, created in 1999, has holdings in the St. Lawrence Lowlands, Gaspé Peninsula and Anticosti Island (see Figure 1.13). Junex, as previously mentioned, has 2 joint ventures with Lone Pine Resources, including the Bécancour #8.
Figure 1.13: Junex’s Land Holdings
Source: Junex website, St. Lawrence Lowlands, http://www.junex.ca/st-lawrence-lowlands (accessed on June 5, 2012)
Regulatory Considerations Oil and gas development and production is regulated by a complex and extensive set of regulations at the federal, provincial and local levels, and each jurisdiction has its own particular framework. The federal government has input into resource developments as it relates to interprovincial and export trade, and regulates the construction and operation of interprovincial and international pipelines, including their tolls and tariffs.
45 In Canada, the NEB
43
Questerre website, Quebec Operations, http://www.questerre.com/en/operations/quebec/ (accessed on June 5, 2012) 44
Junex website, Finding Oil and Gas in Quebec, http://www.junex.ca/finding-oil-gas-quebec (accessed on June 5, 2012) 45
NEB website, Canada’s National Energy Regulator, http://www.neb-one.gc.ca/clf-nsi/rthnb/whwrndrgvrnnc/cndntnlnrgrgltr-eng.html (accessed on June 5, 2012)

Potential Impacts of Developing Québec’s Shale Gas 19
March 2013
is the main regulatory body in the Territories and offshore areas.46
The provinces, however,
manage the mechanics of their own resource development. This includes, but is not exclusive to, land use (with the exception of Indian, defense and federal lands), drilling, pipelines (with the exception of interprovincial or export) and industrial complexes.
In Québec, the Ministère des Resources Naturelles et de la Faune oversees oil and gas activities within the province, from exploration and development to drilling and decommissioning.
47 In
addition, the large department also regulates the development and use of land, energy, forestry and mineral resources in Québec.
48 While the oil and gas sector has played a small role
in the organization’s mandate thus far, the sheer potential of the Utica Shale has initiated change, including creating a new oil and gas regulatory framework.
On August 31, 2010, Québec’s Cabinet mandated the Bureau d’Audiences Publiques sur
l’Environnement (BAPE – Public Hearings on the Environment Board) to propose a framework for shale gas exploration and development in the province.
49 Public hearings began September
14, 2010 and Ministers have encountered loud opposition from environmentalists and some residents.
50 A similar response has been encountered in the northeastern part of the US where
regulators are also either establishing or editing their regulatory frameworks.
In March 2011, the Ministry of Environment, Sustainable Development and Parks in Québec (MDDEP) published the report of the BAPE on the development of the shale gas industry in Québec. The report recommended increasing the understanding of shale gas by all stakeholders, and that a Strategic Environmental Assessment (SEA) be conducted.
51 Following
the MDDEP, the Ministry of Finance published its new royalty regime for the development of
shale gas in the province.52
The new royalty regime will come into effect once the strategic environmental assessment recommended by the BAPE has been completed and the legal and regulatory framework has been adapted to its conclusions.
53 The new rate varies between 5
and 35 percent, and has been modeled on the royalty regimes used in Alberta and British Columbia versus the old regime which was a fixed rate of 10-12.5 percent.
54
46
NEB website, Canada’s National Energy Regulator, http://www.neb-one.gc.ca/clf-nsi/rthnb/whwrndrgvrnnc/cndntnlnrgrgltr-eng.html (accessed on June 5, 2012) 47
http://www.ogc.gov.bc.ca/documents/annualreports/Oil_and_Gas_Water_Use_in_BC.pdf pp. 4. 48
Ministère des Ressources Naturelles et de la Faune website, http://www.mrnf.gouv.qc.ca/english/department/index.jsp (accessed on September 14, 2010) 49
“Shale Gas: Anticipated Changes to Quebec’s Regulatory Framework”, Blakes website, http://www.blakes.com/english/view.asp?ID=4214 (accessed on September 14, 2010) 50
“Quebec shale gas debate heats up”, CBC website, http://www.cbc.ca/canada/montreal/story/2010/08/29/que-shale-gas.html (accessed on September 14, 2010) 51
Montreal Gazette, A year later, Quebec opposition to shale gas is still fierce, March 20. 2012, http://blogs.montrealgazette.com/2012/03/20/a-year-later-quebec-opposition-to-shale-gas-is-still-fierce/ 52
Questerre website, Quebec Operations, http://www.questerre.com/en/operations/quebec/ (accessed on June 5, 2012) 53
ibid 54
Osler website, Quebec Announces Creation of New Royalty Regime for Shale Gas Industry, http://www.osler.com/NewsResources/Details.aspx?id=3329 (accessed on June, 5, 2012)

20 Canadian Energy Research Institute
March 2013
Economic Impacts of Developing Shale Gas in Québec This report does not comment on the possibility of lifting the moratorium that currently exists in Québec, nor any other regulatory or policy changes; it is strictly a study of the economic impacts of developing the Utica Shale were it to happen.
In Québec, there is not currently any significant oil and gas service industry presence, which can lead to significant drilling cost over-runs, and does not allow for companies to achieve economies of scale. This study makes the assumption that the Utica Shale will be developed in an environment where a moderate level of oil and gas services are in place, allowing a certain degree of cost reduction to be established for drillers in the region. In other words, this study assumes that the costs of wells drilled reflect the cost of field development, rather than exploratory wells. Consequently, this study will not reflect any of the cost of the expensive
exploratory phase.
A shallow Montney horizontal well from northeast BC was used as an analog to estimate the cost of drilling the Utica Shale in Québec due to the similar depth of the formation and length of horizontal leg assumed to be used in the Utica Shale (1,850m vertical depth, 3,500m measured depth).
55 Each well is assumed to cost roughly $7 million which includes all costs from
construction, drilling and completion. A type curve from a BC Horn River well was used as an analog for the estimated production profile for a Utica Shale well due to their similar geologic characteristics. There is insufficient production data from the Utica Shale to apply a production profile from the Utica Shale to this study.
Two scenarios are investigated in this study. In the first scenario, drilling takes place to build
and maintain a production level of approximately 500 million cubic feet per day (MMCFPD) – Québec’s current consumption of natural gas. In the second scenario, drilling takes place to build and maintain a production level of approximately 1,500 MMCFPD, which would allow for 1,000 MMCFPD of export capacity on top of Québec’s own consumption needs. These production levels are exogenous. In order to model this development, the following assumptions were made:
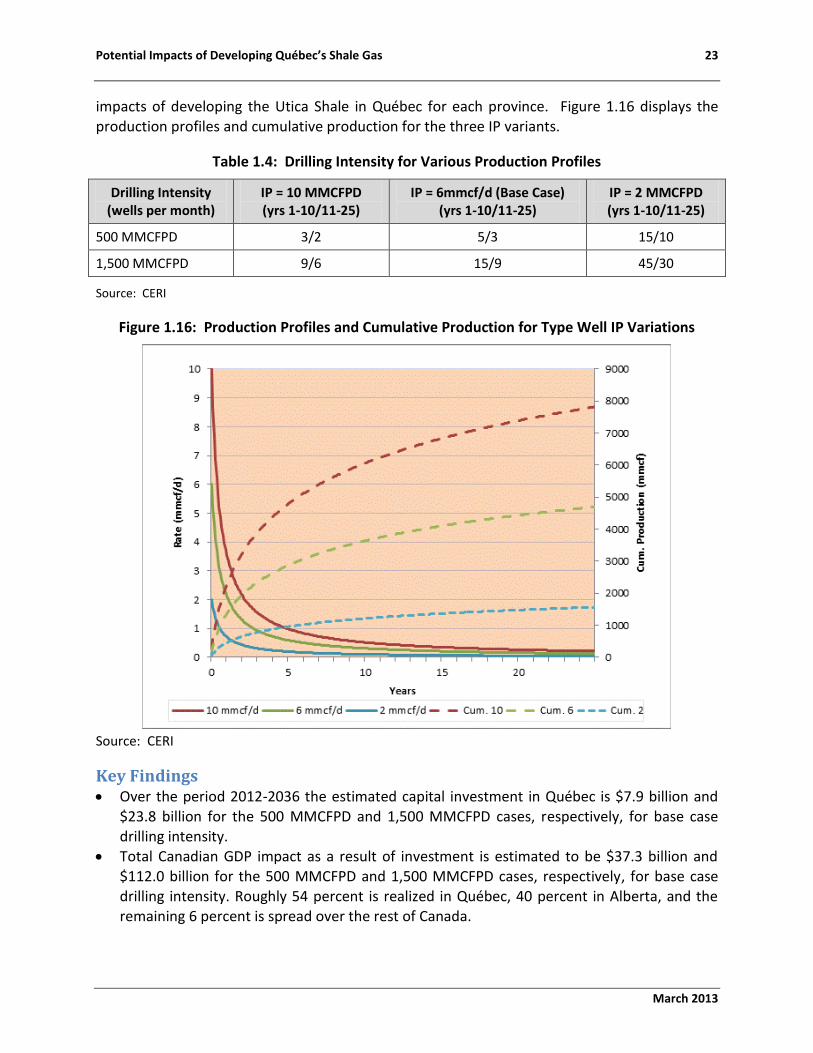
The area of development was restricted to the fairway between the Yamaska fault and Logan’s Line (Area 2) and is assumed to be the only area of development in this study and makes up an area roughly 2,400 sq. miles in size56 (see Figure 1.14). This has been the area with the greatest level of activity and development to date and carries with it the least uncertainty.
60 percent of the area is suitable for drilling.
Utica Shale is developed exclusively with horizontal wells, with 1,500m horizontal legs and 320m inter-well spacing (5 wells per section). This amounts to 7,200 potential well locations.
55
Petroleum Services Association of Canada 2012 Well Cost Study, pp. 46-51, Published November 3, 2011 56
Shale Gas Potential of the Quebec Sedimentary Basins; Marcil, Lavoie et al, Search and Discovery Article #80073 (2009)
Potential Impacts of Developing Québec’s Shale Gas 21
March 2013
100 percent drilling success rate.
Produced gas is dry (i.e., no liquids), and does not require additional processing.
Figure 1.14: Geologic Map of the St. Lawrence Lowlands
Source: MRNF Québec
The production profiles for each of the two scenarios are shown in Figure 1.15. Production climbs over the first ten years, reaching the production target between five and six years after drilling commences. Production peaks at ten years, and then falls off slightly before stabilizing around the target production rate.

22 Canadian Energy Research Institute
March 2013
Figure 1.15: Production Profiles of Two Production Scenarios
Source: CERI
Methodology The goal of this study is to investigate the economic impacts of two different scenarios of shale gas development in Québec over the next twenty-five years. As previously mentioned, the first is a scenario in which drilling activity is maintained to sustain a production level of roughly 500 MMCFPD in order to meet Québec’s current consumption. Second, a scenario in which total production rises to roughly 1,500 MMCFPD, resulting in 1,000 MMCFPD of natural gas exports. Three different production profiles were tested for each scenario to investigate the drilling intensity required to meet the demand required. A type curve from a BC Horn River well was used as an analog for the estimated production profile for a Utica Shale well due to their similar geologic characteristics. An initial production (IP) rate of 6 MMCFPD was used as the base case for the study, which is similar to the IP rate of Talisman’s St. Edouard Hz well in the Utica Shale
drilled in 2010, which had a 30-day IP rate of 5.3 MMCFPD.57
Two other variations of well productivity (10 MMCFPD IP and 2 MMCFPD IP) were also used to test the sensitivity of the results for each production level scenario. Table 1.4 shows the drilling activity required for each variation in order to meet the production requirements for each scenario. Results from each simulation were then plugged into an Input-Output (I-O) model to estimate the economic
57
Talisman Energy Investor Open House, May 2010. North American Operations
Potential Impacts of Developing Québec’s Shale Gas 23
March 2013
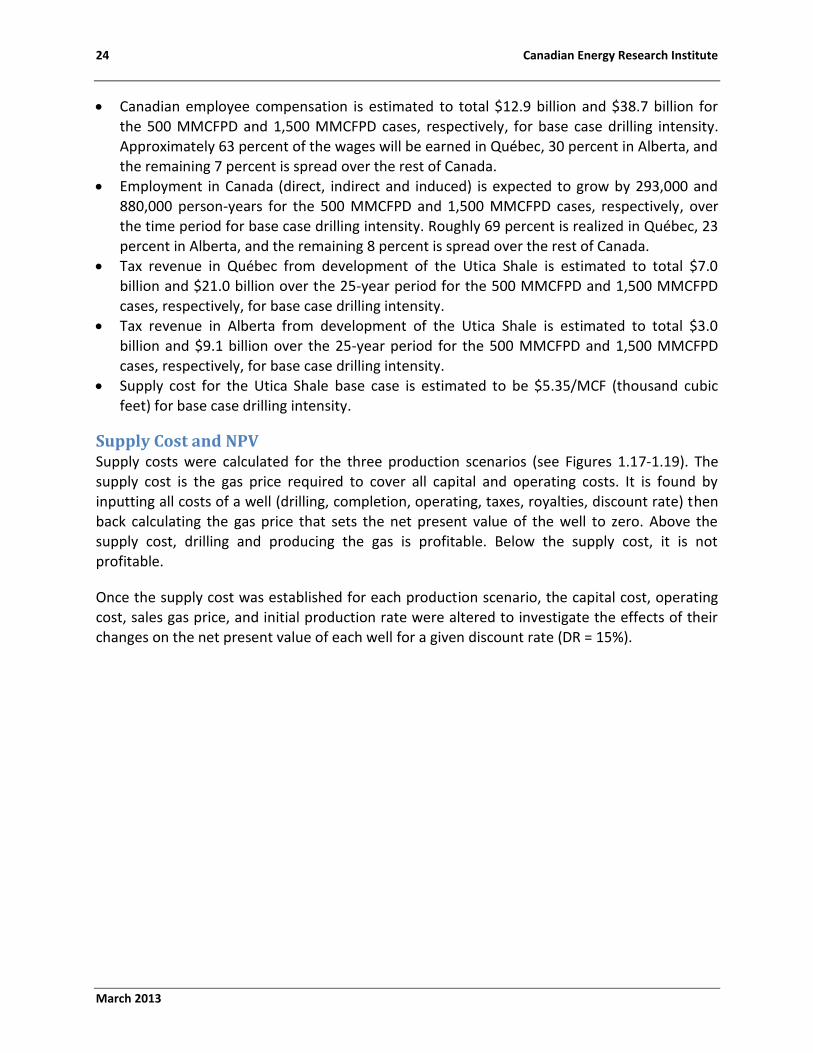
impacts of developing the Utica Shale in Québec for each province. Figure 1.16 displays the
production profiles and cumulative production for the three IP variants.
Table 1.4: Drilling Intensity for Various Production Profiles
Drilling Intensity (wells per month)
IP = 10 MMCFPD (yrs 1-10/11-25)
IP = 6mmcf/d (Base Case) (yrs 1-10/11-25)
IP = 2 MMCFPD (yrs 1-10/11-25)
500 MMCFPD 3/2 5/3 15/10
1,500 MMCFPD 9/6 15/9 45/30
Source: CERI
Figure 1.16: Production Profiles and Cumulative Production for Type Well IP Variations
Source: CERI
Key Findings Over the period 2012-2036 the estimated capital investment in Québec is $7.9 billion and
$23.8 billion for the 500 MMCFPD and 1,500 MMCFPD cases, respectively, for base case drilling intensity.
Total Canadian GDP impact as a result of investment is estimated to be $37.3 billion and $112.0 billion for the 500 MMCFPD and 1,500 MMCFPD cases, respectively, for base case drilling intensity. Roughly 54 percent is realized in Québec, 40 percent in Alberta, and the remaining 6 percent is spread over the rest of Canada.
24 Canadian Energy Research Institute
March 2013
Canadian employee compensation is estimated to total $12.9 billion and $38.7 billion for
the 500 MMCFPD and 1,500 MMCFPD cases, respectively, for base case drilling intensity. Approximately 63 percent of the wages will be earned in Québec, 30 percent in Alberta, and the remaining 7 percent is spread over the rest of Canada.
Employment in Canada (direct, indirect and induced) is expected to grow by 293,000 and 880,000 person-years for the 500 MMCFPD and 1,500 MMCFPD cases, respectively, over the time period for base case drilling intensity. Roughly 69 percent is realized in Québec, 23 percent in Alberta, and the remaining 8 percent is spread over the rest of Canada.
Tax revenue in Québec from development of the Utica Shale is estimated to total $7.0 billion and $21.0 billion over the 25-year period for the 500 MMCFPD and 1,500 MMCFPD cases, respectively, for base case drilling intensity.
Tax revenue in Alberta from development of the Utica Shale is estimated to total $3.0
billion and $9.1 billion over the 25-year period for the 500 MMCFPD and 1,500 MMCFPD cases, respectively, for base case drilling intensity.
Supply cost for the Utica Shale base case is estimated to be $5.35/MCF (thousand cubic feet) for base case drilling intensity.
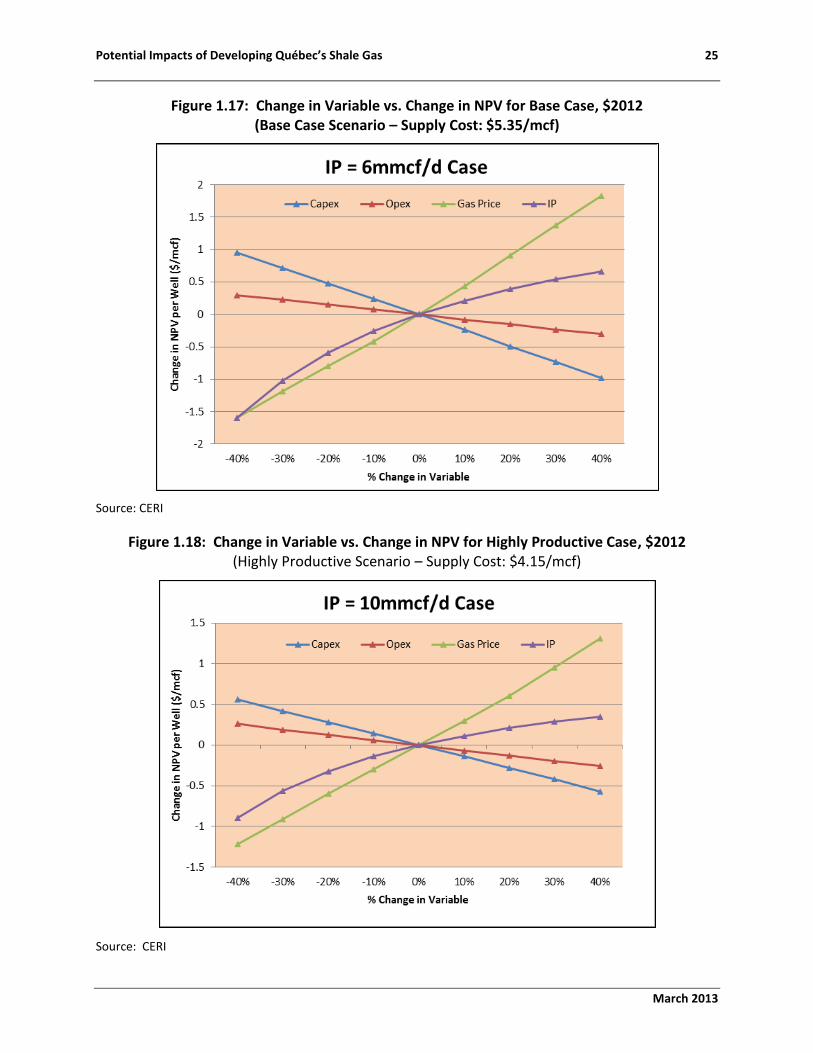
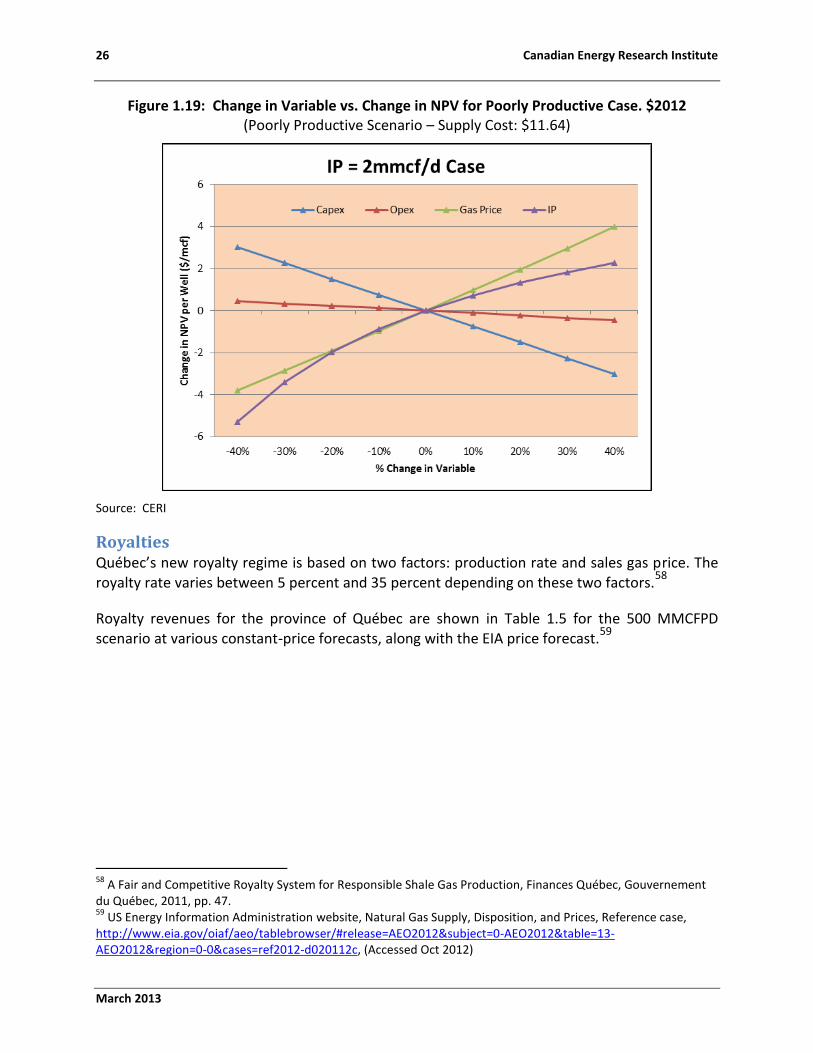
Supply Cost and NPV Supply costs were calculated for the three production scenarios (see Figures 1.17-1.19). The supply cost is the gas price required to cover all capital and operating costs. It is found by inputting all costs of a well (drilling, completion, operating, taxes, royalties, discount rate) then back calculating the gas price that sets the net present value of the well to zero. Above the supply cost, drilling and producing the gas is profitable. Below the supply cost, it is not profitable.
Once the supply cost was established for each production scenario, the capital cost, operating cost, sales gas price, and initial production rate were altered to investigate the effects of their changes on the net present value of each well for a given discount rate (DR = 15%).
Potential Impacts of Developing Québec’s Shale Gas 25
March 2013
Figure 1.17: Change in Variable vs. Change in NPV for Base Case, $2012 (Base Case Scenario – Supply Cost: $5.35/mcf)
Source: CERI
Figure 1.18: Change in Variable vs. Change in NPV for Highly Productive Case, $2012 (Highly Productive Scenario – Supply Cost: $4.15/mcf)
Source: CERI
26 Canadian Energy Research Institute
March 2013
Figure 1.19: Change in Variable vs. Change in NPV for Poorly Productive Case. $2012 (Poorly Productive Scenario – Supply Cost: $11.64)
Source: CERI
Royalties Québec’s new royalty regime is based on two factors: production rate and sales gas price. The
royalty rate varies between 5 percent and 35 percent depending on these two factors.58
Royalty revenues for the province of Québec are shown in Table 1.5 for the 500 MMCFPD scenario at various constant-price forecasts, along with the EIA price forecast.
59
58
A Fair and Competitive Royalty System for Responsible Shale Gas Production, Finances Québec, Gouvernement du Québec, 2011, pp. 47. 59
US Energy Information Administration website, Natural Gas Supply, Disposition, and Prices, Reference case, http://www.eia.gov/oiaf/aeo/tablebrowser/#release=AEO2012&subject=0-AEO2012&table=13-AEO2012®ion=0-0&cases=ref2012-d020112c, (Accessed Oct 2012)

Potential Impacts of Developing Québec’s Shale Gas 27
March 2013
Table 1.5: Québec Royalty Revenues for 500 MMCFPD Scenario at Constant Prices and the EIA Forecast
500 MMCFPD
Highly Productive Wells
Moderately Productive Wells
Poorly Productive Wells
Price ($/mcf) Royalty Revenue (Nominal $MM)
Royalty Revenue (Nominal $MM)
Royalty Revenue (Nominal $MM)
3.00 2,365 1,805 878
4.00 3,643 2,831 1,388
5.00 5,314 4,236 2,197
6.00 6,771 5,750 3,625
7.00 8,101 7,090 4,941
10.00 12,238 11,564 9,883
EIA Forecast* 5,496 4,103 2,030
*$0.50/mcf premium added to EIA forecast due to Québec’s proximity to premium markets.
Source: CERI
The 1,500 MMCFPD scenario basically triples the drilling rate of the first scenario, and consequently triples the royalty revenue. Royalties are shown in Table 1.6.
Table 1.6: Québec Royalty Revenues for 1,500 MMCFPD Scenario at Constant Prices and the EIA Forecast
1,500 MMCFPD Highly Productive Wells
Moderately Productive Wells
Poorly Productive Wells
Price ($/MCF) Royalty Revenue (Nominal $MM)
Royalty Revenue (Nominal $MM)
Royalty Revenue (Nominal $MM)
3.00 6,797 5,246 2,694
4.00 10,928 8,494 4,357
5.00 16,443 12,995 7,003
6.00 21,517 17,939 11,631
7.00 26,060 22,272 15,865
10.00 40,733 36,986 31,790
EIA Forecast* 15,943 11,996 5,980
*$0.50/mcf premium added to EIA forecast due to Québec’s proximity to premium markets.
Source: CERI

28 Canadian Energy Research Institute
March 2013
Capital Investment Capital investment would be entirely realized in the province of Québec, and is estimated to reach over $7.3 billion and $23.7 billion (nominal dollars) for the 500 MMCFPD and 1,500 MMCFPD scenarios, respectively, at the Base Case production level. The capital investment is the amount of money spent drilling and completing all the wells required to meet the production targets over the time period 2012-2036. Capital investment varies significantly and inversely to the productivity of the wells in the field in these models. In order to attain the production targets, more wells will be required if each well has a lower production level. Of course, this would only be true in reality to the point that field development no longer becomes economic. This is a limitation of the model since the field production targets are pre-determined (exogenous) to be 500 MMCFPD and 1,500 MMCFPD, and the competitive market is not allowed to influence the overall field production levels.
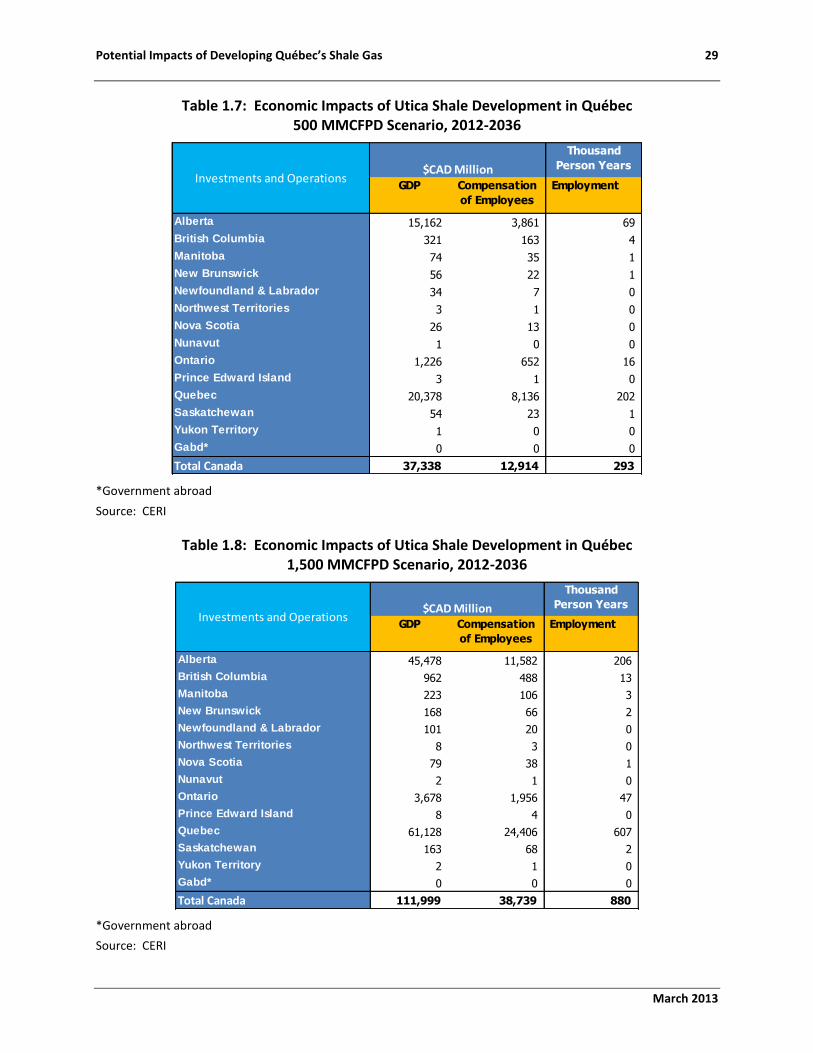
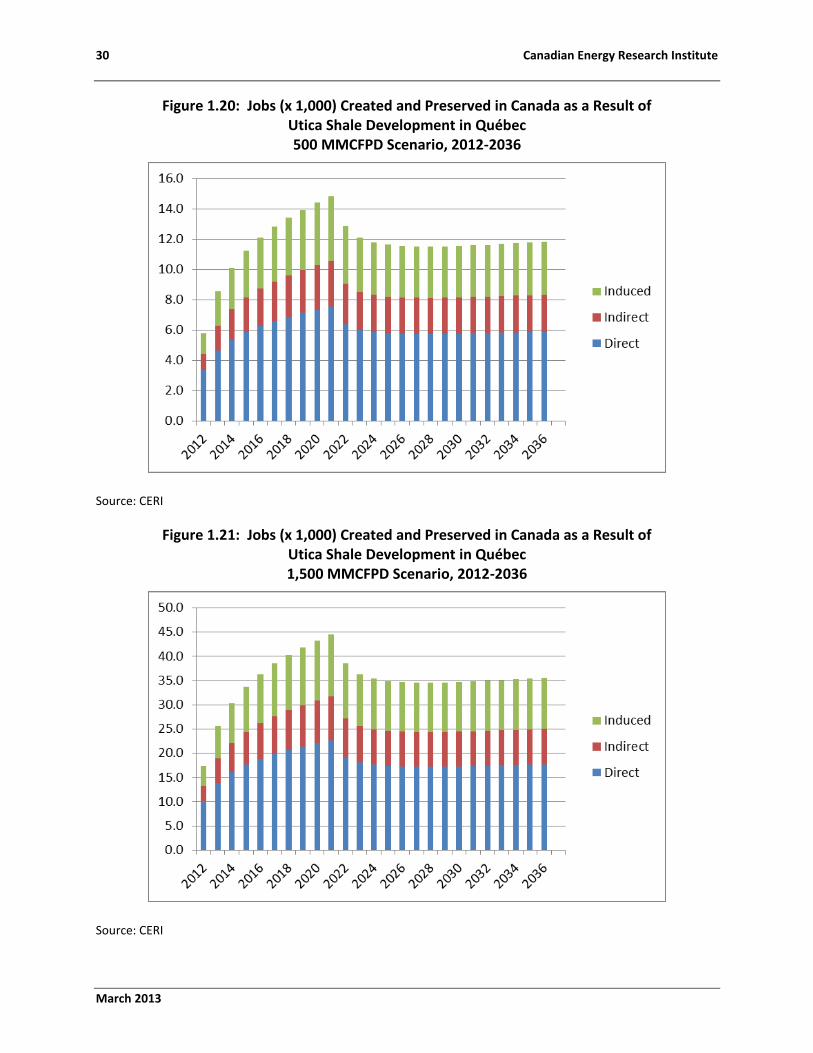
GDP, Employment and Tax The cumulative additional Canadian GDP over the time period 2012-2036 as a result of developing the Utica Shale in Québec is $37.3 billion and $112 billion for the 500 MMCFPD and 1,500 MMCFPD cases, respectively (see Tables 1.7 and 1.8). Canadian employment (direct, indirect and induced) from development of the Utica Shale is estimated to be 293,000 and 880,000 person years for the 500 MMCFPD and 1,500 MMCFPD cases, respectively. Figures 1.20 and 1.21 show the distribution of the associated Canadian employment over the time period 2012-2036. Compensation of employees in Canada is estimated to be $12.9 billion and $38.7 billion for the 500 MMCFPD and 1,500 MMCFPD cases, respectively.
Québec earns the largest share of GDP (54 percent), employment (69 percent), and employee
compensation (63 percent) since the drilling activity occurs in Québec. Alberta earns the second largest share of GDP (40 percent), employment (23 percent), and employee compensation (30 percent). The remaining proportion of each category is spread across the rest of the provinces.
Potential Impacts of Developing Québec’s Shale Gas 29
March 2013
Table 1.7: Economic Impacts of Utica Shale Development in Québec 500 MMCFPD Scenario, 2012-2036
*Government abroad
Source: CERI
Table 1.8: Economic Impacts of Utica Shale Development in Québec 1,500 MMCFPD Scenario, 2012-2036
*Government abroad
Source: CERI
Thousand
Person Years
GDP Compensation
of Employees
Employment
Alberta 15,162 3,861 69
British Columbia 321 163 4
Manitoba 74 35 1
New Brunswick 56 22 1
Newfoundland & Labrador 34 7 0
Northwest Territories 3 1 0
Nova Scotia 26 13 0
Nunavut 1 0 0
Ontario 1,226 652 16
Prince Edward Island 3 1 0
Quebec 20,378 8,136 202
Saskatchewan 54 23 1
Yukon Territory 1 0 0
Gabd* 0 0 0
Total Canada 37,338 12,914 293
Investments and Operations$CAD Million
Thousand
Person Years
GDP Compensation
of Employees
Employment
Alberta 45,478 11,582 206
British Columbia 962 488 13
Manitoba 223 106 3
New Brunswick 168 66 2
Newfoundland & Labrador 101 20 0
Northwest Territories 8 3 0
Nova Scotia 79 38 1
Nunavut 2 1 0
Ontario 3,678 1,956 47
Prince Edward Island 8 4 0
Quebec 61,128 24,406 607
Saskatchewan 163 68 2
Yukon Territory 2 1 0
Gabd* 0 0 0
Total Canada 111,999 38,739 880
Investments and Operations$CAD Million
30 Canadian Energy Research Institute
March 2013
Figure 1.20: Jobs (x 1,000) Created and Preserved in Canada as a Result of Utica Shale Development in Québec 500 MMCFPD Scenario, 2012-2036
Source: CERI
Figure 1.21: Jobs (x 1,000) Created and Preserved in Canada as a Result of Utica Shale Development in Québec 1,500 MMCFPD Scenario, 2012-2036
Source: CERI

Potential Impacts of Developing Québec’s Shale Gas 31
March 2013
Tables 1.9 and 1.10 summarize the estimated tax revenues for each province. Note that in this
format, federal, provincial and municipal taxes are shown together. Québec tax revenues are the largest among all provinces due to the drilling activity that will happen in the province. Alberta has the second largest tax revenues due to the corporate headquarters of many exploration companies being located in Alberta.
Table 1.9: Tax Receipts as a Result of Utica Shale Development in Québec, 2012-2036 500 MMCFPD
Source: CERI
Table 1.10: Tax Receipts as a Result of Utica Shale Development in Québec, 2012-2036 1,500 MMCFPD
Source: CERI
CAD Million Indirect Tax Personal Income Tax Corporate Tax Sum
Alberta 884 1,447 714 3,046
British Columbia 41 35 8 83
Manitoba 10 8 1 20
New Brunswick 7 6 1 14
Newfoundland & Labrador 3 2 1 6
Northwest Territories 0 0 0 0
Nova Scotia 4 3 1 8
Nunavut 0 0 0 0
Ontario 181 146 61 388
Prince Edward Island 0 0 0 1
Quebec 3,198 2,938 853 6,988
Saskatchewan 8 5 3 16
Yukon Territory 0 0 0 0
CAD Million Indirect Tax Personal Income Tax Corporate Tax Sum
Alberta 2,652 4,341 2,143 9,137
British Columbia 122 105 24 250
Manitoba 31 24 4 60
New Brunswick 21 18 4 43
Newfoundland & Labrador 8 7 3 19
Northwest Territories 1 0 0 1
Nova Scotia 12 10 2 24
Nunavut 0 0 0 0
Ontario 543 439 182 1,164
Prince Edward Island 1 1 0 2
Quebec 9,592 8,812 2,559 20,963
Saskatchewan 24 15 9 48
Yukon Territory 0 0 0 0