lyons presentation ceri 2015 petrochemical conference
DESCRIPTION
Ceri Presentation 2015 Petrochemical confTRANSCRIPT

2015 Calgary upstream CFO survey
June 2015
Final report

We live in challenging times
We undertook this study to gain a deeper understanding of the perspectives of upstream oil and gas Chief Financial Officers (CFOs) on several topics, specifically:
• The trajectory of oil prices and implications on their strategy
• Actions to sustain performance in the current environment
• Actions to position for market recovery
• Priorities for the business and finance team during the next 3–12 months
We conducted individual interviews with each CFO between March 30, 2015 and April 30, 2015.
The first quarter of 2015 will look atrocious, because the oil shock is a big deal for us. Governor of the Bank of Canada, March 30, 2015
Darwinian oil patch will result in future damage of scarcer supply.Peter Tertzakian, ARC Financial, March 11, 2015
Amid the gloom and cut backs in industry, the strong will get stronger.The Economist, January 24, 2015
44.88WTI USD/bbl 3/13/2015
104.26WTI USD/bbl5/29/2014
WTI pricing per www.eia.gov
© Deloitte LLP and affiliated entities. | 2015 Calgary upstream CFO survey – Final report 2

Study overview
Participant profile• The aggregate production of respondents accounts for over
30% of Canada’s total 2014 production of oil and gas• Both public and private companies are represented • Participants have domestic and foreign assets • Producers have conventional and unconventional oil, gas
and NGLs with the commodity mix varying from over 65% oil, balanced production, to over 65% gas
• Daily production from 25,000 boe/day to 500,000 boe/day, including some of Canada’s Top 10 producers
• Range of net debt vs projected cash flows ranged from less than 2.0 to over 4.5
Respondents’ % of Canada’s overall production (2014)
* Projected 2015 cashflows were used as conditions that presently prevail and were only manifested in the latter stages of calendar 2014.
>2.1million
Number of participants (CFOs) interviewed individually
Combined boe/day production of participants
18
5 respondents> 150,000 bbl/day
6 respondents50,000 -150,000 bbl/day
7 respondents 25,000 – 50,000 bbl/day
7 respondents>65% oil production
6 respondents Balanced oil and gas production
5 respondents>65% gas production
Range of commodity mixes of respondents
Range of daily production of respondents
Participant range of net debt vs projected cahflows*
<2.0 2.0-4.5 >4.5
>30%
© Deloitte LLP and affiliated entities. | 2015 Calgary upstream CFO survey – Final report 3
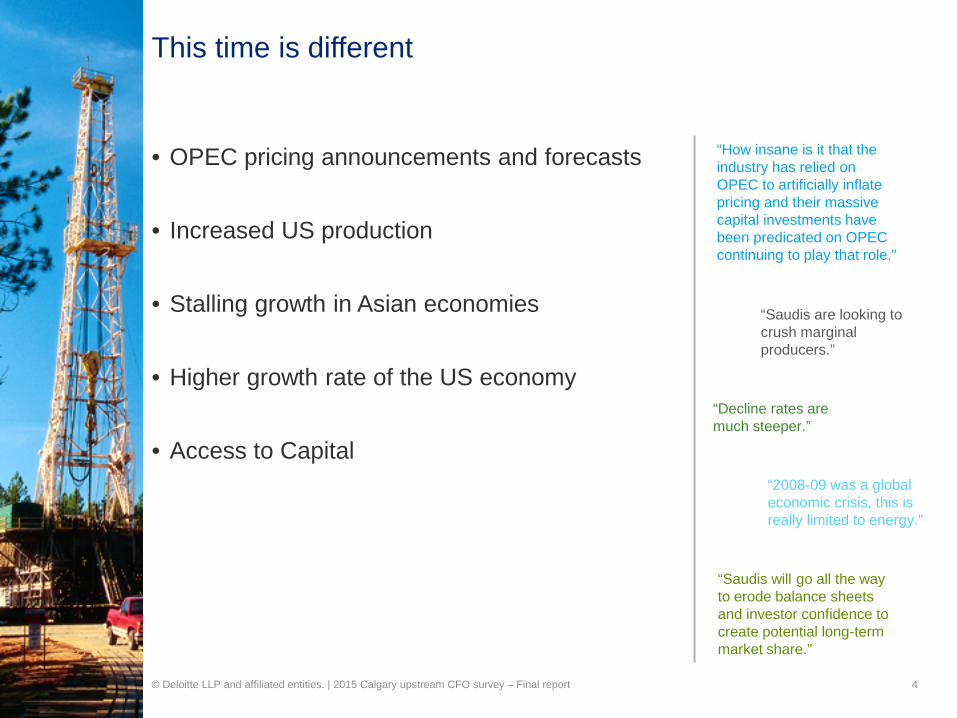
This time is different
• OPEC pricing announcements and forecasts
• Increased US production
• Stalling growth in Asian economies
• Higher growth rate of the US economy
• Access to Capital“2008-09 was a global economic crisis, this is really limited to energy.”
“How insane is it that the industry has relied on OPEC to artificially inflate pricing and their massive capital investments have been predicated on OPEC continuing to play that role.”
“Saudis will go all the way to erode balance sheets and investor confidence to create potential long-term market share.”
“Decline rates are much steeper.”
“Saudis are looking to crush marginal producers.”
© Deloitte LLP and affiliated entities. | 2015 Calgary upstream CFO survey – Final report 4

© Deloitte LLP and affiliated entities. | 2015 Calgary upstream CFO survey – Final report 5
The risk profile of the WCSB has changed
• Structural shift away from natural gas drilling
• Full cycle dry gas has been uneconomic in Canada for several years – no indication that this will change
• Liquids rich strategies can work but are challenged by infrastructure constraints and depressed gas prices
− station 2 pricing in NEBC at significant discount
• Remain cautious on gas due to LNG uncertainty and mountain of gas in the Marcellus
• The average cost per well drilled in the WCSB has risen dramatically as:
– new technologies are implemented (multi-stage fracturing)
– deeper, more technically difficult reservoirs are targeted (i.e. Duvernay)
• Risk for new entities has shifted from exploration to development
• Balance sheets need to adjust accordingly – hence larger initial capital raises
• Undercapitalization remains a risk

• Recovery of WTI prices to US $70-80/bb
• Longer than 12 months
• Many also commented on factors that have softened theimpact of the price decline:– The weakening of the CAD vs the USD – Hedging positions for the remainder of 2015
USD WTI
CAD WTI
28%
72%
© Deloitte LLP and affiliated entities. | 2015 Calgary upstream CFO survey – Final report 6
The outlook for WTI?
CAD and USD WTI prices (FX rates per Bank of Canada)S
Which of the following describes your outlook of when WTI prices will return to US $70 – 80/bbl?
*from May, 2015
Weakening FX rate resulting in favourable CAD WTI
WTI pricing per www.eia.gov
>12 Months
<12 Months
June 2013CAD WTI – $96USD WTI – $93
April 2015CAD WTI – $72USD WTI – $60
Interview Period
© Deloitte LLP and affiliated entities. | 2015 Calgary upstream CFO survey – Final report 7
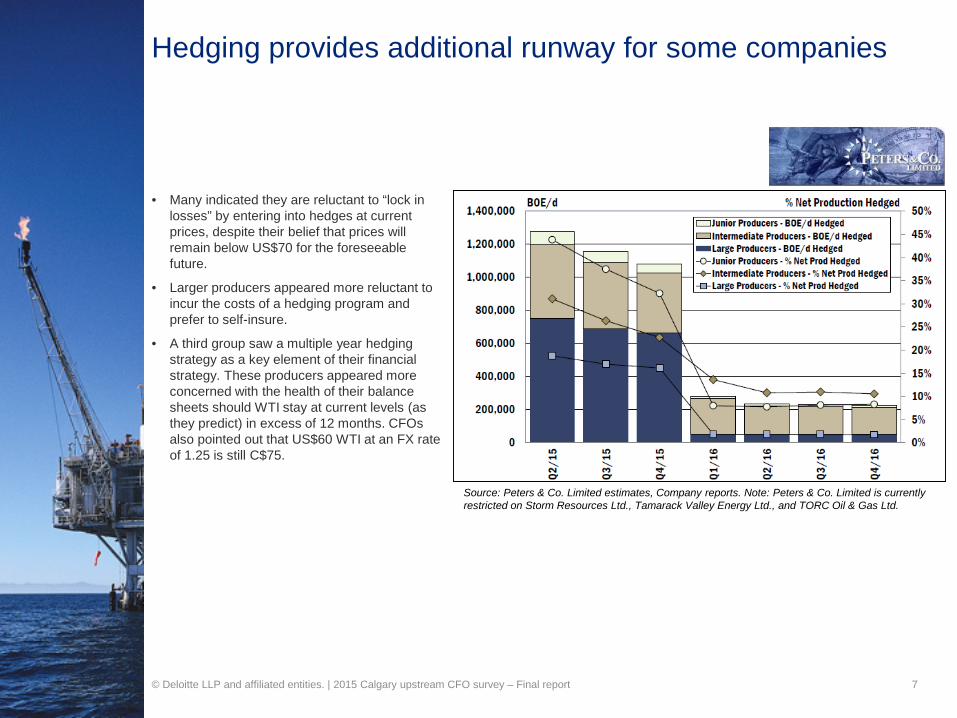
• Many indicated they are reluctant to “lock in losses” by entering into hedges at current prices, despite their belief that prices will remain below US$70 for the foreseeable future.
• Larger producers appeared more reluctant to incur the costs of a hedging program and prefer to self-insure.
• A third group saw a multiple year hedging strategy as a key element of their financial strategy. These producers appeared more concerned with the health of their balance sheets should WTI stay at current levels (as they predict) in excess of 12 months. CFOs also pointed out that US$60 WTI at an FX rate of 1.25 is still C$75.
Hedging provides additional runway for some companies
Source: Peters & Co. Limited estimates, Company reports. Note: Peters & Co. Limited is currently restricted on Storm Resources Ltd., Tamarack Valley Energy Ltd., and TORC Oil & Gas Ltd.

© Deloitte LLP and affiliated entities. | 2015 Calgary upstream CFO survey – Final report 8
CFOs described the current situation as both a challenge and an opportunity, pointing out that those who can effectively handle the volatility will likely be rewarded with the chance to acquire assets at compelling valuations and emerge as stronger companies moving forward.
Challenge or opportunity?
Helps us to be more nimble; forces us to correct.
Proportion of participants (CFOs) identifying current conditions as an opportunity or challenge
As long as you have the balance sheet, this is an opportunity.
This is a reset on capital allocation in the industry –cost structure needs to change.
Because of our debt level, it is a problem; if we can manage it, it will turn into an opportunity.

© Deloitte LLP and affiliated entities. | 2015 Calgary upstream CFO survey – Final report 9
Proportion of participants (CFOs) considering or applying the following strategies to manage current and potential future prices
Actions to sustain performance in the current environment
CASH FLOW MANAGEMENT
Industry-wide, increasing cost efficiency is a focus. CFOs whose companies are smaller and in weaker financial positions were more likely to identify this as a priority.
IMPROVING THE BALANCE SHEET
Debt reduction and managing lenders expectations were consistent themes.
MANAGING CAPITAL
Growth capital has largely been deferred, with sustaining capital reduced as well in some cases. Despite having cut dividends, many are adopting a wait-and-see approach – noting additional cuts may be required.
M&A
Most indicated that the current market is challenging – buyers believe assets are overvalued while sellers want to avoid selling at low valuations.
REDUCING COSTS
DEFER SPEND
STRATEGIC ACQUISITIONS
DIVESTITURES TO MONETIZE ASSETS
CUT DIVIDEND
SHORT-TERM CASH FLOW
ALTERED PLANS TO ACCESS FINANCING
DEBT MANAGEMENT

© Deloitte LLP and affiliated entities. | 2015 Calgary upstream CFO survey – Final report 10
Cash flow managementActions to sustain performance in the current environment
67%8%
17%
8%
Achieved 10% reductionAchieved 15% reductionAchieved 20% reductionAchieved 40% reduction
Percentage cost reduction achieved by CFOs, shown proportionally• Reducing contractor and employee headcount.
• Seeking cost reductions from suppliers. Most indicated that achieving approximately 10% reduction is realistic.
• Improving management of receivables from JV partners while being strategic in vendor payments and realizing discounts for early payment.
© Deloitte LLP and affiliated entities. | 2015 Calgary upstream CFO survey – Final report 11
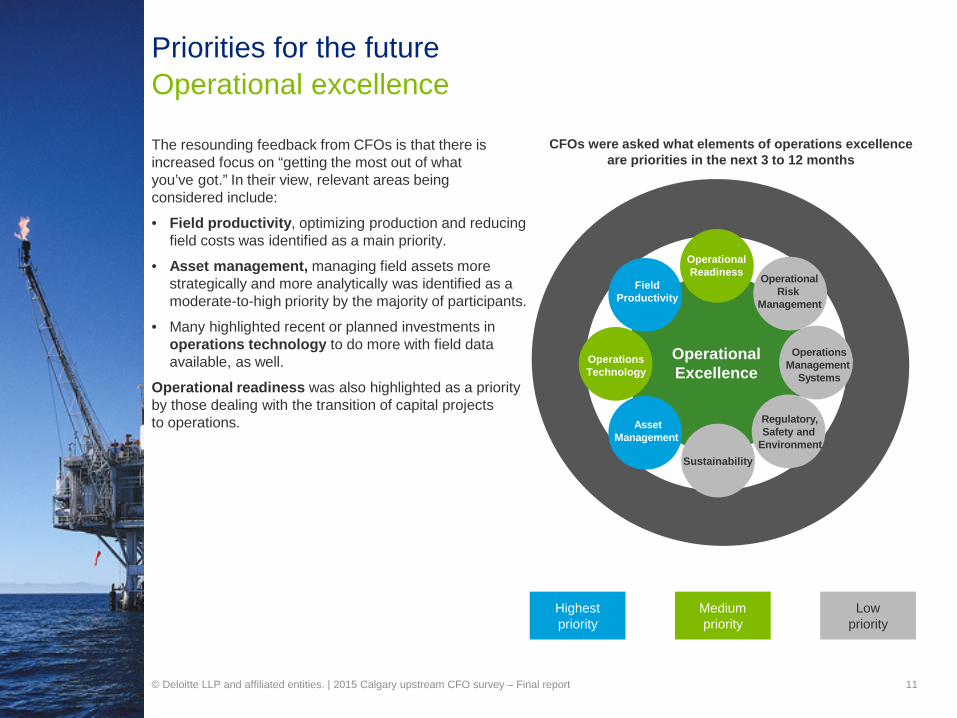
Operational excellencePriorities for the future
The resounding feedback from CFOs is that there is increased focus on “getting the most out of what you’ve got.” In their view, relevant areas being considered include:
• Field productivity, optimizing production and reducing field costs was identified as a main priority.
• Asset management, managing field assets more strategically and more analytically was identified as a moderate-to-high priority by the majority of participants.
• Many highlighted recent or planned investments in operations technology to do more with field data available, as well.
Operational readiness was also highlighted as a priority by those dealing with the transition of capital projects to operations.
Operational Excellence
OperationalRisk
Management
Operations Management
Systems
Regulatory, Safety and
EnvironmentSustainability
Asset Management
Operations Technology
Field Productivity
Operational Readiness
CFOs were asked what elements of operations excellence are priorities in the next 3 to 12 months
Highest priority
Medium priority
Low priority

© Deloitte LLP and affiliated entities. | 2015 Calgary upstream CFO survey – Final report 12
Global breakeven prices

© Deloitte LLP and affiliated entities. | 2015 Calgary upstream CFO survey – Final report 13
Global oil and bitumen production will reduce as a result of cancelled projects

© Deloitte LLP and affiliated entities. | 2015 Calgary upstream CFO survey – Final report 14
Capital cutsActions to sustain performance in the current environment
Yes (67%) No (33%)No cut 1-20% 20-40% >40%
*Some participants have made further cuts as part of their Q1 releases, not captured in the above chart
• Some degree of reduction in capital spending was noted by almost all participants
• Growth capital was the first to be cut
• CFOs far less likely to reduce sustaining capital for fear of negatively impacting longer term cash flows
Proportion of participants (CFOs) who had completed all planned capital cuts
% cut to capital spending completed*
© Deloitte LLP and affiliated entities. | 2015 Calgary upstream CFO survey – Final report 15
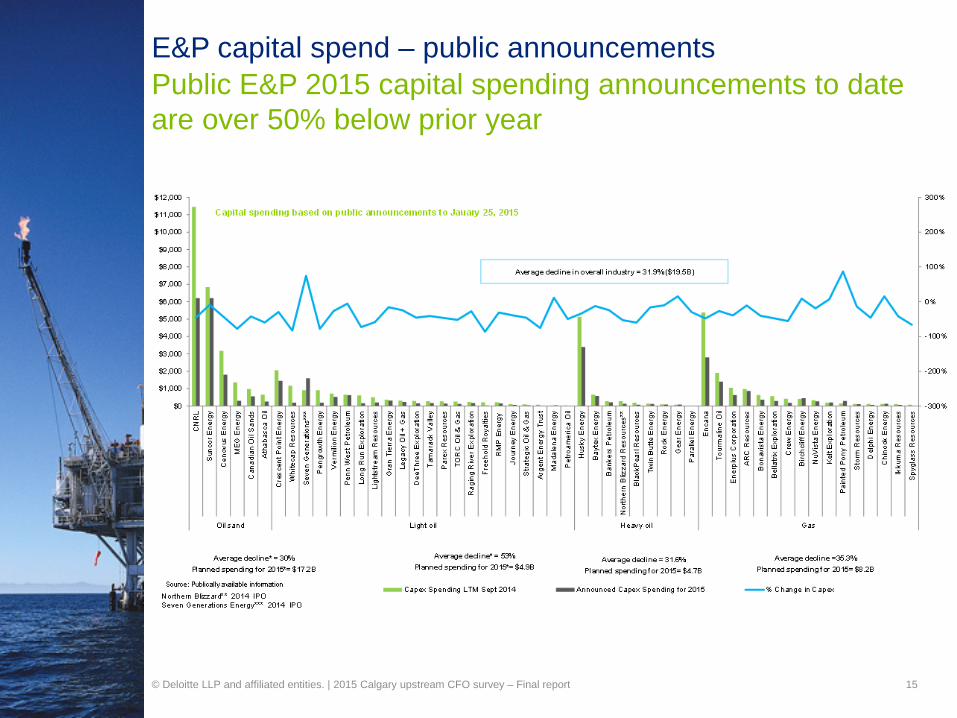
Public E&P 2015 capital spending announcements to date are over 50% below prior year
E&P capital spend – public announcements
© Deloitte LLP and affiliated entities. | 2015 Calgary upstream CFO survey – Final report 16
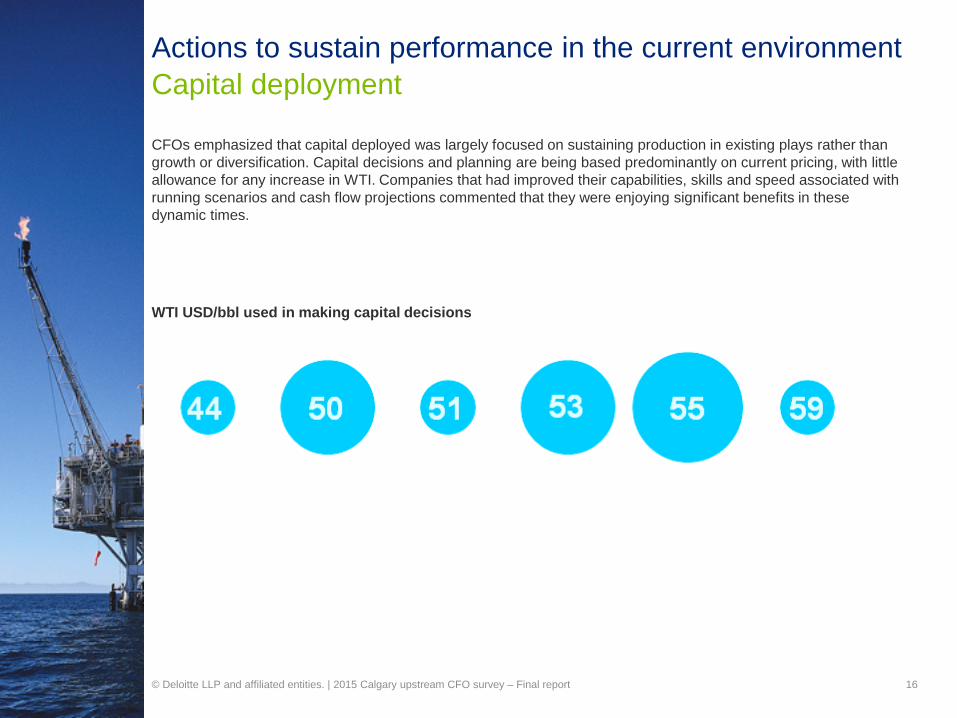
Capital deploymentActions to sustain performance in the current environment
CFOs emphasized that capital deployed was largely focused on sustaining production in existing plays rather than growth or diversification. Capital decisions and planning are being based predominantly on current pricing, with little allowance for any increase in WTI. Companies that had improved their capabilities, skills and speed associated with running scenarios and cash flow projections commented that they were enjoying significant benefits in these dynamic times.
WTI USD/bbl used in making capital decisions
© Deloitte LLP and affiliated entities. | 2015 Calgary upstream CFO survey – Final report 17
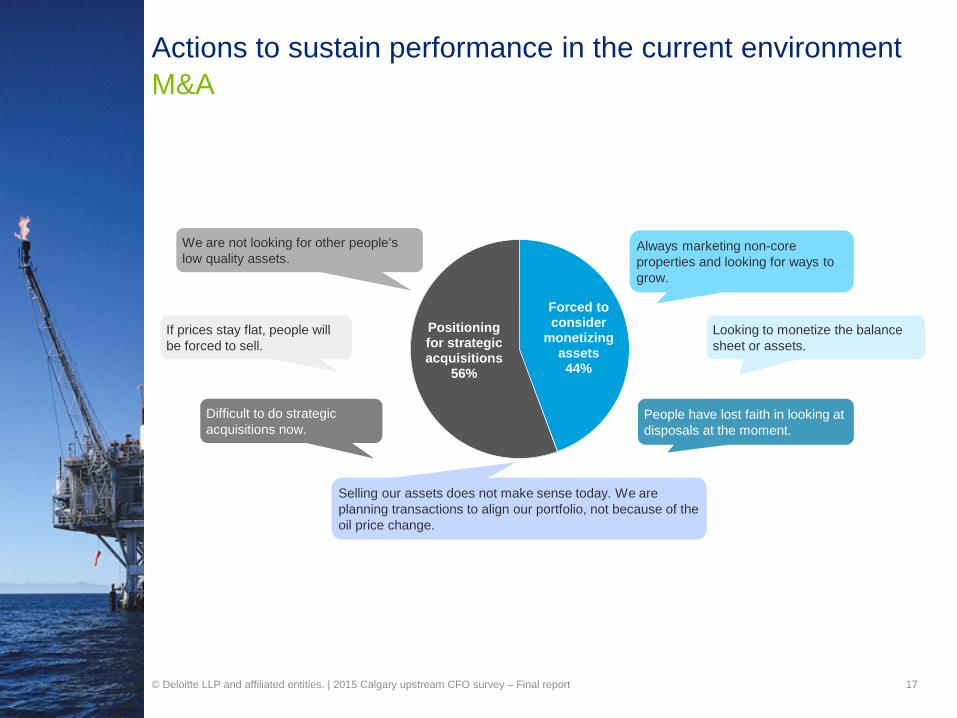
M&AActions to sustain performance in the current environment
Forced to consider
monetizing assets44%
Positioning for strategic acquisitions
56%
Always marketing non-core properties and looking for ways to grow.
We are not looking for other people’s low quality assets.
Difficult to do strategic acquisitions now.
If prices stay flat, people will be forced to sell.
People have lost faith in looking at disposals at the moment.
Looking to monetize the balance sheet or assets.
Selling our assets does not make sense today. We are planning transactions to align our portfolio, not because of the oil price change.

© Deloitte LLP and affiliated entities. | 2015 Calgary upstream CFO survey – Final report 18
Recent trends: Deals and intelligenceGlobal M&A activity: Since 1st Dec 2014
Asset Vs. Corporate• There is an increase in M&A Activity involving both assets and
corporate or JV or licensing instances since January. There was a drop in M&A activity in January corresponding to the bottoming of oil price
• The total value of M&A related deals or interests shown by companies has shown mixed results. Activities involving assets increased gradually since January. However, value of M&A intelligence involving corporate takeovers, Joint Ventures or Licensing decreased in February before rising sharply in April (reflecting Shell-BG deal of US$ 70 bn)
M&A Activity in top 10 Countries• USA tops the list with maximum number of M&A related
intelligence and deals in past 20 weeks followed by Canada, UK and Australia
• In terms of total value of such M&A intelligence and deals, UK is significantly higher compared to other nations. This includes the US$ 70 bn deal between Shell and BG
General observations:• M&A activity picked up towards the end of Q1 2015
as oil prices moved upwards and stabilizedaround US$ 50.
• North America dominates the number of deals as well as value from 2013-2015 YTD including in recent weeks, except for the anomalous US$ 70 bn takeover bid of BG by Shell in Europe.
• Last 15 days in April recorded maximum number of M&A activities in Q1 2015 with 68 instances.
050
100150200250300
US
A
Can
ada
UK
Aus
tralia
Rus
sia
Mex
ico
Indi
a
Bra
zil
Arg
entin
a
Chi
na
M& Activity in top 10 countries
Count of Deals Value Sum US$ bn
M&A activity trend by asset vs Corporate/JV/Licensing M&A activity in top 10 countries
-
20.0
40.0
60.0
80.0
0
20
40
60
80
100
Dec Jan Feb Mar Apr
US$
bn
Cou
nt
Asset Vs Corporate/JV/Licensing M&A Activity
Asset Count Corporate, JV, Licensing
Asset Value Corporate, JV, Licensing

© Deloitte LLP and affiliated entities. | 2015 Calgary upstream CFO survey – Final report 19
M&A and managing uncertaintyDeloitte perspective
0
20
40
60
80
100
120
-
5,000
10,000
15,000
20,000
25,000
Q1 10Q2 10Q3 10Q4 10Q1 11Q2 11Q3 11Q4 11Q1 12Q2 12Q3 12Q4 12Q1 13Q2 13Q3 13Q4 13Q1 14Q2 14Q3 14Q4 14 Q115
Vol
ume
of d
eals
Dea
l val
ue ($
MM
)
Upstream M&A activity in Canada
Total disclosed deal value Number of announced deals Number of announced deals with disclosed valuesNote: Shaded green represents Talisman dealSource: Cap IQ announced deal, quoted in USD
Closing
© Deloitte LLP and affiliated entities. | 2015 Calgary upstream CFO survey – Final report 20
• Longer than 12 months
• Both a challenge and an opportunity
• Preserve cash flow through reducing dividends, deferring capital, reducing staff and pressing suppliers for discounts
• Will have long-term benefits for the industry. Increased competitiveness, greater productivity and improved quality of the workforce
• Asset management, field productivity and operations technology

www.deloitte.ca
Deloitte, one of Canada's leading professional services firms, provides audit, tax, consulting, and financial advisory services. Deloitte LLP, an Ontario limited liability partnership, is the Canadian member firm of Deloitte Touche Tohmatsu Limited.
Deloitte refers to one or more of Deloitte Touche Tohmatsu Limited, a U.K. private company limited by guarantee, and its network of member firms, each of which is a legally separate and independent entity. Please see www.deloitte.com/about for a detailed description of the legal structure of Deloitte Touche Tohmatsu Limited and its member firms.
© Deloitte LLP and affiliated entities. 21