study no. 172 july 2018 - ceri
TRANSCRIPT
CANADIAN ENERGY RESEARCH INSTITUTE
COMPETITIVE ANALYSIS OF
CANADIAN LNG
Study No. 172 July 2018
Canadian Energy Research Institute | Relevant • Independent • Objective
Competitive Analysis of Canadian LNG i
July 2018
Executive Summary Global natural gas consumption is positioned to grow by 45% over the next 25 years. Developing countries in Asia, Africa, Latin America, and the Middle East account for 80% of the increase in global consumption (IEA 2017).
In 2016, total global natural gas pipeline trade was 737.5 bcm while liquefied natural gas (LNG) trade was 346.6 bcm (BP 2017b). LNG accounts for 32 percent of globally traded gas and this number is expected to increase (IEA 2017). According to BP, global LNG is growing seven times faster than pipeline gas trade, and by 2035, half of all globally traded gas will be LNG (BP 2017b).
With 140 bcm of LNG capacity under construction, gas markets remain well supplied for the next
few years (IEA 2017). By the mid-2020s, however, market over-capacity is absorbed by import growth. Investment in the new capacity, therefore, is needed from 2020 onwards to satisfy growing needs (IEA 2017).
The recent plunge of oil and LNG prices have deterred many projects from taking final investment decisions (FID). As the price of oil rebounded to $75,1 LNG spot prices followed ($8.20 in northeast Asia at the time of writing), and project sponsors are going back to the table to review their economics and to meet customers.
Canada has world-scale proven and low-cost natural gas reserves sufficient for domestic demand and export. It also has 15+ projects proposed on the East and West coasts, four of which have received export licenses and environmental approvals and are close to FID (in addition to the 0.3
bcf/d Woodfibre LNG, which has already taken FID).
Will Canada play a role in satisfying natural gas demand globally and join the cohort of 18 export countries? The US predicts that its natural gas net imports from Canada will drop to almost zero by 2040 from its current 5.9 bcf/d (EIA 2018). As such, Canada must either position itself for the decline in natural gas production and associated economic benefits or consider growth through LNG exports.
Canada is not the only country blessed with natural gas resources. Qatar, the US, Russia, Australia, Malaysia, Nigeria, Iran, Algeria, and Mozambique all have vast gas resources. Many of these counties have already monetized them in the form of LNG, gaining valuable experience and lowering the risks for further investments. The top 5 exporters are Qatar, accounting for nearly 30 percent, followed by Australia, Malaysia, Nigeria, and Indonesia (IGU 2017). Australia and the
US have recently stood out as the former will reach 85.4 mtpa in 2019 (APPEA 2018) taking a leading position in the market (IGU 2017), and the latter will have an export capacity of 73 mtpa by 2020 (EIA 2017a) almost reaching the same volumes as the current market leader – Qatar. In the US and other countries, there are more projects under regulatory and investment review.
1 All prices are in 2018 $US unless otherwise specified.

ii Canadian Energy Research Institute
July 2018
Qatar has also recently announced its intention to increase its volumes to 100 mtpa (OGJ 2017)
from its existing 77 mtpa.
Thus, investors, particularly global energy companies, have choices. The fact that Canada does not have LNG project experience puts it at a comparative disadvantage to existing producing countries which may have options for lucrative liquefaction capacity expansion or new projects leveraging infrastructure and experience.
It means Canada needs compelling arguments for investors to choose it over other options. For the Canadian projects on the east and west coasts to move forward, the projects should be cost-competitive with international options. LNG landed costs also should be consistently lower than the expected prices at the destination markets to earn a return for investors. And finally, Canada’s jurisdictions need to be attractive and stable to do long-term business, such as LNG
liquefaction and exports.
The change in the pricing environment also needs to be taken into account. The price volatility of the oil market is a major uncertainty for long-term oil-linked contracts on which most financing and economics of LNG projects depend. The situation is challenging for investors as the percentage of the Brent price LNG sellers are realizing where contracts tied to oil prices have been declining from 14.5% to 11.5% as of late.2 Thus, for investors to take an FID, the projects need to have solid and profitable economics under current and prudent pricing forecasts.
In this study, CERI explores questions and compares Canada’s projects in two jurisdictions (British Columbia and Nova Scotia) with counterparts in the US Gulf of Mexico (Texas and Louisiana) and Australia.3 Supplies from other competitors – Russia, Mozambique, Nigeria and Qatar – were not
included in the scope of this study. Approximately 45 mtpa are anticipated by proponents in countries other than the US and Australia that could come onstream after 2021 (LNG Journal 2018).
Our results show that Canadian supply costs (hereinafter supply costs do not include transportation costs, while landed costs do) for Eastern and Western LNG are from $8.09-$8.35 per mmbtu for the integrated model, when natural gas is produced by LNG facility owners, to $9.85-$11.17 for the merchant business model, when natural gas is bought on the market (Figure E.1). For Eastern Canada, the integrated model implies the development of onshore local shale gas in Nova Scotia, which is currently under a provincial hydraulic fracturing ban. New Brunswick’s shale gas could also be a source of natural gas but it is not considered in the study.
For integrated projects, Eastern Canada projects hold a slight advantage of $0.36 over Western
Canada, primarily due to advantages in lower capital and transportation costs as the gas resource
2 An oil-linked LNG price is specified in a long-term LNG Sale and Purchase Agreement using a generic formula: percent of Brent price on the market + constant dollar amount. The price of Brent is used at the time of a particular LNG sale (and not fixed during signing of the contract). The constant has recently been reduced to zero dollars for many contracts from around $0.5 in previous years. 3 Note: all costs are shown in 2018 $US per mmbtu unless otherwise specified.

Competitive Analysis of Canadian LNG iii
July 2018
is adjacent. British Columbia’s project, on the other hand, edges Nova Scotia’s on natural gas cost
by $0.93.
For the merchant model (when both Eastern and Western projects are supplied from Alberta), the Western Canada LNG gains a $1.32 cost advantage over their Eastern counterpart due to its proximity to the AECO-C hub. This location advantage translates into cheaper gas transportation by almost $2, while capital costs are better by $0.65 in the east. If natural gas is sourced from Marcellus for the Eastern project, British Columbia’s LNG plant maintains its feedstock advantage but it is reduced to $1.1 (the Marcellus gas-sourced project is $10.95 per mmbtu).
Figure E.1: LNG Supply Costs Comparison in Canada ($US/mmbtu)
The study has found that without additional efforts to decrease supply costs both from business and governments, Western Canada and Eastern Canada LNG landed costs (supply cost with shipping cost) are higher than the current spot price in Japan by $0.80 at the time of writing (May 2018). At the same time, the landed cost is below the historical average of $9.2.
Also, Western Canada LNG projects will need an oil price of approximately $80 or higher over the life of the project to break-even under long-term LNG contracts (11.5% of Brent is used as the benchmark for all project economics) or $8.99 per mmbtu on the spot market.
As well, the study has found that Eastern Canada and Western Canada LNG landed costs are higher than the current spot price in the UK. The difference between Western Canada LNG and the UK spot price is $2.5 per mmbtu, while for Eastern Canada LNG with Marcellus and AECO-
sourced gas the difference is $4 to $4.2, respectively. The closest landed cost to the UK market price is locally-sourced shale gas in Nova Scotia where the cost difference is $1.1.
Eastern Canada LNG projects will need an oil price of approximately $100 over the life of the project to break-even under long-term LNG contracts, or $11.6-$11.4 per mmbtu or higher at European markets (the historical average for the last ten years in the UK is $6.3).
-
1.0
2.0
3.0
4.0
5.0
6.0
7.0
8.0
9.0
10.0
11.0
12.0
13.0
Western Canada, BC,Montney
Eastern Canada, NS,Horton Bluff Shale
Western Canada, BC,AECO-C
Eastern Canada, NS,AECO-C
LNG supply costs comparison, Canada, US $ per mmbtu
Captial cost Feed Gas cost Pipeline Transportation cost Operating cost Corporate taxes LNG Income tax Carbon tax
Integrated business model Merchant business model
$8.35$8.09
$9.85$11.17
iv Canadian Energy Research Institute
July 2018
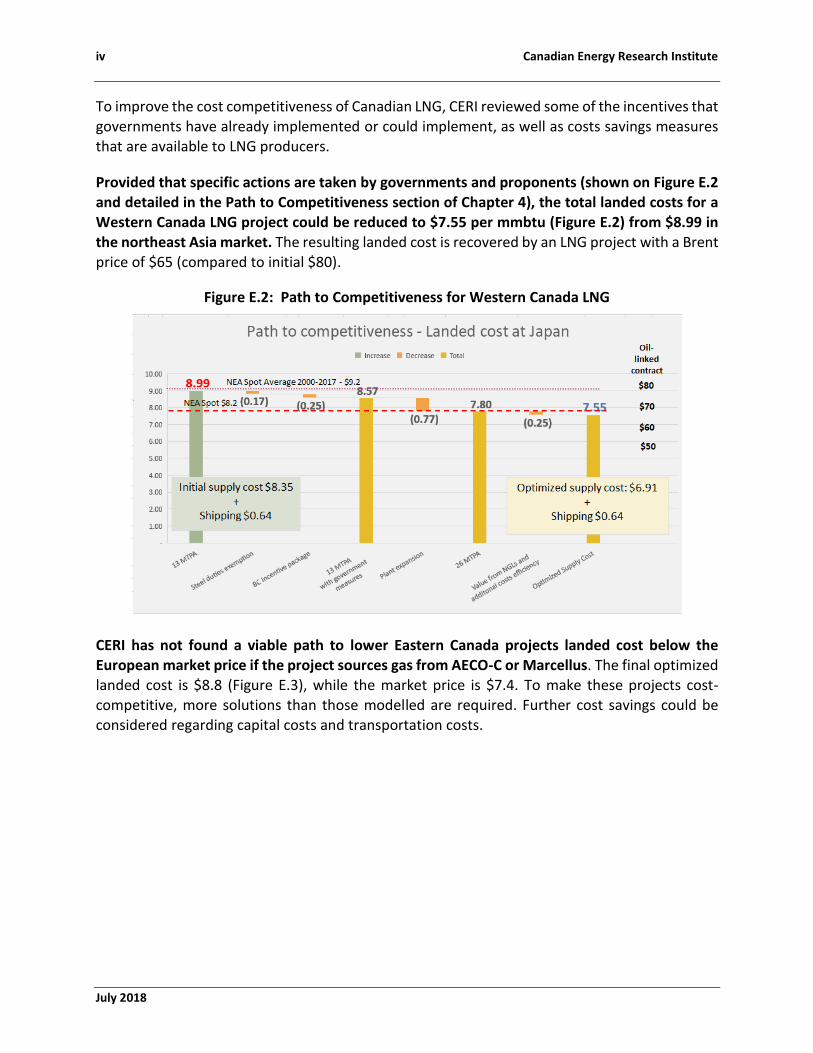
To improve the cost competitiveness of Canadian LNG, CERI reviewed some of the incentives that
governments have already implemented or could implement, as well as costs savings measures that are available to LNG producers.
Provided that specific actions are taken by governments and proponents (shown on Figure E.2 and detailed in the Path to Competitiveness section of Chapter 4), the total landed costs for a Western Canada LNG project could be reduced to $7.55 per mmbtu (Figure E.2) from $8.99 in the northeast Asia market. The resulting landed cost is recovered by an LNG project with a Brent price of $65 (compared to initial $80).
Figure E.2: Path to Competitiveness for Western Canada LNG
CERI has not found a viable path to lower Eastern Canada projects landed cost below the European market price if the project sources gas from AECO-C or Marcellus. The final optimized landed cost is $8.8 (Figure E.3), while the market price is $7.4. To make these projects cost-competitive, more solutions than those modelled are required. Further cost savings could be considered regarding capital costs and transportation costs.

Competitive Analysis of Canadian LNG v
July 2018
Figure E.3: Path to Competitiveness for Eastern Canada LNG
At the same time, if local shale gas was available in Nova Scotia, the optimized cost for such a case reduces the landed costs from $8.5 to $7.35, making such an option viable under current spot prices.
Western Canada LNG has an overall landed cost advantage in the Asia market compared to US Gulf of Mexico (GoM) projects by $1.7 per mmbtu (US greenfield), and by $0.3 (US brownfield).
If supply costs of Canadian LNG are optimized, the difference with US greenfield grows to $3.1 per mmbtu, and to $1.8 per mmbtu compared with US brownfield.
At the same time, US GoM projects hold an advantage over Marcellus-sourced gas for Eastern Canada LNG in the European market by $1.5 (US greenfield), and by $2.9 (US brownfield). If supply costs of Canadian LNG are optimized, Eastern Canada LNG edges a US greenfield project by 1 dollar but loses to a US brownfield by 40 cents.
British Columbia appears to be more competitive than Nova Scotia globally. British Columbia has more incentives and lower corporate taxes than Nova Scotia (26%4 versus 31%). Also, the Asian LNG market is better priced than European gas markets (10-year historical average is $9.2 versus $6.3 per mmbtu). The cost of Montney gas and transportation to a BC facility is half
compared to the case when an Eastern Canada project sources gas from AECO-C or Marcellus.
The jurisdictional comparison is presented in Table E.1 (non-optimized supply costs for Canadian LNG are used). The two lowest cost per major project element is presented in green.
4 27% beginning January 2018 as British Columbia has increased its corporate tax rate from 11% to 12%

vi Canadian Energy Research Institute
July 2018
Table E.1: Jurisdictional Comparison of Non-Optimized LNG Supply Costs ($ per mmbtu)
* A 25.8% yield produces an almost identical result as a 100% allowance if ring-fencing is not removed; if ring-fencing is removed, the capital allowance rate of US GoM becomes superior compared to Canada. See additional federal incentives in the Path to Competitiveness section of Chapter 4 for more detail. ** These costs represent operating costs of transportation only, unlike other jurisdictions. *** Natural gas transportation costs are only shown in absolute dollar amounts as for some cases they represent only operating transmission costs (because a pipeline is part of the LNG project), while in other cases they represent full gas transportation costs (toll).
The US also appeared as a more cost-effective jurisdiction than either of Canada’s provinces, if natural gas costs are not considered. Total liquefaction costs (all costs except for natural gas) are lower by $0.7-$0.8 for the GoM compared to Western Canada, and by a substantial $2.8-$3.0 compared to Eastern Canada. Thus, the costs of doing LNG business is 13-41% lower per mmbtu in the GoM than in Western or Eastern Canada inducing further work of business and governments to reduce the deficiency in cost-competitiveness.
The recent change in corporate taxes in the US gave a boost to the US industry. The corporate
tax share per mmbtu of LNG has decreased by almost 60% (or $0.44-$0.52 per mmbtu). Canadian incentives to the LNG industry are estimated to equal around 51 cents per mmbtu (includes increased capital cost allowances, the BC government Natural Gas Development Framework and the Natural Gas Tax Credit). Still, even with these measures, US greenfield projects have 27.5% lower taxes per mmbtu than for a large 26 mtpa project in Canada after all modelled Canadian incentives are applied. This leaves room for further improvement of the tax regime
Western Canada Eastern Canada AECO-C/Local
Gas
US GoM (greenfield)
Australia
Supply Cost (non-optimized)
$8.35 $11.17 / $8.09 $9.07 $13.06
Natural Gas Cost $2.51 +47% / +37% +80% +92%
Capital Cost/tpa +23% $2.77 / +12% +3% +102%
Operating Cost $0.69 $0.69 +33% +96%
Natural Gas Transportation Cost***
$0.96 $3.33 / $0.07** $0.42 0.14**
Shipping to Europe +270% $0.42 +79% +338%
Shipping to Asia +9% +201% +181% $0.58
Tax Burden +112% +96% / +118% $0.37 +228%
Capital Allowances 25.8%* 25.8%* 100% 13.3%

Competitive Analysis of Canadian LNG vii
July 2018
competitiveness in Canada, for instance exempting projects from ring-fencing and further
increasing capital tax allowance.
As mentioned above, Canada has a number of active LNG projects which are expected to make FID soon. So far, Canada has seen a number of projects cancelled rather than move forward, while other jurisdictions are building out capacity. The study shows that Canadian integrated projects on both coasts, with additional incentives of government and certain cost-savings, are not only competitive and can outperform not only US greenfield and brownfield projects, but also can reach destination market price levels in Europe and Asia.