spr-585: snowplow simulator training evaluation
TRANSCRIPT

SNOWPLOW SIMULATOR TRAINING EVALUATION Final Report 585
Prepared by: Mary Kihl, Ph.D. Donald Herring Peter Wolf Stephanie McVey Vamshee Kovuru College of Design Arizona State University Tempe, AZ 85287-2005
November 2006 Prepared for: Arizona Department of Transportation 206 South 17th Avenue Phoenix, Arizona 85007
In cooperation with US Department of Transportation Federal Highway Administration

The contents of this report reflect the views of the authors who are responsible for the facts and the accuracy of the data presented herein. The contents do not necessarily reflect the official views or policies of the Arizona Department of Transportation or the Federal Highway Administration. This report does not constitute a standard, specification, or regulation. Trade or manufacturers' names which may appear herein are cited only because they are considered essential to the objectives of the report. The U.S. Government and the State of Arizona do not endorse products or manufacturers. ATRC reports are available on the Arizona Department of Transportation’s Internet site.

Technical Report Documentation Page
1. Report No. FHWA-AZ-06-585
2. Government Accession No. 3. Recipient's Catalog No.
4. Title and Subtitle Snowplow Simulator Training Evaluation
5. Report Date November 2006
6. Performing Organization Code
7. Author Mary Kihl, PhD w/ Donald Herring, Peter Wolf, Stephanie McVey and Vamshee Kovuru
8. Performing Organization Report No.
10. Work Unit No.
9. Performing Organization Name and Address Arizona State University School of Planning College of Architecture and Environmental Design Tempe, AZ 85287-2005
11. Contract or Grant No. R0585 17P / JPA 05-010T
SPR-PL-1(67) -585 12. Sponsoring Agency Name and Address
ARIZONA DEPARTMENT OF TRANSPORTATION 206 S. 17th Avenue, Phoenix, Arizona 85007
ADOT Project Manager: Stephen R. Owen, P.E.
13.Type of Report & Period Covered FINAL REPORT- November 2004 to November 2006
14. Sponsoring Agency Code
15. Supplementary Notes Prepared in cooperation with the U.S. Department of Transportation, Federal Highway Administration
16. Abstract – Snowplow drivers must operate $200,000 units of equipment in blinding snowstorms and demanding traffic conditions. Yet traditional training for new drivers, with limited funding and staff, may be only two or three storm shifts with a partner-trainer. For this level of responsibility, training needs to be enhanced, to improve driver safety and reduce risk.
The Arizona Department of Transportation (ADOT) outsourced simulator training for snowplow operators in rural Arizona in late 2004. A mobile simulator classroom visited five ADOT districts: Globe, Flagstaff, Holbrook, Kingman, and Safford, to deliver a half-day introductory course with both classroom and simulator training segments. This Year One (2004-05 winter) trainee group included 149 snowplow drivers. In Winter Two (2005-06), more in-depth training was given on a dedicated driving simulator unit, purchased for ADOT’s Globe Maintenance District. All 61 of Globe’s snowplow drivers took two courses: situational awareness training in the fall, and then fuel management and shifting skills in the spring. All Year Two trainers were experienced ADOT snowplow operators from the Globe District.
An interdisciplinary team from Arizona State University (ASU) evaluated the effectiveness of simulator-based training for snowplow drivers as a new dimension in ADOT’s winter maintenance training program. The primary focus was on driver response to simulator training, and the effectiveness of that training in terms of public safety and potential cost savings. Clear quantitative results on this small scale have been limited, but two years of experience with simulator-trained snowplow operators in Arizona has resulted in optimism about the potential of simulators as an integral part of a comprehensive winter maintenance and driver skill training program.
Based on the Year Two results from Globe and new personnel training needs, ADOT procured two more simulators for Holbrook and Flagstaff Districts in mid-2006. A Working Group was formed of field trainers from the three simulator districts to refine and focus the training courses. A new third-year study will expand on this analysis, with a focus on results of training in proper gear shifting (a control-level skill) to improve fuel efficiency and to reduce repair costs. As the study proceeds, it will continue to evaluate the simulators’ effectiveness, providing quantitative documentation to reinforce the qualitative results and to define broader benefits of the driving simulator for heavy equipment operations. 17. Key Words Driving Simulators, Snowplow Training, Winter Maintenance
18. Distribution Statement Document is available through: ADOT Research Center (ATRC), 206 S. 17TH Avenue (MD-075R) Phoenix Arizona, 85007
19. Security Classification Unclassified
20. Security Classification Unclassified
21. No. of Pages 140
22. Price
23. Registrant's Seal

SI* (MODERN METRIC) CONVERSION FACTORS
APPROXIMATE CONVERSIONS TO SI UNITS APPROXIMATE CONVERSIONS FROM SI UNITS Symbol When You Know Multiply By To Find Symbol Symbol When You Know Multiply By To Find Symbol
LENGTH LENGTH in inches 25.4 millimeters mm mm millimeters 0.039 inches in ft feet 0.305 meters m m meters 3.28 feet ft yd yards 0.914 meters m m meters 1.09 yards yd mi miles 1.61 kilometers km km kilometers 0.621 miles mi AREA AREA
in2 square inches 645.2 square millimeters mm2 mm2 square millimeters 0.0016 square inches in2
ft2 square feet 0.093 square meters m2 m2 square meters 10.764 square feet ft2
yd2 square yards 0.836 square meters m2 m2 square meters 1.195 square yards yd2 ac acres 0.405 hectares ha ha hectares 2.47 acres ac mi2 square miles 2.59 square kilometers km2 km2 square kilometers 0.386 square miles mi2
VOLUME
VOLUME fl oz fluid ounces 29.57 milliliters mL mL milliliters 0.034 fluid ounces fl oz gal gallons 3.785 liters L L liters 0.264 gallons gal ft3 cubic feet 0.028 cubic meters m3 m3 cubic meters 35.315 cubic feet ft3
yd3 cubic yards 0.765 cubic meters m3 m3 cubic meters 1.308 cubic yards yd3
NOTE: Volumes greater than 1000L shall be shown in m3.
MASS MASS oz ounces 28.35 grams g g grams 0.035 ounces oz lb pounds 0.454 kilograms kg kg kilograms 2.205 pounds lb T short tons (2000lb) 0.907 megagrams
(or “metric ton”) mg
(or “t”) Mg megagrams
(or “metric ton”) 1.102 short tons (2000lb) T
TEMPERATURE (exact)
TEMPERATURE (exact) ºF Fahrenheit
temperature 5(F-32)/9
or (F-32)/1.8 Celsius temperature ºC ºC Celsius temperature 1.8C + 32 Fahrenheit
temperature ºF
ILLUMINATION
ILLUMINATION fc foot-candles 10.76 lux lx lx lux 0.0929 foot-candles fc fl foot-Lamberts 3.426 candela/m2 cd/m2 cd/m2 candela/m2 0.2919 foot-Lamberts fl FORCE AND PRESSURE OR STRESS FORCE AND PRESSURE OR STRESS
lbf poundforce 4.45 Newtons N N Newtons 0.225 poundforce lbf lbf/in2 poundforce per
square inch 6.89 kilopascals KPa kPa kilopascals 0.145 poundforce per
square inch lbf/in2
SI is the symbol for the International System of Units. Appropriate rounding should be made to comply with Section 4 of ASTM E380

TABLE OF CONTENTS
EXECUTIVE SUMMARY..............................................................................1
I. PROJECT INTRODUCTION..........................................................................7
II. LITERATURE REVIEW...............................................................................11
III. ARIZONA SNOWPLOW SIMULATOR TRAINING: YEAR ONE .......... 21
IV. SIMULATOR TRAINING – GLOBE DISTRICT: YEAR TWO................ 41
V. QUANTITATIVE ASSESSMENT................................................................55
VI. BROADER IMPLICATIONS OF WINTER MAINTENANCE...................65
VII. FUEL MANAGEMENT TRAINING........................................................... 71
VIII. CONCLUSIONS............................................................................................77
IX. RECOMMENDATIONS ...............................................................................85
APPENDIX A: MID-SEASON TRAINEE SURVEY QUESTIONNAIRES (TWO YEARS)..............................................................................91 APPENDIX B: MOST CHALLENGING MANEUVERS FOR SNOWPLOW OPERATORS (YEAR ONE)......................101 APPENDIX C: SNOWPLOW DRIVER TRAINING SIMULATOR:
FOCUS GROUP QUESTIONS: YEAR ONE/YEAR TWO ......105
APPENDIX D: MONTHLY SNOWFALL AMOUNTS: 1999-2000 TO 2005-06................................................................113 APPENDIX E: SNOWPLOW OPERATIONAL LOSS COSTS:
BY WINTER SEASON, BY DISTRICT ....................................117 APPENDIX F: SNOWPLOW OPERATIONAL LOSS COSTS
BY DISTRICT, BY WINTER: 1999-2006 ................................121 APPENDIX G: MEASURES OF EXPOSURE
RELATED TO OPERATIONAL LOSS COSTS........................125 REFERENCES .......................................................................................................129

LIST OF FIGURES Figure 1. L-3 Simulator Cab Perspective — December 2004 Training ................21
Figure 2. Two of Four L-3 Simulators — December 2004....................................22
Figure 3. Age Categories of Year One Drivers ......................................................26
Figure 4. Years of Experience with Driving Snowplows ......................................27
Figure 5. Drivers Finding Training Demanding.....................................................28
Figure 6. Drivers Feeling Successful/Unsuccessful in Completing Training ........29
Figure 7. Globe Simulator — Fall 2005 Training ..................................................41
Figure 8. Simulator in Use — Hands-on Training .................................................42
Figure 9. Globe ‘Train-the-Trainer’ Session — August 2005 ...............................43
Figure 10. Years of Experience with Driving Snowplows — Year Two, Globe District........................................................................45
Figure 11. Age Categories of Drivers — Globe District..........................................46
Figure 12. Challenges Facing Year Two Snowplow Drivers...................................47
Figure 13. Training Concepts Applied on the Job by Year Two Globe Drivers......48
Figure 14. Snowbound Trucks in an I-40 Storm Closure.........................................66
Figure 15. Pre- and Post-Test MPG Results of Fuel Management Training ...........74

LIST OF TABLES
Table 1. Responses to the Multiple District Surveys ...........................................25
Table 2. Drivers Finding Simulator Training Met Their Needs ...........................30
Table 3. Driver Recall of December 2004 Simulator Training — as Reflected in 2006 Follow-Up Survey.................................................31
Table 4. Year One Simulator Training Applied on the Job in Holbrook, Flagstaff, and Kingman .....................................................32
Table 5. Year One Focus Group/Interview Participants .......................................34
Table 6. Snowplow Operator Activities and Michon’s Driver Behavior Model...........................................................40
Table 7. Historical Snowfall Totals by Winter Season.........................................57
Table 8. Operational Loss Costs by Winter Season 1999-2006: Project Districts ...................................................................58
Table 9. Measures of Exposure Related to Operational Loss Costs in Globe ................................................................................60
Table 10. Year One Snowplow Equipment Repair Costs: 2004-05 Winter – Initial Study Districts.................................................62
Table 11. Year Two Snowplow Equipment Repair Costs: 2005-06 Winter - Study and Control Districts........................................62
Table 12. Statewide Calendar-Year Crashes Related to Snow, Slush, and Ice-Covered Surfaces .......................................................................68

ACKNOWLEDGEMENTS
The ASU project team would like to thank the members of the Technical Advisory Committee (TAC), who have been most helpful in providing data, shaping the project, and critiquing reports prepared in association with this study. The TAC included a broad range of Arizona Department of Transportation personnel, including representatives from ITD Technical Training, Equipment Services, Risk Management, Safety and Health, Central Maintenance Planning, and district offices in Globe, Flagstaff, Kingman, Safford, and Holbrook. The TAC also included a representative of the Federal Highway Administration. Members of the TAC included: Alan Hansen, Annie Parris, Carl Eyrich, Cindy Eiserman, Daniel Russell, David Sikes, Dell Jenkins, Dennis Halachoff, Dennis Johnson, Diane Minton, Erika Blankenship, George Garcia Jr., Jerry Massie, Jo Ann Noriega, John Harper, Randy Routhier, Richard Powers, Sue Olson, and William Kohn. The ASU research team has benefited considerably from the active involvement and diligence of Project Manager Steve Owen of the ADOT Transportation Research Center, who was invaluable in identifying sources of data, keeping the project moving along, and identifying ways of strengthening product. Members of the ASU interdisciplinary team in Year One were: Mary Kihl, Professor, School of Planning, principal investigator; Donald Herring, Clinical Professor, Department of Industrial Design, co-principal investigator; Peter Wolf, Faculty Research Associate, Department of Industrial Design, investigator; and Stephanie McVey, graduate assistant, School of Planning. In Year Two, Vamshee Kovuru from the School of Planning was the graduate assistant.
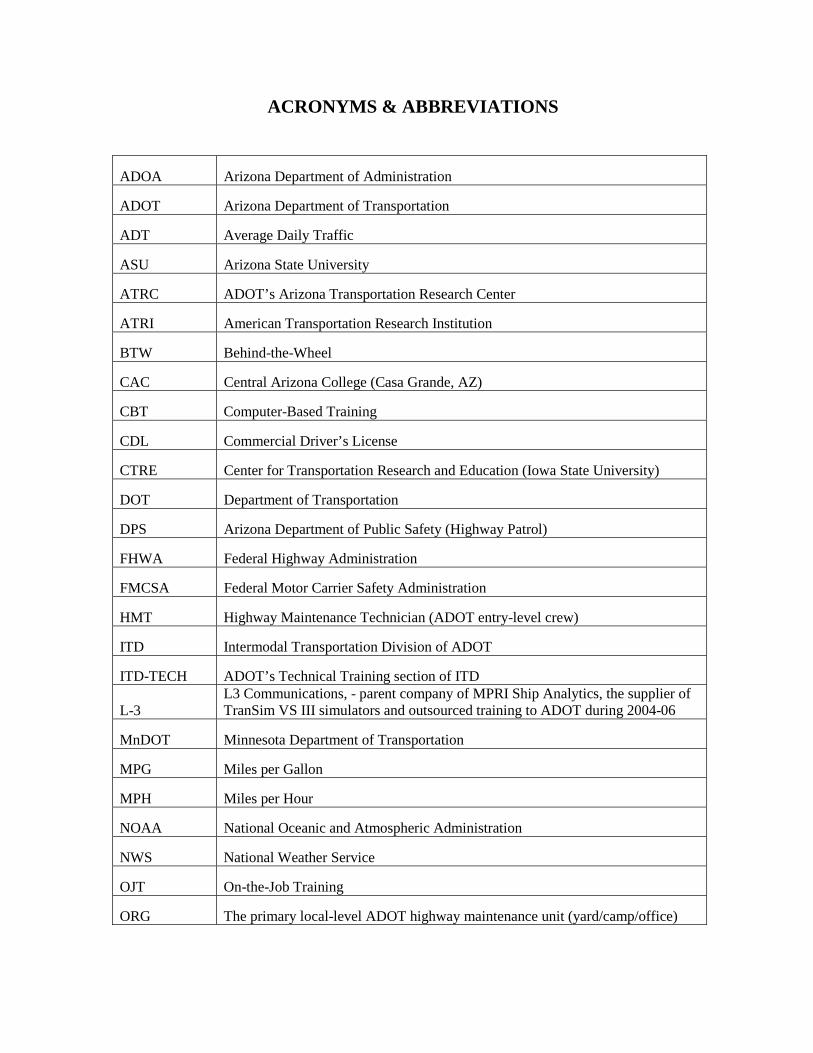
ACRONYMS & ABBREVIATIONS
ADOA Arizona Department of Administration
ADOT Arizona Department of Transportation
ADT Average Daily Traffic
ASU Arizona State University
ATRC ADOT’s Arizona Transportation Research Center
ATRI American Transportation Research Institution
BTW Behind-the-Wheel
CAC Central Arizona College (Casa Grande, AZ)
CBT Computer-Based Training
CDL Commercial Driver’s License
CTRE Center for Transportation Research and Education (Iowa State University)
DOT Department of Transportation
DPS Arizona Department of Public Safety (Highway Patrol)
FHWA Federal Highway Administration
FMCSA Federal Motor Carrier Safety Administration
HMT Highway Maintenance Technician (ADOT entry-level crew)
ITD Intermodal Transportation Division of ADOT
ITD-TECH ADOT’s Technical Training section of ITD
L-3 L3 Communications, - parent company of MPRI Ship Analytics, the supplier of TranSim VS III simulators and outsourced training to ADOT during 2004-06
MnDOT Minnesota Department of Transportation
MPG Miles per Gallon
MPH Miles per Hour
NOAA National Oceanic and Atmospheric Administration
NWS National Weather Service
OJT On-the-Job Training
ORG The primary local-level ADOT highway maintenance unit (yard/camp/office)
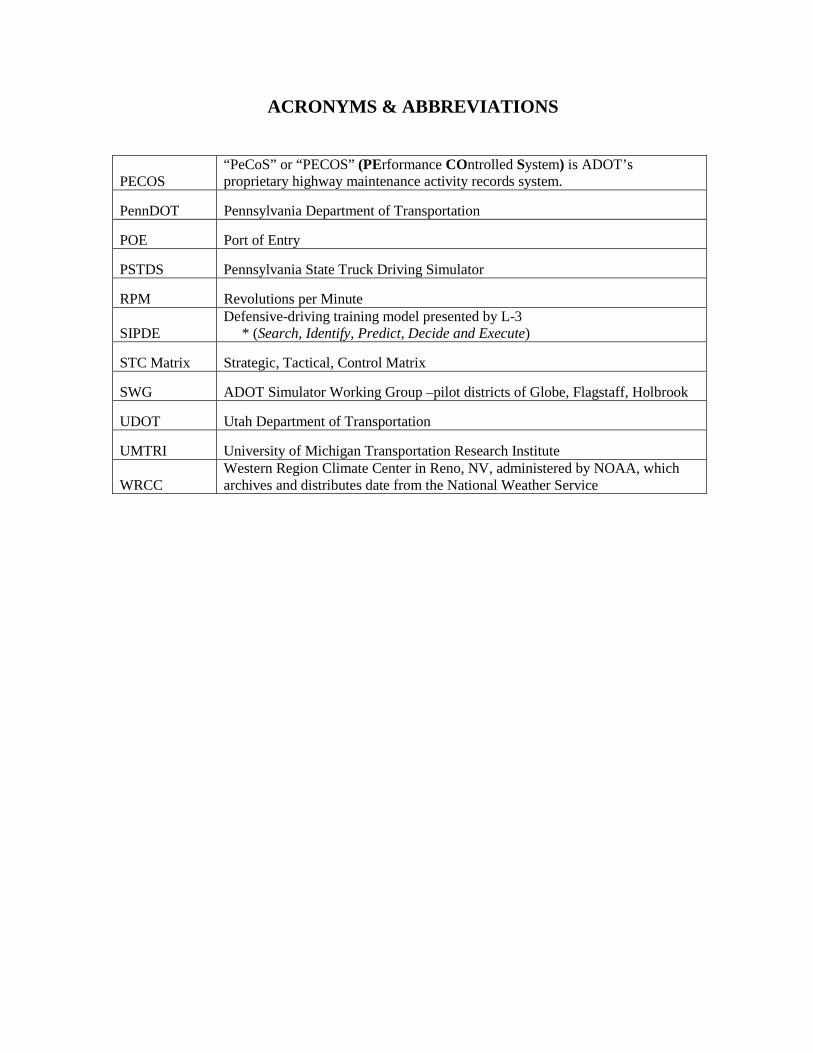
ACRONYMS & ABBREVIATIONS
PECOS “PeCoS” or “PECOS” (PErformance COntrolled System) is ADOT’s proprietary highway maintenance activity records system.
PennDOT Pennsylvania Department of Transportation
POE Port of Entry
PSTDS Pennsylvania State Truck Driving Simulator
RPM Revolutions per Minute
SIPDE Defensive-driving training model presented by L-3 * (Search, Identify, Predict, Decide and Execute)
STC Matrix Strategic, Tactical, Control Matrix
SWG ADOT Simulator Working Group –pilot districts of Globe, Flagstaff, Holbrook
UDOT Utah Department of Transportation
UMTRI University of Michigan Transportation Research Institute
WRCC Western Region Climate Center in Reno, NV, administered by NOAA, which archives and distributes date from the National Weather Service

1
EXECUTIVE SUMMARY
BACKGROUND Snowplow drivers typically must operate $200,000 pieces of equipment in long, stressful shifts, during blinding snowstorms under demanding traffic conditions. Yet traditional training, with limited funding and staff, can result in new drivers being sent out alone after only two or three storm shifts with a partner-trainer. For this level of responsibility, training needs to be enhanced, to improve driver safety and morale. In response to this need, the Arizona Department of Transportation (ADOT) Technical Training Group (ITD-Tech) contracted with L-3 Communications - MPRI Ship Analytics to give third-party simulator training to snowplow operators in rural Arizona. In late 2004, the L-3 mobile simulator classroom visited five ADOT districts: Globe, Flagstaff, Holbrook, Kingman, and Safford. L-3 instructors delivered a 2-1/2-hour curriculum with both classroom and simulator training segments. The Year One trainee group (the 2004-05 snow season) included 149 snowplow drivers. ADOT procured its own L-3 simulator for Year Two, to be assigned to ADOT’s Globe Maintenance District. In Year Two (the 2005-06 snow season), extensive in-depth training could be provided on this new L-3 TranSim VSIII simulator. All 61 Globe snowplow operators were trained, in two four-hour courses: situational awareness training in the fall, and then fuel management and shifting skills in the spring. All Year Two trainers were experienced ADOT snowplow operators from the Globe District. In late 2004, an interdisciplinary team from Arizona State University (ASU) was engaged to evaluate the effectiveness of driving simulator-based training for snowplow drivers as a new dimension in ADOT’s winter maintenance training program. The study was conducted for ADOT’s Arizona Transportation Research Center (ATRC) and the Technical Training Group. The primary focus was on driver response to simulator training, and effectiveness of that training in terms of both public safety and potential ADOT cost savings. RESEARCH The university team evaluated the effectiveness of simulator training through quantitative and qualitative assessments of driver response to the training. In Year One, the trainee snowplow drivers were surveyed on the training they had received in the simulator, followed by a series of focus groups at the end of the snowplow season. Interviews with maintenance supervisors and a ride-along task analysis also provided useful qualitative information. A parallel assessment in Year Two provided a comparative evaluation. The ASU team also held four post-winter focus groups in the Globe District, and a fifth focus group involved the supervisors from all seven maintenance yards in the district. Training snowplow drivers via simulators is a relatively new concept, although driving simulators have been widely used for human factor research and automobile driver training

2
for more than 30 years. Simulators offer a safe environment to practice infrequent, dangerous driving scenarios (e.g., a tire blowout). A driver who has over-learned the proper skills in a simulator may be better equipped to manage an actual blowout in real life. By incorporating “active error training,” a process in which trainees learn by making errors, driving simulators can be effective tools for what is called “analogical transfer.” Through repetitive practice of specific skills, drivers develop expertise at skills similar to those being taught. Simulators are also well suited to training for “adaptive transfer,” using one’s existing knowledge base to change a learned procedure, or develop a new solution to a problem. ASU Mid-Season Survey Results In the Year One survey in early 2005, over 44 percent of the trainees said the course had fully related to challenges they faced, and another 40 percent felt that it related to some of their concerns. In Year Two, 49 percent of the trainees felt that it related to their specific challenges, but 41 percent said it had not sufficiently addressed issues of visibility, traffic, roadway hazards, and actual plow operations. As to further training, the majority in Year One wanted scenarios relating more closely to local conditions, and this was still an issue in Year Two. Most of the drivers in Year Two were satisfied with the fidelity of the simulator. Still, 65 percent of experienced drivers and 35 percent of less experienced drivers called for more local scenarios in Year Two. In Year Two, drivers were also asked which of the concepts they learned in the simulator had been used on the job. Not surprisingly, 26 percent of respondents made observations related to awareness, which was the primary focus of the course. Another 9 percent made comments relating to hazards on the road. A number of other points were also noted. Driver Focus Groups and Field Staff Interviews At the end of the Year One snow season, in spring 2005, ASU held focus groups in Globe, Kingman, Flagstaff, Holbrook, and Safford to get longer-term perspectives from snowplow drivers on the L-3 training program. What emerged was a wealth of information on the December 2004 simulator course, as well as a fuller understanding of the multi-task aspects of driving, and the challenging conditions facing snowplow drivers. In June 2006, in four focus groups in the Globe District, Year Two drivers again conveyed their enthusiasm for the potential of the simulator-training program. The topics discussed included the “driver awareness” training offered in the fall, and the “fuel management and shifting” training offered in the spring. In terms of driver awareness training, there was a striking difference between attitudes of the newer and more experienced drivers. Newer drivers were enthusiastic about the chance for a jump-start on the season, and said the simulator training had helped them though some “white knuckle” plowing challenges. The experienced drivers said they learned little that was new, and without operational controls on the simulator, they could not practice the more challenging multi-tasking aspects of plow operation.

3
The spring 2006 fuel management/shifting training was well received by all drivers operating manual transmission vehicles, who immediately put their training into practice to see how much fuel they could save. Those driving trucks with automatic transmissions found it not particularly useful. The simulator can report on each trainee’s driving performance in such areas as riding the clutch, riding the brake, and grinding the gears. Training in these areas might reduce the amount of maintenance and keep the full fleet operational in a snowstorm. In Year One, the ASU team also visited with district maintenance managers about initial perceptions of the simulator training. Most were optimistic about the potential benefits; their comments on the need for greater realism echoed those of the drivers. A Year Two focus group with Globe District supervisors reinforced their enthusiasm for a system that can provide new drivers with a jump on the snow season, and also give more experienced drivers a refresher before the start of the winter. Quantitative Assessment A parallel quantitative study was launched to determine benefits and costs of snowplow simulator training. The study involved assessments of historical data on snowplowing accidents, liability and insurance claims, and repair records of ADOT snowplows over five winter seasons (1999-2000 through 2003-04). This established a baseline for measuring the effectiveness of simulator training to reduce repair costs to snowplows, to reduce plowing-related accidents, and to improve roadway driving conditions to reduce accident rates on Arizona highways. ADOT equipment repair records for the 2004-05 winter season showed that six of the 149 drivers with initial simulator training were involved in accidents, resulting in $9,968 in repair costs. By contrast, nine of the 145 snowplow drivers who were not simulator trained had accidents that caused $15,973 in repairs to ADOT equipment. These findings are not statistically significant, but they may indicate a trend. For Year Two, repair figures for Globe were compared to the other four Year One districts, as well as for Prescott, which had no simulator training. Results were inconclusive; Globe’s Year Two figures were similar to other districts, and in some cases, higher. Given the small number of accidents in any snow season, a single event is likely to skew reports of repair costs, however. And, accident avoidance is very difficult to quantify. Nevertheless, when repair costs and liability costs are related to exposure (measured in terms of miles plowed or hours spent in plowing or in snowfall inches) the performance in Globe improved on all three measures after the intensive simulator training in Year Two. Public Safety Another indicator of snowplow training effectiveness relates to overall public safety. The stated goal of ADOT snow-management planning is “to provide safe and reliable surfaces for public vehicular use in transporting persons and products.” The proportion of injury-related and fatal accidents associated with snow and ice are relatively small in Arizona, generally less than one percent of such accidents in the state in any given year. Still, the cost impact to Arizona of 335 personal injuries and 10 fatalities on snow, slush, and ice-

4
covered roadways in 2005 is estimated as $18,012,940.1 Training snowplow operators to maneuver plows more efficiently and safely is expected to result in fewer snowplow accidents, and also reduce accidents among private vehicles. Commercial Shipping Delays Minimizing delay costs for commercial freight shipments in winter is another potential long-term benefit of simulator training. Arizona commercial vehicle operators estimate that a one-day delay costs $700 per truck, and a one-hour delay costs $65. On average, 5,177 trucks cross Interstate 40 daily in the snow season. Using Arizona figures, just a one-hour delay can cost freight operators more than $335,505. If all those trucks had to make the full 355-mile trip on snowy and icy roads across the state at 40 mph, rather than the typical 60 mph, the resulting three-hour delay would cost them more than $1 million. Efficient, effective snow removal is essential to keeping the roads open. The simulator is essentially an investment in sharpening the skills and effectiveness of ADOT snowplow operators, helping to assure that priority routes stay open. Transfer of Training In order to evaluate the effectiveness of the ADOT simulator-training program, the ASU research team focused on transfer of training, the ability to apply what is learned in one context to another. In the current study, this refers to the ability of snowplow operators to apply what they have learned in their simulator training to on-the-road driving practice. To better understand the key driving skills required, the ASU team rode in plow trucks and held focus groups with operators. From this, they sorted driving activities into five categories: Inspecting, Communicating, Driving, Plowing and Spreading. Michon’s (1985) driving model served as the framework for this activity model. Three levels of activity describe the set of tasks that comprise driving — strategic, tactical, and control. Strategic tasks focus on the purpose of the trip and the driver’s overall goals. Tactical tasks focus on the choice of maneuvers and immediate goals in getting to a destination. Control tasks focus on the moment-to-moment operation of the vehicle.
Driving Skills and Transfer of Training The surveys, focus groups, and performance reports recorded by the simulator all suggest that L-3’s SIPDE (Search, Identify, Predict, Decide and Execute) Driver Awareness course was relatively successful at training tactical skills, but less so for control skills. The fuel management/shifting program, on the other hand, seems better designed for teaching control skills. While the SIPDE-Driver Awareness program has a broad focus, the fuel management and shifting training is more narrowly focused on proper gear shifting and related clutch usage. Drivers reported that they quickly applied what they had learned, and saw positive results. Although not statistically significant, the results do suggest positive transfer of training of tactical skills from Driver Awareness training, and control skills from Fuel Management.
1 From ADOT Motor Vehicle Crash Facts, 1999-2005, and National Safety Council.

5
Summary Observations Based on the Year Two experience in Globe, and the need for consistent new-hire training, ADOT made a policy decision to procure two more L-3 simulators in mid-2006, to expand this training program into more of its critical snow-country districts. With three units now deployed to the Globe, Flagstaff, and Holbrook Districts, the following points, as regards sound planning and consistent training course development, will be crucial.
1. New and experienced snowplow operators seem to want different things from the L-3 simulator training. How well each group of drivers will respond to simulator training may depend on the driving skills being taught. For states like Arizona, with high rates of driver turnover, the current simulators are quite useful for training tactical-level driving skills for inexperienced drivers and enhancing safety — the primary concern for all Department of Transportation agencies (DOTs).
2. It may be easier to quantify transfer of control-level skills than transfer of tactical-level skills. Tactical skills are more “big picture” skills, and therefore are more complex to study and measure. It is relatively easy, however, to determine if drivers are shifting gears more efficiently (e.g., by way of fuel consumption, reduced clutch maintenance, etc.).
3. How a training program is presented to trainees is critical to its success. The first step in designing or purchasing a training program, then, ought to be asking what driving skills are needed and how is the course “marketed” to trainees? ADOT’s new Simulator Working Group (SWG) includes the Globe, Flagstaff, and Holbrook Districts, each with an L-3 unit. This team of plow operator-field trainers will be critical in defining desired outcomes of the simulator training, and in shaping the way in which it is marketed to trainees.
4. Globe trainees unanimously praised the ADOT trainers - all veteran snowplow operators. In fact, the trainees reported that they learned a great deal from the ‘low-tech’ storytelling aspects of their training sessions, as well as from the ‘high-tech’ simulator itself.
RECOMMENDATIONS The following specific recommendations are drawn from the research team’s two-year assessment:
• Offer consistent programs in all three districts with simulators in 2006-07, and maximize the Globe successes in using experienced local drivers as trainers.
• Challenge the new multi-district Working Group to identify specific training issues, and to refine simulator programs to address those concerns. Market the courses with titles that clearly inform drivers and underscore course objectives. For example, winter SIPDE classes could be called Driver Safety or Driver Awareness Training, and the spring fuel management course might be called Training in Driving Techniques.
• Enhance content of the courses so that they relate to challenges faced in the real world, and allow drivers to practice using scenarios to address those challenges.
• Enhance driving technique courses with training of key functions for all participants. In a course on manual shifting techniques, for example, add relevant lessons for drivers of automatic transmission vehicles.

6
• Offer all drivers documented feedback on performance, and the opportunity to practice in their areas of concern.
• Separate experienced drivers from less experienced or new drivers in SIPDE/Driver Awareness courses.
• Offer the more experienced drivers an advanced class on tactical issues that are challenging for all drivers, such as dealing with motorists, visibility, and hazards, in as realistic a setting as possible.
• Provide more independent practice time for less experienced drivers so that they can better integrate their simulator and their on-the-job training.
• Enhance the fuel management/shifting course with more focus on reports provided by the simulator. Criteria can be set to reflect desired driving policies of each district, and ADOT in general.
• Incorporate references to the de-icing training by highlighting the timing for applying the chemicals, and encouraging the driver to regularly check the (imaginary) temperature gauge.
SUMMARY Two years of experience with simulator training for snowplow operators in Arizona leaves an optimistic feeling about the potential of simulators as an integral part of comprehensive winter maintenance and driver-skill training programs. Further research has been initiated for a third year, with a focus on proper gear shifting (a control-level skill) to improve fuel efficiency and to reduce repair costs. As the study proceeds, it will continue to evaluate the simulator’s effectiveness, providing quantitative documentation to reinforce the qualitative results and to define broader benefits of the driving simulator for heavy equipment operations.

7
I. PROJECT INTRODUCTION Driving simulators have been widely used for human factors research and automobile driver training and retraining for more than 30 years (Linck, Richter, & Schmidt, 1973). Commercial trucking companies are increasingly using them to train drivers and to sharpen their skills. They have not, however, been widely used by Departments of Transportation for training heavy equipment operators. The Arizona Department of Transportation (ADOT) has been a leader among state DOTs, by providing simulator training to snowplow operators since late 2004. The Utah Department of Transportation (UDOT) helped to initiate this program of simulator training in 2003 for a limited number of its plow operators, and has outsourced this course on a broader scale in subsequent snow seasons. And most recently, the Iowa DOT has initiated a simulator training program very similar to ADOT’s, beginning in 2005. Snowplow operators are a crucial group of employees in Arizona, a state that sees irregular snowfalls in the rural, mountainous districts of the northern and eastern parts of the state. Some snow seasons have several snowstorms, while others may have only one or two storms — but they are heavy enough to challenge even the most experienced drivers. Nevertheless, drivers operating equipment valued at up to $200,000 are expected to perform efficiently in clearing the roads, and safely in regard to hazards along the road or motorists who are inexperienced in driving in major snowstorms. Simulator training can offer refresher courses to get experienced drivers ready for the snow season, and give recent hires much-needed pre-season instruction and practice. Given heavy turnover rates, the expectation is that training new hires on the simulator can help to reduce — but certainly not eliminate — time needed in on-the job ride-alongs.
For the 2004-05 snow season, ADOT’s Intermodal Transportation Division (ITD) contracted with the MRI-Ship Analytics unit of L-3 Communications to introduce simulator training to Arizona snowplow operators. Four L-3 TransSim VS III simulators, mounted in a mobile classroom, visited five rural ADOT districts (Globe, Flagstaff, Holbrook, Kingman, and Safford). Training was provided to ADOT drivers by L-3 trainers. In late 2005, ADOT commissioned an L-3 simulator of its own, located in the Globe Maintenance District, initiating a far more extensive pilot training program there for some 60 snowplow drivers. In-house volunteer trainers — each of whom is an experienced snowplow operator — were selected, and went through L-3’s “Train the Trainer” program. Two additional L-3 simulators have since been purchased for the Holbrook and Flagstaff districts, further expanding the training program for 2006-07. The following report was prepared by an interdisciplinary team from Arizona State University that was asked to evaluate the effectiveness of simulator-based training for snowplow drivers, in cooperation with ADOT’s Arizona Transportation Research Center (ATRC). The focus of the study was on driver response to simulator training, and the transfer of training to the real world of winter storm operations.

8
The study is grounded in theory related to transfer of training and assessments of internal validity (relating to consistency and accuracy of reporting on driver performance on the simulator) and external validity (in terms of application to the real world.) Chapter II of this study summarizes literature related to key theories as well as a discussion of related applications of simulators. The chapter ends with a perspective on expectations of simulators in the training process. Those concepts are further elaborated in the rest of the study and applied to an assessment of the application of simulator-based snowplow driver training in Arizona.
Chapter III offers a qualitative assessment of the driver simulator training in Year One (2004-05), when an introductory simulator-training course was offered to snowplow drivers in the Globe, Flagstaff, Holbrook, Kingman, and Safford districts. The chapter highlights responses gained from multiple approaches of qualitative data gathering, including site visits, surveys, focus groups, and discussions with supervisors about the training offered in 2004-05. As the discussion in the chapter points out, drivers were enthusiastic about the simulator. In addition, a driving behavior model, introduced by J.A. Michon, offers a comprehensive approach to synthesizing both expectations and contributions of training on the current simulators. Chapter IV offers a parallel qualitative assessment of driver similar training in Globe in Year Two (2005-06). The training program in Globe involved a consistent 4-hour session for small groups of drivers, offered by experienced snowplow operators from the Globe District. The chapter discusses surveys and focus groups with drivers who participated in the Year Two study. An additional focus group involved maintenance supervisors from each of the ORGs in the Globe District. The drivers in the Globe District had a much more comprehensive exposure to simulator training than did the drivers in Year One. Consequently, they were more circumspect in terms what they had learned from the simulator training courses, what was possible to incorporate into subsequent courses, and what they could incorporate into their own snowplow operations. Chapter V offers a quantitative analysis of the value of simulator training in terms of expected reductions in accidents, repairs, and liabilities. A five-year baseline of data was established for each of the districts, and figures for 2004-05 and 2005-06 were compared with the baseline. In order to equalize exposure levels among the five districts where drivers had had some interaction with simulators, the miles plowed in each district was related to operational losses faced by ADOT. Snowfall data provided by the state climatologist was also provided for each district. By way of comparison, data was also provided for the Prescott district, where drivers had no exposure to simulator training. As was anticipated, the data provided limited information regarding the impact of snowplow driver training. Quantitative data cannot show figures for crashes avoided, although anecdotal reports indicate that the awareness training did help some drivers cope with challenges faced in the real world. Another factor is the point that, in general, ADOT snowplow drivers are careful drivers and there are few crashes reported.

9
Chapter VI offers a broader perspective on the potential impact of efficient snow removal on cross-country shipping, and other economic factors that reach far beyond the bounds of Arizona.
Chapter VII focuses on the Fuel Management training program, as offered in Globe in spring 2006. That training, unlike the Driver Awareness training in the fall, does focus on operational steps that drivers can take to improve their performance. Similarly, the benefits of that training in terms of fuel saved, and the minimizing of routine repairs to clutch components, brakes, and transmissions, can be traced much more directly to this simulator training of operational skills.
Chapter VIII summarizes the conclusions drawn from the findings of this study. Chapter IX offers recommendations to both the Globe District and the two other districts that are about to start simulator training, as well as more general recommendations to other agencies considering truck driving simulator training.

10
11
II. LITERATURE REVIEW
SIMULATORS AS TRAINING TOOLS Training snowplow drivers via simulators is a relatively new concept, although driving simulators have been widely used for human factors research and automobile driver training and retraining for more than 30 years. (Linck et al., 1973, as cited in Reed & Green, 1999). “Operator-in-the-loop” simulators were first developed to train military pilots (Wiener & Nagel, 1988), but have since been used to train locomotive engineers, and ship helmsmen (Emery, Robin, Knipling, Finn, & Fleger, 1999, p. 4). Driving simulators are being used for a wide variety of vehicle applications, including cars, large trucks (Hoskins, El-Gindy, Vance, Hiller, & Goodhart, 2002), buses (Brock, Jacobs, van Cott, McCauley, & Norstrom, 2001), off-road equipment ("Painless Haul-Truck Crashes," 2000), and cranes (Angelo, 2001), among others. Recently, driving simulators have been used to train snowplow operators in Pennsylvania (Vance, El-Gindy, Hoskins, Hiller, & Tallon, 2002) and Utah (Strayer, Drews, & Burns, 2004). Today’s state-of-the-art driving simulators generally feature high-resolution graphics, rapid refresh rates, and nearly-180° fields of view. The University of Michigan’s Transportation Research Institute (UMTRI) purchased a new driving simulator in 2002. Although the UMTRI simulator is more sophisticated than most, its description (Ross-Flanigan, 2002) could easily be used to describe many of the driving simulators on the market today (including the L-3 TranSim VS III model used by ADOT):
The driving simulator consists of a modified, full-sized vehicle console in a room with wall-sized screens. Computer-generated images simulate views of a roadway as seen through the windshield and in the rear-view mirror. The vehicle is equipped to sound and feel real as it cruises down the highway or drives along city streets. (Ross-Flanigan, 2002, p. 1)
Driving simulators are generally used for one of three primary purposes: research, engineering, or training (Emery et al., 1999), although they sometimes serve a combination of these purposes. Research simulators are often used for human factors and cognitive psychology experiments to study various elements of driving behavior (for examples, see Kemeny & Panerai, 2003; Reed & Green, 1999; Sidaway & Fairweather, 1996). Engineering simulators are generally used by automotive manufacturers and suppliers to develop and evaluate vehicle components and systems (for example, see Nagiri, Amano, Fukui, & Doi, n.d.). Training simulators are used by public and private agencies to teach and evaluate various driving skills (for examples, see Emery et al., 1999; Strayer & Drews, 2003; Strayer et al., 2004; Vance et al., 2002). Driving simulators may be categorized as either fixed-base or motion-base simulators. Fixed-base models range from simple, desktop computer models (for example, see Lee, Lee, & Cameron, 2003), to those utilizing head-mounted display with head tracking technology (Liu, Miyazaki, & Watson, 1999), to units that include partial (Ross-Flanigan, 2002) or full vehicle cockpits (for examples, see 2002; Roenker, Cissell, & Ball, 2003).

12
Motion-base simulators are generally more sophisticated than fixed-base models, and feature motion cues that mimic the roll, pitch, and yaw of actual vehicle dynamics. The Iowa Driving Simulator, located in the University of Iowa’s Center for Computer-Aided Design is one of the most sophisticated motion-base driving simulators (Kuhl, Evans, Papelis, Romano, & Watson, 1995). Although fixed-base simulators have the obvious advantage of cost, their lack of motion cues may alter “the perceived motion variables that serve as inputs to [one’s driving] strategy” (Reymond, Kemeny, Droulez, & Berthoz, 2001, p. 493). This becomes especially important during the low-friction conditions associated with snowplow operation. In this case, even small motion cues (e.g., one to two inches) make a significant difference in how realistic the simulation experience feels to users (P.A. Green, personal communication, February 28, 2005). Lacking these motion cues, fixed-base simulators may demonstrate less internal and external validity compared to motion-base models (as discussed below).
Whether used as research, engineering, or training tools, driving simulators offer several advantages over real-world driving. Safety is a primary advantage, as simulators can be used to expose drivers to driving conditions too dangerous to consider for real-world driving (Liu et al., 1999; Reed & Green, 1999). As a training tool, simulators allow trainees to practice driving and develop confidence before taking a road test (Liu et al., 1999, p. 5). Most simulators also have the ability to record and play back training sessions, meaning that evaluation can be objectively assessed, although this advantage is “rarely exploited” (Hoskins et al., 2002).
Populations studied have included older drivers (Hakamies-Blomqvist, Östlund, Henriksson, & Heikkinen, 1995; Lee et al., 2003), teens (Deery & Fildes, 1999), “head-injured” (Liu et al., 1999) and brain-damaged drivers (van Zomeren, Brouwer, & Minderhoud, 1987), and over-the-road truck operators (Hoskins et al., 2002; Manger, 2003; Pierowicz et al., 2002). VALIDITY OF DRIVING SIMULATORS Despite the increasing popularity of driving simulators, the correlation to real-world driving behavior is unclear. As Hoskins, et al. (2002) note in their report, Truck Driving Simulator Performance Effectiveness, “The most significant disadvantages of driving simulators are a lack of consistent experimental support for simulator training and knowledge transfer. On the whole, surprisingly little work had been done to evaluate the advantages claimed for simulator training” (p. 52). “The correlation to real-world driving behavior” is often referred to as a simulator’s validity. According to Emery et al.:
Validation can be judged by the extent to which the real environment and simulator evoke similar driver response and behavior. Furthermore, changes in tasks should evoke corresponding changes in driver response and behavior… In general, measures of response and behavior useful in validation include driver

13
control actions and response, vehicle motion response, driver plus vehicle response and performance, and subjective ratings and commentary (Emery et al 1999, p. 6).
Vance et al. (2002) don’t use the term validity at all; rather they use fidelity to describe “the extent to which it can simulate the real-life situation” (Vance et al. 2002 p. 11). According to these researchers, there are two types of fidelity: physical fidelity refers to “the extent to which the simulator looks like the real situation,” while functional (or psychological) fidelity refers to the “extent to which the operator, equipment, and simulated environment interact in the same way as a real-life situation” (Vance et al., 2002, p 12). Although one might reasonably expect there to be a strong relationship between simulator validity (or fidelity) and knowledge transfer, this is not necessarily so. According to Vance et al., the fidelity required of a particular simulator depends upon the training to be conducted, and they note that “certain tasks and skills can be learned even in very crude simulators” (Vance et al., 2002, p. 13):
Reasoning or cognitive ability tasks do not require high physical fidelity levels. The skills in these settings are generalizable to many different areas, not only truck driving, and the physical layout need not be exact. High physical fidelity is necessary when the training involves learning perceptual-motor skills, or the interaction of the trainee with the layout of the equipment. An example of where high fidelity is needed is when the goal is to practice tasks that cannot be practiced in the field because they are too dangerous, such as simulated spinouts on ice (Vance et al., 2002, p. 13).
Demonstration of internal validity is often considered adequate for engineering and research simulation. “The validation of simulation, however, for the training of a particular skill is most appropriately addressed through an assessment of whether that training actually transfers to the environment in such a way as to encourage skill proficiency and safe operating practices” (Emery et al., 1999, p. 7). As has been shown, little research has been done to support the external validity of simulator training. The ability to apply what is learned in one context to another context is generally called transfer of training. In the case of the current project, this refers to the ability of snowplow operators to apply what they have learned in the simulator training course to on-the-road driving practice. If drivers trained in the simulator perform better on the road than those drivers not trained in the simulator, then it could be concluded that positive transfer has occurred. Conversely, if those trained in the simulator perform worse than their conventionally trained counterparts, it would be considered negative transfer. If there is no difference, then zero transfer has occurred (Goldstein, 1986). Simulators offer a safe environment in which drivers can practice infrequent, dangerous driving scenarios (e.g., a tire blowout). As such, they are well-suited to what is called “over-learning,” the “rehearsal of a response past a minimally acceptable performance

14
level [that] serves to maintain proper performance in stressful situations” (Emery et al., 1999, p. 70). So it is thought that a driver who has over-learned the proper skills in a simulator would be better equipped to manage an actual tire blowout in the real world. This would be an example of analogical transfer, which “involves using a familiar problem to solve a problem of the same type” (Reeves & Weisberg, 1994, as cited in Ivancic & Hesketh, 2000, p. 1967). By incorporating “active error training” (Ivancic & Hesketh, 2000), in which drivers are permitted to make their own errors, simulators can be effective tools for analogical transfer. However, it has been shown that “interventions designed to teach specific driving skills (e.g., skid training) have often produced weak or inconclusive results” (Katila et al. 1996, as cited in Ivancic & Hesketh, 2000, p. 1966). Furthermore, there is some concern that “increasing expertise leads to less adaptable skills” (Hesketh, 1997), thus reducing transfer of more generalizable skills. It would be useful, for example, if learning how to manage a tire blowout in the simulator would also improve a driver’s ability to safely manage a skid caused by icy road conditions. This would be an example of adaptable transfer, which “involves using one’s existing knowledge base to change a learned procedure, or to generate a solution to a completely new problem” (Smith et al. 1997, as cited in Ivancic & Hesketh, 2000, p. 1968). Simulators are well-suited to training for adaptive transfer as well. TRANSFER OF TRAINING AND “SMILE SHEETS” Post-training questionnaires — or “smile sheets” (Hesketh, 1997, p. 328) — are often used to support the general idea of knowledge transfer; however, the literature indicates the many shortcomings of such questionnaires for this purpose. The primary criticism is that short-term evaluation tools (e.g., post-training questionnaires) place too much emphasis on immediate trainee satisfaction, and too little emphasis on long-term training transfer. As Hesketh argues, “those methods used during training that are most effective at the end of training, are not necessarily best for transfer and vice versa” (Hesketh, 1997, p. 325). This is especially true for those components of training that, while “effective in developing skills that transfer,” are also found to be “more effortful and may adversely affect self-efficacy for training and expectancies for success” (Hesketh, 1997, p. 328). Because of the immediate “fix” associated with these types of training courses — often at the expense of long-term benefits — Hesketh refers to them as “cigarette courses,” adding that their addictive quality often makes them “popular with trainers, managers, and the trainees” (Hesketh, 1997, p. 382). Simply put, the evidence that drivers trained in simulators perform better on the road is ambiguous, and the lack of validation is “a problematic trend” (Emery et al., 1999). A 1999 study by the Federal Motor Carrier Safety Administration (FMCSA) investigated validation of simulator training for over-the-road truck drivers. The purpose of the study was to “examine how simulator technology, as compared to conventional methods, may facilitate and enhance tractor-trailer driver performance” (Emery et al., 1999). The study was designed to train a control group of novice tractor-trailer drivers using purely “conventional” behind-the-wheel (BTW) methods, while an experimental group received a combination of simulator training and BTW training. After their training, the students
15
would take the Commercial Driver’s License (CDL) examination. To evaluate transfer of training, the performance of each group on the CDL exam was to be compared. In addition, a longitudinal study was planned, in which drivers’ 3-month and 12-month driving records (number of crashes, number of citations, supervisory ratings, etc.) would be examined. This part of the study was aimed at addressing issues of training retention (Validation of Simulation Technology in the Training, Testing, and Licensing of Tractor-Trailer Drivers, 2000). Part 1 (Emery et al., 1999) and Part 2 (Pierowicz et al., 2002) final reports have been published, and are discussed in detail below. The report for Part 3 (the longitudinal study) was apparently not published. A similar longitudinal study, by the American Transportation Research Institute, is currently in the planning stages (ATRI, n.d.).
OTHER STATES’ EXPERIENCES WITH SIMULATORS Arizona is not the first state to use driving simulators to train snowplow operators. Other states, including Pennsylvania, Utah, and Iowa have done work in this area. What follows is a summary of the investigation and development work that these other state DOTs have done with driving simulators. Pennsylvania DOT The Pennsylvania Department of Transportation (PennDOT) has also considered using simulators to train its snowplow operators. A study was conducted in 2001 to investigate upgrading the Penn State Truck Driving Simulator (PSTDS) with software appropriate to snowplow scenarios. The PSTDS, located at Pennsylvania State University, is a motion-base unit used primarily as a research simulator (Vance et al., 2002). The study also investigated PennDOT’s training procedures for operators of large vehicles, and how simulators might be used to supplement this training. Four research questions were posed, as follows:
1. Can targeted vehicle operation skills be improved through simulator experience?
2. Does simulator training with instruction enhance vehicle operation skills compared to simulator training without instruction?
3. Do simulator-recorded measurements of vehicle operation skills agree with instructor evaluations of the same skills?
4. Is initial training academy performance enhanced by simulator training?
Question 1 The results of the study generally supported the idea that targeted vehicle operation skills can be improved through simulator experience, although to varying degrees. In this case, both subjective data (instructor ratings) and objective data (simulator measures) indicated that “driving performance improved with practice for each scenario” (Vance et al., 2002, p. 66). However, performance in some driving scenarios seemed to benefit from practice more than in other scenarios. According to the researchers, “it is likely that some driving skills are more easily learned in simulator training than others” (Vance et al., 2002, p. 66). It is important to note that at this stage of the study, no on-the-road driving was

16
conducted; all work was conducted in the simulator. The positive results, therefore, suggest good internal validity, but say nothing of external validity. Question 2 The question of whether simulator training with instruction enhances vehicle operation skills, compared to simulator training without instruction, “received overwhelming support” (Vance et al., 2002, p. 66). Study participants who received simulator training with instruction “consistently performed better” than participants who received simulator training without support, and “their learning curves were typically steeper” (Emery et al., 1999, p. 66). As with the first research question, this question addresses issues of internal validity only. Question 3 Results indicated that simulator-recorded measurements of vehicle operation skills do agree with instructor evaluations of the same skills. This is essentially a question of how well subjective data (instructor ratings) correlate with objective data (simulator measures). These findings may offer some support for the use of simulators as training tools. Rather than monitor students continuously, instructors could be used primarily for initial instruction. Following initial instruction, “the simulator measurement charts… could be monitored periodically, with instruction provided as needed until acceptable levels are achieved” (Vance et al., 2002, p. 66). Once again, this question suggests good internal validity, but does not address issues of external validity. Question 4 In order to investigate external validity of the driving simulator, researchers studied initial training academy performance by those participants who received simulator training. Based on an assumed positive transfer of training from the simulator, the researchers expected that study participants who received simulator training should have outperformed those who had not received simulator training in actual driving tasks at PennDOT. However, this was not the case. Indeed, at one of the two training academies, drivers who had received simulator training actually rated lower than drivers who had not received simulator training. On the surface, then, this would appear to suggest poor external validity (and negative transfer of training) for the simulator. However, a number of unforeseen factors contributed to these findings.
Average daily ratings (from academy instructors), for example, do not necessarily reflect individual driver performance, or individual skills. As such, they may be insufficient measures of “driver success” at the academies. Also, the researchers found differences in ratings between the two training academies. The single greatest factor contributing to these surprising results is that different measures were used during simulator training and in-vehicle training at the academies. Therefore, no direct comparison was possible. As the researchers note, the “demonstration of transfer of learning of these skills required comparable measures of performance in the training and job contexts” (Vance et al., 2002, p. 67).

17
Implications of the PennDOT Study Despite the limitations of the PennDOT study with relation to external validity and knowledge transfer, the researchers’ recommendations are worth consideration. The researchers concluded that both novice and experienced PennDOT drivers could likely benefit from simulator training, including the training of “advanced driving skills… such as snow plowing” (Vance et al., 2002, p. 68). Because of rapidly changing simulator technology, “and the variety of potential uses of this technology in actual training,” the researchers suggest “it seems reasonable to invest in more than one type of driving simulator and to spread these acquisitions out over time” (Vance et al., 2002, p. 68). While the researchers are optimistic about the potential benefits of simulator training, they are equally cautious:
Implementing simulators involves a reconsideration of the entire system, and may not be possible considering the cost, upkeep, and required effectiveness of the simulator. Many options and alternatives must be weighed before deciding to use simulators. Detailed and thoughtful design of training will raise the likelihood that a simulator is effective. This process begins with a training needs/task analysis, followed by an analysis of opportunities and limitations of the specific simulator. A careful consideration of how the simulator is to be used as part of a training program is critical, followed by a decision about what to measure and how to measure it. (Vance et al., 2002, p. 16)
Utah DOT The Utah Department of Transportation (UDOT) began using simulators to train snowplow operators in the 2003-04 winter season. The project began as a collaborative effort between UDOT, the University of Utah’s Dr. David Strayer, and General Electric Driver Development to “determine the feasibility of using high-fidelity simulator training to improve the performance of UDOT maintenance operators (i.e., snowplow drivers)” (Strayer et al., 2004). Tasks included an initial needs analysis, development of relevant simulator driving scenarios, actual driver training, and comparison of driving performance for both the simulator-trained and control groups for six months following the training. The authors of the final report indicate positive results of their study: “Overall, the snowplow simulator training program offers a number of attractive benefits for UDOT, including a reduction in the frequency of accidents, a decrease in the cost associated with each accident, and an increase in fuel efficiency” (Strayer et al., 2004, p. 22).
Despite the optimistic findings of this study, it offers little in the way of external validity or transfer of training. The number of accidents during the period in question was relatively low, at seven. Of those seven accidents, three involved drivers from the study group — but in two cases “the trained driver was determined by UDOT to be not responsible for the accident” (Strayer et al., 2004, p. 16). It is therefore very difficult to draw any clear conclusions regarding the effect of simulator training on accident prevention.

18
The difficulty in getting verifiable data regarding the cost savings associated with reduced accidents caused the Utah team to focus more on savings that would be more easily quantified, like fuel savings (D.L. Strayer, personal communication, May 2006). UDOT is not the first to use simulator training to improve drivers’ shifting skills — and therefore improve fuel economy. Indeed, the authors of the UDOT report have themselves conducted a Fuel Management simulation study to quantify the improvement in fuel efficiency for CDL truck drivers” (Strayer & Drews, 2003). The driving patterns of typical CDL truck drivers and snowplow drivers vary considerably, however, and fuel consumption will vary accordingly. Although fuel consumption data were not available through UDOT, the Utah study team noted that a commercial company operating mining equipment did save a considerable amount of fuel after their drivers were trained in proper shifting techniques on the simulator. That point attracted interest in simulator-based training for snowplow operators (Strayer, 2006). Many of the factors that can be controlled in a study of CDL truck drivers simply cannot be controlled in a study of snowplow operators. Indeed, the authors concede that “neither the maintenance data nor the fuel data are of sufficient quality to afford a precise comparison between the study and control groups,” and that “the data that were included in the analysis still have unknown levels of noise” (Strayer et al., 2004, p. 19-20). Nevertheless, they suggest “there is every reason to expect that the benefits of training observed on the commercial side will be similar for UDOT drivers” (Strayer et al., 2004, p. 21). A follow-up study by the Utah research team in 2005 determined that it would be more cost effective for UDOT to engage L-3 as a third-party training vendor. L-3 is providing simulators in a self-contained trailer that can be transported to field locations, and is also offering the training to UDOT drivers — much as was done in Arizona in Year One (Strayer, 2006). Unlike the Arizona simulator training approach, the UDOT maintenance districts chose not to undertake in-house training programs that would be focused on district-level concerns and taught by experienced snowplow operators from that district. Implications of the UDOT Study For the past three years, UDOT has been struggling with the same quantitative measures that have challenged ADOT and the ASU research team for the past two years. Their most recent study is moving away from quantitative measures, in favor of qualitative evaluations. As both Arizona and Utah move forward in their respective training programs, it will be useful to continue to “compare notes” along the way. Iowa DOT In 2006, the Iowa Department of Transportation implemented a snowplow simulator driver training program that in many ways parallels the ADOT program. The DOT is using an L-3 simulator, focusing on driver awareness (via L-3’s SIPDE curriculum), space management, and fuel management. The Iowa DOT commissioned a study through Iowa State University’s Center for Transportation Research and Education (CTRE) that was designed to: 1) assess the use of

19
this simulator as a training tool, and 2) examine personality and other characteristics associated with being an experienced snowplow operator. The research component is conducted by psychology faculty members Professor Derrick Parkhurst and Professor Veronica Dark. The Iowa simulator is transported in a trailer among the six maintenance districts in the state. Each maintenance district has the simulator for about three weeks, and the DOT intends to eventually offer simulator training for all 1,144 drivers in the districts. As of September 2006, 250 drivers, as well as 200 during the initial study, had been trained in three-hour sessions. The drivers are trained in groups of two by local trainers who were brought together for a common train-the-trainer program. All trainers are experienced snowplow drivers selected by their maintenance districts. Since the Iowa DOT is moving to automatic transmission trucks and shifting is not as much of a factor, the fuel management program focuses on reducing idling of all trucks. In the training program a hypothetical situation is presented. If all 900 of Iowa DOT’s snowplow trucks would idle for two hours, at a cost of about $5.90 per truck, the resulting cost to the department would be $5,310. If all trucks reduced idling by one hour, expectations are that as much as 1,000 gallons of fuel could be saved. At $2.95 per gallon, this could add up to as much as $2,950 savings for the state. Other measures are also being taken to reduce fuel consumption. The Iowa team has not yet completed their interim report on the simulator training as of this writing, but the response from its operators has been enthusiastic — particularly among recent hires. Snowplow operations are supplemented with part-time operators and other DOT field staff via a shared worker program. These part-time drivers, in particular, may benefit from the simulator-training program. The past training programs at the Iowa DOT for their snowplow operators have consisted of training videos on DVD, and training conducted by the local garages. The plow drivers are also required to take a defensive driving course every three years provided by the Iowa Highway Patrol. Experienced drivers expressed concern that the simulator-training program does not resemble the real world because it does not have plow or sander controls. One of the project coordinators from the Iowa DOT, Jim Dowd, emphasizes to trainees that it is just a simulator, and is not intended to mirror the real world. “In the simulator we focus on what the drivers need to be aware of while operating a snowplow such as traffic, lane position and road side obstructions. The other facets of operating a snowplow can be learned while riding with an experienced operator during a winter storm.” He and others felt that all could benefit from the space management and the SIPDE training programs (J. Dowd, personal communication, August 2006). Implications of the Iowa DOT Study Since the training program is so similar to the Arizona study, future feedback from Iowa may prove valuable to ADOT (although direct comparisons between the two programs will likely be few, since the Iowa study does not include the same metrics as the current Arizona study). The research looking into the physical responses of drivers will provide

20
useful information that is not being collected by the Arizona study. In addition, the relative success of the program in reducing idling will also be valuable information for trainers and Equipment Services in ADOT.
Summary of Other DOT Studies All three of the studies outlined in this chapter are optimistic about the potential of simulator training as a part of an overall department of transportation driver training program. Although none of the studies demonstrates external validity, this may be more a result of the research design than the actual validity of the driving simulator. It is also interesting to note that both the PennDOT and the first UDOT studies use strictly quantitative approaches, whereas the current Arizona study combined quantitative and qualitative approaches (an approach adopted by UDOT for their most recent study). This “mixed method” approach has helped to shed some much-needed light on the external validity of the simulator (and the knowledge transfer associated with the simulator training program), and the impact of the simulator on the overall ADOT training program.
21
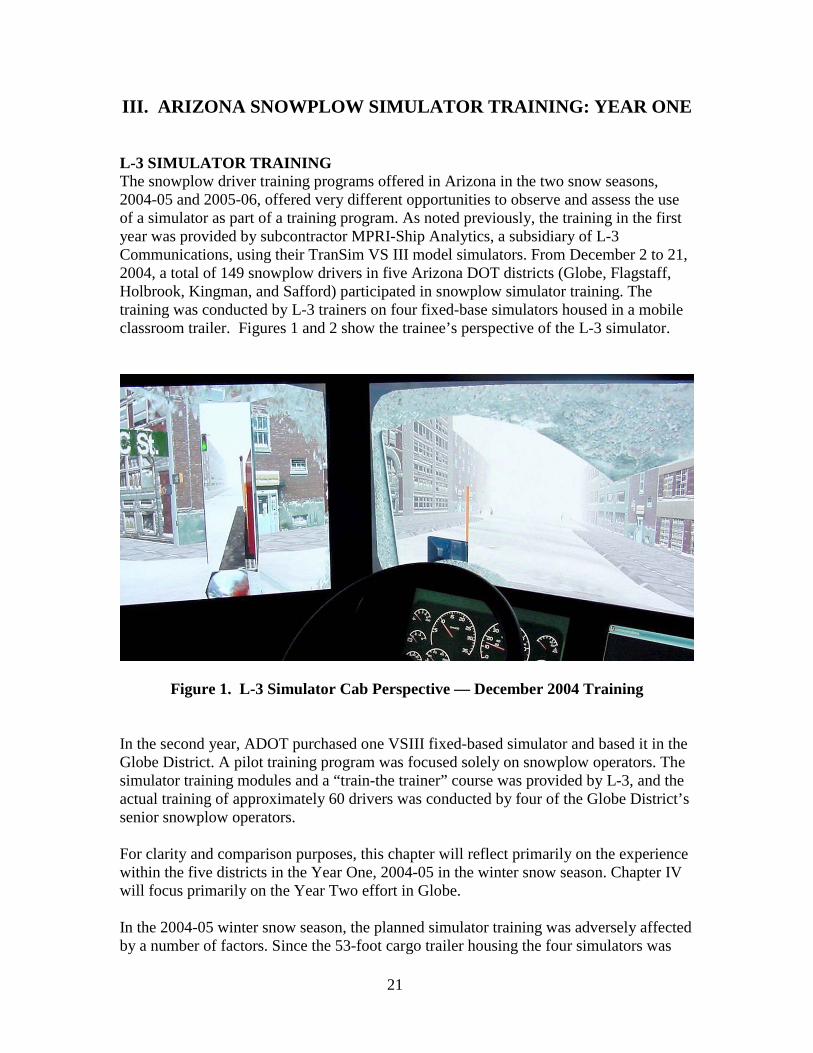
III. ARIZONA SNOWPLOW SIMULATOR TRAINING: YEAR ONE L-3 SIMULATOR TRAINING The snowplow driver training programs offered in Arizona in the two snow seasons, 2004-05 and 2005-06, offered very different opportunities to observe and assess the use of a simulator as part of a training program. As noted previously, the training in the first year was provided by subcontractor MPRI-Ship Analytics, a subsidiary of L-3 Communications, using their TranSim VS III model simulators. From December 2 to 21, 2004, a total of 149 snowplow drivers in five Arizona DOT districts (Globe, Flagstaff, Holbrook, Kingman, and Safford) participated in snowplow simulator training. The training was conducted by L-3 trainers on four fixed-base simulators housed in a mobile classroom trailer. Figures 1 and 2 show the trainee’s perspective of the L-3 simulator.
Figure 1. L-3 Simulator Cab Perspective — December 2004 Training In the second year, ADOT purchased one VSIII fixed-based simulator and based it in the Globe District. A pilot training program was focused solely on snowplow operators. The simulator training modules and a “train-the trainer” course was provided by L-3, and the actual training of approximately 60 drivers was conducted by four of the Globe District’s senior snowplow operators. For clarity and comparison purposes, this chapter will reflect primarily on the experience within the five districts in the Year One, 2004-05 in the winter snow season. Chapter IV will focus primarily on the Year Two effort in Globe. In the 2004-05 winter snow season, the planned simulator training was adversely affected by a number of factors. Since the 53-foot cargo trailer housing the four simulators was

22
newly-built and moved from site to site, troublesome network and power system delays occurred. To further complicate matters, some of the simulators weren’t continually operational at all five of the districts’ training sites due to hardware and software issues. As a result, the various drivers experienced a range of from 15 minutes to 45 minutes of “seat time” in the simulator. The basic Year One Driver Awareness training took place in December 2004, but the northern Arizona snow season had arrived early, and as a result of storm activity, some plow drivers selected for the training simulator training class were unable to attend. As a result, the 2004-05 simulator training had less impact than expected as a “refresher course” that would help to increase awareness of snowplowing issues, even for the most experienced drivers. Nevertheless, despite the many challenges, simulator training was conducted in the five study districts, as planned, and all participating drivers received 2-1/2 hours of training, including a combination of “seat time” and classroom training.
Figure 2. Two of Four L-3 Simulators — December 2004 The ASU team members observed the simulator portion of the Year One training program, as well several full training sessions in Globe in Year Two.
23
In both years the classroom portion of the fall snowplow driver training program emphasized a defensive driving model called SIPDE (Search, Identify, Predict, Decide, and Execute). Each element of SIPDE was explained in some detail, and examples were used to illustrate each point. As indicated, simulator scenarios were used to reinforce the elements of the curriculum. For example, during an “in-town” scenario, trainees were required to search for pedestrians (behind parked cars, in some cases), identify most significant hazards in a particular situation (the school bus in front vs. the motorist speeding past on the left), and so forth. In addition to teaching the SIPDE model, the classroom presentations also included sections on space management, speed management and stopping distance, and crew communications. To add greater realism, the trainers in the Globe District had the option of adding whiteout and/or nighttime conditions. The following simulator scenarios were observed:1 • Snow-covered freeway — trainees begin driving on a snow-covered portion of
freeway, and stop driving after a couple of minutes. The purpose is to get trainees familiar with the simulator’s look and feel.
• Mountain pass with tunnel — trainees begin driving down a steep mountain grade at night, and come upon a tunnel. The purpose is to raise awareness of speed control and space management.
• Parking lot — trainees drive from a parking lot out onto a road, and contend with a garbage truck attempting to pull out onto the same road (possibly in front of the trainee). The purpose is to get trainees thinking about other drivers on the road.
• High country driving — trainees drive along a snow-covered highway, while deer move close to the highway. The purpose is to raise trainees’ awareness of potential distractions/dangers.
• In-town driving — trainees navigate through a downtown area, contending with school buses, pedestrians, and other motorists. The purpose is to raise trainees’ awareness of potential distractions/dangers, as well as particular policy issues.
In Year One, although most drivers were intrigued by the simulator, their brief exposure would have had a limited effect on their driving performance. The overwhelming proportion of participating drivers wanted more time in the simulator. A year later, a follow-up survey with multiple districts indicated that 55 percent of drivers who participated in Year One training — but not Year Two — were still anxious for more simulator training. ASSESSMENT APPROACH In assessing the effectiveness of the snowplow simulator training in Arizona, the primary group involved obviously was the snowplow drivers. The most important factors are: • Driver response to the simulator training approach.
1 This list is based on the recollection of ASU observers—it is not meant to be all-inclusive, but representative of the scenarios experienced by drivers during the training sessions.

24
• Driver perspective on the simulator’s value as a training tool.
• The content of the program in augmenting the ride-along training approach.
• The integration and reinforcement of other training programs with the simulator training.
To assess this perspective, in Year One the research team:
• Reviewed the end-of-session survey administered by the L-3 trainers in 2004
• Conducted more in-depth surveys of participant drivers in February 2005. In 2006, an additional survey was sent to the districts that had participated in the Year One training to help to gage recall of the simulator experience.
• Conducted a series of driver-trainee focus groups at the end of the 2004-05 winter season in all five participating districts.
• Interviewed district maintenance supervisors in 2004-05 to learn about their perspective on the success of a training program.
Based on an assessment of findings generated by the focus groups, and subsequent interviews in 2005, team members prepared a Driver Behavior Model (see Table 6) that was refined in Year Two. RESULTS L-3 Survey Response Immediately following the training sessions conducted in each of the five participating districts in 2004, the L-3 team offered a brief survey questionnaire asking whether the participants thought the training was worthwhile, and requesting their comments on the training process. Overall, 88 percent of the respondents thought that their training was worthwhile. In one district, 97 percent of the respondents checked the positive response, “agree,” on all questions. Comments included “Simulator was great;” “Great class, will be of great benefit;” “Setup was great;” “Class has a lot of good information.” The overwhelming proportion of those respondents (83 percent) felt, however, that more simulator time was needed. This level of enthusiasm was anticipated, since the drivers had participated in a new form of training and met in small groups, giving them the opportunity to interact with each other and one-on-one with professional trainers. As note earlier, Hesketh (1997, p. 328) calls these types of surveys “smile sheets,” arguing that they provide short-term positive impressions rather than an indication of potential application of training to the real world. Follow-Up Survey Responses In mid-snow-season, in February 2005, the ASU team launched another survey of all drivers who had participated in the 2004-05 snow season training. The objective was to gain more information on specifics of the training program from the perspective of the drivers (that survey questionnaire is included in Appendix A). Of the 149 drivers who participated in the L-3 training in December 2004, 109 returned these surveys, for a 74 percent response rate.
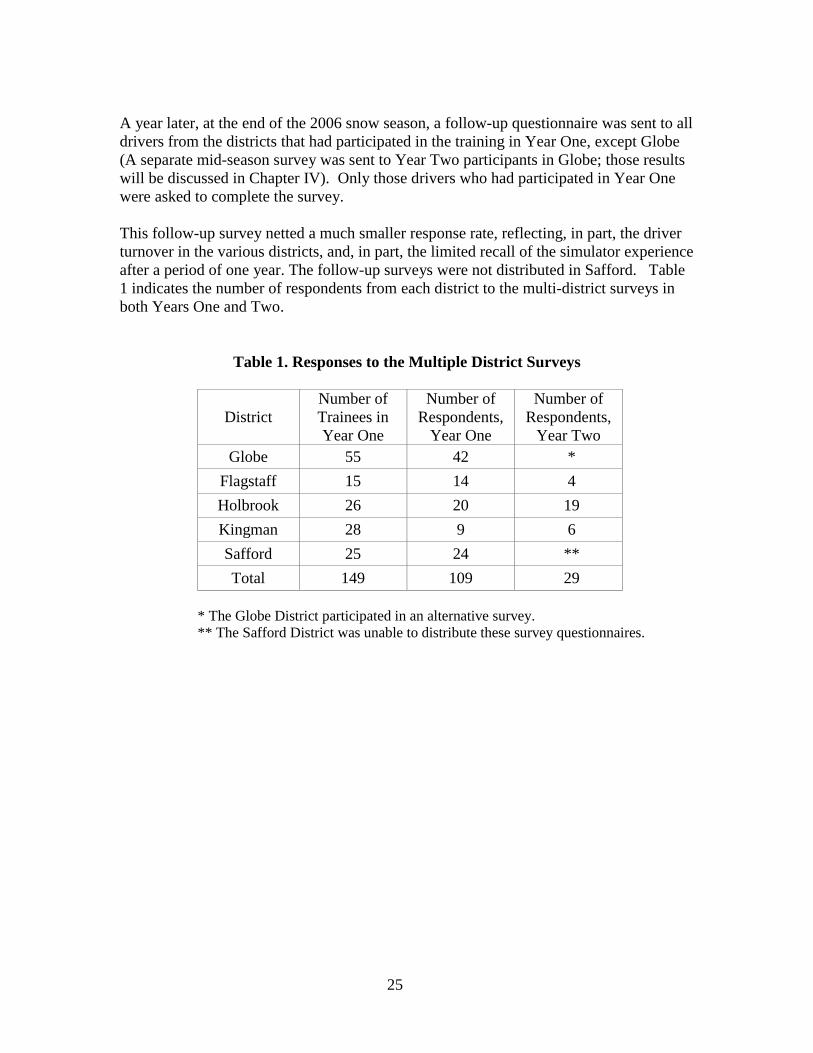
25
A year later, at the end of the 2006 snow season, a follow-up questionnaire was sent to all drivers from the districts that had participated in the training in Year One, except Globe (A separate mid-season survey was sent to Year Two participants in Globe; those results will be discussed in Chapter IV). Only those drivers who had participated in Year One were asked to complete the survey. This follow-up survey netted a much smaller response rate, reflecting, in part, the driver turnover in the various districts, and, in part, the limited recall of the simulator experience after a period of one year. The follow-up surveys were not distributed in Safford. Table 1 indicates the number of respondents from each district to the multi-district surveys in both Years One and Two.
Table 1. Responses to the Multiple District Surveys
District
Number of Trainees in Year One
Number of Respondents,
Year One
Number of Respondents,
Year Two Globe 55 42 *
Flagstaff 15 14 4 Holbrook 26 20 19 Kingman 28 9 6 Safford 25 24 ** Total 149 109 29
* The Globe District participated in an alternative survey. ** The Safford District was unable to distribute these survey questionnaires.

26
Year One Mid-Season Survey Respondents Drivers in all age groups participated in the Year One survey, with the largest proportion of the respondents (37 percent) in the 36-45 age group, as is shown in Figure 3.
5.5%
20.2%
37.6%
22.9%
13.8%
0%
5%
10%
15%
20%
25%
30%
35%
40%
45%
50%
< 26 26-35 36-45 46-55 56-65 Age Category
Figure 3. Age Categories of Year One Drivers The survey participants in Year One also reflected a full range of experience in driving snowplows as is indicated in Figure 4.

27
Twenty-one percent had been driving for less than one year, 16 percent for one to two years, 21 percent for three to five years, and 25 percent six to ten years. There were also very experienced drivers. Among those reporting, 17 percent of drivers had been driving snowplows for more than 11 years.
21.3%
15.7%
21.3%
25.0%
7.4%
3.7%5.6%
0%
5%
10%
15%
20%
25%
30%
35%
40%
45%
50%
< 1 1-2 3-5 6-10 11-15 16-20 > 20Drivers' Experience Level (years)
Figure 4. Years of Experience with Driving Snowplows Even the recently-hired snowplow drivers had considerable experience driving other pieces of heavy equipment. There was only one respondent who was new to snowplows, and who also had limited experience with heavy equipment.

28
Drivers in the Year One survey were asked several basic questions about their experience with the simulator.
15.6%
24.8%
31.2%
20.2%
8.3%
0%
5%
10%
15%
20%
25%
30%
35%
40%
45%
50%
Easy Rather Easy Moderate SomewhatDemanding
Demanding
Level of Training "Demand"
Figure 5. Drivers Finding Training Demanding As the graph in Figure 5 shows, more than 28 percent of the drivers felt it was rather demanding to moderately demanding, while 40 percent felt that the simulator training was rather easy or very easy. The rest found the training moderately demanding. This seems to indicate the potential for adding more challenges to the scenarios included in the simulator-training program. In the Year One survey, 48 percent of the drivers rated themselves as “successful” in the simulator training and an additional 22 percent rated themselves “very successful” in the simulator training, as Figure 6 points out.
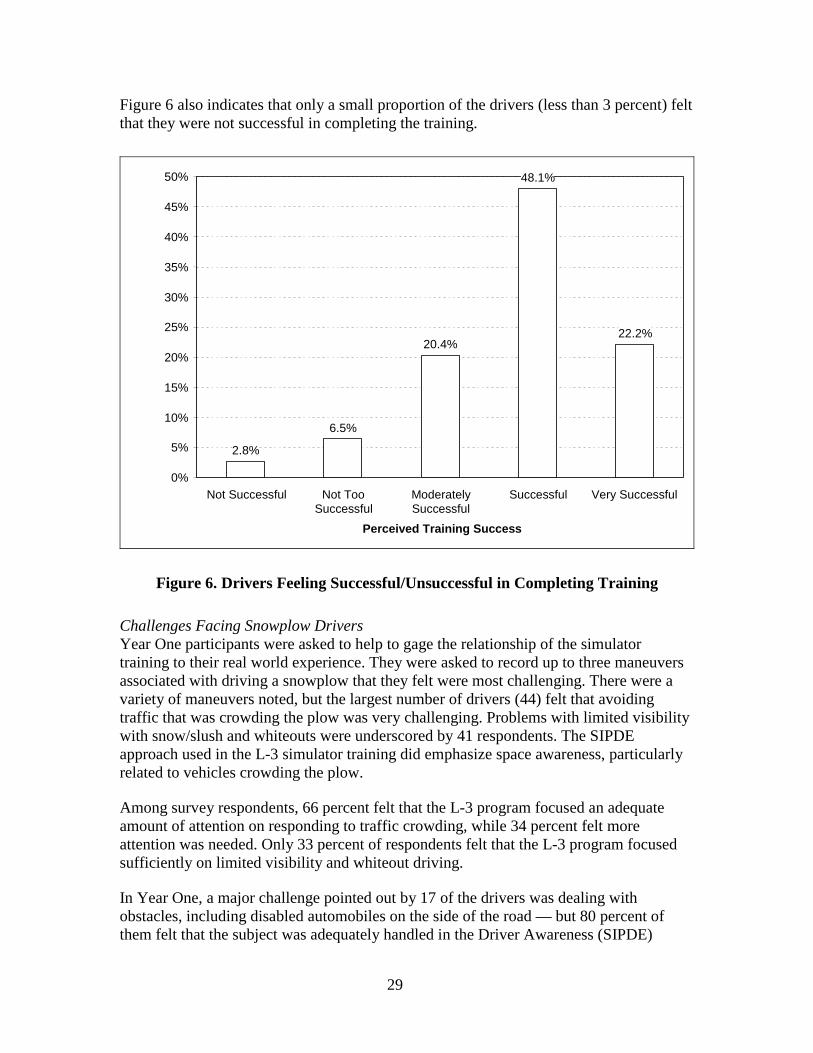
29
Figure 6 also indicates that only a small proportion of the drivers (less than 3 percent) felt that they were not successful in completing the training.
2.8% 6.5%
20.4%
48.1%
22.2%
0%
5%
10%
15%
20%
25%
30%
35%
40%
45%
50%
Not Successful Not TooSuccessful
ModeratelySuccessful
Successful Very Successful
Perceived Training Success
Figure 6. Drivers Feeling Successful/Unsuccessful in Completing Training Challenges Facing Snowplow Drivers Year One participants were asked to help to gage the relationship of the simulator training to their real world experience. They were asked to record up to three maneuvers associated with driving a snowplow that they felt were most challenging. There were a variety of maneuvers noted, but the largest number of drivers (44) felt that avoiding traffic that was crowding the plow was very challenging. Problems with limited visibility with snow/slush and whiteouts were underscored by 41 respondents. The SIPDE approach used in the L-3 simulator training did emphasize space awareness, particularly related to vehicles crowding the plow. Among survey respondents, 66 percent felt that the L-3 program focused an adequate amount of attention on responding to traffic crowding, while 34 percent felt more attention was needed. Only 33 percent of respondents felt that the L-3 program focused sufficiently on limited visibility and whiteout driving. In Year One, a major challenge pointed out by 17 of the drivers was dealing with obstacles, including disabled automobiles on the side of the road — but 80 percent of them felt that the subject was adequately handled in the Driver Awareness (SIPDE)

30
training program. Of the 16 drivers who found city driving a major challenge, 66 percent felt that the subject had been adequately handled in the Driver Awareness training. Challenges that more than 75 percent of the driver respondents felt were not adequately addressed in the simulator training included real-world challenges, such as plowing snow-packed roads, plowing mountain roads with ice, negotiating switchbacks, and plowing more than 10 inches of snow. Reversing the plow, determining appropriate speed, and driving along shoulders were also were underscored by 50 percent of the drivers as needing more attention in the simulator training program. A variety of other issues were also identified in the 109 surveys returned in spring 2005. Many of these related to specific issues associated with controls on the plow, such as those used for wing plow and spreader operation. These operational issues were not covered in the basic SIPDE - Driver Awareness simulator training. Drivers were asked on the Year One survey whether the simulator training had responded to their needs. The following table documents their responses.
Table 2. Drivers Finding Simulator Training Met Their Needs
Years Driving Perceived Responsiveness of
Simulator Training (%) Total Plow Yes Partially No
< 1 year 41.0 31.8 27.2 100 (22)
1-2 years 35.3 41.1 23.6 100 (17)
3-5 years 61.0 26.0 13.0 100 (23)
6-10 years 37.5 54.2 8.4 100 (24)
11-15 years 37.5 50.0 12.5 100 (8)
16-20 years 50.0 25.0 25.0 100 (4)
> 20 years 40.0 60.0 0.0 100 (5)
Total 43.6 (45)
39.9 (41)
15.5 (17)
100 (103)
Note: Figures in parentheses are raw numbers of survey respondents in each category (not all drivers answered all questions).
Drivers’ Recollections Of Training The primary recollections of 17 percent of drivers responding to the ASU Year One survey — administered six weeks after the simulator training — was that drivers were to be aware of surroundings when driving, and they were to choose the right speed when driving. Both subjects were heavily emphasized in the Driver Awareness training

31
program. In fact, increasing space awareness was the fundamental point made in the Driver Awareness training program. Eleven percent of the drivers recalled an emphasis on safety concerns, and 13 percent reported that they were instructed to drive a safe distance from other vehicles. There were other responses noted by a small group of respondents, and a substantial number of drivers left the question unanswered. Differences Between New And Experienced Drivers There were differences between the attitudes of experienced and less experienced drivers toward the simulator. Among the new drivers, 41 percent felt that the Driver Awareness simulator training addressed their needs, and 32 percent felt that it had partially responded to their needs. Another 27 percent of the new drivers, however, felt that the simulator training did not meet their needs. Like their more experienced colleagues, they underscored visibility and whiteout issues as their primary concern, but they were also concerned about safe braking distance, avoiding conflicts with tractor-trailers, avoiding guardrails, turning the plow, controlling the plow, stopping the plow, and staying in their lane with snow-pack conditions. Some were concerned about driving on mountain roads with switchbacks. Other issues involved plow lighting and wing plow operation. About 45 percent of the 109 respondents to the Year One mid-year survey felt the simulator training should focus on less experienced drivers, but 55 percent said that it should be directed to all drivers. Among those drivers hired by ADOT in the last two years, 60 percent said that the training should focus on all drivers, and only 40 percent of them felt that it should focus on new hires. Among drivers with three to five years experience, 74 percent agreed that the simulator training should be for all drivers. Conversely, 60 percent of the more experienced drivers (with more than five years of experience) felt that the Driver Awareness simulator training should be focused on less experienced drivers. In Year Two, drivers from Flagstaff, Kingman and Holbrook Districts were asked what they recalled from the simulator training the year before. As Table 3 shows, of the 19 respondents who indicated that they recalled the simulator-training course, nine recalled a focus on safety, six recalled the emphasis on being alert and aware, and four recalled an emphasis on speed related issues.
Table 3. Driver Recall of 2004 Simulator Training - as Reflected in 2006 Follow-Up Survey
Training
Issue Number of
Respondents Percentage of Total Respondents (%)
Awareness 6 32 Safety 9 47 Speed 4 21 Total 19 100
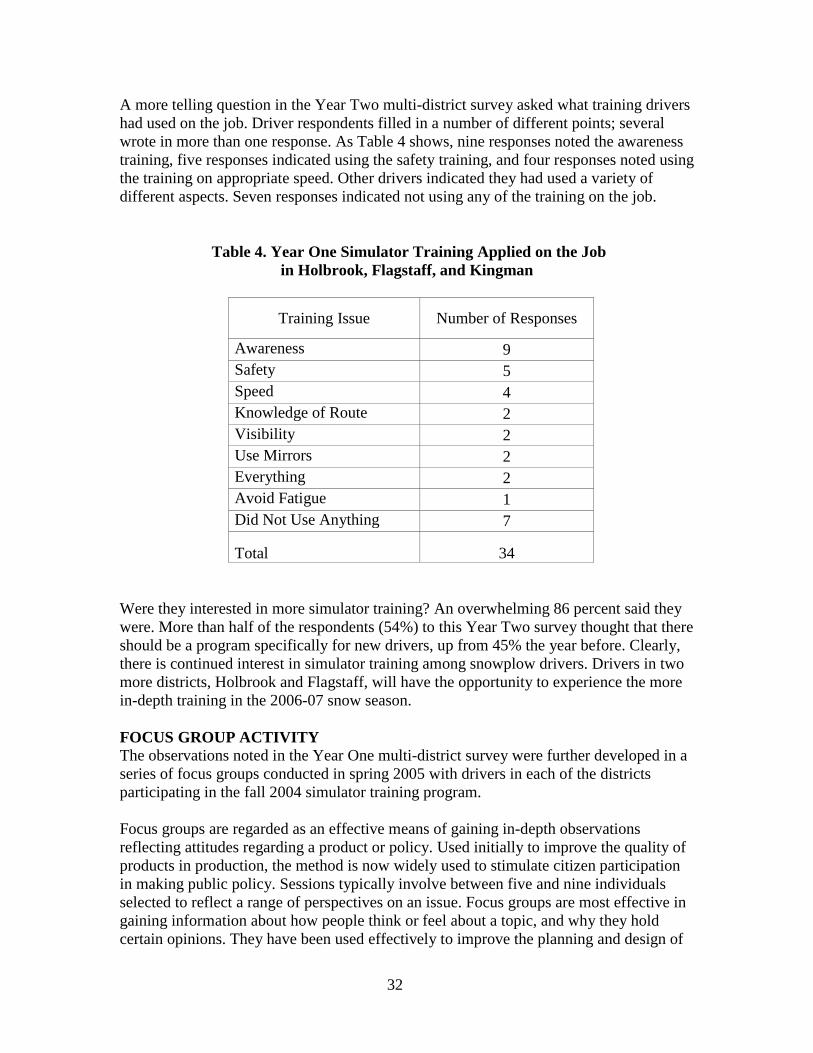
32
A more telling question in the Year Two multi-district survey asked what training drivers had used on the job. Driver respondents filled in a number of different points; several wrote in more than one response. As Table 4 shows, nine responses noted the awareness training, five responses indicated using the safety training, and four responses noted using the training on appropriate speed. Other drivers indicated they had used a variety of different aspects. Seven responses indicated not using any of the training on the job.
Table 4. Year One Simulator Training Applied on the Job in Holbrook, Flagstaff, and Kingman
Were they interested in more simulator training? An overwhelming 86 percent said they were. More than half of the respondents (54%) to this Year Two survey thought that there should be a program specifically for new drivers, up from 45% the year before. Clearly, there is continued interest in simulator training among snowplow drivers. Drivers in two more districts, Holbrook and Flagstaff, will have the opportunity to experience the more in-depth training in the 2006-07 snow season. FOCUS GROUP ACTIVITY The observations noted in the Year One multi-district survey were further developed in a series of focus groups conducted in spring 2005 with drivers in each of the districts participating in the fall 2004 simulator training program. Focus groups are regarded as an effective means of gaining in-depth observations reflecting attitudes regarding a product or policy. Used initially to improve the quality of products in production, the method is now widely used to stimulate citizen participation in making public policy. Sessions typically involve between five and nine individuals selected to reflect a range of perspectives on an issue. Focus groups are most effective in gaining information about how people think or feel about a topic, and why they hold certain opinions. They have been used effectively to improve the planning and design of
Training Issue Number of Responses
Awareness 9 Safety 5 Speed 4 Knowledge of Route 2 Visibility 2 Use Mirrors 2 Everything 2 Avoid Fatigue 1 Did Not Use Anything 7 Total
34

33
new programs and evaluating existing programs. They can also be used to determine whether a program is responding to individual or group needs, and what might help to make it more effective in reaching those needs (Krueger, 1994; Marcazak & Sewell, 2002; Morgan, 1988). The small group format enables all participants to be heard, and encourages all to share their ideas. Group dynamics contribute to the level and range of discussion as participants build upon the ideas presented by others. An objective facilitator encourages all to participate actively, keeps the discussion on target, and moves the discussion through an established agenda. Recorders note all observations. Discussions are taped and transcripts are made available for later assessment. Focus Group Sessions With Snowplow Drivers During the period of April 26 to May 24, 2005, the ASU research team conducted five focus group discussions with those who had participated in the first simulator training in December 2004 in Globe, Kingman, Flagstaff, Holbrook, and Safford. The objective was to gain the perspective of snowplow drivers on the L-3 simulator-training program. What emerged from the focus groups was a wealth of information not just on the specific simulator training, but also a fuller understanding of the multi-tasking aspect of driving and the challenging weather environment faced by snowplow drivers. Since drivers were also asked in the focus groups to design a simulator program that would meet their needs, a clearer idea of needs and expectations also emerged. In Year One, parallel focus group discussions with drivers who had not been simulator trained also proved to be valuable. These “control groups” helped to gain a clearer idea of the traditional training process and issues that they felt should be addressed in simulator training. In Year One, follow-up discussions were conducted with ADOT maintenance engineers, maintenance superintendents, and ORG supervisors, where possible. In Year Two, all ORG supervisors in the Globe District participated in a separate focus group and offered their expectations and assessment of the simulator programs.
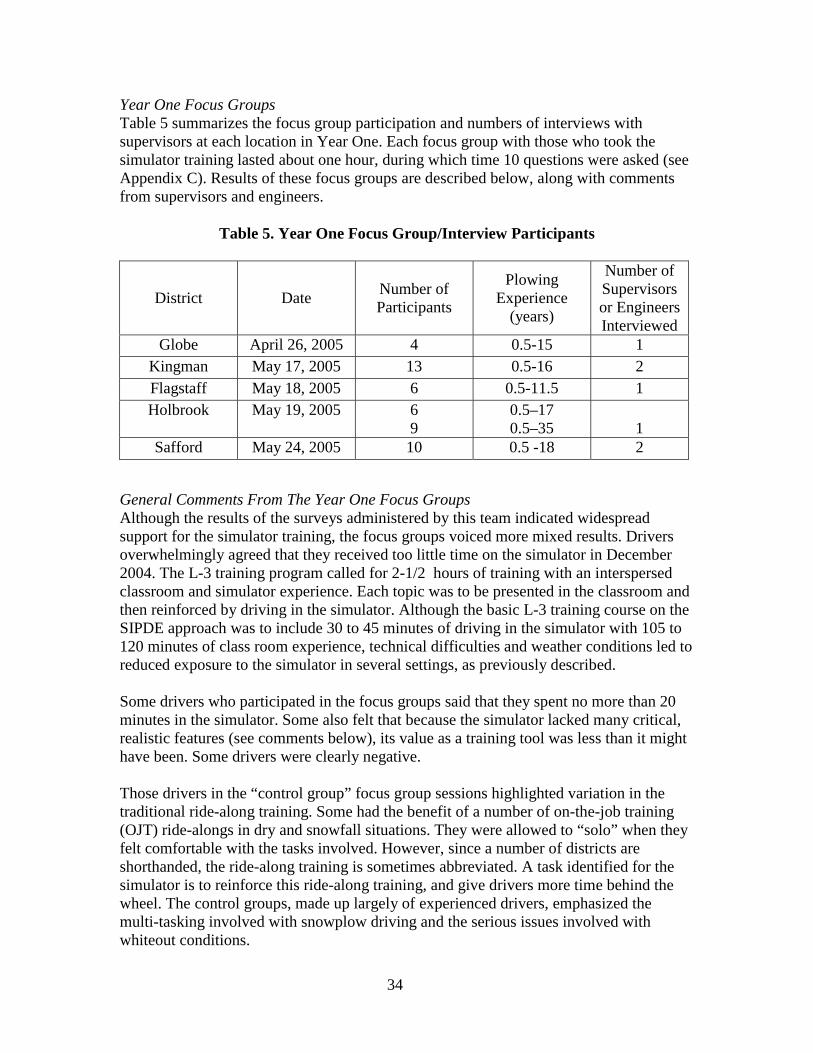
34
Year One Focus Groups Table 5 summarizes the focus group participation and numbers of interviews with supervisors at each location in Year One. Each focus group with those who took the simulator training lasted about one hour, during which time 10 questions were asked (see Appendix C). Results of these focus groups are described below, along with comments from supervisors and engineers.
Table 5. Year One Focus Group/Interview Participants
District Date Number of Participants
Plowing Experience
(years)
Number of Supervisors or Engineers Interviewed
Globe April 26, 2005 4 0.5-15 1 Kingman May 17, 2005 13 0.5-16 2 Flagstaff May 18, 2005 6 0.5-11.5 1 Holbrook May 19, 2005 6
9 0.5–17 0.5–35
1
Safford May 24, 2005 10 0.5 -18 2 General Comments From The Year One Focus Groups Although the results of the surveys administered by this team indicated widespread support for the simulator training, the focus groups voiced more mixed results. Drivers overwhelmingly agreed that they received too little time on the simulator in December 2004. The L-3 training program called for 2-1/2 hours of training with an interspersed classroom and simulator experience. Each topic was to be presented in the classroom and then reinforced by driving in the simulator. Although the basic L-3 training course on the SIPDE approach was to include 30 to 45 minutes of driving in the simulator with 105 to 120 minutes of class room experience, technical difficulties and weather conditions led to reduced exposure to the simulator in several settings, as previously described. Some drivers who participated in the focus groups said that they spent no more than 20 minutes in the simulator. Some also felt that because the simulator lacked many critical, realistic features (see comments below), its value as a training tool was less than it might have been. Some drivers were clearly negative. Those drivers in the “control group” focus group sessions highlighted variation in the traditional ride-along training. Some had the benefit of a number of on-the-job training (OJT) ride-alongs in dry and snowfall situations. They were allowed to “solo” when they felt comfortable with the tasks involved. However, since a number of districts are shorthanded, the ride-along training is sometimes abbreviated. A task identified for the simulator is to reinforce this ride-along training, and give drivers more time behind the wheel. The control groups, made up largely of experienced drivers, emphasized the multi-tasking involved with snowplow driving and the serious issues involved with whiteout conditions.

35
Drivers who had participated in simulator training generally agreed that even the small amount of simulator experience they received in December 2004 did raise their level of awareness. According to the drivers, the simulator training “opens your eyes” and “makes you think.” On this point, the supervisors and engineers interviewed agreed. One noted that although some more-experienced drivers thought the simulator was “cheesy,” some of them did crash during the driving scenarios due to poor decisions. While these skeptical drivers may not have realized the benefits of the simulator training, they (apparently) were learning, nonetheless. Of course, the timing of such “eye openers” is critical. In the 2004-05 snow season, because of early snow fall and some delays in the simulator training, drivers had already been plowing snow before they received the simulator training. There was also general optimism for the potential of a driving simulator (although this optimism was not unanimous). Focus group participants repeatedly expressed their desire for a more “realistic” simulator, one that would better meet their needs as a training tool. It should also be noted that some drivers who expressed rather negative opinions of the simulator itself, had nothing but praise for the classroom portion of the training (i.e., the SIPDE method used by the L-3 trainer). Drivers specifically mentioned the emphasis on safe following distance and speed-awareness considerations as particularly useful. Drivers (and supervisors) had plenty of suggestions for how the simulator might be modified and incorporated into the ADOT driver-training program, as described in the following sections. Year One Consensus In Year One, drivers repeatedly cited the simulator’s lack of realism as its single greatest shortcoming. According to these drivers, the designers of the simulator needed to “ride-along” in plow trucks under severe conditions in Arizona. The general consensus was that the people designing the L-3 simulator were not aware of the severe real-world conditions with which Arizona plow drivers regularly contend. When drivers were asked which features they would include if they could design the simulator themselves, their responses most often had to do with realistic controls and displays. As one driver put it, “make it as real as you can make it.” Another summed up the feelings of many when he said, “if we’re gonna be in the simulator, it better match our trucks.” Among the many features requested, it was expressed that the simulator should incorporate the following operational features: • Plow controls (which vary according to the various truck interiors). • Vehicle instruments (radio, defroster, etc.). • Gear shifting (according to one driver, this was quite difficult to learn, and distracted
him from the many other more critical — and potentially dangerous — tasks). This was addressed in the Fuel Management training described in Chapter VII.

36
• Spreader controls (there are at least three different types in use, and as one driver noted, the learning curve associated with the spreader controls is actually steeper than that of the hydraulic plow controls).
• Washer fluid control/meter (according to the drivers, this is something you forget only once — it’s that important).
• Road temperature gauge (which is used to make critical decisions about when to apply de-icer and in what quantity).
Essentially, what these drivers wanted was an actual truck cab, with changeable controls (e.g., different spreader controls, hydraulic levers, etc.). Some simulators on the market do use actual vehicle cabs, but are generally the much more expensive motion-base units. Visibility — or the lack thereof — was perhaps the area of greatest criticism for the Year One training simulator. According to the drivers, this is the single most stressful part of the job — the fact that visibility is often so poor that it is impossible to determine which side of the road one is actually driving on. The overwhelming consensus was that in all simulator scenarios the visibility was far too good, compared to real-world snowplow driving conditions. According to the drivers, environmental conditions should be more severe (e.g., darker nighttime driving, more blinding whiteouts, etc.). In addition, vehicle-related visibility conditions should also be more severe (e.g., frosted/fogged up windshields, frosted mirrors, frozen wipers, etc.). Some of these changes were incorporated into the Year Two simulator experience. Driving Scenarios A variety of more appropriate driving scenarios was also an important consideration for the drivers who participated in the focus groups. Drivers on rural routes, for example, saw limited benefit in the “in town” scenarios that were part of the December 2004 SIPDE training program. Likewise, drivers who never plow highways said that they learned little from the highway portions of the simulator training. Drivers consistently reported that they would like to see simulator scenarios that reflect the actual ADOT routes with which they are familiar — especially those considered particularly hazardous. They suggested several scenarios that would be more beneficial, including: • Cars passing on both sides of the plow truck; according to drivers, large trucks will
often pass at high speed. • Predictable road hazards (railroad tracks, expansion joints, cattle guards, etc.) that are
generally known on familiar routes are potentially dangerous on unfamiliar routes. • Unexpected road hazards (e.g., snow-covered rock in a curve). • “Getting sucked into the cut” (driving slightly off the shoulder of the road — and
struggling to get the vehicle safely back onto the road surface). • Various weather and road conditions, other than snow (e.g., rain, sleet, hail, black ice,
etc.); also weather changes based on temperature (air and road), altitude, etc.2
2 It was interesting to note that drivers often use the skies to determine their approach to de-icing. If the skies begin to clear up, for example, they know that the temperature will soon drop and it is important to put down anti-icing chemicals before the road surface freezes.

37
For many drivers, the feeling of the simulator didn’t reflect the real world. For example, although the simulator included downhill scenarios, there was no feeling of going downhill; only visual input was available to indicate the pitch angle of the truck (as the simulator used was a fixed-base model). As it turns out, drivers often use senses other than visual for driving and plowing in the winter season. Drivers generally “shift by ear,” for example, using the sound of the engine rather than the tachometer to judge engine speed. More experienced drivers can often smell the carbide wear bits when friction levels are high, and thus make adjustments (e.g., raise the plow slightly) that will prolong the life of the bits. And many drivers reported a variety of “drive by feel” tactics (using rumble strips as a way to find the shoulder of a snow-covered road, gently riding the guardrails with the edge of the plow blade to maintain consistent lane position, etc.). All of these tactics are important aspects of the snowplowing activity, and yet none was incorporated into the simulator scenarios used in the 2004-05 training period, due to current software and hardware limitations. Distractions In addition to the various individual features and driving scenarios requested, the drivers were very clear that snowplow operation is a continuous series of “distractions.” A driver may be struggling to clear the windshield while downshifting, answering a radio call, and monitoring the temperature gauge, for example. In the real world, no single driving activity happens independently. By contrast, as one driver pointed out, “there [are] just absolutely no distractions in the simulator.” The “distractions” are what make the snowplowing job so demanding — and so rewarding for these drivers. One driver talked about the overall soreness he feels after long shifts plowing snow, while many drivers talked about the fatigue that comes with such severe driving demands. Drivers were quite skeptical that driving fatigue could be simulated, but suggested that it would be an important aspect of realistic driving simulation. Some drivers suggested that it would be useful to begin simulator scenarios in a very simple form, and add more distractions as the trainee becomes more comfortable and more expert. Of course, this is similar to what was done in December 2004. What was lacking was the wide range of distractions that could be included. Interestingly, this corresponds closely to what is called “part training,”3 in which a whole task is mastered by learning its constituent (and presumably, more easily learned) “parts.” Time In The Simulator Drivers were asked how much time they thought should be spent in the simulator — assuming the simulator could be “improved” to reflect their suggestions. Responses varied widely, from a low of 15 minutes to a high of five hours. The majority of the drivers suggested a four-hour training program would be appropriate. Inexperienced Drivers The general consensus in Year One was that new drivers would benefit from more time in the simulator, while experienced drivers would require only a brief pre-winter 3 See, for example, Goldstein, I. L. (1986). Training In Organizations: Needs Assessment, Development, And Evaluation (2nd ed.). Monterey, CA: Brooks/Cole Pub. Co.

38
“refresher.” However, it is interesting to note that these same drivers also suggested that even the best drivers might have serious problems in severe conditions (e.g., nighttime whiteout), so experience is not necessarily an adequate predictor of success (in the simulator or the real world). Also of interest, the driver responses were quite different from those of the supervisors on this point. Some supervisors suggested that up to 40 hours of training may be useful, while emphasizing its importance for new drivers. Supervisor Perspective In Year One In general, the maintenance engineers, maintenance superintendents, and ORG supervisors were optimistic about the potential benefits of the driving simulator. Although they saw much room for improvement (their comments regarding the need for greater realism echoed those from the drivers), they recognized that the simulator — despite its shortcomings — is effective at “getting [drivers] to think about things.”4 Part of the simulator’s potential benefit lies in its ability to generate scenarios that become increasingly difficult, eventually approaching the real-world hazards of snowplowing. There are benefits to making the simulator “difficult.” According to one supervisor, if a driver goes into a curve too fast, he ought to lose control and crash. This would illustrate the importance of thinking and planning ahead for drivers. One supervisor suggested that he would be very pleased if drivers crashed quite frequently in the simulator, and were (as a result) accident-free on the road. Simulator training may be even more important in states like Arizona where snowfalls are less frequent. Here, even a five-year veteran ADOT driver may have seen only a dozen significant snowstorms. In one ORG, a driver noted that he only plowed twice last snow season and felt really out of practice. Effective simulator training would keep drivers fresh. Also, it was reported that some newer drivers prefer not to plow snow, since they are intimidated by the difficulties associated with the job. However, it was suggested that if these drivers were prepared somewhat by the simulator, this issue might be diminished. TASK ANALYSIS DRIVER BEHAVIORAL MODEL Based on the Year One snowplow operator focus groups conducted in Globe, Kingman, Flagstaff, Holbrook, and Safford, the various “operator activities” were sorted into five major categories: inspecting, communicating, driving, plowing, and spreading. Michon’s (1985) driving model was used as a framework into which each activity could be placed (see Table 6). The description of Michon’s driving model provided by Wickens, Gordon, & Liu (1998) is especially useful, and worth quoting fully:
Three levels of activity describe the complex set of tasks that comprise driving— strategic, tactical, and control [STC model]… Strategic tasks focus on the purpose of the trip and the driver’s overall goals; many of these tasks occur before we even get into the car. Strategic tasks include the general process of deciding where to go, when to go, and how to get there… Tactical tasks focus on the choice of
4 This may be related to Michon’s hierarchy of driving skills: Strategic, Tactical, and Operational levels. See Michon, J. A. (1985). A Critical View of Driver Behavior Models: What Do We Know, What Should We Do? In Human Behavior and Traffic Safety (pp. 485-520), Plenum Press. See Table 6 for details.

39
maneuvers and immediate goals in getting to a destination. They include speed selection, the decision to pass another vehicle, and the choice of lanes… Control tasks focus on the moment-to-moment operation of the vehicle. These tasks include maintaining a desired speed, keeping the desired distance from the car ahead, and keeping the car in the lane. (p. 438)
This type of STC analysis provides a necessary framework for evaluating which skills are best trained in the simulator, and which skills are better trained using other means (and how different skills may be transferred to the real world), as described in Chapters VIII and IX. It is also useful for evaluating training programs and policies related to snowplow operations. For example, the Strategic level corresponds to ADOT’s snow policies, as they relate to the larger ADOT mission. The simulator can be used to ensure that Tactical- and Control-level skills and behaviors correspond with ADOT snow policies. Table 6 illustrates this framework.

40
Table 6: Snowplow Operator Activities and Michon’s5 Driver Behavior Model
Levels of Driving Skills Activities of Snowplow Operators
Strategic (Planning)
Tactical (Maneuvering)
Control (Operational)
Inspecting (pre & post trip; & while plowing)
N/A N/A • Vehicle (hydraulic lines, tires, lights, etc.) • Snow removal equipment (wear bits, frame bolts, de-icing material, etc.)
Communicating • Broad ADOT policies (e.g., public safety) • District Snow Plan policies • Receive orders from Snow Desk
• Contact other ADOT drivers • Assist other drivers (ADOT, Department of Public Safety (DPS), the public)
• Adjust radio volume • Locate and key radio microphone
Driving N/A • Navigation-Avoidance (other drivers, known objects, unknown objects) • Monitor speed (by ear)
• Navigation-Aim (apply brake and gas pedals, steering inputs, etc.) • Shifting gears and using clutch. • Visibility (heater & defroster controls, wipers, mirrors, etc.)
Plowing N/A • Aiming (height, angle — function of vehicle speed) • Avoidance (expansion joints, railroad tracks, etc.)
• Adjust height and angle of plows (main and wing)
Spreading N/A • Monitor road temperature (gages, weather stations, and skies) • Monitor material (salt or MgCl)
• Adjust spreader controls
5 From Michon, J. A. (1985). “A Critical View of Driver Behavior Models: What Do We Know, What Should We Do?” In Human Behavior and Traffic Safety (pp. 485-520), Plenum Press.

41
IV. SIMULATOR TRAINING - GLOBE DISTRICT: YEAR TWO Year Two Simulator Training As noted previously, the focus of Year Two was on the first ADOT-owned simulator unit, newly installed in the Globe District (Figure 7). In the 2005-06 winter snow season, all drivers in the Globe District had a full four hours of training, with a combination of classroom and simulator seat time. The classes involved small groups of two or four drivers, allowing all trainees to spend about 45 minutes on the simulator. Classroom training time was reinforced, as each driver spent time in the simulator working on three increasingly difficult scenarios. The ASU team members observed several full training sessions in Globe, including both simulator and classroom activities.
Figure 7. Globe Simulator— Fall 2005 Training In spring 2006, the Globe drivers participated in a second simulator training session, which was focused on fuel management and gear shifting. An assessment of that training program is included in Chapter VII of this report. The current chapter focuses primarily on the snowplow driver-training program offered to Globe District crews in fall 2005.

42
Figure 8. Simulator in Use — Hands-on Training Key Changes for Year Two Training The primary change in the Year Two simulator course, as noted previously, was that the training was offered by experienced snowplow drivers from the Globe District. These trainers were able to bring their real-world experience from around the district to the other drivers. Their enthusiasm and willingness to share techniques really made the program come alive for the Globe drivers. The fall 2005 training program in Globe was based on that offered by L-3, but the District trainers made changes in the L-3 PowerPoint course material to better reflect local issues. For example, since there are no freeways in the Globe District, discussions of plowing in the gore points were replaced by references to traffic signals and signs, which are important issues to emphasize in the district’s small communities. Trainees were also urged to be alert to truck load weights and grades, given the narrow, winding mountain roads in the district. In addition to the district-specific issues added to the curriculum, the Year Two training reflected some general issues of concern to ADOT. For example, Globe drivers were urged to follow the CDL checklist in reviewing equipment before operating it. There were also additional slides emphasizing the need for adherence to proper braking techniques and for communication among drivers plowing in tandem.

43
Figure 9. Globe ‘Train-the-Trainer’ Session — August 2005 ASU’s Evaluation Approach As a parallel to the assessment conducted in Year One, the ASU study team: • Reviewed the end-of-session survey conducted by Globe. • Conducted a more in-depth survey of driver participants in the snowplow simulator
study in April 2006 (after a late snow fall). An additional part of that survey related to the fuel management/gear shifting training program, as is discussed in chapter VII.
• Conducted a series of four focus groups at the end of 2005-06 snow season. All participants in the Globe District focus groups had participated in snowplow simulator training.
• Conducted a focus group with representatives from each of the maintenance ORGs in the Globe District.
Driver Awareness Post-Session Exit Survey In 2005, the same exit survey was distributed to driver participants in Globe as had been distributed the year before (Appendix A). The responses were predictably enthusiastic.

44
However, the drivers also seemed to be a bit more discerning, since most of them had also been through the training in 2004. One driver even commented, “This was better than the first time.” Several reported enthusiastically that they appreciated working with the experienced snowplow driver instructors this year. Among the respondents, 58 percent checked “agreed” for every question, a somewhat lower rate than in Year One. However, 88 percent of respondents agreed that the program did convey its primary objective, focusing on awareness and hazard avoidance. Twelve percent felt that the class lecture time was too long, while six percent felt the simulator seat time was too short Several presented ideas for course improvements, such as accounting for the width of the plow in the scenarios, making more scenarios reflect “our routes,” and making more scenarios with “night whiteouts.” Overall, however, the comments were positive. As one driver put it, “This was a well-rounded course. I believe it will be helpful for the upcoming season.” Another added, “This is a very good simulator.” There were those, however, who felt that they did not get enough trainer feedback. ASU Spring 2006 Globe Survey As was indicated previously, in April 2006, a separate survey was sent to snowplow operators in Globe, all of whom had been through the fall 2005 Driver Awareness training program. Among those 61 drivers, 49 returned usable survey questionnaires. This survey instrument (Appendix A) was very similar to the one that was distributed to all districts in Year One. The intention was to note any differences between what was learned in each of the two years, and its potential for application to the real world. As noted, there were several distinct changes in Year Two in Globe in terms of training approaches: using local trainers and providing more classroom and simulator time, for example. Also, the class PowerPoint slides included more references to local conditions in Globe. Globe District participants completing the Year Two questionnaire included drivers with varying levels of expertise in snow removal.

45
As the graph in Figure 10 shows, 45 percent of the respondents had two years’ experience or less, while 10 percent had over 16 years’ experience. The median was about five years’ experience on snowplows. Nevertheless, more than 75 percent of these drivers had more than five years’ of experience in driving various other types of heavy equipment.
18.4%
4.1%6.1%
2.0%
26.6%28.6%
12.2%
0%
10%
20%
30%
40%
50%
<1 Year 1-2 Years 3-5 Years 6-10 Years 11-15 Years 16-20 Years > 20
Experience Level of Drivers (Years)
Figure 10. Years of Experience with Driving Snowplows — Year Two, Globe District

46
Figure 11 shows the age range of drivers in the Globe District in Year Two. There is a slightly lower proportion of younger and of older drivers in the Globe District, as compared with the other districts in Year One. Nevertheless, the largest proportion of drivers is in the 36 to 55 range.
5.5%
13.8%
44.8%
20.2%22.9%
37.6%
20.7%
3.4% 3.4%
27.6%
0%
10%
20%
30%
40%
50%
< 26 26-35 36-45 46-55 56-65 Age of Drivers (years)
Year 1Year 2
Figure 11. Age Categories of Drivers — Globe District The Year Two survey asked drivers in the Globe ORGs to note the aspects of snowplow driving that they found most challenging. They were also asked to note which of these topics had been covered in the simulator training. The chart in Figure 12 presents their collective observations. The white bars indicate the proportion of drivers who identified specific driving challenges, while the dark bars indicate the proportion of respondents who felt those specific challenges were fully addressed in the simulator training program.

47
Drivers felt as though the challenges associated with the weather were addressed, and a number felt issues associated with pedestrians were adequately addressed. Fifteen percent of respondents felt that none of their real-word challenges were addressed, as Figure 12 shows. The concerns that they listed were primarily related to operating the plow itself, and real-world roadway conditions in the Globe District. Neither of those issues is part of the’ awareness’ simulator training program.
19.0%
4.0%
15.0%
9.0%
3.0%
15.0%
5.0%4.0%
5.0%
21.0%
1.5%
5.0%
0.0%
4.0%
8.0%
3.0%
1.5% 2.0%
8.0% 8.0%
0%
5%
10%
15%
20%
25%
Visibilit
yTraf
fic
Pedes
trians
U-Turn
s
Speed
Roadw
ay
Operat
ions
Fatigu
e
Weathe
r
Unreso
lved
Driving Challenges
Challenges Identified
Challenges Met
Figure 12. Challenges Facing Year Two Snowplow Drivers In the Year Two survey, Globe drivers listed very similar real-world challenges to those they had listed on the Year One survey — visibility, dealing with traffic, and roadway conditions (including guard rails, cattle guards, winding mountain roads, and ice on the roadways). Fewer than half of the respondents felt that issues associated with traffic and visibility were adequately addressed. In the future, perhaps more class and simulator time could be devoted to these issues that drivers report as most serious in the real world.

48
The drivers were asked about aspects of the driver simulation training that they had been able to use on the job. Several indicated that they used more than one aspect on the job. The chart in Figure 13 summarizes these observations.
25.9%
3.7% 3.7%
1.9%
3.7%
1.9%
3.7%
5.6%
22.2%
3.7%
5.6%
9.3%
7.4%
0%
5%
10%
15%
20%
25%
Awarene
ss
Speed
Safety
Hazard
s
Center
Line
Get Res
t
Driving
Issu
es
Night D
riving
Revers
ing
Commun
icatin
g
Weathe
r
Everyt
hing
Nothing
Concepts Applied on the Job
Figure 13. Training Concepts Applied on the Job by Year Two Globe Drivers Since drivers were encouraged to list multiple aspects used on the job, the graph will reflect numbers higher than the 49 respondents to the survey. The fact that 26 percent of the responses referred to awareness is understandable, since that was the main focus of the Driver Awareness course. Drivers also mentioned the related issues of safety and hazard avoidance. While 6 percent of the responses indicated that the drivers used all aspects of the course on the job, another 23 percent of the responses indicated that the drivers had not used any of the Driver Awareness (SIPDE) training on the job. They felt that it was not specific enough to address their issues. Of course, it is difficult to gauge how much of the Driver Awareness the drivers actually did use on the job. The researchers only heard anecdotal reports from young drivers who said they had used the training, and that it had made them more confident on the job. The expectation of the trainers is that awareness is so much a part of the job that employing the SIPDE concepts will become almost automatic for the drivers.

49
Most drivers were relatively satisfied with their simulator experience. The majority felt that the four-hour classroom/simulator training in Driver Awareness was adequate. Among the Globe drivers in Year Two, 20 percent found that the simulator training was somewhat demanding, while 36 percent found it not very demanding or not demanding at all. These percentages mirror those for the multi-district survey the year before. Among the Year Two Globe respondents, 98 percent felt that they were relatively successful in the simulator training. The trainers did encourage all participants, by indicating that they were making progress through the scenarios. There was, however, limited individual feedback and no written report to actually confirm the drivers’ perspective about their success in the simulator. Fuel Management Training The Year Two survey also included questions for drivers who had participated in the Fuel Management training course in Globe. More than 50 percent indicated their interest in the gear-shifting portion of the course. However, those driving automatic transmissions could not directly apply the training, unless they were reassigned to a truck with standard transmission or “loaned out” to another district where only a manual truck was available. When asked which aspects of the training they would be able to apply while driving a plow, 48 percent indicated they would use proper shifting techniques. Only 13 percent noted their interest in overall fuel management, and only six percent indicated that they would try to apply fuel management techniques while also dealing with the challenges of driving a plow. Fuel management was actually a secondary emphasis for the course that was primarily focused on driving techniques. A title such as Driving Skills would more accurately describe the course. This training program is discussed in more depth in Chapter VII of this report. Year Two Focus Groups in the Globe District On June 5 and 6, 2006, focus group sessions were conducted in the Globe District. The goal was to gain a perspective on the Year Two simulator training program, which included longer exposure to the simulator, and training programs conducted by experienced snowplow drivers from the Globe District. As noted previously, the training sessions in Globe were four hours in length, and included both classroom time and simulator time (which included three increasingly difficult scenarios). Each driver had a total of about 45 minutes on the simulator in the snowplow Driver Awareness program. Focus group questions about the length of the program seemed to confirm the point made in the mid-year survey that the four-hour program was about the right length. Four focus groups were held with the drivers who had participated in the Globe District simulator training sessions. Two groups included drivers that represented the ORGs closest to Globe, while two other groups represented the ORGs closer to the neighboring town of Show Low. While more of the drivers based around Globe used trucks with automatic transmissions, the majority of drivers in the higher-elevation Show Low region drove trucks with standard transmissions. Each group included six drivers with a mix of new hires and experienced drivers. An additional focus group involved supervisors from all the ORGs in the Globe District.
50
All Globe trainees (in either of the Year Two simulator training programs) were enthusiastic about the quality of the instructors from their own district. The drivers swapped stories with, and eagerly learned from, the experience of those who knew their specific “real world.” A total of 24 drivers participated in the four focus groups. All of these drivers had gone through both the Driver Awareness (SIPDE) training in the fall and the Fuel Management training in the spring. The fall course was similar to the one offered in Year One, but the program in Globe was longer, consistent for all drivers, and taught by very experienced snowplow operators. The spring simulator-training program on Fuel Management and shifting, as indicated above, was also four hours in length. It, too, included a combination of classroom and simulator training, and was taught by the same experienced heavy truck operators from the Globe District. There was an overwhelming optimism among drivers for the potential of the simulator. However, this optimism seemed to be reduced from Year One. The drivers seemed to be somewhat frustrated that the simulator was not being used to its fullest potential and that the current curriculum did not address the real world operational issues that they were dealing with. Experienced drivers repeatedly voiced the opinion that the fall simulator awareness training was of value really only to new hires. They felt that, as veteran drivers, they did not experience anything they did not already know from real-world experience. New hires, however, were enthusiastic, indicating that the training gave them a jumpstart on the season. They were interested in having more practice time on the simulator before they faced the challenges of the real world. Experienced drivers continued to raise issues, first brought up in Year One, associated with operational controls. The simulator does not help with the challenges of backing up, turning the plow around, driving with a wing plow, handling the sander, or applying deicing chemicals, as they pointed out. One experienced driver noted that the simulator also lacked realistic controls that would raise and lower the plow blade. This made it difficult to train for the real world, where it is ADOT policy to raise the blade while crossing railroad tracks and cattle guards. Although the trainers do remind drivers of this point while they are in the simulator, the trainees aren’t able to do anything that would respond to the need to raise the plow. Feedback From The Simulator Program Several drivers mentioned the issue of feedback from the simulator training. In Year One, the L-3 trainer offered verbal feedback. Some drivers were satisfied with this, but others were frustrated, suggesting that one trainer could not adequately monitor and provide feedback to four trainees simultaneously. This was not an issue in Year Two when the Globe District trainers worked with each driver independently. They did get verbal feedback, but some drivers suggested that feedback on paper would be helpful, and requested a sort of “report card,” containing various objective measures. One driver in a Year Two focus group commented that a paper report after a pre-test would be useful if he had time to use the simulator to practice areas where he was having difficulty. There were concerns, however, that a paper “report card” with the driver’s name on it might end

51
up affecting his or her rating as an ADOT employee. An anonymous report, based on the simulator report and handed directly to the driver, would avoid this issue. Some drivers suggested that it might be useful to have feedback from other drivers. Multiple drivers could run through identical scenarios, and then be “debriefed” collectively. By sharing their individual experiences in the simulator, drivers would learn from each other as part of the simulator training program. Indeed, it was pointed out that this sort of “shared learning” was one clear advantage of the simulator over traditional OJT. The simulator offers the opportunity for other drivers to learn by watching their colleagues “drive” the different scenarios in the simulator. There were concerns among some drivers that the simulator training might be used as a form of certification, and in the event of an accident or incident the trained driver’s behavior/judgment could be called into question. It should be noted that ADOT has no plans to use the simulator for certification testing. Perspective Of The Supervisors The Year Two focus group with the Globe supervisors indicated that they thought the drivers were quite satisfied with the simulator training, although the drivers had indicated (via survey responses and focus group comments) some concerns. How can this apparent discrepancy be explained? The ASU team identified two theories:
• Supervisors may think the drivers are completely satisfied with the simulator training based on comments and/or discussion immediately following the training session. At that time, the drivers may have felt the training was an interesting and entertaining change of pace. It also gave them an opportunity to visit with other drivers, and to learn from seasoned veteran trainers (whom, it must be noted, received unanimously positive feedback from the focus groups). However, the drivers were able to put very little of what they learned from the simulator into practice in the 2005-06 snow season, when most of the snowfall came in March, five months after the fall simulator training. In other words, the initial enthusiasm wore off once these drivers got back into the real world.
• The supervisors may see the potential of the simulator as a tool for training primarily tactical driving skills (e.g., monitoring road temperature and material, contacting other ADOT drivers, avoidance of other drivers and obstacles, etc.), whereas the drivers see the world (and therefore the simulator’s success or failure) in terms of control or operational skills (e.g., applying brake and gas pedals, providing steering inputs, using heater/defroster controls, clearing windshield, adjusting plow height and angle, adjusting spreader controls, etc.). The simulator — in its current configuration, anyway — does a good job of the tactical skills training (the basis of L-3’s SIPDE curriculum), but a marginal job with control skills training1 (as was evident from the drivers’ comments in both Year One and Year Two focus groups). Marketing the simulator in terms of strengths in training for tactical skills would help avoid false expectations among experienced drivers. These issues are discussed in greater detail in Chapters VIII and IX of this report.
1 Gear shifting being a notable exception.
52
Basic ADOT Driver Training According to both the drivers and the supervisors, OJT has been the method traditionally used by ADOT. This method is still used today, and will continue to be used even after simulators are fully integrated with the training process. Typically, a new driver rides “shotgun” with an experienced driver as his/her first stage of training. Next, the new driver is put behind the wheel with an experienced driver riding shotgun. This is under ideal circumstances, however. Very often, a new driver gets only one or two days of training in the truck before “going solo.” Several drivers reported that very little training was done for them. They were simply told, as one driver put it, “There’s the truck.” New drivers are often put into dump trucks (which are, in fact, plow trucks without the plows attached) before being asked to plow snow. They would then be asked to make dry runs with a fully-dressed plow (but without snow on the ground) before winter arrives. Again, this is under ideal conditions, and some drivers reported little training of any kind, summer or winter. Weather and available resources may create demand that interferes with this training plan. Due to rockslides or flash floods, drivers in some regions may occasionally have to ‘plow’ rocks and flood debris as well as snow. This provides some additional off-season training (although an unplanned form of training). Given the immediate need for snowplow drivers when there is a heavy snowfall, drivers are loaned or borrowed within and among districts. As a consequence, drivers may find themselves on unfamiliar routes or plow trucks — which may increase the likelihood of accidents/incidents. Some drivers noted that all-day or all-night shifts might be a potential safety consideration (drivers can sometimes choose which shift they are more comfortable with) since they would then be driving in the lighting condition with which they are most comfortable. Each district has its own shift timing, based on local considerations. Driver Turnover The demand for snowplow drivers when there is a heavy snowfall is affected by driver turnover. All of the maintenance districts involved in this study have experienced substantial turnover in the past several years, as Appendix E indicates. Within the Globe District, there are 51 Highway Maintenance Technician (HMT)-1 positions (first level snowplow operator positions). Over the last 3-1/2 years, there has been a vacancy for at least one of these positions, on average, 44% of the time. As an average, then, 22 new workers have to be hired and trained each year. Potentially, the simulator training may contribute to increased driver proficiency, and efficiency in the training of new hires — giving them a jumpstart in the more traditional OJT. With high turnover rates, it is essential to have all employees perform at peak efficiency as soon as possible. Otherwise equipment can be idled. This did happen in at least one district, where there were not enough drivers to keep all plows operating. All new HMT-1 employees are paid $11.10 an hour, with a supplement for snowplowing. In an average year, they work 30 weeks in an October-April snow season (1,200 hours). At the standard pay schedule, each HMT-1 is paid $13,320 for this work, in regular

53
hours. However, new HMT-1 employees, without snowplow experience, are able to perform only at reduced efficiency (estimated at 50% in their first snow year). They typically ride shotgun with experienced drivers for several days, and then gradually increase their efficiency). A conservative estimate of reduced efficiency on the job for 22 new hires in the Globe District for their first snow season would result in a cost impact figure of $146,520. Another factor is the additional time that experienced drivers would need to spend training the new hires. It is difficult to come up with a figure for how much simulator training can enhance the efficiency of new hires, and reduce the length of time needed to gain competence and certification on a snowplow. However, even if the simulator could reduce this lost efficiency by 33 percent, it would provide a substantial benefit to the district. This savings would be even more significant for the new HMT-1 drivers who come to an ADOT position with a CDL permit, rather than a full license. A simulator module on CDL training (which is included in the current simulator package) can offer new hires much-needed practice, potentially allowing them to move through the steps of CDL licensing more quickly. Overall Driver Response to Plowing Snow Generally speaking, the ADOT drivers who participated in the focus groups reported that they enjoyed their jobs, and especially the snowplowing aspects. They reported that ADOT demands a high level of expertise, making their work rewarding. Drivers felt that the higher snowplowing wage initiated in the 2004-05 snow season was a real “morale boost.” They have been volunteering to plow snow (which is unusual — in the past, some drivers tried to avoid plowing snow if they could). The degree of this benefit depends on snow, however. The 2004-05 snowfall was substantial, but snowfall in Globe in 2005-06 was limited, with only one major snowfall coming in March — late in the season. Working 12-hour shifts — sometimes back-to-back — is very taxing on drivers. Drivers pointed out that they often get very little sleep during severe storms — perhaps not much more than a 15-minute “power nap” on the job when they feel they really need it. The power nap is possible since, in some ORGs or on some plow routes, two drivers may be sent out on any snowplow shift that extends over 12 hours. One driver, who had previously operated a crane for a living, felt that one hour on the plow was equivalent to three hours of crane operation. Knowing the road and being schooled in watching surroundings, as is emphasized in the L-3 SIPDE training program, can help even tired drivers be more alert to the unexpected. Simulator training cannot prevent fatigue, of course, but it can improve a driver’s response to situations affecting his or her performance, safety, and efficiency. Perspectives on Training The potential impact of introducing the simulator into the ADOT training program is far-reaching. For example, if the simulator could be refined to better reflect realistic driving conditions — as suggested by drivers — it may provide the same sort of “morale boost” as the stipend introduced during the 2004-05 season. This would, however, require

54
enhanced hardware, software, and accessory features that may or may not be available though the current primary vendor. Although it may be useful to quantify the benefits associated with simulator training, care must be exercised: there is great difficulty in trying to “quantify avoidance.” While supervisors are, in general, confident that the simulator will have (indeed, already has had) a positive effect on driver safety, they point out that it is difficult to quantify. Initial reports indicate that the recently adopted de-icing approach has reduced the number of accidents. De-icing means, however, that ADOT drivers are now using their plows more on clear pavement, resulting in increased wear to the carbide bits. If only maintenance cost records are considered, this seems to be a negative result — despite the reduction in the number of accidents. However, there are opportunities for quantitative measures. If, for example, the simulator included scenarios with cattle guards and expansion joints, this may help to heighten awareness about issues often attributed only to driver experience. If, as a result of this scenario, plow moldboard damage could be reduced, that would be quantifiable evidence of the benefits of simulator training. Roadside sign and private property damages might also be reduced through simulator training (adding to the quantifiable evidence). According to interviewees, OJT has been — and still is — the primary mode of driver training. As one supervisor put it, “They need to come up to speed pretty quick.” However, while drivers expressed frustration with limited on the job training, supervisors saw OJT more positively. One stated, “ADOT trains very adequately, [and we’re] always looking for new ways to improve.” ADOT operators are regularly involved in updating current snowplow driver guidelines. The objective is to provide the driver with enough training that they will automatically respond appropriately to motorists who are driving too fast, too close to the plow, and passing the plow on a narrow road, in conditions of limited visibility. That is certainly difficult to accomplish. Nevertheless, the added experience of driving a no-risk simulator can certainly help — provided that the simulator experience matches those real-world challenges. The Globe District, as the pilot deployment site and the model for ADOT’s Simulator Working Group initiative, is committed to offering another year of more enhanced Driver Awareness training, particularly for the new and less experienced drivers. The Year Two study certainly underscored both the interest and perceived need for that training among recent hires. Some minor modifications, including more feedback and more practice time on difficult maneuvers will likely make the program even more successful. For more experienced drivers, greater emphasis on driver efficiency and effectiveness, as presented in the Fuel Management program, will capture interest, and this may also more clearly generate the quantitative benefits anticipated from the simulator program, as Chapter VII points out.

55
V. QUANTITATIVE ASSESSMENT INTRODUCTION Parallel to the qualitative study discussed previously, a quantitative study was launched to determine the relative benefits and costs of the simulator training program. The study began with a thorough examination of historical accident and insurance claims, as well as the repair records for snowplows operating throughout Arizona during the period 1999-2004. These “operational loss” cost data helped to establish a five-year baseline against which to measure the effectiveness of simulator training initiatives. It was anticipated that snowplow driver simulator training would reduce repair costs to snowplows, reduce snowplow-related accidents, and improve roadway conditions — thereby enhancing driver safety in the 2004-05 and 2005-06 snow seasons. Given the limited number of accidents and liability claims over any one-year period, however, a single major accident is likely to skew the report for a particular district in a particular year. It is, therefore difficult to suggest that simulator training itself is responsible for any dramatic changes (one way or the other) in operational losses. DATA TYPES AND UTILIZATION For the 2004-05 winter season, accidents and claims were traced to individual plow drivers. All records were used on a confidential basis. The data were sorted in such a way as to compare drivers participating in the simulator training to those who did not participate. The expectation is that the data will reveal that drivers with sufficient time in the simulator will generate less costs in terms of accidents, repairs, and insurance claims, compared to drivers trained traditionally. In Year Two, all drivers in the Globe District participated in a consistent simulator training program. The other districts were used as control groups, and comparisons were also made between Year One and Year Two within the Globe District. Furthermore, one additional control group was added in Year Two. The Prescott district receives a considerable amount of snowfall each year, yet drivers in that district received no simulator training in either Year One or Year Two. Hence, the training their drivers received was primarily the traditional OJT. Figures for operational losses for Prescott are therefore included for comparison. Findings in the 2004-05 winter season identified $9,968 of ADOT equipment repair costs associated with snowplow accidents attributed to six drivers who participated in the December 2004 simulator training. An additional $15,973 in equipment repairs was attributed to nine drivers (from the same districts) who did not participate in the training. There is no clear indication as to whether more time in the simulator could have prevented the type of accidents in which simulator-trained drivers were involved. During the 2004-05 season, accidents involving simulator-trained drivers included striking a bridge abutment, striking a guardrail while reversing, losing traction on ice in a parking lot, and catching a plow on soft asphalt. At least some of these accidents might have been avoided if the driver had been more alert to the setting and taken evasive action, as is emphasized in the fall Driver Awareness training.

56
In Globe, in 2005-06, simulator-trained drivers were involved in accidents that included hitting concrete in an intersection near a light pole, backing up and damaging a sander on a guard rail, and hitting a tree limb while backing up in whiteout conditions. More simulator training may not have helped the drivers avoid these accidents. Nevertheless, the L-3 SIPDE training does emphasize being fully aware of surroundings, a point that could have been a factor in these 2005-06 accidents. The simulator is capable of presenting near-whiteout conditions and nighttime driving, and the drivers did indicate a strong interest in having more practice driving in whiteout conditions. The Globe training program did impose night and whiteout conditions on several scenarios, however, the current simulator software does not allow for scenarios that include backing up. As in 2004-05, Globe drivers in 2005-06 faced severe challenges in dealing with unexpected actions of motorists sliding on ice and snow. In one case, a motorist spun out, crossed a median, and collided head on with a snowplow, resulting in a fatality. In a second accident, the snowplow operator was able to see a motorist spin out, and turned the plow in such a way as to minimize the severity of the accident. Training on how to respond to unexpected actions of motorists is certainly included in the Driver Awareness training package. In the future, perhaps more training on how to respond to unanticipated motorists’ actions might help to reinforce Driver Awareness, and help drivers learn possible evasive actions. Again, this was the type of training that the drivers indicated they needed in the survey questionnaires. Winter Weather Factors A key variable that affects all winter operations is snowfall. The state, and the selected districts, experience considerable variability in terms of snowfall amounts over the years. The records for this study were obtained from the Western Regional Climate Center (WRCC), a division of the Desert Research Institute, and include annual snowfall totals for each district. All data were collected by National Weather Service (NWS) observers. A substantial amount of detail was available; snowfall data was available for multiple substations within each district. In this instance, records from the most representative substations as recommended by NWS and ADOT staff were used to determine each district’s snowfall history for each winter season. Table 7 reflects the snowfall records posted on NWS monthly B-91 forms for key weather stations in each district. A volunteer on-site observer who reports the level of snowfall daily at their weather station completes these B-91 forms. The Arizona State Climatologist made the B-91 data sheets available, and Table 7 summarizes these observer reports for a representative snowfall site in each district. A full record of B-91 observer data for the key weather stations by district is found in Appendix D.

57
Table 7. Historical Snowfall Totals by Winter Season
District and Location of
Snowfall by Snow Season (inches)
Weather Station 99-00 00-01 01-02 02-03 03-04 04-05 05-06 Total Flagstaff (Pulliam Airport) 74 125 43 55 51 130 45 523 Globe (McNary) 30 97 38 80 52 72 53 422 Holbrook (Painted Desert) 0 3 0 2 0 0 0 5 Kingman (Seligman) 11 16 3 7 7 16 12 72 Safford (Bisbee) 1 3 0 1 0 0 3 8 Prescott (control) 11 25 2 7 5 11 12 73
Snowfall Totals 127 269 86 152 115 229 125 As is apparent from Table 7, the level of snowfall certainly changes over the years. In 2004-05, the five-district total was almost double the snowfall for the same districts in 2005-06. These snowfall totals do not account for icy roadways, but they do relate to the relative level of snowplowing effort in a given season. The district of Globe had the highest proportion of snowfall among all five of the districts in 2005-06. Most of that snowfall occurred in March 2006. By way of comparison, the control district of Prescott had 12.3 inches of snowfall in 2005-06. Cost Analysis “Operational Loss” cost figures in this study include all of the ADOT equipment repair costs and claims initiated due to snowplow-related injuries or accidents that are related to topics covered during simulator training. Workers’ compensation claims are generally not included in operating costs, and have not been included in table representing operational losses. Such incidents were generally not associated with skills taught in the awareness training (e.g., a claim due to slipping on ice and breaking an arm while getting into the snowplow). It should be noted that due to the low dollar value of most claims, one large accident or incident with private property could cause annual costs to jump considerably. These loss tabulations include portions from one or several of the categories below:
• Auto Liability—Claims involving contact with another motor vehicle, which may range from accidental contact with heavy commercial trucks down to personal automobiles, and are included regardless of fault.
• General Liability—Claims made by an outside party due to damage by a snowplow or plowing materials. Examples of a common claim made in this category are those

58
drivers whose windshields were damaged due to material falling from or scattered by a snowplow.
• Injury to Private Property—This category identifies claims made due to inadvertent damage caused by a snowplow to private property (e.g., a fence or mailbox).
• ADOT Equipment Shop snowplow repairs of plowing-related equipment damage, but not normal wear and tear or regular servicing.
Table 8 summarizes the snowplow activity and the operational loss costs associated with plowing activity that took place over the years 1999-2006, in each of the study districts. Prescott did not participate in simulator training activities and is, therefore, included as a “control” district. The ADOT operational losses shown include both claim costs and repair costs for the five ADOT simulator-trained districts and the control district, in the categories used for this study. As was suggested previously, given the low dollar value of most claims, one large accident or incident with private property can cause annual costs to jump considerably (as seen in Table 8 for the 2002-03 winter). The snowplow repair figure for 2005-06 was $58,437, a figure higher than that for 2004-05, but certainly lower than the figure for 2002-03. The cost figures in Table 8 do not reflect any annual compounding factors.
Table 8. Operational Loss Costs by Winter Season 1999-2006: Project Districts
Snowplow Operational Loss Costs by Winter Season ($) District 1999-00 2000-01 2001-02 2002-03 2003-04 2004-05 2005-06 Flagstaff $3,803 69,439 42,300 6,551 5,772 32,876 $22,614 Globe 14,332 7,640 6,916 19,911 5,450 41,574 18,631 Holbrook 1,074 17,898 21,098 52,799 1,810 1,469 1,212 Kingman - - 7,933 315 - - - Safford - 2,754 7,739 950 4,580 - - Prescott 3,374 16,407 11,144 82,612 3,288 8,994 15,980 Totals $22,583 114,138 97,131 163,139 20,899 84,912 $58,437
The liability claim data was obtained through ADOT Risk Management from the Arizona Department of Administration (ADOA), and Equipment Services provided the snowplow truck repair data. Each data set was broken down by district and snow season, and then added together to get the total costs by district or season. The data were also examined to insure that there were no duplicate records between the sets. In addition to the cost data provided, separate metrics based on regional snowfall and on snowplowing activity were created. This approach allows for a quick comparison between plow activity and snowfall—again, either by district or by season—over the seven winters. The following tables summarize that data. As indicated in Table 8, the snow season reports of ADOT operational losses for the Globe District are lower in 2005-06 than for 2004-05. The association between simulator

59
training and ADOT operational costs is difficult to establish, given the small number of crashes and the range of accident severities and circumstances. It is almost impossible to calculate the value of accidents avoided, yet that is the objective of the simulator’s Driver Awareness package. If even half of the potential accidents in the Globe District were avoided because drivers gave more attention to scanning their environment for potential hazards and then took a proactive response, then ADOT would benefit considerably. Exposure to Hazards Table 8 shows clearly the year-to-year variation among districts, reflecting major repairs and claims in one year, and very small or no operational losses in another year. Variation among districts can be attributed, in part, to snowfall amounts and miles traveled by snowplow — indications of exposure. It is important to note that in some cases, while snow may not have fallen in a given season, the performance data and costs associated with the season and districts are accurate. Frequently, snowplows are used to patrol icy or wet roadways. In these cases, the driver and the snowplow are still exposed to damage from other vehicles and roadway obstacles. So, the operational loss costs as summarized in Tables 8 and 9 are very often incurred during periods of little or no snowfall. Table 9, for the Globe District, is derived from a more complete table relating exposure to operational loss costs in Appendix G, which shows miles traveled, hours worked, and snowfall figures for each district over the last seven years. Exposure for each district is expressed in terms of miles plowed per snow season and hours spent in plowing activity. Appendix E summarizes the loss cost history by season over seven winters, normalized to 2005-06 at 7 percent per year, while Appendix F shows these same costs by district, by winter. In these Appendixes, which are the basis for Appendix G, the field for Miles Plowed represents a summary of the total miles for which a snowplow was actively engaged in clearing the roadway and/or spreading anti-icing materials. The fields are totaled on the district level. Based on seasonal activity, Miles Plowed gives a general indication of the extent of roadways in each of the five project districts, as well as the regional snowstorm activity. The data for the tables in the Appendixes are from ADOT’s “PECOS” (PErformance COntrolled System) maintenance reporting database. As with the Miles Plowed field, Truck Plow Hours is also taken from the PECOS database and is summed by season and district. These data are recorded individually by day and by shift for each plow truck. Thus, it may also give a general indication of driver exposure — the duration of his winter storm activity — as each truck is only driven by one driver per shift (except in special cases, such as OJT ride-along training). The snowplow driver exposure varied considerably among districts, as is shown in Appendix E. In the 2005-06 snow season, for example, the miles plowed in each of the five districts included in the study varied from 10,187 to 324,876 miles, reflecting the differences in regional snowfall from Safford to Flagstaff. Safford District had three inches of regional snowfall (as measured at Bisbee) while Flagstaff had 45 inches. The snowplow hours varied similarly, from 379 to 9,938 hours. The miles plowed in Globe in 2005-2006 snow season were 97,232 and the snowplow hours were 3,674.

60
Operational losses in terms of cost per mile, cost per truck hour, and cost per snow inch, however, are not directly proportional to these measures of exposure. Appendix G tables 1 and 2 present operational loss costs for each study district in relation to three measures of exposure: operational losses divided by miles plowed, by hours of truck operation, and by snow inches (with and without the 7% compounding used in Appendixes E and F). Table 9 below, the Globe District record, illustrates the variability of conditions within the districts each winter, and offers some indication of a comparison in operational losses in terms of exposure. What is worth noting is that Globe District fared better in the 2005-06 snow season — after all drivers had taken the Year Two fall simulator training — than it had in the previous 2004-05 season. The loss costs in terms of all measures of exposure were lower for Year Two. The figures in Table 9 do not reflect any annual compounding.
Table 9. Measures of Exposure Related to Operational Loss Costs in Globe
Snow
Season: Globe
Total Operational Loss Costs
Associated with Snowplowing ($)
Cost/Mile of Snowplow Operation ($/mile)
Cost/Hour of Snowplow Operation ($/hour)
Cost/Inch of Snowfall ($/inch)
1999-00 $14,332 $0.14 $3.35 $480.94 2000-01 7,640 0.03 0.66 78.68 2001-02 6,916 0.04 1.09 181.53 2002-03 19,911 0.10 2.59 247.65 2003-04 5,450 0.02 0.64 105.61 2004-05 41,574 0.25 6.82 574.23 2005-06 $18,631 0.19 5.07 $349.55
As summarized in Appendix G, the comparisons with other districts in terms of the other measures of exposure were, however, mixed. For example, the operational loss in Flagstaff was $0.07/mile in 2005-2006, as compared to $0.19/mile in Globe. In Flagstaff, the operational loss per truck hour of snowplow exposure was $2.28/hour, as compared to $5.07 per truck hour in Globe. This difference can be explained, in part, by the fact that in the 2005-06 snow season Globe experienced two very costly accidents (for which the snowplow drivers were not faulted). Since snowplow drivers are involved in so few accidents, a single major accident can cause a spike in reported operational losses associated with any district. In Prescott, the control district without any simulator training, the operational loss per mile in the 2005-06 snow season ($0.31/mile) was higher than for any of the districts involved with Year One or Year Two simulator training (see Appendix G). In addition, the operational loss per hour of snowplow exposure in Prescott was higher (at $6.67), as was the operational loss per inch of snowfall (at $1299.17/inch). This difference is worth

61
exploring further, to determine whether the type of crashes experienced in the Prescott District were addressed in the simulator training. Detailed tables presenting this cost data sorted by district and by winter season are included in Appendices E, F, and G2. Each of these appendixes incorporates a seven-percent annual compounding to 2005-06 for all costs, to adjust for inflation, and to establish a common base for the cost figures across this project’s seven-year time frame. Utah Experience Relative to the Arizona Study Early results of an ongoing 2003-05 study conducted by the University of Utah, in conjunction with the Utah Department of Transportation, suggested that snowplow drivers of all skill levels could benefit from using simulators to prepare for making decisions under critical conditions. These studies focused on the likelihood, or odds, that simulator-trained drivers would not get into accidents. The Utah study relied heavily on statistical odds ratios to determine the likelihood of accidents for participants, and for control groups of drivers trained traditionally. Odds ratios have been used extensively in medical studies (Bland & Altman, 2000; Strayer et al., 2004; Westergren, Karlsson, Andersson, Ohlsson, & Hallberg, 2001), but Utah’s study is a new application. Although the Utah study found that there were fewer accidents attributed to the simulator trained drivers than to the control group, the number of all drivers in the study was small (40 participants and 40 in the control group), and the Utah authors felt that 120 participants would present a more reliable set of data. The number of accidents was also small, and none were attributed to a training participant (as was discussed previously). Interestingly, the most recent simulator training work in Utah is focused on trainee satisfaction, and not accident data (Strayer, 2006). The Year One Arizona study involved 149 drivers in the L-3 simulator training. Data were available for 148 participants. The 145 other drivers in the same five study districts who did not have the simulator training are regarded as the control group (49 percent of the study’s total of 294 drivers). Data based on ADOT’s 2004-05 winter repair records indicate that four percent of the 149 simulator trainees were involved in accidents subsequent to their training in December 2004. That compares with six percent of the 145 from the same districts who did not have simulator training. The equipment repair costs associated with accidents involving simulator-trained drivers (who are 51 percent of the study total) are $9,968 (or 38 percent of all snowplowing accident-related equipment repair costs). The parallel repair figure for the control group was $15,973. Overall, ADOT snowplow drivers have not been involved in many costly accidents. As Table 10 shows, the majority of the plowing-related accidents associated with both simulator-trained and non-simulator-trained drivers involved relatively low-cost ADOT equipment repairs. The majority of accidents involved shop repair charges of $500 to $1,000. The small number of drivers involved in accidents makes it difficult to associate simulator training with reduction of accidents. Nevertheless, the results are encouraging.

62
Table 10. Year One Snowplow Equipment Repair Costs: 2004-05 Winter – Initial Study Districts
Snowplow-
Related Accident Repair Costs
Number of Accidents by Simulator-
Trained Drivers (149)
Number of Accidents
By Non-Simulator-Trained Drivers
(145) < $500 1 1
$501-1,000 3 4 $1,001-2,000 - 1 $2,001-3,000 1 2
> $3,000 1 1 Total 6 9
Table 11 shows the Year Two comparison of the Globe drivers and drivers from the other four districts who took part only in the Year One training. A separate column shows repairs for the control district, Prescott/Payson where drivers did not have any simulator training. It is difficult to compare across districts given the wide range of types of roadways and snowfalls.
Table 11. Year Two Snowplow Equipment Repair Costs: 2005-06 Winter - Study and Control Districts
In Year Two, the number and costs of accidents involving Globe simulator-trained drivers were similar to those involving drivers from the four districts (where drivers were given introductory training on simulators only in Year One). Prescott had more but lower-cost accidents, on average.
Snowplow Related
Accident Repair Costs:
2005-06
Number of Accidents
by 61 Globe Simulator-Trained
Drivers
Accidents: Four Districts with
93 Simulator-Trainees in Year One
Accidents: Prescott District
(~46 Non-Trained Control Group)
< $500 0 3 1 $501-1,000 4 4 6
$1,001-2,000 2 2 1 $2,001-3,000 1 0 0
> $3,000 2 4 0 Total 9 13 8

63
As was indicated previously, a “spike” in the data is caused by one or two major accidents in a single year. This occurred in the Globe District in the 2005-06 snow season, when a snowplow driver had a head-on collision with a motorist who crossed the median. Another accident also caused major damage to a wing plow. It is unclear whether more awareness training could have helped in these situations. Nevertheless, more simulator training on hazard avoidance, particularly in dealing with errant motorists, may be helpful.

64

65
VI. BROADER IMPLICATIONS OF WINTER MAINTENANCE
THE SIMULATOR EFFECT IN STATE SNOW PLANNING POLICY To make best use of the simulator, it is of primary importance to focus on the overall ADOT objectives for the Winter Maintenance Training Program, and then determine how the simulator can assist in meeting those objectives. State policy emphasizes that “priority” roads including interstates, should be cleared of snow first. It also requires that trucking and commerce, as well as essential services, are accommodated. ROAD CLOSURES AND SHIPPING DELAYS Delays in plowing the roads can lead directly to economic losses for shippers and for their customers. Nationally, shippers can lose up to 500 million hours of delay annually because of fog, snow, and ice (Where the Weather Meets the Road: A Research Agenda for Improving Weather Services, 2004). The estimated cost of weather-related delay to trucking companies ranges from $2.2 to $3.5 billion annually. On freeways, light rain or snow can reduce traffic speed by about 10 percent. In heavy snow, however, travel speeds can decline by some 40 percent (How Do Weather Events Impact Roads?, 2002), having a significant impact on just-in-time shipments. Studies conducted by Standard and Poor’s Data Resource Incorporated, in various states in the East and Midwest, point out the major loss to state economies if major roadways are closed by snow for even one day. For example, Wisconsin would lose $27.7 million in retail trade, hourly wages, and state and federal taxes alone. Pennsylvania would lose $68.1 million, and Ohio would lose $146.5 million (Beauvais, 2002). In northern Arizona, along Interstate 40, winter storms may occur at any time over seven months, from October to April. Hence, potential delays associated with the snowfall can be a significant issue for freight haulers and other commercial vehicle operators as well. Although no specific figure was calculated for Arizona, the message is clear. Arizona would lose a significant amount of wages, retail sales, and state and federal taxes if a storm closed all major roads in the high country. A significant number of westbound commercial vehicles entered the State of Arizona at Sanders Port of Entry (POE) on I-40 during the 2005-06 winter season, from October to April. This number has continued to increase in recent years. A sizable number of trucks took advantage of the relatively dry 2005-06 winter season along I-40. Another factor contributing to the increase in the reported number of commercial vehicles entering the state is that the Sanders POE facility was in operation 8,115 hours in 2005. By comparison, in the previous three years, the facility was closed about a third of the time, due to staffing shortages. To normalize the average daily traffic (ADT) counts of commercial vehicles entering the state over each of the last four years on I-40, the ASU team multiplied the average number of westbound commercial vehicles entering the Sanders POE per hour, by the

66
number of hours (8,115 hours) that the facility was open in 2005-06. The following, then, are the estimates generated: • 2005-06: 2,263,888 inbound commercial vehicles at the Sanders Port of Entry, with
the facility open for 8,115 hrs • 2004-05: 1,850,220 inbound commercial vehicles — if Port open for 8,115 hours • 2003-04: 1,769,000 inbound commercial vehicles — if Port open for 8,115 hours • 2002-03: 1,736,610 inbound commercial vehicles — if Port open for 8,115 hours Based on the above figures, then, an estimated average total of 1,904,947 commercial vehicles enter the state at the Sanders I-40 Port of Entry on the eastern border of Arizona each year. The proportion entering in the winter season, October to April, is 64% using 2005-06 figures.1 Thus the estimated average number of inbound commercial trucks entering at Sanders Port for the last four winters would be 1,219,166.
Figure 14: Snowbound Trucks in an I-40 Storm Closure Winter Storm Impacts According to a major commercial truck operation based in Arizona, delays of one hour can lead to an average cost of $65 per fully loaded commercial vehicle, while a full-day loss would average $700 per truck. A study of 28 snow belt states, conducted by Thomas Maze and Michael Crum of Iowa State University, indicated that the cost of a one-hour delay to a shipper can range from $23 up to about $71 an hour, depending on full or partial load, type of goods, or, just-in-time delivery. (Maze, Crum, & Burchett, 2005). 1 2005-2006 Monthly travel figures provided by ADOT, Motor Vehicle Division.

67
The figure provided by the Arizona trucking firm corresponds to that provided in the Iowa study for an average fully-loaded truck. The cost of a delay of just one hour for the average number of the 1,219,166 commercial vehicles crossing the state in the typical winter season on I-40 would amount to more than $79 million. Given the significance of I-40 for cross-county shipping, delays can be a major cost to shippers crossing Arizona in the October to April snow season. A major Arizona trucking firm estimates that 90 percent of westbound trucks entering at the Sanders Port of Entry drive through the state on I-40. This would mean that approximately 5,177 commercial vehicles a day travel the full extent of I-40 (a trip of 355 miles). If they can only travel at 40 miles per hour (MPH) on a snowy or slushy roadway, rather than at 60 MPH on a dry roadway, the cost of the three-hour delay to shippers crossing the state would be more than more than $1 million. It is estimated that the proportion of commercial vehicles traveling from west to east along I-40 is about two thirds of the number traveling east to west. If those trucks also encountered the same three-hour delay, the total cost of losses to commercial shippers would be over $1.6 million. Efficient, effective snow removal is essential to keeping the roads open. The simulator is essentially an investment in sharpening the skills and effectiveness of snowplow drivers — and helping to ensure that priority routes remain open. The Minnesota concept of closing freeways to allow for more efficient snow removal is worth mentioning (Nookala, 2000). The argument is that trucks stopped for freeway closures will make up time as they travel faster — but more safely — on clearer roads. MnDOT takes care to close the freeway near an exit with overnight accommodations. In Arizona, it would be more difficult to find such exits, and the heavy truck traffic would be badly backed up. The intent in Arizona is, therefore, to avoid road closures. TRAVELER SAFETY Public safety is also a critical issue. Nationally, 1,300 people are killed and 118,000 more are injured each year in crashes associated with driving on snow, slush, or icy road surfaces. In fact, across the country, 23 percent of weather-related crashes are associated with snow, slush, or ice-covered roadways (FHWA, 2006). These national crash numbers have increased in recent years (see Goodwin & Pisano, 2003). If any of these crashes can be avoided by effectively and efficiently clearing snow and ice, the benefits would certainly be significant. This study has not specifically related simulator training to an increased efficiency of snowplowing along Arizona’s major highway corridors, or to reductions in fatal or injury accidents. Nevertheless, the SIPDE awareness training is clearly focused on avoiding hazards and being alert to surroundings, even in limited visibility conditions. The training is focused on increasing efficiency, while maintaining effectiveness in plowing snow. FURTHERING PUBLIC SAFETY The general purpose noted in each district’s snow management plan is “to provide safe and reliable surfaces for public vehicular use in transporting persons and products.

68
ADOT’s goal is to do all that is reasonably possible to keep the Highway System safely open and available to the prudent motorist” (Safford District Snow Control Plan, 2004). It is expected that a snowplow operator who is trained to maneuver a plow efficiently and safely will not only be involved in fewer snowplow accidents, but will also prevent private vehicle accidents. Clearer and drier roadways — provided in an efficient manner — are invaluable to citizens in high-altitude communities. To measure this variable, motor vehicle accident data associated with snowy or icy road surfaces were obtained from ADOT by district for all major highways in the study areas, as well as for roadways in various city jurisdictions. It is expected that in the future these rates will show a decline in the districts with a higher proportion of simulator-trained snowplow drivers. Statewide accident data confirms that a sizable number of accidents each year occur on snow- and ice-covered road surfaces, as Table 12 shows, posted in terms of calendar years. Fortunately, the relatively low number of fatal crashes on snow- or ice-covered road surfaces has remained fairly stable since 1999, despite increasing traffic volumes.
Table 12. Statewide Calendar-Year Crashes Related to Snow, Slush, and Ice-Covered Surfaces
Calendar Year
Total Number of
Crashes Statewide
Total Crashes:
Snow- and Ice-
Covered Roadways
Total Statewide
Fatal Crashes
Fatal Crashes:
Snow- and Ice-
Covered Roadways
Total Statewide
Injury Crashes
Injury Crashes:
Snow- and Ice-
Covered Roadways
1999 125,764 647 907 5 45,541 206 2000 131,368 1,292 891 8 47,485 318 2001 131,573 2,073 934 14 46,150 518 2002 134,228 1,243 974 12 46,209 322 2003 130,895 967 971 14 45,177 266 2004 138,547 1,291 992 8 46,674 326 2005 139,265 1,016 1,038 7 45,361 213
Source: Arizona Motor Vehicle Crash Facts (ADOT Traffic Records Section)
The highest toll in terms of fatal accidents attributed to snowy or icy roadways (and the number of injury-related accidents attributable to ice, slush, or snow) was in calendar 2001, a year with considerable snowfall — 244 inches across the five study districts alone. In that year, 1.4 percent of fatal accidents and 1.1 percent of injury accidents related to snow- and ice-covered roadways. In calendar year 2005, according to preliminary figures released by ADOT, there were only seven fatal crashes on snow- and ice-covered roadways, and 213 injury-related crashes — the lowest number since 1999.

69
Despite the relatively small number of crashes that are attributable to snow- and ice-covered roadways in general, it is still important to reduce the number of these accidents, for the sake of those involved and also to reduce costs and delays associated with these crashes. The estimated cost of all injuries and fatalities associated with snow- and ice-covered roads in 2005, for example, was $18,012,940 — based on the National Safety Council estimate of $1,152,600 associated with each of the ten individual fatalities, and $19,364 for each of the 335 individual injuries (ADOT, 2006). Efficient, well-trained snowplow drivers can play an important role in reducing the number of accidents. Using driving simulators as part of a comprehensive snowplow operator training program has the potential of increasing the efficiency of clearing roads, and therefore reducing these crash figures. Further study is needed, however.

70

71
VII. FUEL MANAGEMENT TRAINING
INTRODUCTION ADOT spent nearly $2.4 million for approximately one million gallons of diesel fuel in 2005 (this figure reflects a wide range of vehicles, from light trucks to snowplows to bulldozers). ADOT’s fleet average fuel economy in 2005 was 5.34 miles per gallon (MPG). The Globe District’s heavy trucks averaged 4.97 MPG over 2004 and 2005, which required roughly 70,000 gallons of diesel each year. As fuel costs continue to fluctuate, a significant cost savings might be achieved through a driver-training program aimed specifically at fuel-efficient driving techniques. The TranSim VS III driving simulators purchased by ADOT during 2005 and 2006 are equipped with just such a training module; however, the potential gains in fuel efficiency (as well as costs savings related to transmission and clutch maintenance) are largely unknown. A new, year-long study, building upon the current research, will investigate in detail the potential savings associated with the L-3 simulator’s Fuel Management training course, beginning in the fall of 2006. The project will use both qualitative and quantitative methods to (1) estimate the potential effect of simulator training on fuel efficiency in terms of cost savings associated with fuel use and related maintenance and operational factors (such as transmission types, terrain, etc.), and (2) to help determine the best long-term use of existing ADOT simulators. It is hoped that by using the Globe District — which is the “home” of the first ADOT simulator — as a well-controlled pilot study, the impact of simulator training on fuel efficiency (as well as drive train maintenance and repairs) can be effectively studied. These results can then be applied to other districts with simulators. As part of the current two-year study, an initial investigation was begun, as described below. LITERATURE REVIEW Rising fuel prices, as well as increased environmental concerns have prompted several research studies about how driver-training programs might be used to improve fuel efficiency (DfT, 2004; Foss, 2005; n.a., 2002; Parkes & Rau, n.d.; Strayer & Drews, 2003; TRL, 2005; van der Voort, Dougherty, & Maarseveen, 2001). The potential benefits are significant, especially for trucking companies and government agencies with large fleets (e.g., ADOT). One study that used only behind-the-wheel training methods found a 9.4% average miles per gallon improvement (DfT, 2004). Interestingly, this study also noted a 30% reduction in gear changes, which, the authors suggest, “means the gear box will need less servicing and is likely to last longer.” Another study, which used a “fuel-efficiency support tool” to provide real-time feedback to drivers, reported improved fuel efficiency of up to 23% in “urban environments” (van der Voort et al., 2001). As has already been noted, driving simulators are being used for a variety of research (Ross-Flanigan, 2002), engineering (Nagiri et al., n.d.), and training purposes (Emery et

72
al., 1999; Foss, 2005; Kihl, Herring, Wolf, & McVey, 2005; Strayer & Drews, 2003; Strayer et al., 2004; Vance et al., 2002). Recently, some public and private agencies have begun to investigate how simulator training might be used to improve their fleet’s fuel efficiency as well (Parkes & Rau, n.d.; Strayer & Drews, 2003; TRL, 2005). One study of trucking in the UK suggests that such training may result in a 16% improvement in “behind the wheel fuel efficiency,” although long-term evaluations are still underway (TRL, 2005). Another study, this one of “drivers hauling mining materials,” reported a 2.8% improvement in fuel efficiency (Strayer & Drews, 2003). In 2004, researchers from the University of Utah and the Utah DOT studied fuel efficiency of snowplows (Strayer et al., 2004). While they did see improvements in fuel efficiency — especially among “drivers who exhibited the worst pre-training fuel efficiency” — they concluded that, “neither the maintenance data nor the fuel data are of sufficient quality to afford a precise comparison between the study and control groups.” TRAINING IN GLOBE In the spring of 2006, Fuel Management training was conducted in the Globe District. The same drivers who had been trained on safety awareness in the fall were given instruction on proper gear shifting techniques for better fuel economy, using the Fuel Management module of the simulator’s package. For this training, the focus was purely on shifting gears more smoothly and efficiently (using the gear shift, clutch, and accelerator), rather than on the overall driving experience (as was the case with all previous simulator training sessions). Trainees received a combination of “stand-up” lecture training, computer-based training (CBT), and simulator “seat time.” The stand-up training covered the basic principles of shifting for fuel economy and also emphasized the benefits of proper shifting techniques in reducing repair costs associated with the clutch brake and the transmission. The trainers added personal observations which engaged all participants. Each driver then had the opportunity to use the simulator to practice the shifting techniques presented in class for 15 or 20 minutes. A trainer mentored them as they moved through the gears to the point where they could “cruise” along a highway with maximum fuel efficiency. Driver trainees worked with the CBT while waiting for their turn on the simulator. The CBT reinforced the points covered in the stand-up lectures by offering “one-on-one” modules in which the trainees received instruction (via headphones) and answered questions related to the training. The main points of the curriculum included: • Knowing the relevant shift pattern. • Starting the vehicle in lowest gear. • Using the progressive shifting technique. • Downshifting at the proper time. • Using the tachometer and speedometer as shifting cues. • Avoiding the lugging or over-revving of the engine.

73
The CBT covered techniques for reducing fuel consumption, including factors such as vehicle speed, engine idling, horsepower and torque, aerodynamics, and route planning. It also taught drivers how to calculate their fuel economy accurately, and explained how a driver’s attitude and performance will affect fuel economy. Other points emphasized included using moderate speed, using air conditioner only when necessary, using smooth starts and progressive shifting, maintaining a constant speed, maintaining a consistent space in front of the vehicle to avoid excessive acceleration and deceleration, avoiding stop-and-go, inspecting rigs frequently, and maintaining proper air pressure in tires. At the start of the course, each driver participant was asked to use the simulator and drive along a short section of rural highway as a type of pre-test. The trainer noted both the time and miles performed by the driver, as well as fuel usage. Then at the end of the course, after each of the drivers had participated in the classroom and the computer-based training and had the opportunity to apply what they had learned on the simulator, they took a post-test on the simulator. The post-test involved “driving” the same route as in the pre-test, with the same time and same distance. The trainer noted the fuel consumed in the post-test and compared that with the fuel used in the pre-test. Except for the pre- and post-tests, the three 180-degree display screens (which show the windshield and side windows of the truck) were not used for the Fuel Management training. Instead, only the “glass dashboard” was used, along with additional computer graphics (shown in the dashboard area of the simulator) to monitor engine speed and clutch brake usage. RESULTS In general, driver response to the Fuel Management training was considerably more positive than for the Driver Awareness training, and there was greater consensus among new drivers and veterans (indeed, even some veteran drivers admitted that the Fuel Management training was the first training they had received on the subject of proper shifting techniques). Fuel Management Performance The drivers were virtually unanimous in their opinion that saving fuel while at the same time plowing snow was nearly impossible. Indeed, saving fuel, they said, was the last thing on their minds. Nevertheless, many drivers (even some veterans) said they had learned something of value in the Fuel Management training. This would seem to suggest that the training is worthwhile, but may need to be “marketed” differently to the drivers. Perhaps the emphasis should be on proper shifting (which frees up a driver’s attention for more important tasks, like wiping ice off the windshield), as opposed to purely fuel savings. This is discussed further in Chapter VIII. Reports generated by the simulator suggest that most drivers’ performance did improve over the course of the training, as shown in Figure 15.

74
Fuel Savings Indicated in Fuel Management Training
0
1
2
3
4
5
6
1 3 5 7 9 11 13 15 17 19 21 23 25 27 29 31 33 35 37 39 41 43 45 47 49
Drivers' Sample Number
Pre-TestPost-Test
Figure 15. Pre- and Post-Test MPG: Results of Fuel Management Training
Although several of the drivers actually performed better on their pre-test than on their post-test, this is most likely a reflection of the lack of adequate practice time during the training program. Of greater interest are the number of drivers — many of whom routinely drive automatic transmission vehicles, and therefore aren’t very familiar with operating a manual transmission truck — who improved over the course of this brief training session. Many drivers, who scored low on their pre-test, made substantial improvements on their post-test. Future Fuel Management training will attempt to (1) allow more time for practice, (2) incorporate more rigorous pre- and post-testing, to better understand the effectiveness of the training course, and (3) better classify driver trainees by experience level and transmission type with which they are most familiar. Many drivers who regularly drive automatics suggested that the Fuel Management training could have been valuable if they drove manual transmissions, but was of limited value as long as they were driving automatics (approximately 26-28% of the snowplow trucks are automatics, and the number is increasing). Given that these transmissions are push-button operated, these drivers wondered about the potential fuel savings of properly shifting the automatics. They also wondered if this could be included in the simulator training, so that drivers could be trained on either transmission. The focus groups revealed that drivers are very much aware of the fuel economy of their trucks. Many reported that they have applied the shifting techniques learned in class, and
75
have demonstrated improved fuel economy — apparent evidence of positive transfer of training. Some have gone so far as to have informal competitions to see who can get the most mileage out of a tank of fuel. This naturally occurring competition can encourage drivers to apply what they learn in the classroom, and may be something that can be designed into future training programs. Finally, the ASU team noticed that drivers received very little actual practice time. At the end of the training session, drivers’ performance appeared to be only slightly better than at the beginning of the training (indeed, performance actually worsened for some, as can be seen in Figure 15). Strangely, none of the drivers in the focus groups expressed the desire to have more practice time for Fuel Management training. Still, additional training is required to achieve over-learning, or the “rehearsal of a response past a minimally acceptable performance level [that] serves to maintain proper performance in stressful situations” (Emery et al., 1999, p. 70). IMPLICATIONS Although not statistically significant, the preliminary results do suggest positive transfer of training of control skills for the Fuel Management course. The ASU research team will continue to study the effects and potential benefits of simulator training, as it is related to proper gear shifting, during the subsequent efficiency study for 2006-07.
Driving Skills and Transfer of Training Put into simple terms, the Fuel Management program seemed to do a good job of teaching control skills. Transfer of training, therefore, seems to have as much to do with the skills being trained as the simulator’s realism (or fidelity). A closer look at Table 6 (Chapter III, page 39) reveals some interesting relationships. It can be seen, for example, that the Driver Awareness program addresses primarily tactical driving skills related to Driving and Communicating activities. The tactical skills associated with driving activities include avoiding other drivers and objects, and monitoring vehicle speed - all issues as emphasized strongly in the Driver Awareness (SIPDE) curriculum. Results of the surveys, focus groups, and performance reports generated by the simulator itself all suggest that the simulator was relatively “successful” in these areas, as was discussed previously. Whereas the Driver Awareness program was broadly focused, the Fuel Management training program was narrowly focused — emphasizing proper gear shifting (and related clutch usage). As shown in Table 6, gear shifting is comprised of control-level driving skills corresponding to the Driving activity of snowplow operation. And here, positive transfer of training seems to have taken place. Drivers reported that they quickly applied what they had learned on the simulator to their everyday driving, and saw positive results (not only in ADOT vehicles, but in their personal vehicles as well). This supports the results from the simulator-generated reports shown in Figure 15. The Fuel Management program is effective at teaching some specific control skills, and represents analogical transfer, which “involves using a familiar problem to solve a problem of the same type” (Reeves & Weisberg, 1994). Here, the skills learned are quite

76
specific, and not easily adapted to other situations. Indeed, learning how to properly shift a manual transmission does little to inform drivers of how to properly shift the push-button automatic transmissions that are becoming increasingly common within ADOT. It should be noted, however, that the CBT (described previously) does emphasize several tactical skills associated with fuel efficiency (e.g., moderate speed, awareness of torque curves, etc.) that are applicable to both manual and automatic transmission vehicles.
Costs of Shifting-Related Maintenance Items The ASU research team performed an initial study of Equipment Services work orders from the Globe District, searching specifically for driveline-related (e.g., clutch, transmission, throw-out bearing, etc.) repairs. Clutch adjustments are a fairly common maintenance issue (approximately six in two years). These involved approximately one-quarter of the 23 trucks with standard shift in the fleet based in the Globe District. The associated costs are, however, modest (approximately $150 per instance). Very few other driveline-related repairs were found in the preliminary review of Equipment Services reports. An additional study will review these maintenance figures more completely.

77
VIII. CONCLUSIONS FINDINGS Before addressing detailed recommendations, it is worthwhile to review the major findings of this study. 1. Overall satisfaction with the simulator training reflects expectations regarding the focus of the program.
Surveys and focus groups indicated strong interest in the potential for simulator training in sharpening awareness of hazards, and offering opportunities to respond to these challenges. Drivers who had only “sampled” the simulator in Year One were eager to spend more time on it (which they assumed would help them to respond more effectively to the major challenges they face in snowstorms). The Globe drivers in Year Two generally felt that they had sufficient exposure to the simulator and were anxious that the fall Driver Awareness training could be enhanced to give them more time and practice in dealing with the real-world challenges they face. These drivers pointed out that they drive on rural roads rather than on the freeway presented in one of the scenarios. They also felt they needed more practice in dealing with traffic and driving in conditions with limited visibility. In the Globe focus groups in Year Two, there was a clear divergence in expectations and enthusiasm for the simulator between experienced and less experienced drivers. Inexperienced drivers felt the awareness training really gave them a jumpstart on the season, and all agreed that the simulator program should focus on less experienced drivers. More experienced drivers had been expecting that the course would offer a refresher in how to drive a snowplow. Consequently, they were dissatisfied when they found that the current simulator did not include such features as controls for a sander or for lifting a plow, and therefore did not replicate the complex multi-tasking of activities experienced by snowplow operators. In reality, the intent of the simulator training was to focus on situational awareness, safety and, and decision making. It was intended to train drivers to be more alert to their surroundings, to anticipate (and therefore avoid) potential hazards. It does that very well by capturing the attention of drivers with scenarios that are graphically realistic. Perhaps the real issue is a need for clarity in marketing the course to focus on what it is really intended to do. Clearly, the Globe supervisors were enthusiastic supporters of the simulator, which they felt met their expectations of a program that could alert drivers to hazards, and thereby increase safety. 2. The quantitative data alone are not of adequate quality to justify the implementation of a simulator-training program. As a parallel to the above qualitative assessment, the study also conducted an extensive quantitative analysis. Here, the impact of simulator training was studied in terms of its

78
potential to reduce state operational losses (e.g., accidents and liability claims). The study included all the districts that participated in the Year One simulation training program: Globe, Flagstaff, Holbrook, Kingman, and Safford. A five-year baseline study attempted to establish the average costs per district based on exposure to hazards in terms of miles and hours of snowplowing activity. As noted elsewhere, “hours of activity” on the road is an equal or even more relevant measure of driver exposure to harm than is simply his or her miles driven while plowing. These baseline figures were also associated with snowfall per snow season, by district. Similar figures were collected for Prescott, which was offered no simulator training. There was a clear reduction in operational losses in the Globe District, in terms of all measures of exposure between the 2004-05 snow season and the 2005-06 snow season — after all drivers had participated in simulator training. As Table 9 shows, the operational losses per mile for Globe, with no compounding, were $0.25 per mile in 2004-05 and $0.19 per mile in 2005-06. In terms of snowplowing hours, the parallel figures were $6.82/hour in 2004-05 and $5.07/hour in 2005-06. The operational loss per inch of snow in 2004-05 was $574.23/inch and $349.55/inch in 2005-06. These findings from Globe are encouraging, but they cannot be regarded as a trend. The parallel figures varied considerably over the five years of the baseline study. Findings are inconclusive primarily because there are very few accidents involving snowplows each year, and any major accident severely skews the operational loss figures for a given district in that year. Simulator training is, of course, intended to reinforce other driver training programs and to help drivers avoid accidents. However, there is no quantifiable way of indicating accident avoidance. Anecdotal discussions in the focus groups came closest to documenting accidents avoided due to clear thinking on the part of the drivers. Several Globe drivers actually attributed their clear thinking to training received in the Driver Awareness training sessions. 3. The relationship between simulator training and the potential savings generated by the avoidance of road closures (and corresponding shipping delays) is also difficult to quantify, but worth considering. However, we know that the snowplow curriculum on the simulator is designed to enhance snowplowing efficiency and effectiveness. And we also know delays in plowing roads can lead directly to economic losses for shippers and their customers. Nationally, the estimated cost of weather-related delays cost trucking companies $2.2 to $3.5 billion annually. On freeways, light rain or snow can reduce speeds by 10 percent, while heavy snow can reduce speeds by 40 percent. It is estimated that 90 percent of trucks traveling on I-40 in Arizona are driving through the state. Approximately 5,177 commercial vehicles travel the full extent of I-40 in Arizona, a trip of 355 miles each day during the winter snow season. The estimated cost of a one-hour delay is approximately $65 per commercial vehicle. Hence, if all the commercial vehicles crossing the state on any one day in the winter snow season were limited to an average of 40 MPH on a snowy or slushy roadway (rather than at 60 MPH

79
on a cleared dry roadway), then the costs of the resulting three-hour delay to shippers would be more than more than $1 million. Increasing the effectiveness of snow removal is one of ADOT’s fundamental goals. 4. The Fuel Management training program appears promising in its ability to improve fleet fuel economy and reduce those maintenance costs associated with driving techniques (e.g., gear shifting). Fuel costs for all ADOT diesel vehicles were $2.4 million in 2005. That figure, for an equivalent of the 1 million gallons of diesel fuel used in 2005, could easily rise to $3 million with rising fuel costs. Using the simulator to enhance proper shifting techniques can likely save on fuel costs if drivers successfully transfer their training to the real world of heavy truck operation. Snowplow drivers unanimously reported that fuel saving was the last thing on their minds during the challenges of snow plowing. Attention to fuel management can, however, relate more broadly to driving a full array of trucks year-round. Avoiding clutch and transmission damage while pulling a full load on a grade should be the first thing on the mind of a skilled driver. The simulator training in proper shifting techniques could potentially reduce ADOT costs for regular maintenance by training drivers in proper use of the clutch and clutch brake, and in techniques for reducing stress and subsequent damage to the drive train. Over time, these costs can be considerable, not just in the actual repair costs but also in the time that the vehicle is idled for repair. An additional study in 2006-07 will take a closer look at the potential for economic savings in fuel and repairs related to simulator-based training. An additional consideration will be the use of fuel in idling, and whether a policy change like that proposed in Iowa (i.e., setting idling time limits) can have significant impacts in fuel savings. CONCLUSIONS In light of these findings, it is worth repeating the conclusion reached by Hoskins, et al., (2002): “The most significant disadvantages of driving simulators are a lack of consistent experimental support for simulator training and knowledge transfer” (p. 52). Although this study does not demonstrate statistically significant quantitative “experimental support for simulator training and knowledge transfer,” it nevertheless uncovered many valuable qualitative insights over two winters of activity in Arizona.
How Real is Real Enough? Many trainees — especially those with many years of driving experience — criticized the simulator for its lack of realism. Yet, from what the researchers were able to learn from the surveys and focus groups, even these skeptical trainees seemed to have learned something from the Driver Awareness and Fuel Management courses. One might reasonably expect there to be a strong relationship between simulator realism and knowledge transfer, but this is not necessarily so. According to Vance et al. (2002), the realism (or fidelity) required of a particular simulator depends upon the training to be conducted, and “certain tasks and skills can be learned even in very crude simulators.” In fact, according to these researchers:

80
Reasoning or cognitive ability tasks do not require high physical fidelity levels. The skills in these settings are generalizable to many different areas, not only truck driving, and the physical layout need not be exact. High physical fidelity is necessary when the training involves learning perceptual-motor skills, or the interaction of the trainee with the layout of the equipment. An example of where high fidelity is needed is when the goal is to practice tasks that cannot be practiced in the field because they are too dangerous, such as simulated spinouts on ice. (p. 13)
Transfer of Training In order to evaluate the effectiveness of the ADOT simulator training program, therefore, the study team focused attention not on the fidelity of the simulator, but on transfer of training. The ability to apply what is learned in one context to another context is generally called transfer of training (Goldstein, 1986). In the case of the current study, this refers to the ability of snowplow operators to apply what they have learned in the simulator training course to on-the-road driving practice. If drivers trained in the simulator perform better on the road than drivers not training in the simulator, then it should be concluded that positive transfer has occurred. For the purposes of the current study, in which all the snowplow operators in the Globe District were trained in the simulator, the control group is — by default — made up of drivers from other districts. But because of the considerable differences (e.g., snowfall, road types, etc.) among districts, a true A-to-B comparison is not possible. Findings, however, do suggest areas in which positive transfer may have occurred. As Emery et al. (1999) note, “The validation of simulation… for the training of a particular skill is most appropriately addressed through an assessment of whether that training actually transfers to the environment in such a way as to encourage skill proficiency and safe operating practices.” But what, precisely, are the particular skills these drivers need? And, are these skills being taught in the Driver Awareness, and Fuel Management courses?
Driving Skills and Transfer of Training Put into very simple terms, the Driver Awareness (SIPDE) program seemed to do a good job of training tactical skills, but a poor job of training control skills. The Fuel Management/Shifting program, on the other hand, seemed to do a good job of teaching control skills. Yet all of the training took place on the same driving simulator. Transfer of training, therefore, seems to have as much to do with the skills being trained as the simulator’s realism (or fidelity). A closer look at Table 6 (p. 39) reveals some interesting relationships. It can be seen, for example, that the Driver Awareness program addresses primarily tactical driving skills related to Driving and Communicating activities. The tactical skills associated with driving activities include avoiding other drivers and objects, and monitoring vehicle speed — all issues emphasized strongly in the Driver Awareness (SIPDE) curriculum. Results of surveys, focus groups, and the performance reports generated by the simulator

81
itself all suggest that the simulator was relatively successful in these areas, as was discussed previously. The drivers who participated in the Driver Awareness training suggested that the SIPDE program seemed to do a good job of training for tactical skills (like enhanced awareness and safety considerations) but it did not provide control skills training. Some drivers went so far as to say that the simulator’s lack of realism (no plow controls, no spreader controls, etc.) made it “useless” as a training tool. However, while it is true that these operational skills are not addressed in the Driver Awareness program, it is important to note that the SIPDE program was never intended to teach control skills. The curriculum focuses on overall Driver Awareness (tactical skills) and the L-3 TranSim VS III model simulator, as now configured, lacks the physical fidelity to facilitate training of many control skills. This same lack of fidelity means that some tactical skills, like those associated with plowing and spreading activities, cannot currently be taught realistically using the simulator. Drivers are, however, encouraged to “talk through” some of these aspects, as part of the Driver Awareness course. Efforts are ongoing to create desired changes to the L-3 software, and to the hardware by adding plow blade and sander controls. While the Driver Awareness program was broadly focused, the Fuel Management training program was narrowly focused — emphasizing proper gear shifting (and related clutch usage). As shown in Table 6, gear shifting is comprised of control-level driving skills corresponding to the Driving activity of snowplow operation. And here, positive transfer of training seems to have taken place. (The add-on study will attempt to quantify this.) Drivers reported that they quickly applied what they had learned on the simulator to their everyday driving, and saw positive results (not only in ADOT vehicles, but in their personal vehicles as well). This supports the findings from the simulator-generated reports, shown in Figure 15. Although not statistically significant, the results do suggest positive transfer of training of tactical skills for the Driver Awareness training course, and control skills for the Fuel Management course. The ASU team is further suggesting that the form of knowledge transfer taking place differs with the level of driving skills being taught. The Driver Awareness (SIPDE) program is effective at teaching tactical skills, and represents adaptable transfer, which “involves using one’s existing knowledge base to change a learned procedure, or to generate a solution to a completely new problem” (Ivancic & Hesketh, 2000). Clearly, the various elements of the SIPDE program (Search, Identify, Predict, Decide, and Execute) are easily adapted to a range of situations facing snowplow operators (and drivers in general). The Fuel Management program, on the other hand, is effective at teaching control skills, and represents analogical transfer, which “involves using a familiar problem to solve a problem of the same type” (Reeves & Weisberg, 1994). Here, the skills learned are quite specific, and not easily adapted to other situations. Indeed, learning how to properly shift a manual transmission does not inform drivers how to properly shift the push-button
82
automatic transmissions that are becoming increasingly common within ADOT. Nevertheless, the fuel management/driver skills curriculum does instruct drivers about optimal engine torque and revolutions per minute (RPM), as well as other professional driver “best practices” that can be adapted to driving any type of vehicle. DISCUSSION Simulator Fidelity and Driving Skills New and experienced snowplow operators seem to want different things from simulator training. While the novices are content with learning needed tactical-level driving skills, veterans look to the simulator primarily for a “refresher course,” focused on control-level skills (the skills they don’t get during their daily off-season work). How well each group of drivers will respond to simulator training, therefore, may depend on the driving skills being taught (which, in turn, relate to the necessary physical fidelity of the simulator). For states like Arizona, with high rates of driver turnover, even simulators with relatively low physical fidelity can be very useful for training tactical-level driving skills. Although control-level or “specialty” skills require increased levels of physical fidelity, it seems quite reasonable to suggest that the tactical-level skills are more closely related to issues of safety — the primary concern of DOTs. This, of course, is precisely the point emphasized in Driver Awareness courses (such as the L-3 SIPDE course). The strong relationship between safety and tactical skills may help to explain the supervisors’ enthusiasm for the current simulator-based training, as compared to the more restrained praise offered by veteran drivers. Supervisors commented that the simulator training helped new drivers gain the confidence they needed to get behind the wheel of a snowplow, but they also noted that all drivers needed to sharpen their skills in anticipating and responding to hazards along the road. Quantitative Data and Driving Skills It may be easier to quantify transfer of control-level skills than transfer of tactical-level skills. Because tactical skills are more “big picture” skills, they are also more complex to study and measure. It’s relatively easy to determine if drivers are shifting gears more efficiently (e.g., fuel consumption, reduced clutch maintenance, etc.), but it is much more challenging to determine if drivers are Searching, Identifying, Predicting, Deciding, and Executing. For the purposes of a cost/benefit analysis, focusing on issues related to control-level skills may prove more fruitful than focusing on more elusive issues related to tactical-level skills. However, if it is true that safety issues are more strongly related to tactical skills, then issues related to tactical skills must not be ignored for the sake of a simpler cost/benefit analysis. Also, it may be true that “over-learning” control-levels skills “frees up” cognitive resources, and therefore indirectly improves performance of tactical skills.

83
Presenting Training Programs to Trainees How a training program is presented to trainees is critical to its success. For example, some drivers resented being taught “Fuel Management.” In fact, the drivers were virtuously unanimous in their opinion that saving fuel while at the same time plowing snow was nearly impossible. However, they were quite eager to learn about proper shifting techniques (which was the real focus of the course). Similarly, the Driver Awareness (SIPDE) course was generally referred to as “Snowplow Simulator Training,” which built up specific expectations (e.g., the inclusion of control-level skills training) in the minds of trainees. Had the course been called “Driving Awareness Training,” perhaps it would have been better received (especially by those who criticized its lack of realism). The first step in designing or purchasing a training program, then, ought to be asking what driving skills are needed (this ought to be straightforward, since training is generally aimed at “fixing” some existing “problem”). Are the skills to be taught control-level or tactical-level skills? How the course is “marketed” to trainees (and others in the organization) should be based on the skills being taught. It seems reasonable to assume that training programs that are better received by trainees are more likely to be effective. In mid-2006, ADOT formed a Simulator Working Group (SWG) to connect the pilot-program experience of the Globe District and its existing L-3 simulator with the new Flagstaff and Holbrook simulator training teams. This regional team of field operator-trainers will focus on offering consistent responses to these questions. The SWG has already modified the PowerPoint slides associated with the fall SIPDE training course to include some materials related to driving techniques along with the original driver awareness materials. The group has also reassessed the simulator-based training programs and decided to market them to trainees as Driver Awareness and Driving Techniques courses. By making the objective of each course clear in its title, the SWG hopes to reduce experienced drivers’ criticisms of the fall SIPDE course that does not — and is not intended to — offer control-level operational training. Marketing the spring course as a “driver skills” course will capture the interest of all drivers, not just those driving trucks with manual transmission. Capitalizing on ADOT Trainers Globe District trainees were unanimous in their praise of the ADOT trainers, who are all veteran snowplow operators. In fact, the trainees reported that they learned a great deal over the course of both the Driver Awareness and Fuel Management courses that wasn’t directly related to the simulator at all. It seems they learned as much from the low-tech storytelling aspects of the training sessions as from the high-tech simulator. These in-house trainers are valuable assets to the organization, and could be leveraged further in a variety of training programs (especially important in organizations with high turnover rates). And, because the ADOT trainers have such a wealth of personal experience, they are able to teach both tactical- and control-level driving skills (which may or may not be taught in the simulator).

84

85
IX. RECOMMENDATIONS The following specific recommendations (not necessarily listed in order of priority) are drawn from the assessment and the report. One list includes short-term recommendations that can be adopted within the next year, considering both the urgency and feasibility of implementation. The long-term items are important as well, of course. They will, however, require more effort in implementation. Responding to the driver-related issues on the short-term list this season, however, would help to ensure continued driver involvement and enthusiasm with the training program — which does, of course, represent a considerable ADOT investment. Regular updates to the snowplow Driver Awareness training curriculum will be needed to continue to maintain enthusiasm for the program — and for the simulator as a learning tool. The drivers have shared their interests and concerns — they anticipate changes to the simulator-training program in response. The agenda of the Working Group does, in fact, include regular updates to the training programs. SHORT-TERM RECOMMENDATIONS 1. Complete a detailed needs analysis. The new multi-district Working Group should perform a detailed needs analysis, using this report (and the recommendations herein) as a starting point. It is critical for the working group to understand clearly the “opportunities and limitations of the specific simulator” as well as “how the simulator is to be used as part of a training program” (Emery et al., 1999). In other words, now that simulator training is being implemented, it is critical that ADOT understand precisely which training needs it can best meet. 2. Make full use of capabilities of L-3 simulators. The Working Group should seek to understand in-depth the capabilities of the L-3 simulators owned by ADOT. There are a number of dimensions of the simulators that have not yet been fully deployed. The CDL module may be of special interest since it (1) has yet to be deployed by ADOT, and (2) may be particularly useful in light of the high turnover rate within the state. 3. Set a consistent policy on type of vehicle transmission and potential fuel economy. District supervisory personnel should focus on the consistency of policy regarding the type of transmission on heavy equipment and the potential for fuel economy. There is considerable evidence that automatic transmission trucks are less fuel-efficient than those with manual transmissions. The simulator’s Driving Techniques program can, with adequate driver practice, likely improve the fuel economy of vehicles with manual transmissions. Most drivers in both the Year One and Year Two focus groups preferred the manual transmission vehicles. Nevertheless, Districts/ORGs are proceeding to place orders for vehicles with automatic transmissions. It is important that the simulator-training program reflect future vehicle orders, as closely as is practicable.

86
4. Capitalize on ADOT trainers. The drivers overwhelmingly praised the ADOT trainers in surveys and focus groups. The districts should seek their input in designing new training programs (perhaps even integrating them into the existing anti-icing training). Take advantage of the “campfire effect,” witnessed this year, in which new drivers who participated in the simulator training learned from experienced drivers in a group setting (as described in the Discussion section of Chapter VIII). This may have been as valuable as the simulator training itself, although it was an unintended benefit. 5. Increase simulator seat time of new trainees. New trainees should be exposed to as much “seat time” in the simulator as possible, before being trained by other ADOT drivers in their ride-along, OJT phase. 6. Enhance course content to allow more practice addressing real world challenges. Enhance the content of the simulator courses to provide more opportunities for drivers to practice with scenarios that address what they perceive to be their real-world challenges. For example, drivers in the fall course reported that they were most concerned with responding to unanticipated actions by motorists who are unfamiliar with driving on snow and ice. These issues are raised in the simulator program, but drivers are interested in more practice with more scenarios focusing on these issues. Other concerns shared by a large number of drivers were driving in whiteout conditions, nighttime driving, and avoiding hazards — particularly in conditions with low visibility. Again the simulator did “turn day into night” and add iced over windshields, but the drivers want more practice in dealing with these challenges. These concerns relate directly to the safety component of the Driver Awareness program. 7. Focus Driving Techniques on functions related to all participants. Redirect driver technical skills courses to include training on key functions that will relate to all participants and encourage them to make changes in their day-to-day operations. For example, if the program is focused on shifting, include applications for automatic vehicles as well. If the objective is to reduce maintenance costs, include sections on the clutch brake and appropriate shifting techniques, but also include sections on riding the brake and slipping the clutch while at signalized stops or stop signs. The drivers respond enthusiastically to programs that have immediate practical application. Using the simulator to offer a variety of control-type training courses (as much as is possible, given the current limitations of the L-3 simulators, as described previously), including CDL training, will maintain driver interest, and potentially offer quantifiable data supporting the simulator’s use for this type of training. 8. Offer drivers documented feedback on performance in Driver Awareness. Offer all drivers documented feedback on performance in the Driver Awareness program and the opportunity for extensive practice, so that they can improve in areas of concern. The fuel management program’s pre-tests and post-tests are very effective in assisting individual drivers and underscoring areas that need more attention in future training programs. A similar approach for the Driver Awareness program would help to document

87
the effectiveness of the course in the transfer of training, at least in this simulated environment. 9. Increase use of simulator-generated training-session performance reports. Enhance the Driving Techniques course by focusing more attention on the reports generated by the simulator. The criteria for these reports can be set to reflect the policies and concerns of the district, the Simulator Working Group, and ADOT. What are the most significant issues with driving? The SWG can establish and prioritize criteria that reflect ADOT policies. The current simulator report notes as most important: putting on hazard lights when driving under 40 miles an hour, sliding at signalized stops, wearing a seat belt, and avoiding collisions. However, other issues may be more important in a particular district. The simulator-generated report identifies about 20 concerns, and notes driver performance in relation to these. The trainers should spend more time on whatever issues are deemed important, and then offer a post-test to evaluate improvement. 10. Offer separate courses for experienced and less experienced drivers. It would be wise to separate experienced drivers, who have already been through the fall Driver Awareness course, from less experienced or new drivers for future Driver Awareness courses. New hires and less experienced drivers are very enthusiastic about the simulator and what it can do for helping them prepare for the snow season. It is important to offer experienced drivers sufficient challenges to keep them engaged with the simulator training program. 11. Offer an advanced class for experienced drivers. Offer the experienced drivers an advanced class, with a heavy focus on tactical issues that are challenging for all drivers - including dealing with motorists, visibility, and hazards - in as realistic a setting as possible, and then market it appropriately as Driver Awareness training. For most Globe District drivers, realism is associated with mountain rural roads. Although the current simulator does not have controls for sanders, lifting the plow, or backing up, it does include shifting and braking. Perhaps a scenario that includes mountain roads in low visibility, with the additional requirement of appropriate shifting, would begin to approximate at least some of the challenges faced by experienced drivers. 12. Provide independent practice time for less experienced drivers. Provide more independent practice time for less experienced drivers, in particular, so that they can better integrate their simulator and their OJT. This should be done for all future simulator training programs (SIPDE, Driving Techniques, etc.). 13. Incorporate references to de-icing in Driver Awareness course. Snowplow drivers participate in de-icing training courses, as well as Driver Awareness courses. It would be helpful to link the two training programs by incorporating references to the de-icing training in the Driver Awareness simulator course. It would be possible to highlight the correct timing for applying the chemicals, and encourage the driver to regularly check the (imaginary) temperature gauge.

88
14. Provide closer linkage in record keeping. Modify current ADOT record keeping activities such that detailed fuel economy numbers and routine repairs can be more readily combined with PECOS data for analysis. This will be a substantial help to the ASU research team in the new second-phase project, as well as to all others attempting to document simulator training effectiveness.
LONGER-TERM RECOMMENDATIONS 1. Maintain state-wide consistency in simulator training. Maintain as much consistency in the simulator training across the state as is practicable. Obviously, there are some aspects of winter training that vary by district or by ORG (e.g., type of and amount of de-icing materials used), so it is critical to determine which aspects of training must reflect statewide policy, and which reflect local policies. These distinctions must be recognized by, and incorporated into, all winter training activities — including simulator training. The SWG is a valuable step in this direction. 2. Develop scenarios that reflect Arizona roadways. Work with L-3 to create new scenarios that better reflect actual ADOT roadways. Scenarios that include turning around should also be added, as this was an issue of concern voiced by drivers in the surveys and focus groups. Scenarios reflecting the real-world roadways encountered by drivers in each district could be used as the backdrop for a number of lessons involving response to limited visibility, hazards, and motorists unfamiliar with driving on icy roadways. 3. Develop a scenario related to the wing plow. Work with L-3 to develop a scenario that accommodates the width of a wing plow along a winding road so that the drivers can begin to understand the challenges of driving with a wing plow. Currently, there are very few drivers in the Globe District certified to drive a wing plow. More need to be trained, especially in light of recent incidents in which drivers have inadvertently damaged their wing plows. 4. Modify a simulator to include switches related to controls. Before purchasing additional simulators, field modify at least one of the existing ADOT simulators to accommodate some of the real-world controls so strongly requested by the drivers (especially those with greater levels of experience). For example, add a road temperature sensor and sander controls to the simulators, so that experienced drivers receive a more challenging, more engaging refresher course each year. As the same time, newer drivers would get to practice critical control-level skills in the safety of the driving simulator, rather than in the much riskier real world. L-3 is currently working to further refine their simulators with more of this type of control switches. 5. Add a switch relating to lifting the plow. Enhance the simulator learning environment and reinforce ADOT policy by adding a control switch for lifting the plow, and noting the driver’s appropriate response in the computer record. At present the simulator has the driver just drive over railroad tracks,

89
bridge joints, and cattle guards, without providing any indication that he is responding to the trainer’s warning that the vehicle is approaching a hazard. 6. Add a control switch to the simulator to apply deicing chemicals. There is currently no control to apply the de-icing chemicals. A short-term solution would have the driver instructed to announce when he would begin application. In the future, a new scenario could be created that links the Driver Awareness simulator training with the de-icing training. The simulator training could then be used to indicate successful application of chemicals. SUMMARY Two years of experience with simulator training for snowplow operators in Arizona leaves an optimistic feeling about the potential of driving simulators as an integral part of a comprehensive driver training program for ADOT. Clearly, there are elements of ADOT’s driver training programs for which the simulator is not well-suited (as has been described in detail previously in this report), and nothing can replace real-world behind-the-wheel training. Broadly speaking, the existing L-3 simulators seem to be better at training for tactical-level driving skills than for control-level driving skills. However, when appropriately equipped, these same simulators can be effective tools for teaching control skills as well. An additional ADOT study is planned that will focus primarily on use of the simulator to further year-round fuel efficiency, and to reduce repair costs, by training drivers in proper gear shifting (a control-level skill). As the new study proceeds through a third winter, the research team will continue to evaluate the simulator’s effectiveness, in an effort to build the “experimental support for simulator training and knowledge transfer” sought by Hoskins, et al. (2002).

90

91
APPENDIX A
MID-SEASON TRAINEE SURVEY QUESTIONNAIRES (TWO YEARS)

92

93
SNOWPLOW SIMULATOR TRAINING PROGRAM – YEAR ONE FIVE STUDY DISTRICTS - PARTICIPANT SURVEY - JANUARY’05
District_________________ Date_______________ Please take a few minutes to respond to this anonymous survey on your experience with the snowplow simulator training in December. Your responses will be very helpful in guiding plans for snowplow driver training in the future. I. Background questions: Please check as appropriate.
1. How long have you been driving a snowplow? ____Less than 1 year ____Years (Please fill in the correct number) 2. Have you driven/operated heavy equipment? ___No ___Yes ___________________________type _____years 3. What age group are you in? Please check one. ___25 or younger ___46-55 ___26-35 ___56-65 ___36-45 ___Over 65
II. Overall Assessment of Snowplow Simulator Training 4. What are the 3 most challenging maneuvers for you when driving a snowplow? Please list. a.______________________________________________________________________ b.______________________________________________________________________ c.______________________________________________________________________ 5. Did the simulator-training program offer ideas related to any or all of these issues? ____Yes, Which ones?________________________________________________ ____No 6. What were the 1 or 2 primary ideas that you recall from the simulator-training program? a.___________________________________________________________________ b.____________________________________________________________________

94
III. Workload in simulator training On a scale of 1 to 5, rate your experience with the driving simulator. Please circle the number that seems to fit best. 7. Were the tasks in the simulator training demanding or complex? 1 2 3 4 5 Easy Very demanding 8. How much pressure did you feel due to the pace at which the tasks occurred? 1 2 3 4 5 No Pressure Very stressful 9. How successful do you think you were in accomplishing the goals set by the trainer or yourself? 1 2 3 4 5 Not very successful Very successful IV. Overall rating 10. What did you find most valuable about the course? Check all appropriate.
____a. The classroom lectures included helpful information ____b. There was no actual risk in the driving program. ____c. The simulator included real life situations. ____d. The trainer offered helpful advice and strategies ____e. Other. Please note______________________________
11. What aspects of the program would you change? Check all appropriate. ____a. Provide more time in the simulator. ____b. Include more simulator time on the issue of (fill in)__________________ ____c. More scenarios that relate to the real issues in OUR district ____d. Provide the program specifically for newer drivers. ____e. Other (fill in)_________________________________ Thank you for your help! Please return this form to your field training officer.

95
GLOBE DISTRICT SNOWPLOW DRIVER TRAINING SIMULATOR – YEAR TWO
Participant Survey—Spring 2006 SNOWPLOW SIMULATOR TRAINING offered in Globe in FALL 2005
Please take a few minutes to respond to this survey on your experience with the driver training simulator training programs offered in the Globe District this year. Your responses will be very helpful in guiding plans for snowplow driver training in the future. Your answers will be kept confidential and will only be presented as part of a summary report. I. Background questions: Please check as appropriate.
1. How long have you been driving a snowplow? ____Less than 1 year ____Years (Please fill in the correct number) 2. Have you driven/operated heavy equipment? ___No ___Yes ___________________________type _____years 3. What age group are you in? Please check one. ___25 or younger ___46-55 ___26-35 ___56-65 ___36-45 ___Over 65
II. Overall Assessment of Snowplow Simulator Training Offered in Fall 2005 4. What 3 maneuvers are most challenging for you when driving a snowplow? List. a.______________________________________________________________________ b.______________________________________________________________________ c.______________________________________________________________________ 5. Did the simulator-training program offer ideas related to any or all of these issues? ____Yes, which ones? a.________________________________________________ b.________________________________________________ c_________________________________________________ ____ None of them.

96
6. What were the primary concepts that you recall from the fall 2005 snowplow simulator-training program? a.___________________________________________________________________ b.___________________________________________________________________ 7. What concepts presented in the snowplow simulator training program were you able to use on the job? a.____________________________________________________________________
b.____________________________________________________________________
c.____________________________________________________________________ d. _____ None of them, because the concepts were not relevant. e.______ None of them, because I didn’t drive a plow for snowplowing this season. III. Workload in the snowplow driver simulator training program Interaction with the snowplow simulator became increasingly complex with the various scenarios. On a scale of 1 to 5, rate your experience with the driving simulator. Please circle the number that seems to fit best. 8. How much pressure did you feel due to the pace at which the tasks occurred? 1 2 3 4 5 No Pressure Very stressful
9.Overall, were the tasks in the simulator training demanding ? 1 2 3 4 5 They were easy They were very demanding 10.. How successful do you think you were in accomplishing the goals set by the trainer or yourself? 1 2 3 4 5 Not very successful Very successful IV. Overall rating of the fall 2005 snowplow simulator training program 10. What did you find most valuable about the fall 2005 snowplow course? Check all appropriate.
____a. The classroom lectures included helpful information ____b. The simulator let me practice some complex maneuvers without risk. ____c. The simulator modules included real life situations ____d. The trainer offered helpful advice and strategies ____e. Other. Please note______________________________

97
11. What aspects of the fall 2005 snowplow training program would you change? Check all appropriate. ____ a. Provide more time in the simulator. ____ b. Include more simulator time on the issue of (fill in)__________________ ____ c. More scenarios that relate to the real issues in OUR district, for example _______________________________________________________________ ____ d. Provide the program specifically for newer drivers. ____ e. Other (fill in)_________________________________ ________________________________________________________________________ V. FUEL TRAINING SIMULATOR offered in Globe in Spring 2006 12. Did you have the opportunity to take the fuel utilization simulator training? ____a. Yes Please continue with the survey. ____b. No Please skip to question 17 at the end of the survey. 13. What aspects of the fuel training program did you find most helpful?
14. Did you have the opportunity to try out any of these ideas while driving a plow? _____ a. Yes _____ b. No (I did not drive a plow after taking the fuel training course) If yes, which ones? _______________________________________________________________________ 15. Were any of the ideas raised in the fuel training useful to you while driving other heavy equipment? ______a. Yes ______b. No If yes, which ones?

98
16. What suggestions do you have for improving the fuel simulator training program? 17. Do you have any other comments on using the simulator as part of driver training?
Thank you for your help! Please return this form to your field training officer By May 15, 2006

99
ALL STUDY DISTRICTS SNOWPLOW DRIVER TRAINING SIMULATOR – YEAR TWO
Year One Participants during 2004-2005 snow season (except Globe) Last year a number of snowplow operators in your district participated in a driver training simulator program. We are interested in your thoughts about whether you were able to use any of the concepts included in that training program in this year’s snow season. Could you please take a few minutes to respond to this short questionnaire? Your responses will be very helpful in guiding plans for snowplow driver training in the future. Your answers will be kept confidential and will only be presented as part of a summary report. SNOWPLOW SIMULATOR TRAINING given in YOUR DISTRICT - FALL 2004 I.. Background questions: Please check as appropriate.
4. How long have you been driving a snowplow? ____Less than 1 year ____Years (Please fill in the correct number)
5. What age group are you in? Please check one. ___25 or younger ___46-55 ___26-35 ___56-65 ___36-45 ___Over 65
3. What were the primary ideas that you recall from the fall 2004 snowplow simulator-training program? a.___________________________________________________________________ b.____________________________________________________________________ 4. What ideas presented in the simulator training program were you able to use on the job this snow season? a.______________________________________________________________________
b.____________________________________________________________________
c.__________________________________________________________________________ d. _____ None of them, because the concepts were not relevant. e.______ None of them, because I didn’t drive a plow for snowplowing this season.

100
5. Would you be interested in taking additional snowplow driver training using a simulator? __Yes __No 6. Do you have any suggestions as to how we could improve the driver training program? Please check all appropriate. ____ a. Provide more time in the simulator. ____ b. Include more simulator time on the issue of (fill in)__________________ ____ c. Provide more scenarios that relate to the real issues in OUR district, for example _______________________________________________________________ ____ d. Provide the program specifically for newer drivers. 7. Do you have any other comments on using the simulator for driver training?
Thank you for your help! Please return this form to your field training officer by May 15, 2006.

101
APPENDIX B
MOST CHALLENGING MANEUVERS FOR SNOWPLOW OPERATORS (YEAR ONE)

102

103
Challenging Maneuvers for Snowplow Operators – Year One Survey
Challenging Maneuver
Number of Drivers Noting this Maneuver
Percent of Respondents Noting This Maneuver
Percent of Respondents
Feeling Covered in Simulator
Training
Percent of Respondents Feeling
NOT Adequately Covered
Traffic Crowding Plow
44 17% 66% 34%
Limited Visibility 41 16% 33.3% 66.6%
Obstacles on Side of Road
17 6.5% 80% 20%
Driving in city Traffic
16 6.2% 66.6% 33.3%
Operating the Truck
15 5.8% 66.6% 33.3%
Snow Packed Roads
14 5.4% 0% 100%
Mt. Roads with Ice
9 3.4% 25% 75%
Reversing Plow 9 3.4% 50% 50%
Determining Appropriate Speed
9 3.4% 50% 50%
Avoiding Pedestrians
8 3.1% 82% 18%
Staying on the Road
8 3.1% 80% 20%
Seeing at Night 7 2.7% 56% 44%
Turning at Intersections
7 2.7% 57% 43%
Switchbacks 7 2.7% 20% 80%
Driving Down Hill
7 2.7% 88% 12%
Finding Shoulders 7 2.7% 50% 50%
Avoiding Guard Rails
4 1.5% 75% 25%
Plowing 10 Inches of Snow
2 0.7% 0% 100%
Other ** 30 11% 37% 63% 259* 100%
* Drivers could note up
to three challenges
** Individual driver issues

104

105
APPENDIX C
SNOWPLOW DRIVER TRAINING SIMULATOR FOCUS GROUP QUESTIONS: YEAR ONE / YEAR TWO

106

107
SNOWPLOW DRIVER TRAINING SIMULATOR
FOCUS GROUP QUESTIONS – YEAR ONE Spring 2005
1. Pleases tell us a bit about the standard training typically offered within your
district for snowplow drivers?
2. Did the simulator training provide something new in terms of training? Please give some examples of how the simulator training reinforced the existing training program?
3. Thinking back on your simulator training from last December what that stands out
as having been particularly helpful to you in the rest of the plowing season?
4. Overall, did the simulator training help you performing your duties this snow season? In what ways?
Thinking a bit more about the simulator experience--
5. Did you have any problems adapting to driving the simulator? For example, did you have any problems with mirrors, plow location, and whiteout conditions?
6. Were the controls provided by the simulator adequate to capture the “real” activities of plowing? What other truck or plowing-related controls would be most useful to you in a training program like this? (Should there be plow controls? Sand/salt adjustments?)
7. Did you feel like the simulator training provided you with enough feed back on your performance? Ideally, how should you get that performance evaluation—on screen, a print out or a verbal debriefing?
8. About how many hours of simulator training do you feel would be needed for a
new driver? An experienced driver? 9. If you were designing a simulator training program, what would you suggest as
being essential?

108
GLOBE DISTRICT SNOWPLOW DRIVER TRAINING SIMULATOR
FOCUS GROUP QUESTIONS – YEAR TWO Spring 2006
Please introduce yourselves indicating how many years of snowplow driving experience and any other heavy equipment driving you have had. We are going to divide our time together into 2 parts. First, we’ll talk about the snowplow driving simulator experience and then we’ll talk about the fuel management simulator experience. 1. How many of you participated in the snowplow simulator training offered by the L-3 trainers in December 2004? Did you participate in the snowplow training offered by Globe District trainers in fall 2005? 2. What differences did you note between the snowplow simulator training you received this last year and the simulator training you received a year ago? 3. Do you feel like you had enough time in the simulator this year? About how many hours of simulator training do you feel would be needed for a new driver? An experienced driver? 4. Thinking back on your snowplow simulator training from last fall what stands out as having been particularly helpful to you in the rest of the plowing season?
5. Did you have any problems adapting to driving the simulator?
6. Were the scenarios and controls provided by the simulator adequate to capture the “real” activities of plowing?

109
Is there anything else that could be added to make the simulator experience seem closer to the real activities of plowing?
7. Did you feel like the snowplow simulator training provided you with enough feed back on your performance? Ideally, how should you get that performance evaluation—on screen, a print out or a verbal debriefing? 8. If you were designing a snowplow driver simulator training program, what would you suggest as being essential? Let’s turn now to the fuel management simulator training. 9. Did you all participate in the fuel management training simulator program this spring? 10. What stands out about that experience? 11. Was there anything that you learned in the fuel management simulator training
program that will be particularly useful in driving a snow plow? Was there anything in the training that could be used when driving other trucks? 12. What aspects of the fuel training did you newer drivers find most helpful? Did you experienced drivers find aspects of the fuel management simulation training useful? What aspects? 13. If you were to have another session on fuel management next year, how would you change it to make it more helpful? 14. The simulator is going to stay in Globe. Are there any other types of training that you would like to see added to the current simulator training programs? 15. Are there any ways that the simulator could enhance or replace other types of training programs?

110
GLOBE DISTRICT SNOWPLOW TRAINING SIMULATOR
SUPERVISORS FOCUS GROUP QUESTIONS – YEAR TWO Spring 2006
Please introduce yourselves and indicate your position. Please tell us briefly how you interact with snowplow drivers and the vehicles that they operate. Please also mention any opportunity that you have had to observe or work with the simulator training. We work like to divide our time together into 2 parts. First, we’ll talk about the snowplow driving simulator training and then we’ll talk about the fuel management simulator training. 1. What would you say were the primary objectives in housing the simulator? 2. In what areas do you think it is coming closest to meeting those objectives? 3. Are there any disappointments with the simulator training effort at this stage? 4. Have you noticed any difference in the performance of the snowplow drivers since you have had the training program here in Globe?
5. Have you heard reactions for new and/or experienced drivers?
6. In what areas would you hope that their performance would improve?
7. The drivers are anxious that the snowplow simulator training experience should be as realistic as possible. How feasible is it to add features that would make the simulator experience seem closer to reality?
Now turning to the fuel management training—
8.What do you hope to achieve with the fuel training program? Do you have any indicators that you are moving in a positive direction in terms of fuel usage?
9.The fuel training program focuses on shifting techniques as a way of reducing energy cost. How many of your heavy trucks are automatic? Are you adding more manual transmission vehicles?
10. Have you noticed any change in driving performance consumption or fuel since the drivers completed the fuel training simulator course?
(We are looking into this area and hope to do more in this area next year. We have looked through the material provided on fuel usage per month up to March. Do you know of any way that we could get fuel usage activity for April and May for this year?)

111
11. Are there any ways that the simulator could enhance or replace other types of training programs?
12. What are future plans for using the simulator?
13. The Globe District has invested heavily in the simulator training program. Do you think that this investment is paying off?

112

113
APPENDIX D
MONTHLY SNOWFALL AMOUNTS: 1999-2000 to 2005-2006

114

115
Snowfall Data from October-April for Winters 1999-2000 to 2005-2006 taken from Monthly B-91 Observer Reports – Five Study Districts
1999-2000 Snowfall in inches (116.2) Oct Nov Dec Jan Feb Mar Apr Total (in) Seligman 0 0 0 3.5 3.0 4.2 0 10.7 Painted Desert 0 0 0 0.3 0 0 0 0.3 Mc Nary 0 0 0.9 2.8 5.2 18.9 2.0 29.8 Flagstaff 0 0 0 6.3 17.1 48.4 2.6 74.4 Bisbee 0 0 0 1.0 0 0 0 1.0 2000-2001 Snowfall in inches (243.7) Oct Nov Dec Jan Feb Mar Apr Total (in) Seligman 0 1.0 0 12.0 1.5 0 1.0 15.5 Painted Desert 0 0 1.5 1.5 0 0 0 3.0 Mc Nary 6.3 12.8 7.0 28.3 22.2 10.2 10.3 97.1 Flagstaff 8.9 15.7 2.0 46.3 25.3 11.2 15.7 125.1 Bisbee 0 0 0 3.0 0 0 0 3.0 2001-2002 Snowfall in inches (84.9) Oct Nov Dec Jan Feb Mar Apr Total (in) Seligman 0 1.0 1.5 0 0 0.9 0 3.4 Painted Desert 0 0 0 0 0 0 0 0 Mc Nary 0 1.4 19.4 13.4 0.5 2.3 1.1 38.1 Flagstaff 0 6.2 26.1 5.0 0 6.1 0 43.4 Bisbee 0 0 0 0 0 0 0 0 2002-2003 Snowfall in inches (144.4) Oct Nov Dec Jan Feb Mar Apr Total (in) Seligman 0 0 1.7 0 2.4 1.9 0.5 6.5 Painted Desert 0 0 0 0 2.0 0 0 2.0 Mc Nary 0 0 26.2 0.5 26.4 23.8 3.5 80.4 Flagstaff 0.3 3.0 19.6 0.5 17.0 12.5 2.0 54.9 Bisbee 0 0 0.6 0 0 0 0 0.6 2003-2004 Snowfall in inches (109.8) Oct Nov Dec Jan Feb Mar Apr Total (in) Seligman 0 0 6.5 0.3 0.5 0 0 7.3 Painted Desert 0 0 0 0 0 0 0 0 Mc Nary 0 0 9.8 12.3 19.8 7.7 2.0 51.6 Flagstaff 0 0 1.2 9.8 27.4 12.5 0 50.9 Bisbee 0 0 0 0 0 0 0 0 2004-2005 Snowfall in inches (218.6) Oct Nov Dec Jan Feb Mar Apr Total (in) Seligman 0.2 0 0 12.5 3.2 0 0 15.9 Painted Desert 0 0 0 0 0 0 0 0 Mc Nary 1.1 12.1 5.0 25.4 17.3 9.6 1.9 72.4 Flagstaff 15.3 11.8 10.9 56.3 16.8 18.1 1.1 130.3 Bisbee 0 0 0 0 0 0 0 0 2005-2006 Snowfall in inches (114.2) Oct Nov Dec Jan Feb Mar Apr Total (in) Seligman 0 0 0 0 0 2.8 2.0 4.8 Painted Desert 0 0 0 0 0 0 0 0 Mc Nary 0 0 0 1.8 0 50.2 0.3 52.3 Flagstaff 0 0 0 1.6 0 40.0 3.0 44.6 Bisbee 0 0 0 0 0 0 0 0.2 Prescott (Year Two - control) 0 0 0 .75 0 11.5 0 12.3

116

117
APPENDIX E
SNOWPLOW OPERATIONAL LOSS COSTS: BY WINTER SEASON, BY DISTRICT

118
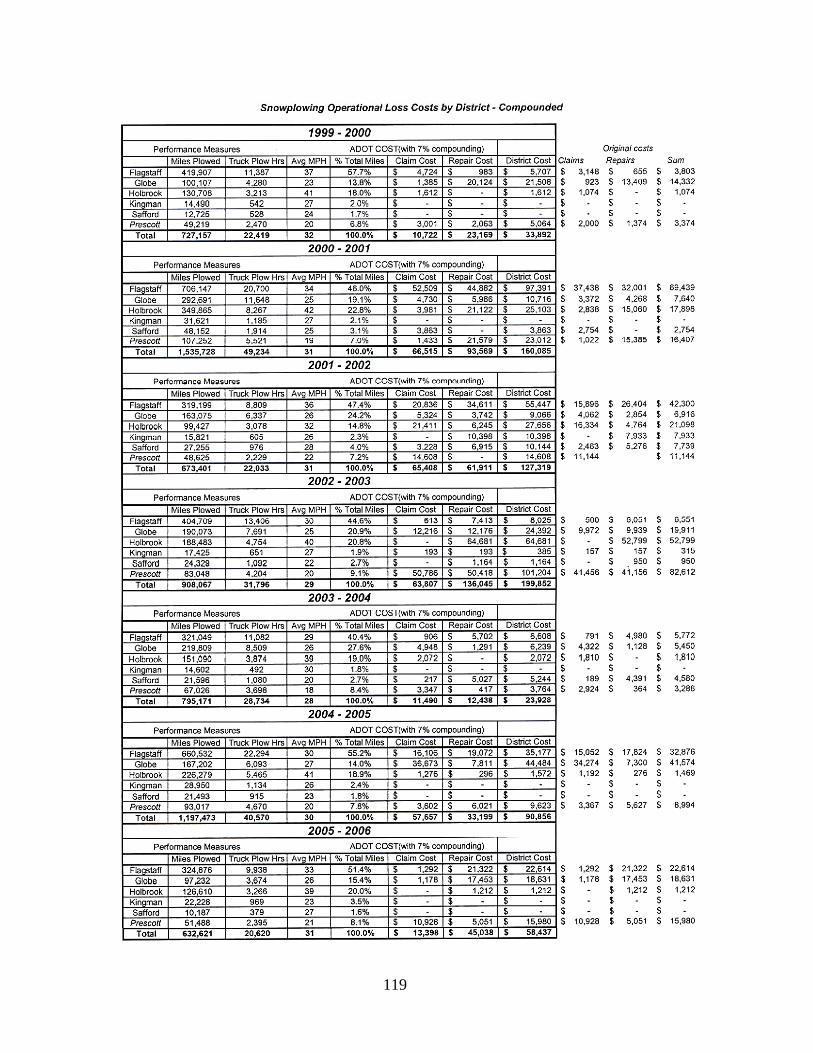
119

120

121
APPENDIX F
SNOWPLOW OPERATIONAL LOSS COSTS BY DISTRICT, BY WINTER: 1999-2006

122

123
Snow Season ADOT COST(with 7% compounding)Snowfall % Total Snowfall Claim Cost Repair Cost District Cost
1999-2000 74.40 14% 4,724$ 983$ 5,707$ 2000-2001 125.10 24% 52,509$ 44,882$ 97,391$ 2001-2002 43.40 8% 20,836$ 34,611$ 55,447$ 2002-2003 54.90 10% 613$ 7,413$ 8,025$ 2003-2004 50.90 10% 906$ 5,702$ 6,608$ 2004-2005 130.30 25% 16,106$ 19,072$ 35,177$ 2005-2006 44.80 9% 1,292$ 21,322$ 22,614$
Total 523.80 100% 96,985$ 133,985$ 230,970$
Snow Season ADOT COST(with 7% compounding)Snowfall % Total Snowfall Claim Cost Repair Cost District Cost
1999-2000 29.80 7% 1,385$ 20,124$ 21,508$ 2000-2001 97.10 23% 4,730$ 5,986$ 10,716$ 2001-2002 38.10 9% 5,324$ 3,742$ 9,066$ 2002-2003 80.40 19% 12,216$ 12,176$ 24,392$ 2003-2004 51.60 12% 4,948$ 1,291$ 6,239$ 2004-2005 72.40 17% 36,673$ 7,811$ 44,484$ 2005-2006 53.30 13% 1,178$ 17,453$ 18,631$
Total 422.70 100% 66,454$ 68,583$ 135,036$
Snow Season ADOT COST(with 7% compounding)Snowfall % Total Snowfall Claim Cost Repair Cost District Cost
1999-2000 0.30 6% 1,612$ -$ 1,612$ 2000-2001 3.00 57% 3,981$ 21,122$ 25,103$ 2001-2002 0.00 0% 21,411$ 6,245$ 27,656$ 2002-2003 2.00 38% -$ 64,681$ 64,681$ 2003-2004 0.00 0% 2,072$ -$ 2,072$ 2004-2005 0.00 0% 1,276$ 296$ 1,572$ 2005-2006 0.00 0% -$ 1,212$ 1,212$
Total 5.30 100% 30,352$ 93,555$ 123,907$
Snow Season ADOT COST(with 7% compounding)Snowfall % Total Snowfall Claim Cost Repair Cost District Cost
1999-2000 10.70 15% -$ -$ -$ 2000-2001 15.50 22% -$ -$ -$ 2001-2002 3.40 5% -$ 10,398$ 10,398$ 2002-2003 6.50 9% 193$ 193$ 385$ 2003-2004 7.30 10% -$ -$ -$ 2004-2005 15.90 22% -$ -$ -$ 2005-2006 12.00 17% -$ -$ -$
Total 71.30 100% 193$ 10,591$ 10,784$
Snow Season ADOT COST(with 7% compounding)Snowfall % Total Snowfall Claim Cost Repair Cost District Cost
1999-2000 1.00 14% -$ -$ -$ 2000-2001 3.00 41% 3,863$ -$ 3,863$ 2001-2002 0.00 0% 3,228$ 6,915$ 10,144$ 2002-2003 0.60 8% -$ 1,164$ 1,164$ 2003-2004 0.00 0% 217$ 5,027$ 5,244$ 2004-2005 0.00 0% -$ -$ -$ 2005-2006 2.73 37% -$ -$ -$
Total 7.33 100% 7,308$ 13,107$ 20,414$
Snow Season ADOT COST(with 7% compounding)Snowfall % Total Snowfall Claim Cost Repair Cost District Cost
1999-2000 10.50 15% 3,001$ 2,063$ 5,064$ 2000-2001 24.50 34% 1,433$ 21,579$ 23,012$ 2001-2002 2.00 3% 14,608$ -$ 14,608$ 2002-2003 6.50 9% 50,786$ 50,418$ 101,204$ 2003-2004 5.00 7% 3,347$ 417$ 3,764$ 2004-2005 10.50 15% 3,602$ 6,021$ 9,623$ 2005-2006 12.30 17% 10,928$ 5,051$ 15,979$
Total 71.30 100% 87,706$ 85,548$ 173,254$
Snowplowing Operational Loss Costs by District - Compounded
Safford Snowfall Data
Flagstaff Snowfall Data
Globe Snowfall Data
Prescott Snowfall Data
Holbrook Snowfall Data
Kingman Snowfall Data

124

125
APPENDIX G
MEASURES OF EXPOSURE RELATED TO OPERATIONAL LOSS COSTS

126

127
Measures of Exposure – Plowing Operational Loss Costs by District: Original-Year Cost Appendix G1
Season LOSS COSTS (Basis: Original $) Accomplishments - PECOS Exposure Costs
Flagstaff Claim Cost
Repair Cost
District Total
Miles Plowed
Plow Hours Snowfall Cost /
Mile Cost / Hour
Per Snow Inch
1999-2000 $3,148 $655 $3,803 419,907 11,387 74.4 $0.01 $0.33 $51.122000-2001 $37,438 $32,001 $69,439 706,147 20,700 125.1 0.10 3.35 555.072001-2002 $15,896 $26,404 $42,300 319,199 8,809 43.4 0.13 4.80 974.662002-2003 $500 $6,051 $6,551 404,709 13,406 54.9 0.02 0.49 119.332003-2004 $791 $4,980 $5,772 321,049 11,082 50.9 0.02 0.52 113.392004-2005 $15,052 $17,824 $32,876 660,532 22,294 130.3 0.05 1.47 252.312005-2006 $1,292 $21,322 $22,614 324,876 9,938 44.8 0.07 2.28 504.78
Globe Claims Repairs Dist Total Miles Plowed Plow Hrs Snowfall Per Mile Per Hour Per Inch 1999-2000 $923 $13,409 $14,332 100,107 4,280 29.8 $0.14 $3.35 $480.942000-2001 $3,372 $4,268 $7,640 292,691 11,648 97.1 0.03 0.66 78.682001-2002 $4,062 $2,854 $6,916 163,075 6,337 38.1 0.04 1.09 181.532002-2003 $9,972 $9,939 $19,911 190,073 7,691 80.4 0.10 2.59 247.652003-2004 $4,322 $1,128 $5,450 219,809 8,509 51.6 0.02 0.64 105.612004-2005 $34,274 $7,300 $41,574 167,202 6,093 72.4 0.25 6.82 574.232005-2006 $1,178 $17,453 $18,631 97,232 3,674 53.3 0.19 5.07 349.55
Holbrook Claims Repairs Dist Total Miles Plowed Plow Hrs Snowfall Per Mile Per Hour Per Inch 1999-2000 $1,074 $0 $1,074 130,708 3,213 0.3 $0.01 $0.33 $3,580.172000-2001 $2,838 $15,060 $17,898 349,865 8,267 3.0 0.05 2.16 5,965.972001-2002 $16,334 $4,764 $21,098 99,427 3,078 0.0 0.21 6.85 N/A2002-2003 $0 $52,799 $52,799 188,483 4,754 2.0 0.28 11.11 26,399.452003-2004 $1,810 $0 $1,810 151,090 3,874 0.0 0.01 0.47 N/A2004-2005 $1,192 $276 $1,469 226,279 5,465 0.0 0.01 0.27 N/A2005-2006 $0 $1,212 $1,212 126,610 3,266 0.0 0.01 0.37 N/A
Kingman Claims Repairs Dist Total Miles Plowed Plow Hrs Snowfall Per Mile Per Hour Per Inch 1999-2000 $0 $0 $0 14,490 542 10.7 $0.00 $0.00 $0.002000-2001 $0 $0 $0 31,621 1,185 15.5 0.00 0.00 0.002001-2002 $0 $7,933 $7,933 15,821 605 3.4 0.50 13.11 2,333.212002-2003 $157 $157 $315 17,425 651 6.5 0.02 0.48 48.402003-2004 $0 $0 $0 14,602 492 7.3 0.00 0.00 0.002004-2005 $0 $0 $0 28,950 1,134 15.9 0.00 0.00 0.002005-2006 $0 $0 $0 22,228 969 12.0 0.00 0.00 0.00
Safford Claims Repairs Dist Total Miles Plowed Plow Hrs Snowfall Per Mile Per Hour Per Inch
1999-2000 $0 $0 $0 12,725 528 1.0 $0.00 $0.00 $0.002000-2001 $2,754 $0 $2,754 48,152 1,914 3.0 0.06 1.44 918.042001-2002 $2,463 $5,276 $7,739 27,255 976 0.0 0.28 7.93 N/A2002-2003 $- $950 $950 24,329 1,092 0.6 0.04 0.87 1,583.422003-2004 $189 $4,391 $4,580 21,596 1,080 0.0 0.21 4.24 N/A2004-2005 $0 $0 $0 21,493 915 0.0 0.00 0.00 N/A2005-2006 $0 $0 $0 10,187 379 2.7 0.00 0.00 0.00
Prescott Claims Repairs Dist Total Miles Plowed Plow Hrs Snowfall Per Mile Per Hour Per Inch 1999-2000 $2,000 $1,374 $3,374 49,219 2,470 10.5 $0.07 $1.37 $321.372000-2001 $1,022 $15,385 $16,407 107,252 5,521 24.5 0.15 2.97 669.682001-2002 $11,144 $0 $11,144 48,625 2,229 2.0 0.23 5.00 5,572.182002-2003 $41,456 $41,156 $82,612 83,048 4,204 6.5 0.99 19.65 12,709.612003-2004 $2,924 $364 $3,288 67,026 3,698 5.0 0.05 0.89 657.532004-2005 $3,367 $5,627 $8,994 93,017 4,670 10.5 0.10 1.93 856.532005-2006 $10,928 $5,051 $15,980 51,488 2,395 12.3 0.31 6.67 1,299.17

128
Measures of Exposure – Plowing Operational Loss Costs by District: 7% Compounded Appendix G2
Season LOSS COSTS (7% compounding) Accomplishments - PECOS Exposure Costs
Flagstaff Claim Cost
Repair Cost
District Total
Miles Plowed
Plow Hours Snowfall Cost /
Mile Cost / Hour
Per Snow Inch
1999-2000 $4,724 $983 $5,707 419,907 11,387 74.4 $0.01 $0.50 $76.712000-2001 $ 52,509 $44,882 $97,391 706,147 20,700 125.1 0.14 4.70 778.512001-2002 $20,836 $34,611 $55,447 319,199 8,809 43.4 0.17 6.29 1,277.582002-2003 $613 $7,413 $8,025 404,709 13,406 54.9 0.02 0.60 146.182003-2004 $906 $5,702 $6,608 321,049 11,082 50.9 0.02 0.60 129.822004-2005 $16,106 $19,072 $35,177 660,532 22,294 130.3 0.05 1.58 269.972005-2006 $1,292 $21,322 $22,614 324,876 9,938 44.8 0.07 2.28 504.78
Globe Claims Repairs Dist Total Miles Plowed Plow Hrs Snowfall Per Mile Per Hour Per Inch 1999-2000 $1,385 $20,124 $21,508 100,107 4,280 29.8 $0.21 $5.03 $721.762000-2001 $4,730 $5,986 $10,716 292,691 11,648 97.1 0.04 0.92 110.362001-2002 $5,324 $3,742 $9,066 163,075 6,337 38.1 0.06 1.43 237.952002-2003 $12,216 $12,176 $24,392 190,073 7,691 80.4 0.13 3.17 303.392003-2004 $4,948 $1,291 $6,239 219,809 8,509 51.6 0.03 0.73 120.912004-2005 $36,673 $7,811 $44,484 167,202 6,093 72.4 0.27 7.30 614.422005-2006 $1,178 $17,453 $18,631 97,232 3,674 53.3 0.19 5.07 349.55
Holbrook Claims Repairs Dist Total Miles Plowed Plow Hrs Snowfall Per Mile Per Hour Per Inch 1999-2000 $1,612 $0 $1,612 130,708 3,213 0.3 $0.01 $0.50 $5,372.862000-2001 $3,981 $21,122 $25,103 349,865 8,267 3.0 0.07 3.04 8,367.582001-2002 $21,411 $6,245 $27,656 99,427 3,078 0.0 0.28 8.98 N/A2002-2003 $0 $64,681 $64,681 188,483 4,754 2.0 0.34 13.61 32,340.462003-2004 $2,072 $0 $2,072 151,090 3,874 0.0 0.01 0.53 N/A2004-2005 $1,276 $296 $1,572 226,279 5,465 0.0 0.01 0.29 N/A2005-2006 $0 $1,212 $1,212 126,610 3,266 0.0 0.01 0.37 N/A
Kingman Claims Repairs Dist Total Miles Plowed Plow Hrs Snowfall Per Mile Per Hour Per Inch 1999-2000 $0 $0 $0 14,490 542 10.7 $0.00 $0.00 $0.002000-2001 $0 $0 $0 31,621 1,185 15.5 0.00 0.00 0.002001-2002 $0 $10,398 $10,398 15,821 605 3.4 0.66 17.19 3,058.362002-2003 $193 $193 $385 17,425 651 6.5 0.02 0.59 59.292003-2004 $0 $0 $0 14,602 492 7.3 0.00 0.00 0.002004-2005 $0 $0 $0 28,950 1,134 15.9 0.00 0.00 0.002005-2006 $0 $0 $0 22,228 969 12.0 0.00 0.00 0.00
Safford Claims Repairs Dist Total Miles Plowed Plow Hrs Snowfall Per Mile Per Hour Per Inch
1999-2000 $0 $0 $0 12,725 528 1.0 $0.00 $0.00 $0.002000-2001 $3,863 $0 $3,863 48,152 1,914 3.0 0.08 2.02 1,287.602001-2002 $3,228 $6,915 $10,144 27,255 976 0.0 0.37 10.39 N/A2002-2003 $0 $1,164 $1,164 24,329 1,092 0.6 0.05 1.07 1,939.752003-2004 $217 $5,027 $5,244 21,596 1,080 0.0 0.24 4.86 N/A2004-2005 $0 $0 $0 21,493 915 0.0 0.00 0.00 N/A2005-2006 $0 $0 $0 10,187 379 2.7 0.00 0.00 0.00
Prescott Claims Repairs Dist Total Miles Plowed Plow Hrs Snowfall Per Mile Per Hour Per Inch 1999-2000 $3,001 $2,063 $5,064 49,219 2,470 10.5 $0.10 $2.05 $482.292000-2001 $1,433 $21,579 $23,012 107,252 5,521 24.5 0.21 4.17 939.262001-2002 $14,608 $0 $14,608 48,625 2,229 2.0 0.30 6.55 7,303.992002-2003 $50,786 $50,418 $101,204 83,048 4,204 6.5 1.22 24.07 15,569.822003-2004 $3,347 $417 $3,764 67,026 3,698 5.0 0.06 1.02 752.802004-2005 $3,602 $6,021 $9,623 93,017 4,670 10.5 0.10 2.06 916.482005-2006 $ 10,928 $5,051 $15,979 51,488 2,395 12.3 0.31 6.67 1,299.14

129
REFERENCES ADOT. (2006). 2005 Motor Vehicle Crash Facts for the State of Arizona. Phoenix: Arizona Department of Transportation.
Angelo, W. J. (2001, December 10, 2001). Training, Technology and Testing Take the Bite Out of Crane Operation. Engineering News-Record, 247 (24), 24.
ATRI. (n.d.). Evaluating the Effectiveness of CMV Driving Simulators with Veteran Drivers. Retrieved August 7, 2006, from American Transportation Research Institute: http://atri-online.org/research/safety/Current_Safety_and_Human_Factors.htm
Beauvais, J. (2002). The Salt Institute of Canada. Retrieved August 3, 2005, from http://www.saltinstitute.org/pubstat/canada02-02.html
Bland, J. M., & Altman, D. G. (2000). Statistics Notes: The Odds Ratio. Retrieved August 2, 2005, from http://bmj.bmjjournals.com/cgi/content/full/320/7247/1468 .
Brock, J. F., Jacobs, C., van Cott, H., McCauley, M., & Norstrom, D., M. (2001). Simulators And Bus Safety: Guidelines For Acquiring And Using Transit Bus Operator Driving Simulators (No. 0309067111). Transit Cooperative Research Program report 72. Washington, D.C.: TRB, National Research Council.
Deery, H. A., & Fildes, B. N. (1999). Young Novice Driver Subtypes: Relationship to High-Risk Behavior, Traffic Accident Record, and Simulator Driving Performance. Human Factors, 41 (4), 628–643.
DfT. (2004). Review of the Road Haulage Modernisation Fund. The Department for Transport (United Kingdom).
Dowd, J., Iowa DOT: Personal Communication, August 2006, M. Kihl.
Emery, C., Robin, J., Knipling, R., Finn, R., & Fleger, S. (1999). Validation of Simulation Technology in the Training, Testing, and Licensing of Tractor-Trailer Drivers. Washington, D.C.: Federal Highway Administration.
FHWA. (2006, June 15, 2006). Snow and Ice. Retrieved October 11, 2006, from http://ops.fhwa.dot.gov/weather/weather_events/snow_ice.htm
Foss, B. (2005, December 28). Trucking Industry Embraces Training Simulators. The Boston Globe.
Globe District Snow Control Plan. (2005). Globe, AZ: Arizona Department of Transportation.
Goldstein, I. L. (1986). Training in Organizations: Needs Assessment, Development, and Evaluation (2nd ed.). Monterey, CA: Brooks/Cole Pub. Co.

130
Goodwin, L. C., & Pisano, P. (2003). Best Practices for Road Weather Management. Washington, DC: U.S. Department of Transportation, Federal Highway Administration.
Hakamies-Blomqvist, L., Östlund, J., Henriksson, P., & Heikkinen, S. (1995). Elderly Car Drivers In A Simulator—A Validation Study. Linköping, Sweden: Swedish National Road and Transport Research Institute.
Hesketh, B. (1997). Dilemmas in Training for Transfer and Retention. Applied Psychology, 46 (4), 317-386.
Hoskins, A., El-Gindy, M., Vance, R., Hiller, N., & Goodhart, C. C. (2002). Truck Driving Simulator Performance Effectiveness. In ASME International Mechanical Engineering Congress & Exposition (pp. 51-57), New Orleans, LA: ASME.
How Do Weather Events Impact Roads? (2002, June 14, 2005). Retrieved August 2, 2005, from http://ops.fhwa.dot.gov/weather/q1_roadimpact.htm
Ivancic, K., & Hesketh, B. (2000). Learning From Errors In A Driving Simulation: Effects On Driving Skill And Self-Confidence. Ergonomics, 43 (12), 1966-1984.
Kemeny, A., & Panerai, F. (2003). Evaluating Perception In Driving Simulation Experiments. TRENDS in Cognitive Sciences, 7 (1), 31-37.
Kihl, M., Herring, D., Wolf, P., & McVey, S. (2005). Driving Simulator Training Evaluation: Interim Report (unpublished). Phoenix, AZ: Arizona Department of Transportation.
Krueger, R. A. (1994). Focus Groups: A Practical Guide for Applied Research. Thousand Oaks, CA: Sage Publications.
Kuhl, J., Evans, D., Papelis, Y., Romano, R., & Watson, G. (July,1995). The Iowa Driving Simulator: An Immersive Research Environment. Computer, 28 (7), 35-41.
Lee, H. C., Lee, A. H., & Cameron, D. (2003). Validation of a Driving Simulator by Measuring the Visual Attention Skill of Older Drivers. The American Journal of Occupational Therapy, 57 (3), 324-328.
Linck, W., Richter, B., & Schmidt, R. (1973). Simulation and Measurement of Driver Vehicle Handing Performance. SAE Technical Paper No. 730489. Warrendale, PA: Society of Automotive Engineers.
Liu, L., Miyazaki, M., & Watson, B. (1999). Norms and Validity of the "DriVR" — A Virtual Reality Driving Assessment For Persons With Head Injury. Cyberpsychology & Behavior, 2 (1), 53-67.
Manger, C. (May, 2003). Truck Simulator Offers Unique Training Opportunities. Commercial Carrier Journal, 6.

131
Marcazak, M., & Sewell, M. (2002). Using Focus Groups for Evaluation. Retrieved August 1, 2005, from http://ag.arizona.edu/fcs/cyfernet/cyfar/focus.htm
Maze, T. H., Crum, M. R., & Burchett, G. (2005). An Investigation of User Costs and Benefits of Winter Road Closure. Ames: Midwest Transportation Consortium.
Michon, J. A. (1985). A Critical View of Driver Behavior Models: What Do We Know, What Should We Do? In Human Behavior and Traffic Safety.
Morgan, D. L. (1988). Focus Groups As Qualitative Research. Newbury Park, Calif.: Sage Publications.
n.a. (2002). Eco-Drive Simulator Facts & Figures. Retrieved February 22, 2006, from http://www.eco-drive.ch/en/02.html
Nagiri, S., Amano, Y., Fukui, K., & Doi, S. (n.d.). A Study of a Personally Adaptive Driving Support System Using a Driving Simulator: R&D Review of Toyota CRDL.
Nookala, M. (2000). Rural Freeway Management During Snow Events—ITS Application. Presented at the 7th World Conference on Intelligent Transport Systems.
Painless Haul-Truck Crashes. (September, 2000). Engineering and Mining Journal, 130-132.
Parkes, A. M., & Rau, H. J. (n.d.). An Evaluation of Simulation as a Viable Tool for Truck Driver Training, from http://www.trucksim.co.uk/Documents/An%20evaluation%20of%20simulation%20as%20a%20viable%20tool%20for%20truck%20driver%20training.pdf.
Pierowicz, J., Robin, J., Gawron, V., Watson, G., & Nestor, B. (2002). Commercial Truck Simulators Re-Assessment and Evaluation. Washington, D.C.: Federal Motor Vehicle Carrier Safety Administration.
Reed, M. P., & Green, P. A. (1999). Comparison Of Driving Performance On-Road And In A Low-Cost Simulator Using A Concurrent Telephone Dialing Task. Ergonomics, 42 (8), 1015-1037.
Reeves, L. M., & Weisberg, R. W. (1994). Usefulness Of Analogous Solutions For Solving Algebra Word Problems. Journal of Experimental Psychology: Learning, Memory, and Cognition, 11, 106-125.
Reymond, G., Kemeny, A., Droulez, J., & Berthoz, A. (2001). Role of Lateral Acceleration in Curve Driving: Driver Model and Experiments on a Real Vehicle and a Driving Simulator. Human Factors, 43 (3), 483-495.
Roenker, D. L., Cissell, G. M., & Ball, K. K. (2003). Speed of Processing and Driving Simulator Training Result in Improved Driving Performance. Human Factors, 45 (2), 218-233.

132
Ross-Flanigan, N. (2002, April-June). New Driving Simulator. Research Review, 33 (2), 1-5.
Safford District Snow Control Plan. (2004). Safford, AZ: Arizona Department of Transportation.
Sidaway, B., & Fairweather, M. (1996). Time-to-Collision Estimation in a Simulated Driving Task. Human Factors, 38 (1), 101-113.
Strayer, D. L., University of Utah: Personal Communication, May 2006, M. Kihl.
Strayer, D. L., & Drews, F. A. (2003). Simulator Training Improves Driver Efficiency: Transfer from the Simulator to the Real World. Presented at Second International Driving Symposium on Human Factors in Driver Assessment, Training and Vehicle Design.
Strayer, D. L., Drews, F. A., & Burns, S. (2004). The Development and Evaluation of a High-Fidelity Simulator Training Program for Snowplow Operators. Salt Lake City: University of Utah, Department of Psychology.
TRL. (2005). Benefits of Truck Simulator Fuel Efficiency Training Revealed. Retrieved February 22, 2006, from Transport Research Laboratory: http://www.trl.co.uk/press/press_detail.asp?pid=20&aid=94
Validation of Simulation Technology in the Training, Testing, and Licensing of Tractor-Trailer Drivers. (2000). Washington, DC: Federal Motor Carrier Safety Administration.
van der Voort, M., Dougherty, M. S., & van Maarseveen, M. (2001). A Prototype Fuel-Efficiency Support Tool. Transportation Research Part C: Emerging Technologies, 9, 279-296.
van Zomeren, A. H., Brouwer, W. H., & Minderhoud, J. M. (1987). Acquired Brain Damage and Driving: A Review. Archives of Physical Medicine and Rehabilitation, 68 (October), 697-705.
Vance, R. J., El-Gindy, M., Hoskins, A. H., Hiller, N. J., & Tallon, R. A. (2002). Simulator Training Evaluation Program. University Park, PA: Pennsylvania Transportation Institute.
Westergren, A., Karlsson, S., Andersson, P., Ohlsson, O., & Hallberg, I. R. (2001). Eating Difficulties, Need For Assisted Eating, Nutritional Status And Pressure Ulcers In Patients Admitted For Stroke Rehabilitation. Journal of Clinical Nursing, 10, 257-269.
Where the Weather Meets the Road: A Research Agenda for Improving Weather Services. (2004). Washington, DC: National Research Council.
Wickens, C. D., Gordon, S. E., & Liu, Y. (1998). An Introduction to Human Factors Engineering. New York: Longman.
Wiener, E., & Nagel, D. (1988). Human Factors in Aviation. San Diego: Academic Press.