snowplow, metail and cascalog
TRANSCRIPT
1
Snowplow and Cascalog
METAIL - YOUR ONLINE FITTING ROOM
Presentation by Rob Boland, Lead Data Architect
2
Introduction
• Introduction to Metail – who we are, why we use Snowplow
• How the Lambda Architecture has influenced our Data Architecture
• Where Cascalog fits in at Metail and why it works well with Snowplow
• Example of where we’ve used Cascalog and how it works
• Looker forward to the future

3
Every body is unique and should be celebrated

4
YOUR ONLINE FITTING ROOM

5
• Sign up with just a few clicks
• See how the clothes look on you
• Build layered outfits
• Get size recommendation
http://trymetail.com/collections/metail
6
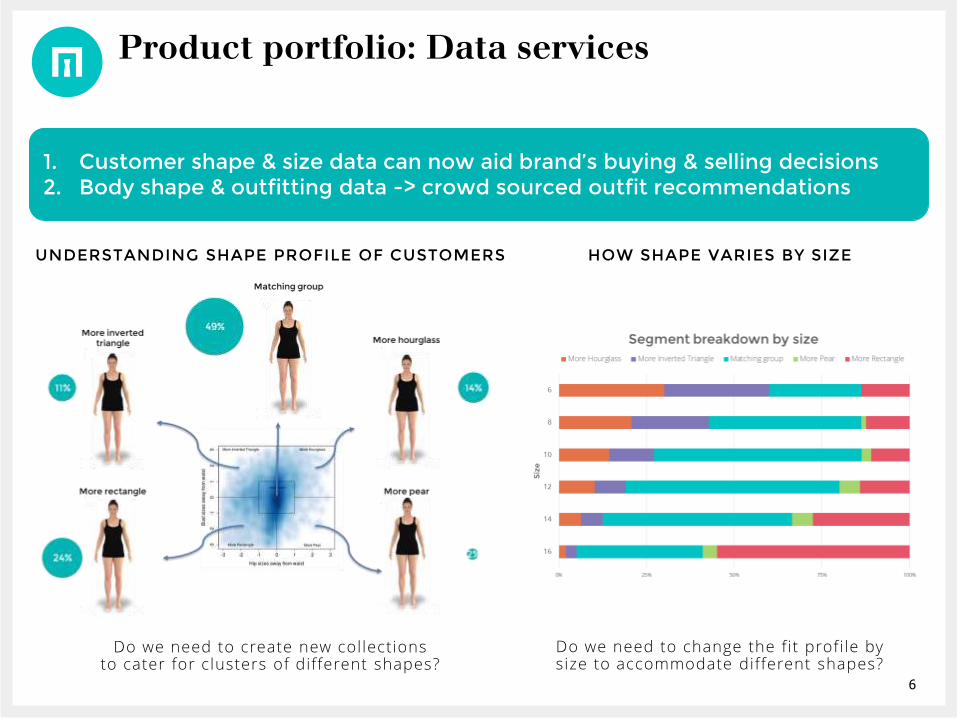
1. Customer shape & size data can now aid brand’s buying & selling decisions2. Body shape & outfitting data -> crowd sourced outfit recommendations
Product portfolio: Data services
UNDERSTANDING SHAPE PROFILE OF CUSTOMERS HOW SHAPE VARIES BY SIZE
Do we need to create new collectionsto cater for clusters of different shapes?
Do we need to change the fit profi le bysize to accommodate different shapes?
7
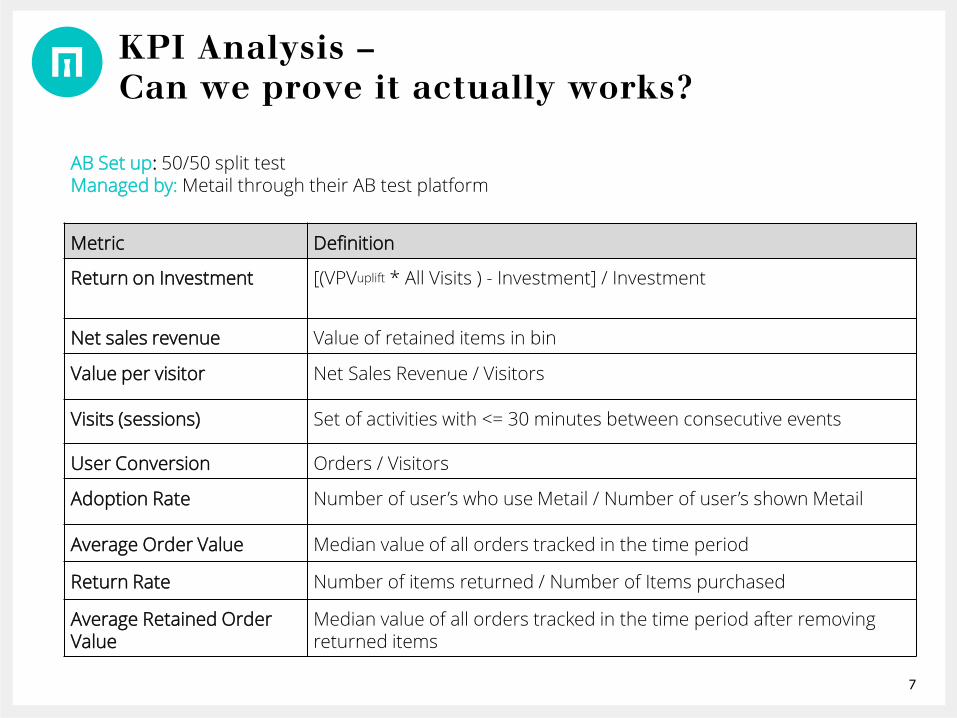
KPI Analysis –Can we prove it actually works?
Metric Definition
Return on Investment [(VPVuplift * All Visits ) - Investment] / Investment
Net sales revenue Value of retained items in bin
Value per visitor Net Sales Revenue / Visitors
Visits (sessions) Set of activities with <= 30 minutes between consecutive events
User Conversion Orders / Visitors
Adoption Rate Number of user’s who use Metail / Number of user’s shown Metail
Average Order Value Median value of all orders tracked in the time period
Return Rate Number of items returned / Number of Items purchased
Average Retained Order Value
Median value of all orders tracked in the time period after removing returned items
AB Set up: 50/50 split testManaged by: Metail through their AB test platform
8
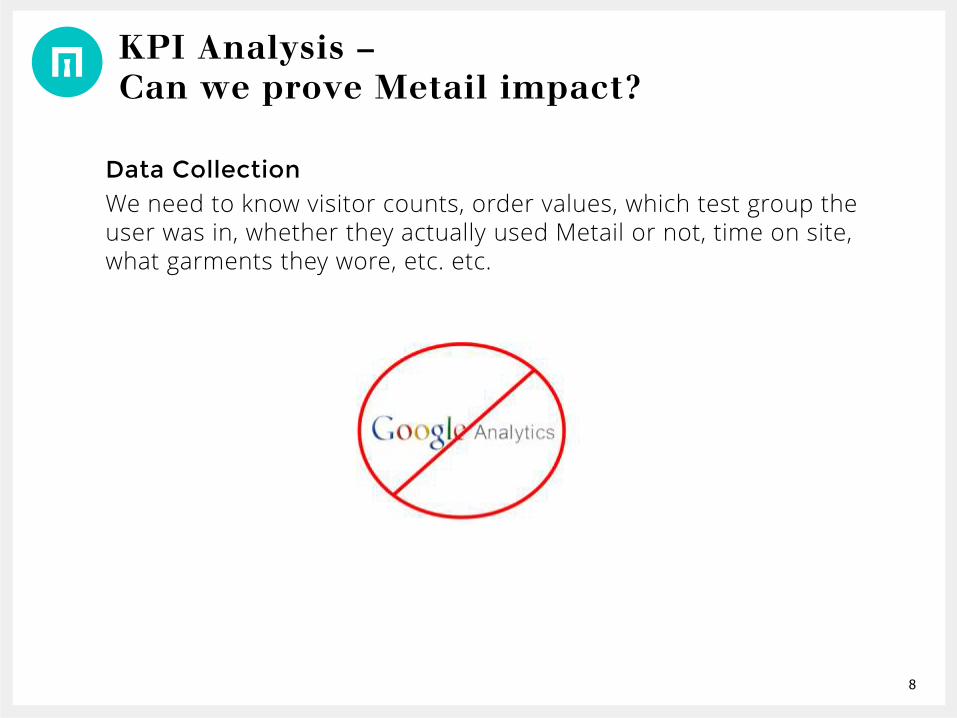
KPI Analysis –Can we prove Metail impact?
Data CollectionWe need to know visitor counts, order values, which test group the user was in, whether they actually used Metail or not, time on site, what garments they wore, etc. etc.
9
Enter Snowplow
10
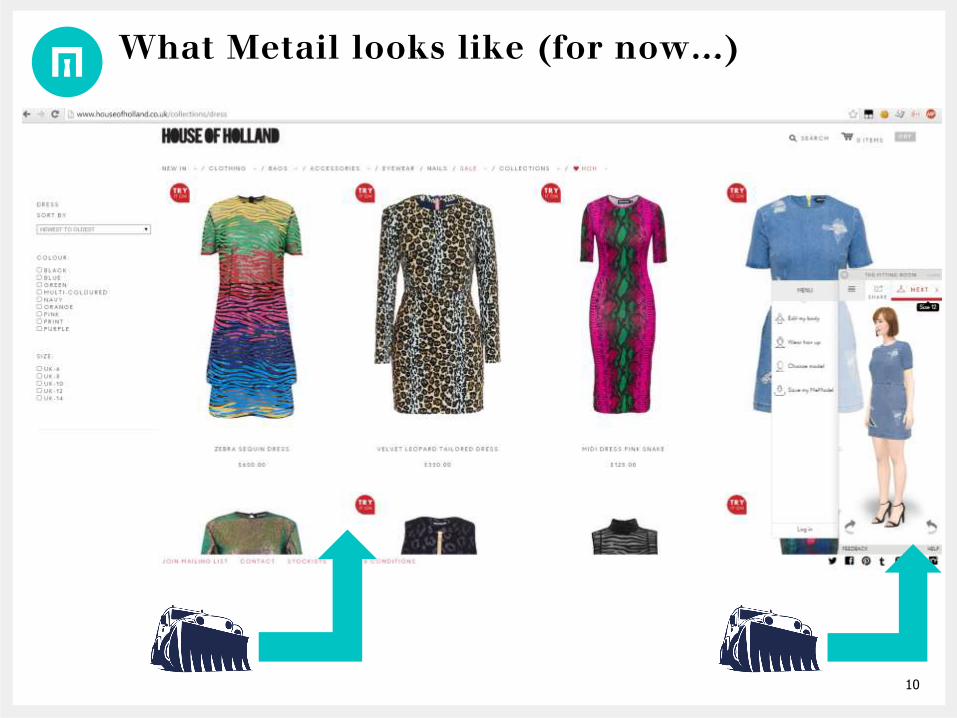
What Metail looks like (for now…)

11
Data Collection! Now what?
Read the Big Data book
(Still MEAP after 3 years!)
12
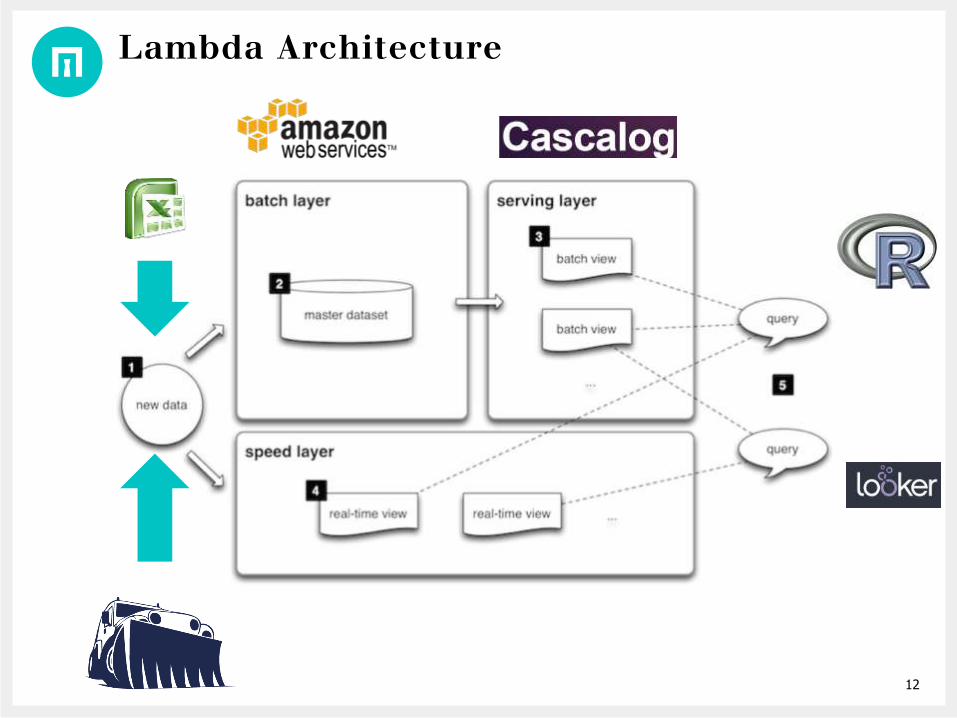
Lambda Architecture

13
Cascalog to produce Batch Views
Turn the Snowplow event stream into a normalised schema
Body Shape
Orders
Items Ordered
ReturnsBrowsers (visitors)
Sessions
Garment Details
AB Events
Snowplow Events
14
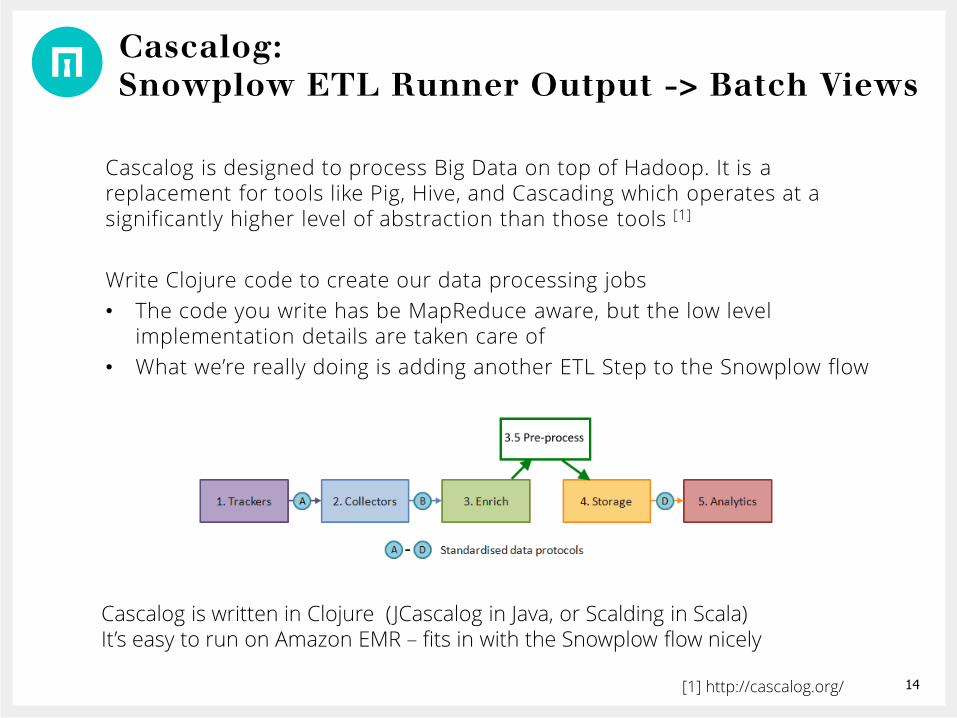
Cascalog: Snowplow ETL Runner Output -> Batch Views
Cascalog is designed to process Big Data on top of Hadoop. It is a replacement for tools like Pig, Hive, and Cascading which operates at a significantly higher level of abstraction than those tools [1]
Write Clojure code to create our data processing jobs
• The code you write has be MapReduce aware, but the low level implementation details are taken care of
• What we’re really doing is adding another ETL Step to the Snowplow flow
[1] http://cascalog.org/
Cascalog is written in Clojure (JCascalog in Java, or Scalding in Scala)It’s easy to run on Amazon EMR – fits in with the Snowplow flow nicely
15
Cascalog – Worth the effort?
Couldn’t you achieve the same output working with the events table alone?
…kind of
But there are two key benefits:
1. Breaking the data into a manageable schema means you can directly access the data you care about
2. Complex logic and aggregation is easier to achieve
Real example: • KPI Data Aggregation
16
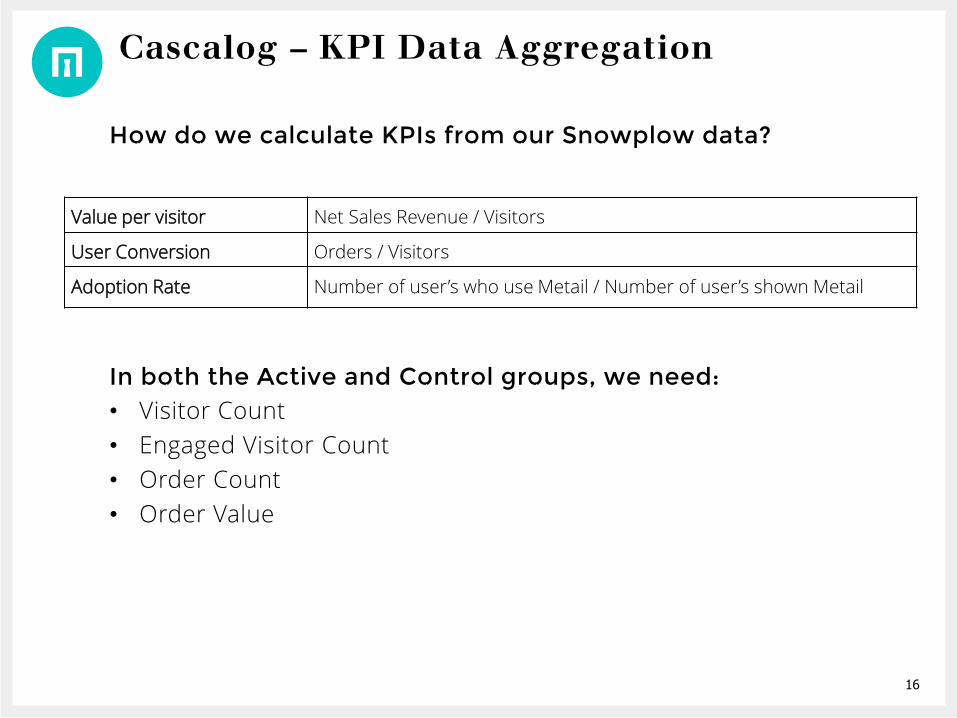
Cascalog – KPI Data Aggregation
Value per visitor Net Sales Revenue / Visitors
User Conversion Orders / Visitors
Adoption Rate Number of user’s who use Metail / Number of user’s shown Metail
How do we calculate KPIs from our Snowplow data?
In both the Active and Control groups, we need:• Visitor Count
• Engaged Visitor Count
• Order Count
• Order Value
17
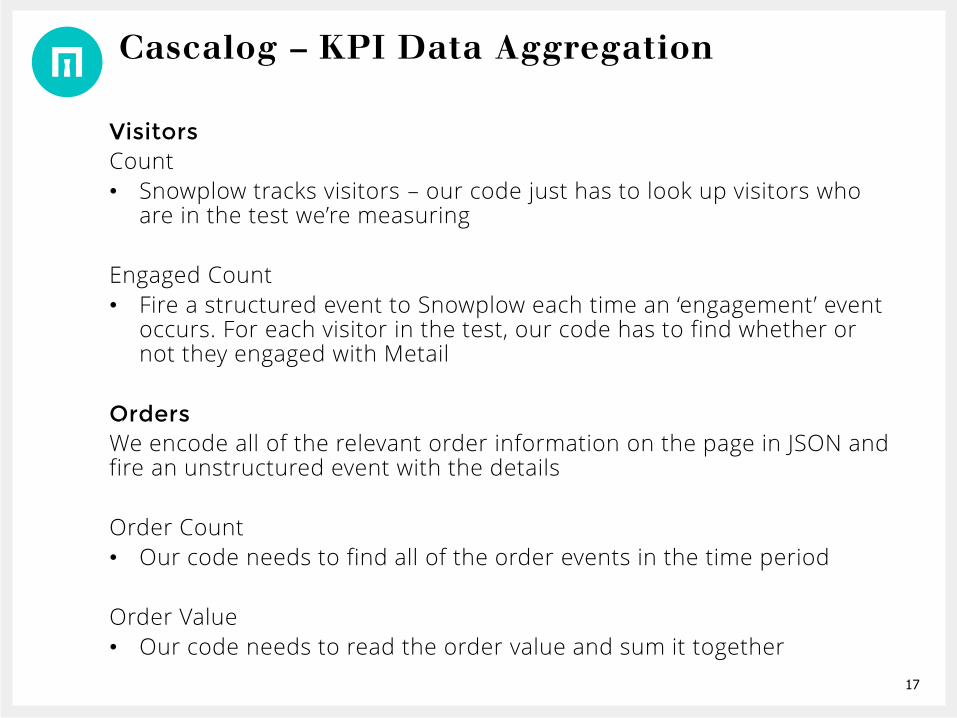
Cascalog – KPI Data Aggregation
VisitorsCount
• Snowplow tracks visitors – our code just has to look up visitors who are in the test we’re measuring
Engaged Count
• Fire a structured event to Snowplow each time an ‘engagement’ event occurs. For each visitor in the test, our code has to find whether or not they engaged with Metail
OrdersWe encode all of the relevant order information on the page in JSON and fire an unstructured event with the details
Order Count
• Our code needs to find all of the order events in the time period
Order Value
• Our code needs to read the order value and sum it together
18
Cascalog – KPI Data Aggregation
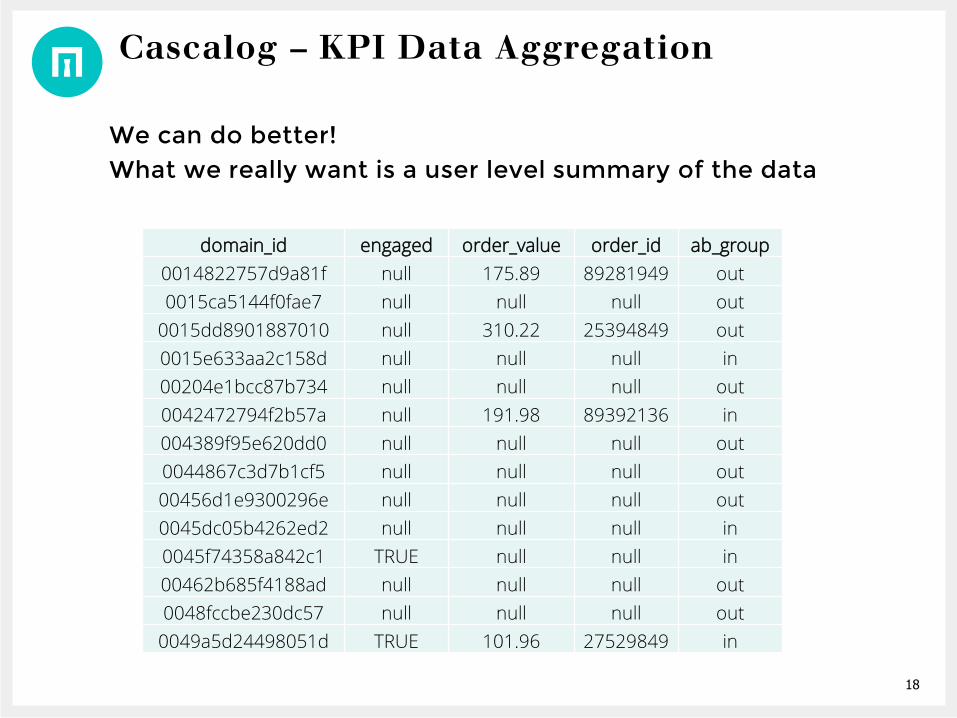
We can do better! What we really want is a user level summary of the data
domain_id engaged order_value order_id ab_group
0014822757d9a81f null 175.89 89281949 out
0015ca5144f0fae7 null null null out
0015dd8901887010 null 310.22 25394849 out
0015e633aa2c158d null null null in
00204e1bcc87b734 null null null out
0042472794f2b57a null 191.98 89392136 in
004389f95e620dd0 null null null out
0044867c3d7b1cf5 null null null out
00456d1e9300296e null null null out
0045dc05b4262ed2 null null null in
0045f74358a842c1 TRUE null null in
00462b685f4188ad null null null out
0048fccbe230dc57 null null null out
0049a5d24498051d TRUE 101.96 27529849 in
19
Cascalog – Implementation
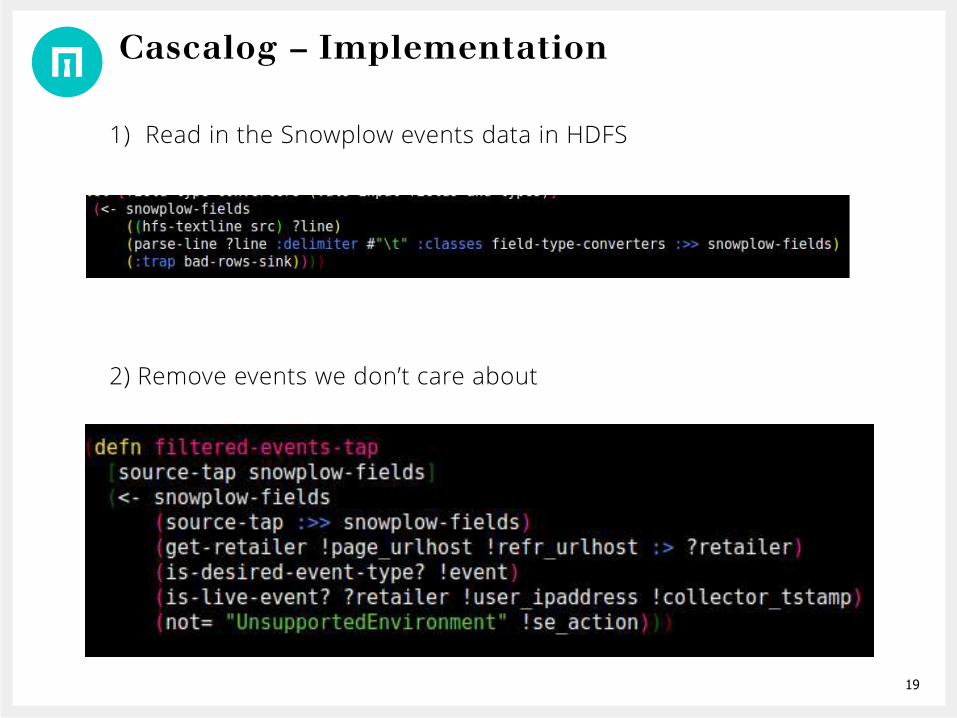
1) Read in the Snowplow events data in HDFS
2) Remove events we don’t care about
20
Cascalog – Implementation
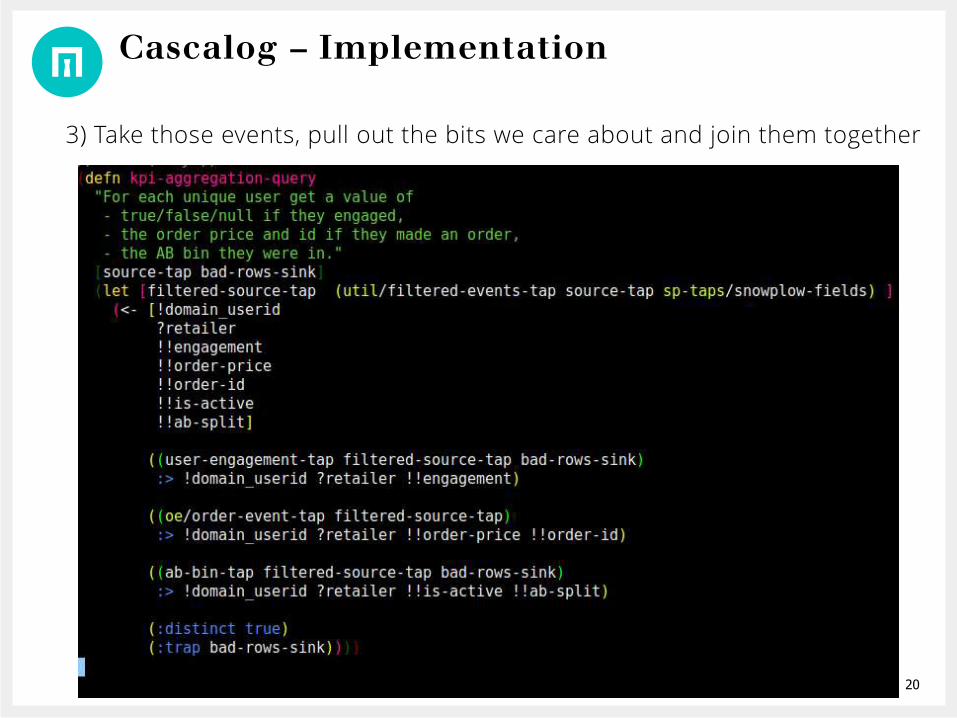
3) Take those events, pull out the bits we care about and join them together
21
What do we do with the Batch Views?
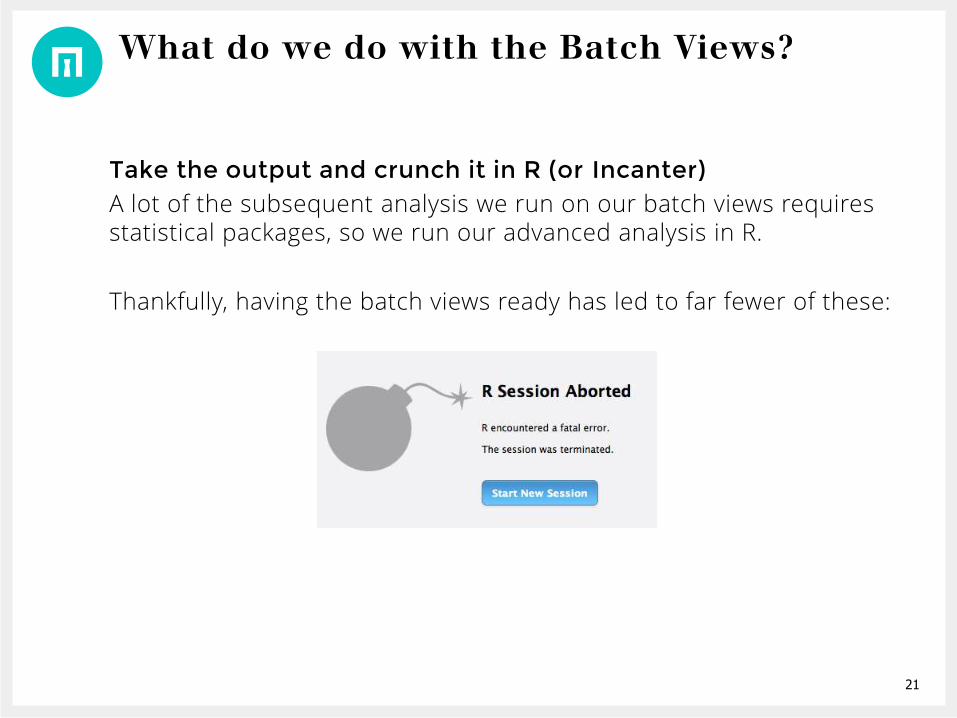
Take the output and crunch it in R (or Incanter)A lot of the subsequent analysis we run on our batch views requires statistical packages, so we run our advanced analysis in R.
Thankfully, having the batch views ready has led to far fewer of these:
22
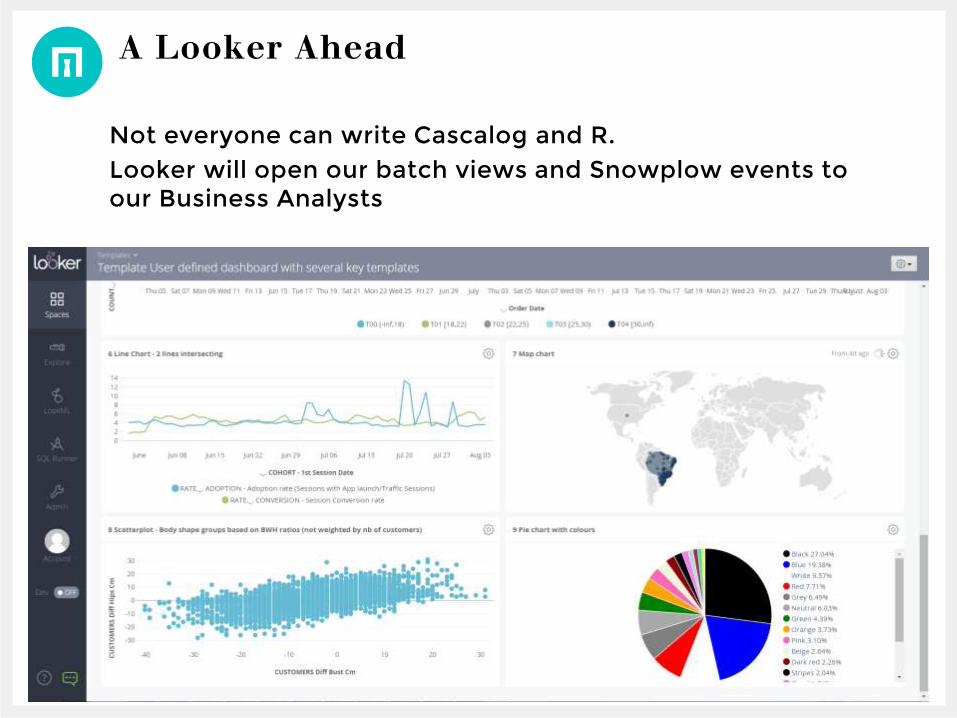
A Looker Ahead
Not everyone can write Cascalog and R. Looker will open our batch views and Snowplow events to our Business Analysts