single-trial classification of gait and point movement ... · original research article published:...
TRANSCRIPT

ORIGINAL RESEARCH ARTICLEpublished: 11 June 2013
doi: 10.3389/fnins.2013.00084
Single-trial classification of gait and point movementpreparation from human EEGPriya D. Velu1 and Virginia R. de Sa2*
1 Department of Neurosciences, University of California San Diego, La Jolla, CA, USA2 Department of Cognitive Science, University of California San Diego, La Jolla, CA, USA
Edited by:
Cuntai Guan, Institute for InfocommResearch, Singapore
Reviewed by:
Reinhold Scherer, Graz University ofTechnology, AustriaOu Bai, Virginia CommonwealthUniversity, USA
*Correspondence:
Virginia R. de Sa, Department ofCognitive Science, University ofCalifornia San Diego, 9500 GilmanDrive, 0515, La Jolla,CA 92103-0515, USAe-mail: [email protected]
Neuroimaging studies provide evidence of cortical involvement immediately before andduring gait and during gait-related behaviors such as stepping in place or motor imageryof gait. Here we attempt to perform single-trial classification of gait intent from anothermovement plan (point intent) or from standing in place. Subjects walked naturally froma starting position to a designated ending position, pointed at a designated positionfrom the starting position, or remained standing at the starting position. The 700 ms ofrecorded electroencephalography (EEG) before movement onset was used for single-trialclassification of trials based on action type and direction (left walk, forward walk, rightwalk, left point, right point, and stand) as well as action type regardless of direction(stand, walk, point). Classification using regularized LDA was performed on a principalcomponents analysis (PCA) reduced feature space composed of coefficients from levels1 to 9 of a discrete wavelet decomposition using the Daubechies 4 wavelet. We achievedsignificant classification for all conditions, with errors as low as 17% when averaged acrossnine subjects. LDA and PCA highly weighted frequency ranges that included movementrelated potentials (MRPs), with smaller contributions from frequency ranges that includedmu and beta idle motor rhythms. Additionally, error patterns suggested a spatial structureto the EEG signal. Future applications of the cortical gait intent signal may include anadditional dimension of control for prosthetics, preemptive corrective feedback for gaitdisturbances, or human computer interfaces (HCI).
Keywords: EEG, gait intent, point intent, brain-computer interface
INTRODUCTIONThe detection of locomotive intent has potential as a control sig-nal in brain-computer interfaces, for mitigating complications inmovement disorders, or for use in environments with humancomputer interfaces (HCI). Detection of this signal is valuablefor spinal cord injury patients and other users of lower limbprosthetics or artificial exoskeletons. It may also prove useful foralleviating abnormal states that prevent proper gait coordinationsuch as during freezing of gait in Parkinson’s disease by provid-ing preemptive visual cues that help prevent freezing episodes(Hanakawa et al., 1999; Jiang and Norman, 2006; Nieuwboer,2008). Other uses could be in HCI systems that anticipate usermovement. Truly useful and versatile applications will require dif-ferentiation between many possible types of movements as well asthe directionality of the movements. Here we explore the possibil-ity of electroencephalography (EEG) to differentiate the intent toproduce a locomotive movement from another movement as wellas the spatial direction of the movement.
EEG is an ideal modality to capture locomotive intent. Itsnon-invasive nature is attractive to users, and the high tempo-ral resolution, which is lacking in other non-invasive methodssuch as functional magnetic resonance imaging (fMRI), is suit-able for capturing the cortical dynamics of gait planning andproduction. EEG systems are also inexpensive compared to otherimaging technologies and can be worn comfortably by the subject
even during large-scale movements such as locomotion. Thereare many groups competing to produce commercial dry electrodeEEG systems, including ones that wirelessly connect to cell phones(Matthews et al., 2008; Yasui, 2009; Wang et al., 2011).
Locomotive movement through an environment is a crucialsurvival trait of many organisms. Vertebrates perform locomo-tive movements through a multi-level control system involvingthe cortex, brainstem, cerebellum, and spinal cord. This systemintegrates visual, vestibular, and proprioceptive information fromthe environment to perform coordinated movement of jointsand muscles. Direct pathways from the cortex to the spinal cordhave been shown to be vital for skilled movement, and pathwaysfrom the cortex to the basal ganglia may be important for onlinechange of gait in response to obstacles or new goals (Graybiel,2005; Grillner et al., 2008). Recently, intracortical recordings fromhundreds of neurons in monkey motor cortex were successfullydecoded to 3D coordinates of leg joints during treadmill walkingof varied speed and direction (Fitzsimmons et al., 2009). A sim-ilar experiment conducted with humans and using EEG decodedthe linear and angular kinematics of the ankle, knee and hip jointsduring treadmill walking (Presacco et al., 2011).
Neuroimaging studies in humans provide further evidencethat the cortex is active during gait preparation and gait produc-tion. These studies attempted to isolate the neural correlates ofbipedal gait production in humans by measuring brain activity
www.frontiersin.org June 2013 | Volume 7 | Article 84 | 1

Velu and de Sa EEG detection of gait preparation
during visual observation and mental motor imagery of gait andrelated motor activities with fMRI and positron emission tomog-raphy scanning (PET) (Malouin et al., 2003; Jahn et al., 2004;Bakker et al., 2008; Iseki et al., 2008; Wang et al., 2008, 2009).Groups have also recorded brain activity during gait movementwith near infrared spectroscopy (NIRS) or EEG to determinebrain regions involved in gait, to demonstrate effective movementartifact elimination from EEG, and to characterize the EEG signalduring gait production (Yazawa et al., 1997; Miyai et al., 2001;Gwin et al., 2010, 2011; Wagner et al., 2012).
This study aims to detect EEG based cortical activity that isrelated to gait preparation before the voluntary motor productionof gait. To our knowledge, we are the first to attempt to classifythe intent to walk from single trial EEG data recorded before theonset of a natural gait movement in which the subject walks inreal space from a starting position to a target position. We alsoclassify the intent to walk from another motor plan, the intent topoint. The classification of reach preparation before movementonset from EEG has been well established (Hammon et al., 2008;Wang and Makeig, 2009; Lew et al., 2012).
The classification process here uses information from all avail-able frequency ranges and channels to allow for individual varia-tions in cortical topography and dynamics. By examining whichchannels and which frequency ranges are most weighted by thetop principal components and the LDA classifier, we character-ize the nature of the signal used in classification. Finally, weattempt classification of pre-movement EEG between differenttarget positions located in spatially distinct areas either to the left,right or in front of the subject.
We used a feature space that could capture mu (8–13 Hz) andbeta (14–25 Hz) frequency band desynchronization over centralmotor and premotor areas (PMAs) as well as slow movementrelated potentials (MRPs) within single trials. Wavelets, especiallythe Debauchies (db) family, have been extensively used for EEGclassification. The intended motor plan was predicted by classifi-cation of a principal components analysis (PCA) reduced featurespace using regularized linear discriminant analysis (rLDA).
MATERIALS AND METHODSDATA COLLECTIONNine healthy, right-handed subjects (18–27 years old, 2 females)participated in the experiment. All subjects read and signedinformed consent forms that were approved by the UCSD HumanResearch Protections Office. Subjects were naive and untrainedin the task and no feedback was given that could cue subjectsto modulate their cortical signals to produce better features overtime.
Continuous EEG was recorded from 64 Ag/AgCl electrodespositioned on a BioSemi nylon head cap according to the 10–20International System. The signal was amplified with fixed gainBioSemi ActiveTwo amplifiers, band-passed from 0.2 to 100 Hz,and digitized at 512 Hz with 24-bit resolution. The independentsoftware package DataRiver was used to read and record EEGsignals as well as to integrate EEG signals with events from theStim2007 stimulus presentation software (Delorme et al., 2011,2012; Vankov et al., 2010). Two EOG electrodes were placedto record eye movements (one on the right outer canthus and
one below the right eye). Right and left mastoid electrodes wereaveraged off-line to serve as reference. To minimize movementartifacts, subjects were encouraged to remain as still as possi-ble and to look at a fixation cross on the wall until they heardthe go cue. Two electrodes were placed on the anterior tib-ialis muscle (the first muscle to activate in gait) on each leg todetect premature muscle contraction during trials (Mann et al.,1979). As only eight EMG electrodes were available, the muscleactivity of the arm could not be monitored through electrophys-iological methods; the experimenter noted and discarded anytrials with premature pointing or arm movements unrelated tothe task.
Cues were given in the form of auditory stimuli played throughtwo speakers located behind the subject. A trial consisted of acommand cue spoken by a computer-generated voice (walk front,walk right, walk left, point right, point left, stand still) followedby a delayed go cue (indicated by an auditory tone of 1 s induration). The command cues were 1 s in length, and an inter-val of 1 s occurred after the end of the command cue and beforethe sound of the go cue. For point and stand trials the end ofthe trial was indicated by an auditory tone 2 s after the go cuewhile for walk trials the same tone was sounded 4 s after the gocue (Figure 1B). The experiment consisted of 60 trials for eachcondition, or a total of 360 trials, presented in pseudorandomorder in six blocks of 60 trials with 2 min of rest between blocks,with the exception of Subject 1, who had 80 trials per condition.We reduced the number to 60 trials per condition for subjects2–9 as the time to complete the experiment was prohibitivelylong. After the go cue sounded, the subject either walked for-ward five feet to designated spots on the floor to the right, left,or in front of standing position; pointed at designated objectson the right and left ends of a table placed five feet in front ofthe subject, or remained standing still with eyes focused on thefixation cross at eye level on the wall directly in front of thesubject (Figure 1A). The subject carried the EEG amplifier andbattery in a specially designed backpack for the duration of theexperiment.
DATA ANALYSISAll data were analyzed offline. For artifact removal, data werehigh pass filtered above 1 Hz to remove slow cortical poten-tials and galvanic skin potentials. The experimenter first visu-ally inspected the data for removal of noisy channels, epochswith artifacts, and epochs with incorrect responses or prema-ture leg movement (Figure 1C). These data was then furthercleaned using EEGLAB automatic artifact rejection functionsthat removed channels and epochs that had kurtosis measures5 standard deviations from the mean kurtosis value (Delormeand Makeig, 2004; Delorme et al., 2011). Kurtosis is the fourthmoment measure of a probability distribution, and large posi-tive kurtosis values indicate increased peaky shape whereas largenegative kurtosis values indicate abnormally flat shape in the dis-tribution. In EEG, these may represent undesirable artifacts inthe data.
The above channels and time points were noted and thenexcluded from original raw, unfiltered data for subsequent clas-sification analyses. The number of trials remaining for each class
Frontiers in Neuroscience | Neuroprosthetics June 2013 | Volume 7 | Article 84 | 2

Velu and de Sa EEG detection of gait preparation
FIGURE 1 | (A) Experiment set-up. Subject stands with arms at side andfixates on cross bar until the go cue sounds to perform one of six actions:walk left, front or right to target marked on floor, point left or right at an objecton the table, or stand still. (B) Trial structure with the red bar indicating time
range of data used in classification. (C) EMG from right anterior tibialismuscle of one subject. Trials in which EMG indicated movement onset priorto 200 ms were omitted. The red bar indicates the time range of data used inclassification.
Table 1 | The number of channels and the number of trials for each class remaining after artifact elimination are shown for each subject.
Subject Channels L walk R walk F walk L point R point Stand Cut-off (%)
S1 63 66 66 66 66 66 72 41
S2 59 44 44 46 44 44 46 40
S3 59 49 49 49 49 49 50 40
S4 51 45 45 52 45 45 49 40
S5 62 48 48 48 48 48 58 40
S6 58 36 36 36 36 36 51 39
S7 50 27 27 27 27 27 29 37
S8 50 44 44 44 44 44 48 40
S9 59 47 47 47 47 47 47 40
The final column lists the adjusted cut-off for binary classification significance based on Wald intervals modified for small sample sizes determined by the class with
the lowest number of trials.
and the number of channels remaining for each subject afterartifact rejection are shown in Table 1.
Filtering of data provided to the classifier was explicitlyavoided so as to avoid any misrepresentation or distortion of thesignal. High pass and acausal filters are commonly used in EEGresearch to remove noise, but these are poor choices for predic-tive classification as they produce temporal smearing of the signalsuch that values at future time points in which actual move-ment occurs may be used in the calculation of values at timepoints of interest for movement prediction. Causal filters avoidthis problem, but still cause distortions in the original signal.
For classification, EEG data were separated into epochs start-ing 500 ms before and ending 200 ms after the onset of the gocue (but before the onset of gait) of each trial. We used this timerange in order to capture the MRP signal from the motor cortex aswell as any pre-movement related mu or beta desynchronization.Epochs were then processed to extract wavelet coefficients as thefeatures for the classifier.
RATIONALE BEHIND FEATURE SELECTIONWavelets provide high-resolution frequency information at lowfrequencies and high-resolution time information at higherfrequencies. Many biological signals consist of slow oscillatingbackground activity with rapid onset of change in activity. Thetemporal dynamics of such frequency perturbations may be bettercaptured by wavelets than other methods.
Wavelet decomposition was performed on all available chan-nels within a subject. This yielded a high dimensional featurespace with d = n channels × 358 coefficients per trial. To facil-itate classification by LDA, this high dimensionality was reducedby PCA to ten dimensions per trial (Lan et al., 2010). We usedall 10 principal components for classification since only compo-nents with the highest variance were not ensured to be infor-mative for classification (Lugger et al., 1998). Thus, we let theclassifier decide which components were most informative byassigning those components higher weights during the trainingprocess.
www.frontiersin.org June 2013 | Volume 7 | Article 84 | 3

Velu and de Sa EEG detection of gait preparation
FIGURE 2 | L walk/ L point feature visualization for S4 and S8. Thesmaller scalp maps show topographies of final weights of channels withindifferent frequency bands. The larger scalp map shows the weighted average
of the final weights from all frequencies, and represents what is used by theclassifier. Each line represents the absolute value of the final weights for allcoefficients for an individual channel.
FEATURE PARAMETERSWe calculated the coefficients from level 9 discrete wavelet decom-positions of the data using Daubechies wavelet 4 (db4) as themother wavelet with periodization padding. The db family ofwavelets has been shown to be better than biorthogonal wavelets,autoregressive filtering, and mu-matched filtering for extractingmovement-related information from EEG signals (Renfrew et al.,2008). The db4 wavelet has been used extensively to analyze EEGsignals (Subasi, 2006) and has performed as well as wavelets cus-tomized to individual subjects’ EEG training data (do Nascimentoand Farina, 2006; Farina et al., 2007) in a task predicting torquedirection in foot movement.
Since the EEG signal was sampled at 512 Hz, the Nyquist fre-quency was 256 Hz. The level 1 decomposition thus includedfrequency information from 128 to 256 Hz, the level 2decomposition from 64 to 128 Hz, and so on (Table 2). Detailcoefficients from levels 1 to 9 encompassed available frequency
signals from 0.5 to 56 Hz, and the approximate coefficients forlevel 9 had signals from 0 to 0.5 Hz. This range included boththe mu and beta frequency sub-bands associated with idle motorrhythms and slow cortical potentials such as the MRP.
LDA CLASSIFICATIONFeatures were extracted for six classes of trials: walk left, walkright, walk front, point left, point right, and stand. The classeswere paired into 15 different binary classification problems, whichcan be separated into four different categories: same action withdifferent directions, different actions with same direction, differ-ent actions with different directions, and actions vs. standing.Classes were also collapsed over directions to test the ability toclassify walk/stand, point/stand, and walk/point.
A regularized LDA classifier (with optimized regularizationparameter k) was trained on 10 features per trial using a10-fold cross validation scheme (Friedman, 1989). Each class was
Frontiers in Neuroscience | Neuroprosthetics June 2013 | Volume 7 | Article 84 | 4

Velu and de Sa EEG detection of gait preparation
Table 2 | Wavelet levels and coefficients with corresponding
frequency ranges.
Level Frequency (Hz) Coefficients
9 0–0.5 1 (approximate)
9 0.5–1 2 (detail)
8 1–2 3, 4
7 2–4 5–7
6 4–8 8–13
5 8–16 14–25
4 16–32 26–48
3 32–64 49–93
2 64–128 94–183
1 128–256 184–362
assigned an equal number of trials and these trials were then ran-domly shuffled and partitioned into 10 sets, with nine used fortraining and one used for testing. Training and testing was done10 times with a different set used each time as the test set. Thus,test data were completely separate from the training data. Thiscomplete process was repeated 9 additional times, and the predic-tion errors from the resulting 100 test cross validation folds wereaveraged and reported as the final results.
In situations with few trials compared to features, we do nothave enough data to accurately estimate the covariance matricesused by LDA. In the absence of adequate information, a spheri-cal covariance matrix is often assumed. Regularization providesa way to smoothly interpolate (using regularization constant k)between the sample covariance matrix and spherical covariancematrix. Within each fold, the optimal value for the regularizationconstant k was chosen from 10 values covering the interval [0.090.5] based on the value with the highest performance in an inner4-fold cross validation scheme that used training data only.
Classifier performance was evaluated based on the number oftrials used in classification. Chance level in a binary classificationproblem is not exactly 50%, but 50% with a confidence intervalfor a given p-value depending on the number of trials. The Waldinterval is a normal approximation of the binomial confidenceinterval. As we had a small number of trials, we calculated Waldintervals with adjustments for a small sample size by adding fourdummy observations, or two for each type (Agresti and Caffo,2000; Müller-Putz et al., 2008). These intervals were then used todetermine if the classifier performed significantly above chanceor not.
LOCATION AND FREQUENCY SOURCE ANALYSIS USING PCA RESULTSTo better understand the nature of the signal used in classificationand to ensure that classification was not based on eye or mus-cle movements, the final weights (all 10 PC weights multipliedby their respective LDA weights) were visualized with respect tospace (channel scalp topography) and frequency band (waveletcoefficients.) The topographies of the final weights were plottedat each frequency band as well as averaged over all frequencybands to pinpoint the channels that contributed most to classi-fication. The absolute values of the final weights were plotted foreach wavelet coefficient of each channel to visualize which region
of the frequency spectrum was most informative for successfulclassification. Scalp topographies from each of the 10 PC com-ponents averaged over all 100-folds and all frequencies from thesubject with the best performance were plotted in order of the PCwith the highest contribution to LDA to the PC with the lowestto determine if PCs with higher eigenvalues contained the mostpertinent information for classification.
CONTRIBUTION FROM EOG AND PERIPHERAL SCALP CHANNELSAs an additional measure to assess the contribution of eye andmuscle movements to the classification, LDA classification wasperformed using only EOG channels and those channels thatwould most be influenced by eye movements or muscle move-ments: Fp1, AF7, F7, FT7, T7, TP7, P9, P7, PO7, O1, Iz, Oz,O2, PO8, P8, P10, TP8, T8, FT8, F8, AF8, Fp2, and Fpz. Thesechannels were located on the periphery of the EEG cap and wereclose to the origin of eye movements and muscles, and thus prob-ably most strongly reflected the activity from these artifacts whencompared to the other scalp channels.
Subjects with greater than chance performance based on theaverage of 10 runs of 10-fold CV from a specified LDA classi-fication using this subset of channels were eliminated from thereported grand averages over subjects for that classification.
ERROR PATTERNSTo determine if there was underlying spatial structure in the EEGsignal, multiple discriminant analysis (MDA) using the one classvs. rest scheme was applied to the following classification prob-lems: (1) left walk, front walk, right walk (three classes); (2) leftpoint, front walk, right point (three classes); and (3) left walk,left point, right walk, right point (four classes). To visualize clas-sification performance, trials from all cross validation folds weregrouped based on true class and predicted class. For example, ina three-class problem, the groups were arranged into a 3 × 3 con-fusion matrix with row labels corresponding to true classes andcolumn labels corresponding to predicted classes. Cells were nor-malized by dividing by the total number of trials in the row class,so that the value of one cell was the fraction of trials that the clas-sifier predicted to be in the class as defined by the column locationof the cell.
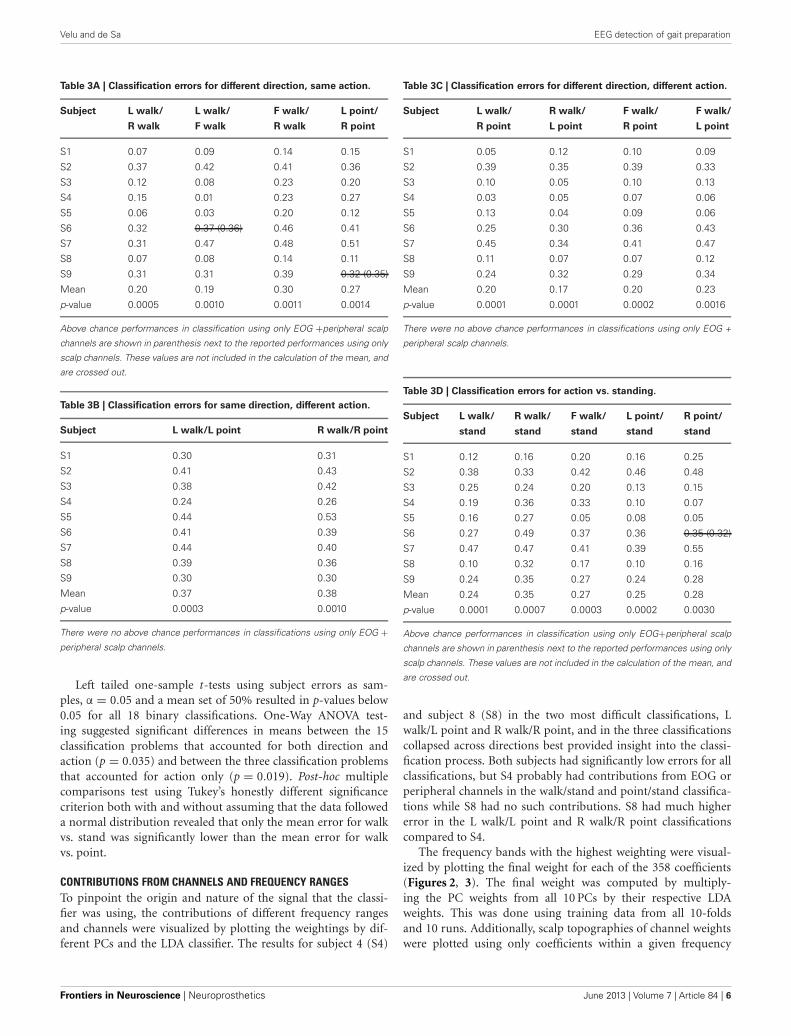
RESULTSLDA CLASSIFICATIONIndividual subject errors and errors averaged over all nine subjectsare shown in Tables 3A–3D for the 15 classification problems thatconsider direction as well as action. Mean and individual subjecterrors are shown in Table 4 for the three classification problemsthat collapse trials across directions and only consider differencesin actions. Classification was successful if it yielded an error lowerthan the calculated threshold that was based on the number oftrials used (Table 1).
Only 9/162 classifications had significant performance usingEOG and peripheral channels: L walk/F walk and R point/stand insubject 6; L point/R point in subject 9; walk/stand in subjects 1, 2,4, 7; and point/stand in subjects 1 and 4. Within these nine clas-sifications, the performance of EOG and peripheral channels waseither poorer (8/9) or similar (1/9) to that of all scalp channels.
www.frontiersin.org June 2013 | Volume 7 | Article 84 | 5
Velu and de Sa EEG detection of gait preparation
Table 3A | Classification errors for different direction, same action.
Subject L walk/ L walk/ F walk/ L point/
R walk F walk R walk R point
S1 0.07 0.09 0.14 0.15
S2 0.37 0.42 0.41 0.36
S3 0.12 0.08 0.23 0.20
S4 0.15 0.01 0.23 0.27
S5 0.06 0.03 0.20 0.12
S6 0.32 0.37 (0.36) 0.46 0.41
S7 0.31 0.47 0.48 0.51
S8 0.07 0.08 0.14 0.11
S9 0.31 0.31 0.39 0.32 (0.35)
Mean 0.20 0.19 0.30 0.27
p-value 0.0005 0.0010 0.0011 0.0014
Above chance performances in classification using only EOG +peripheral scalp
channels are shown in parenthesis next to the reported performances using only
scalp channels. These values are not included in the calculation of the mean, and
are crossed out.
Table 3B | Classification errors for same direction, different action.
Subject L walk/L point R walk/R point
S1 0.30 0.31
S2 0.41 0.43
S3 0.38 0.42
S4 0.24 0.26
S5 0.44 0.53
S6 0.41 0.39
S7 0.44 0.40
S8 0.39 0.36
S9 0.30 0.30
Mean 0.37 0.38
p-value 0.0003 0.0010
There were no above chance performances in classifications using only EOG +peripheral scalp channels.
Left tailed one-sample t-tests using subject errors as sam-ples, α = 0.05 and a mean set of 50% resulted in p-values below0.05 for all 18 binary classifications. One-Way ANOVA test-ing suggested significant differences in means between the 15classification problems that accounted for both direction andaction (p = 0.035) and between the three classification problemsthat accounted for action only (p = 0.019). Post-hoc multiplecomparisons test using Tukey’s honestly different significancecriterion both with and without assuming that the data followeda normal distribution revealed that only the mean error for walkvs. stand was significantly lower than the mean error for walkvs. point.
CONTRIBUTIONS FROM CHANNELS AND FREQUENCY RANGESTo pinpoint the origin and nature of the signal that the classi-fier was using, the contributions of different frequency rangesand channels were visualized by plotting the weightings by dif-ferent PCs and the LDA classifier. The results for subject 4 (S4)
Table 3C | Classification errors for different direction, different action.
Subject L walk/ R walk/ F walk/ F walk/
R point L point R point L point
S1 0.05 0.12 0.10 0.09
S2 0.39 0.35 0.39 0.33
S3 0.10 0.05 0.10 0.13
S4 0.03 0.05 0.07 0.06
S5 0.13 0.04 0.09 0.06
S6 0.25 0.30 0.36 0.43
S7 0.45 0.34 0.41 0.47
S8 0.11 0.07 0.07 0.12
S9 0.24 0.32 0.29 0.34
Mean 0.20 0.17 0.20 0.23
p-value 0.0001 0.0001 0.0002 0.0016
There were no above chance performances in classifications using only EOG +
peripheral scalp channels.
Table 3D | Classification errors for action vs. standing.
Subject L walk/ R walk/ F walk/ L point/ R point/
stand stand stand stand stand
S1 0.12 0.16 0.20 0.16 0.25
S2 0.38 0.33 0.42 0.46 0.48
S3 0.25 0.24 0.20 0.13 0.15
S4 0.19 0.36 0.33 0.10 0.07
S5 0.16 0.27 0.05 0.08 0.05
S6 0.27 0.49 0.37 0.36 0.35 (0.32)
S7 0.47 0.47 0.41 0.39 0.55
S8 0.10 0.32 0.17 0.10 0.16
S9 0.24 0.35 0.27 0.24 0.28
Mean 0.24 0.35 0.27 0.25 0.28
p-value 0.0001 0.0007 0.0003 0.0002 0.0030
Above chance performances in classification using only EOG+peripheral scalp
channels are shown in parenthesis next to the reported performances using only
scalp channels. These values are not included in the calculation of the mean, and
are crossed out.
and subject 8 (S8) in the two most difficult classifications, Lwalk/L point and R walk/R point, and in the three classificationscollapsed across directions best provided insight into the classi-fication process. Both subjects had significantly low errors for allclassifications, but S4 probably had contributions from EOG orperipheral channels in the walk/stand and point/stand classifica-tions while S8 had no such contributions. S8 had much highererror in the L walk/L point and R walk/R point classificationscompared to S4.
The frequency bands with the highest weighting were visual-ized by plotting the final weight for each of the 358 coefficients(Figures 2, 3). The final weight was computed by multiply-ing the PC weights from all 10 PCs by their respective LDAweights. This was done using training data from all 10-foldsand 10 runs. Additionally, scalp topographies of channel weightswere plotted using only coefficients within a given frequency
Frontiers in Neuroscience | Neuroprosthetics June 2013 | Volume 7 | Article 84 | 6

Velu and de Sa EEG detection of gait preparation
band (smaller scalp plots) and using all coefficients (large scalpplot). The former indicated which brain regions had infor-mative activity within a given frequency band while the lat-ter gave a sense of which channels were most crucial for theLDA classification. The plots show that coefficients correspond-ing to lower frequency bands were more highly weighted. Thescalp map averaged over all coefficients indicated that channelsCpz, C4, and FC5 were most highly weighted in S4 whereasS8 only had one channel, C3, highly weighted. The scalp
Table 4 | Classification errors for combined directions.
Subject Walk/ Point/ Walk/
stand stand point
S1 0.10 (0.38) 0.30 (0.39) 0.24
S2 0.34 (0.38) 0.41 0.40
S3 0.21 0.25 0.39
S4 0.19 (0.33) 0.22 (0.36) 0.24
S5 0.21 0.26 0.40
S6 0.35 0.41 0.40
S7 0.22 (0.34) 0.28 0.42
S8 0.18 0.17 0.28
S9 0.24 0.32 0.28
Mean 0.24 0.30 0.34
p-value 0.0005 0.0005 0.0002
Above chance performance in classifications using only EOG +peripheral scalp
channelsareshowninparenthesisnexttotheperformanceusingall scalpchannels.
These values are crossed out, and not included in the calculation of the mean.
maps within different frequency bands showed very variabletopographies.
Using EOG and peripheral channels alone resulted in signifi-cantly low errors in the walk/stand and point/stand classificationsin S4. Scalp topographies suggested weighting of the frontalelectrodes in a pattern that suggested vertical eye movements,though this reliance on frontal electrodes was diminished in thewalk/point classification. An example of possible neck muscleartifact can be seen in the scalp map for the 16–32 Hz frequencyband of the R walk/R point classification. There were no scalptopographies with exclusively frontal or peripheral electrodeweighting, which would suggest that eye or muscle movementswere driving the classification.
The most weighted PCs did not necessarily have the high-est eigenvalues (Figure 4). There were three distinct topographieswith slight variations represented by the 10 PCs, and the first fivePCs summed to 75% of the total contribution to classification.
ERROR PATTERNS FROM MDA CLASSIFICATIONIn the confusion matrix for the three-class problem of leftwalk/front walk/right walk (Figure 5A), most left and right tri-als were correctly classified, less likely to be classified one locationaway, and least likely to be classified two locations away. Mostfront trials were correctly classified, with similar misclassificationrates as left or right. This same structure more or less exists in theconfusion matrix for the three-class problem of left point/frontwalk/right point (Figure 5B). In the four-class problem of leftwalk/right walk/left point/right point (Figure 5C), once again tri-als were most likely to be correctly classified. Direction was a
FIGURE 3 | Similar to Figure 2, but with walk/stand, point/stand, and walk/point feature visualization for S4 and S8.
www.frontiersin.org June 2013 | Volume 7 | Article 84 | 7

Velu and de Sa EEG detection of gait preparation
FIGURE 4 | Scalp topographies of the weighted average of the
contributions from all frequencies for all 10 PCs used in the L walk/L
point classification in S4 are ordered from the PC with the highest LDA
weight to that with the lowest LDA weight. Percentage contribution toLDA was calculated by normalizing LDA weights to one. PC1 has the highesteigenvalue and PC10 the lowest.
FIGURE 5 | (A) Confusion matrix for three-class MDA of left walk/frontwalk/right walk. Row labels indicate true classes and column labels indicateclassifier labels. Color of cells reflect fraction of trials classified as trial typeindicated by the column label, i.e., the second cell in the top row indicates
the fraction of left trials classified as front trials. Larger fractions (lightercolors) represent higher number of correct classifications. (B) Confusionmatrix for three-class MDA of left point/front walk/right point. (C) Confusionmatrix for four-class MDA of left walk/right walk/left point/right point.
stronger factor than type of action for correct classification. Forexample, left walk trials were more likely to be misclassified as leftpoint trials but less likely and at similar rates to be misclassified asright walk or right point trials.
DISCUSSIONThis study demonstrated that single trial EEG data is (1) classi-fiable for walk intent before the onset of natural movement, (2)classifiable between two motor plans (walking and pointing) thatactivate overlapping muscles, and (3) classifiable for an actionat different target spatial locations. The largest contributors to
successful classification were low frequencies (0–4 Hz) and chan-nels located over areas involved in motor planning or motorproduction.
It is important to note that “movement intent” as used in thispaper refers to the preparation of a movement by the subject inresponse to an external experimental cue. Further, movement waselicited by a warning stimulus (S1) that was followed by an imper-ative stimulus (S2). The resultant MRP from this paradigm is theCNV, which contains contributions from both motor preparationand attention for the upcoming stimulus (Luck and Kappenman,2011). The motor aspect of the CNV is often equated to the late
Frontiers in Neuroscience | Neuroprosthetics June 2013 | Volume 7 | Article 84 | 8

Velu and de Sa EEG detection of gait preparation
phase of the BP (Bereitschaftpotential), which is another slowcortical DC potential that is an indicator of human voluntaryactivity from as early as 2 s (the “early BP”) to 400 ms (the “lateBP”) before the onset of movement (Shibasaki and Hallet, 2006).While the CNV results from external regularly timed cued move-ment, the BP results from internally self-paced movement. Thebeginning of the early BP starts in the pre-supplementary motorarea (pre-SMA) and lacks somatotopic organization, but the restof the early BP and the entire late BP have generators with dis-crete spatial locations corresponding to body parts. Applicationof this classifier paradigm to subject driven gait intent may showbetter classification as a result of the greater specificity of the BPcompared to the CNV (Jankelowtiz and Colebatch, 2002; Lewet al., 2012).
A large challenge of using MRPs is finding informative activ-ity within single trials since the low signal to noise ratio of asingle trial presents a considerable obstacle in feature detection.Though the majority of MRPs in EEG literature are presentedas ERPs averaged over hundreds of trials in the time-voltagedomain, efforts are being made to capture the MRP within a sin-gle trial. One group succeeded in single trial detection of the MRPusing features from wavelet analysis for predicting foot torquemovement while subjects were seated (Farina et al., 2007).
Another feature commonly used in BCIs is the event relateddesynchronization (ERD)/event related synchronization (ERS),or the decrease/increase in power of mu (8–13 Hz) or beta(14–25 Hz) rhythms at somatotopically distinct regions beforeand during motor planning, action or imagery (McFarlandet al., 2000; Pineda et al., 2000). In select subjects, it is visuallyobservable during single trials and has been used to detect hand,foot, or tongue motor imagery (Pfurtscheller et al., 2006; Baiet al., 2008) or predict wrist extension (Bai et al., 2010). Onestudy concluded that ERD and ERS was a more specific signalcompared to the MRP for detection of pre-movement or motorimagery in a left hand/right hand/foot/tongue task (Morash et al.,2008). It is important to note that this feature varies spectrally andtopographically in individual subjects (McFarland et al., 2000).
In this study we used all frequency information available in thesignal by including coefficients from the entire wavelet decompo-sition. Previously mentioned fMRI, PET, and NIRS studies on gaitfound task-relevant activity in the supplementary motor cortex(SMA), medial primary motor cortex, and medial sensorimotorcortices. Cortical folding is different between individuals, whichresults in highly variable topographic distributions of useful EEGsignal within a group of subjects. We created unsupervised cus-tom spatial filters for each subject by including all noise-freechannels available from the 64-channel montage covering thescalp and then applying PCA to transform and reduce this largefeature space to the 10 dimensions with the most variance in thesignal.
The variable ranking of PCs by LDA weights was in line with astudy of single trial EEG classification using PCA-reduced featurespace and LDA for an imagined left-and-right hand movementtask (Lugger et al., 1998). Though the first few PCA compo-nents had the greatest variance, they were poor in discriminatingbetween left vs. right hand motor imagery. These componentswere thought to represent background cortical EEG activity thatwas unrelated to the task.
Visualizations of the features used by the classifier revealedthat frequency components within the range of the MRP weremost heavily weighted. The channels most weighted in S4 mayhave reflected activity from the PMd (FC5), leg motor area (CPz),and arm motor area (C4), which could explain the lower errorsfor the L walk/L point and R walk/ R point classifications com-pared with S8, who only had high weighting of channel C3.Notably, the classification error for walk/point was similar forboth S4 and S8, possibly because more trials were available fortraining as the classification used trials from both left and rightconditions.
The dorsal premotor cortex (PMd) is postulated to be acti-vated in externally cued movement preparation vs. movementthat is internally driven by the subject, and vice versa in the SMA.Evidence for this has been circumstantial in humans, thoughone group demonstrated double-dissociation of PMd and SMAactivity on MRPs by repetitive transcranial magnetic stimulation(rTMS) in humans during a right digit task in externally cued vs.internally driven conditions (Lu et al., 2011). Most relevant to thisEEG study is an experiment that demonstrated that EEG surfacepotential configurations had the same order and same strengthbut longer duration over the PMA compared to the SMA in exter-nally cued vs. internally driven right digit movement (Thut et al.,2000).
BCIs also must minimize or eliminate contributions fromnon-cortical electrical activity, such as from EOG and EMG.These signals not only obscure the cortical signal but canmisdirect classification as in a situation when a subject is look-ing at a target that is not located in the intended direction ofgait. Topographies suggestive of eye and muscle movements didappear in some scalp maps but were not the only feature presentin the maps or had smaller weights. Classification using EOG andperipheral scalp channels resulted in significantly low errors inonly 6% of all classifications, and these error values were pooreror comparable to those from classifications using only scalp chan-nels. The classifiers appear to have minimized the contribution ofeye or muscle movement on the scalp channel cortical signals forcorrect classification of movement intent.
Another challenge was in differentiating between two differentmotor plans to ensure that discrimination was based on a sig-nal unique to gait movement intent and not generalized to anymovement intent. Further, this was not a straightforward classifi-cation of an upper limb activity from a lower limb activity. Gaitrequires not only the participation of lower limb muscles, buttrunk and upper limb muscles as well. In EMG studies, the poste-rior deltoid muscle was consistently activated in all 35 subjects ina walking task (Barthelemy and Nielsen, 2010), and contributedto horizontal abduction, external rotation, and depression at theshoulder as well as flexion and supination at the elbow dur-ing arm reaching (Vandenberghe et al., 2012). Though regionsof the cortex involved in planning movements of these mus-cles have specific somatopic distribution, they are contiguouslylocated on the sensorimotor cortex (Bakker et al., 2007) and maynot be easily separable by the poor spatial resolution of EEG.This was probably the biggest factor in the higher errors for thewalk vs. point classification problems compared to point vs. standand walk vs. stand classification problems, though it is notablethat the errors were still significantly below chance. With more
www.frontiersin.org June 2013 | Volume 7 | Article 84 | 9

Velu and de Sa EEG detection of gait preparation
training trials and the use of a non-linear classifier such as kernelsupport vector machines, these errors may be further lowered.
Finally, we tested the ability to predict the direction of move-ment toward a target either to the left, in front, or right of thesubject. For all three targets, subjects initiated walking with thesame leg and same arm, so classification was not based on con-tralateral cortical activation of the limb used. Previously, reachingto three different (left, right, center) locations using the same armrevealed an underlying structure in the pre-movement EEG signalthat corresponded with target space (Hammon et al., 2008). Trialswere most likely to be correctly classified, less likely to be classifiedone target away, and least likely to be classified two targets away.We found a similar underlying structure that corresponded to thetarget space in our data.
We should note that in an online real-time BCI, the classifierwould be trained on initial data and then be tested on future data.This means it must be robust to non-stationarity in the signalsthat can cause drifts in the features over time. In this experimentthere were not enough trials to create a large enough training
set for adequate training and a separate (later) test set with anadequate number of trials to reliably assess the classifier accuracy,so we were not able to test this aspect.
In conclusion, this study has shown that the EEG signalcan be used for predictive classification between walk, pointand stand actions as well between different target directionsfor these actions. Spatial and spectral contributions were fromareas involved in motor planning or production and mostlyfrom low frequency cortical activity, with smaller contributionsfrom mu and beta frequency bands. It remains to be testedwhether this signal can be detected in real-time non-stationarydata.
ACKNOWLEDGMENTSWe would like to thank Dr. Marta Kutas for comments on ear-lier versions of this manuscript. This work was supported bygrants from the National Science Foundation (CBET-0756828,IIS 1219200, SBE-0542013, SMA 1041755) and the NationalInstitutes of Health (5T32GM007198-35).
REFERENCESAgresti, A., and Caffo, B. (2000). Simple
and effective confidence intervalsfor proportion and differences ofproportions result from adding twosuccesses and two failures. Am. Stat.54, 280–288.
Bai, O., Lin, P., Vorbach, S., Floeter,M. K., Hattori, N., and Hallet,M. (2008). A high performancesensorimotor beta rhythm-basedbrain computer interface associatedwith human natural motor behav-ior. J. Neural Eng. 5, 24–35. doi:10.1088/1741-2560/5/1/003
Bai, O., Rathi, V., Lin, P., Huang,D., Battapady, H., Fei, D., et al.(2010). Prediction of humanvoluntary movement before itoccurs. Clin. Neurophysiol. 122,364–372. doi: 10.1016/j.clinph.2010.07.010
Bakker, M., De Lange, F. P., Helmich,R. C., Scheeringa, R., Bloem, B.R., and Toni, I. (2008). Cerebralcorrelates of motor imageryof normal and precision gait.Neuroimage 41, 998–1010. doi:10.1016/j.neuroimage.2008.03.020
Bakker, M., Verstappen, C. C. P.,Bloem, B. R., and Toni, I. (2007).Recent advances in functional neu-roimaging of gait. J. Neural. Transm.114, 1323–1331. doi: 10.1007/s00702-007-0783-8
Barthelemy, D., and Nielsen, J. B.(2010). Corticospinal contri-bution to arm muscle activityduring human walking. J. Physiol.588, 967–979. doi: 10.1113/jphysiol.2009.185520
Delorme, A., Kothe, C., Vankov, A.,Bigdely-Shamlo, N., Oostenveldt,R., Zander, T., et al. (2012).
“MATLAB-based tools for BCIresearch,” in (B+H)CI: BrainComputer Interfaces: Applyingour Minds to Human-ComputerInteraction, eds D. Tan andA. Nijholt (New York, NY:Springer-Verlag), 241–259.
Delorme, A., and Makeig, S. (2004).EEGLAB: an open sourcetoolbox for analysis of single-trial EEG dynamics. J. Neuro.Meth. 134, 9–21. doi: 10.1016/j.jneumeth.2003.10.009
Delorme, A., Mullen, T., Kothe, C.,Akalin Acar, Z., Bigdely-Shamlo,N., Vankov, A., et al. (2011).EEGLAB, SIFT, NFT, BCILAB, andERICA: new tools for advancedEEG processing. Comput. Intell.Neurosci. Article ID 130714, 12. doi:10.1155/2011/130714
do Nascimento, O. F., and Farina,D. (2006). “Classification ofmovement-related cortical poten-tials according to variationsof rate of torque developmentduring imaginary isometricplantar-flexion,” in Proceedingsof the 3rd International Brain-Computer Interface Workshop andTraining Course (Graz, Austria),70–71.
Farina, D., do Nascimento, O. F.,Lucas, M. F., and Doncarli, C.(2007). Optimization of waveletsfor classification of movement-related-cortical potentials generatedby variation of force-relatedparamaters. J. Neuro. Meth.162, 357–363. doi: 10.1016/j.jneumeth.2007.01.011
Fitzsimmons, N. A., Lebedev, M.A., Peikon, I. D., and Nicolelis,M. A. L. (2009). Extracting
kinematic parameters for mon-key bipedal walking for corticalneuronal ensemble activity.Front. Integr. Neuro. 3:3. doi:10.3389/neuro.07.003.2009
Friedman, J. H. (1989). Regularizeddiscriminant analysis. J. Am. Stat.Assoc. 84, 165–175.
Graybiel, A. M. (2005). The basalganglia: learning new tricks andloving it. Curr. Opin. Neurobiol.15, 638–644. doi: 10.1016/j.conb.2005.10.006
Grillner, S., Wallen, P., Saitoh, K.,Kozlov, A., and Robertson, B.(2008). Neural bases of goal-directed locomotion in vertebrates.Brain Res. Rev. 57, 2–12.
Gwin, J. T., Gramann, K., Makeig,S., and Ferris, D. P. (2010).Removal of movement artifactfrom high-density EEG recordedduring walking and running.J. Neurophysiol. 103, 3526–3534.doi: 10.1152/jn.00105.2010
Gwin, J. T., Gramann, K., Makeig,S., and Ferris, D. P. (2011).Electrocortical activity is cou-pled to gait cycle phase duringtreadmill walking. Neuroimage54, 1289–1296. doi: 10.1016/j.neuroimage.2010.08.066
Hammon, P. S., Makeig, S., Poizner,H., Todorov, E., and de Sa, V.R. (2008). Predicting reach tar-gets from human EEG. IEEESignal Proc. Mag. 70, 69–77. doi:10.1109/MSP.2007.909004
Hanakawa, T., Katsumi, Y., Hidemo,F., Honda, M., and Hayashi, T.(1999). Mechanisms underlyinggait disturbance in Parkinson’sdisease. Brain 122, 1271–1282. doi:10.1093/brain/122.7.1271
Iseki, K., Hanakawa, T., Shinozaki,J., Nankaku, M., and Fukuyama,H. (2008). Neural mechanismsinvolved in mental imageryand observation of gait.Neuroimage 41, 1021–1031. doi:10.1016/j.neuroimage.2008.03.010
Jahn, K., Deutschlander, A., Stephan,T., Strupp, M., Wiesmann, M.,and Brandt, T. (2004). Brain acti-vation patterns during imaginedstance and locomotion in func-tional magnetic resonance imag-ing. Neuroimage 22, 1722–1731. doi:10.1016/j.neuroimage.2004.05.017
Jankelowtiz, S. K., and Colebatch, J. G.(2002). Movement-related poten-tials associated with self-paced,cued and imagined arm move-ments. Exp. Brain Res. 147, 98–107.doi: 10.1007/s00221-002-1220-8
Jiang, Y., and Norman, K. E. (2006).Effects of visual and auditorycues on gait initiation in peo-ple with Parkinson’s disease.Clin. Rehabil. 20, 36–45. doi:10.1191/0269215506cr925oa
Lan, T., Erdogmus, D., Black, L., andVan Santen, J. (2010). A com-parison of different dimensional-ity reduction and feature selectionmethods for single trial ERP detec-tion. Conf. Proc. IEEE Eng. Med.Biol. Soc. 2010, 6329–6332. doi:10.1109/IEMBS.2010.5627642.
Lew, E., Chavarriaga, R., Silvoni, S., andMillán, J. (2012). Detection of self-paced reaching movement intentionfrom EEG signals. Front. Neuroeng.5:13. doi: 10.3389/fneng.2012.00013
Lu, M. K., Arai, N., Tsai, C. H., andZiemann, U. (2011). Movementrelated cortical potentials of cuedversus self-initiated movements:
Frontiers in Neuroscience | Neuroprosthetics June 2013 | Volume 7 | Article 84 | 10

Velu and de Sa EEG detection of gait preparation
double dissociated modulationby dorsal premotor cortex versussupplementary motor area rTMS.Hum. Brain Mapp. 33, 824–839. doi:10.1002/hbm.21248
Luck, S., and Kappenman, E. (2011).The Oxford Handbook of Event-Related Potential Components. NewYork, NY: Oxford University Press.
Lugger, K., Flotzinger, D., Schloegl, A.,Pregenzer, M., and Pfurtscheller,G. (1998). Feature extraction foron-line EEG classification usingprincipal components and lineardiscriminants. Med. Biol. Eng.Comput. 36, 309–314.
Malouin, F., Richards, C. L., Jackson, P.L., Dumas, F., and Doyon, J. (2003).Brain activations during motorimagery of locomotor-related tasks:a PET study. Hum. Brain Mapp. 19,47–62. doi: 10.1002/hbm.10103
Mann, R. A., Hagy, J. L., White, V.,and Liddell, D. (1979). The initia-tion of gait. J. Bone Joint Surg. 61a,232–239.
Matthews, R., Turner, P. J., McDonald,N. J., Ermolaev, K., Manus, T. Mc.,Shelby R. A., et al. (2008). “Realtime workload classification froman ambulatory wireless EEG sys-tem using hybrid EEG electrodes,”in EMBS 30th Annual InternationalConference of the IEEE (Vancouver,Canada), 5871–5875.
McFarland, D. J., Miner, L. A., Vaughan,T. M., and Wolpaw, J. R. (2000).Mu and beta rhythm topogra-phies during motor imagery andactual movements. Brain Topogr. 12,177–186.
Miyai, I., Tanabe, H. C., Sase, I.,Eda, H., Oda, I., Konishi, I., et al.(2001). Cortical mappping ofgait in humans: a near-infraredspectroscopic topography study.Neuroimage 14, 1186–1192. doi:10.1006/nimg.2001.0905
Morash, V., Bai, O., Furlani, S., Lin, P.,and Hallett, M. (2008). Classifying
EEG signals preceding right hand,left hand, tongue, and right footmovements and motor imageries.Clin. Neurophysiol. 119, 2570–2578.doi: 10.1016/j.clinph.2008.08.013
Müller-Putz, G. R., Scherer, R.,Brunner, C., Leeb, R., andPfurtscheller, G. (2008). Betterthan random? A closer look on BCIresults. Int. J. Bioelectromag. 10,52–55.
Nieuwboer, A. (2008). Cueing forfreezing of gait in patients withParkinson’s disease: A rehabilitationperspective. Mov. Disord. 23(Suppl.2), S475–S481.
Pfurtscheller, G., Brunner, C., Schlögl,A., and Lopes da Silva, F. H. (2006).Mu rhythm (de)synchronizationand EEG single-trial classificationof different motor imagery tasks.Neuroimage 31, 153–159. doi:10.1016/j.neuroimage.2005.12.003
Pineda, J. A., Allison, B. Z., andVankov, A. (2000). The effectsof self-movement, observation,and imagination on mu rhythmsand readiness potentials (RP’s):towards a brain-computer inter-face. IEEE Trans. Rehabil. Eng. 8,219–222.
Presacco, A., Goodman, R., Forrester,L., and Contreras-Vidal, J. L.(2011). Neural decoding of tread-mill walking from noninvasiveelectroencephalographic signals.J. Neurophysiol. 106, 1875–1887.doi: 10.1152/jn.00104.2011
Renfrew, M., Cheng, R., Daly, J. J., andCavusoglu, M. (2008). Comparisonof filtering and classification tech-niques of electroencephalographyfor brain-computer interface.Conf. Proc. IEEE Eng. Med.Biol. Soc. 2008, 2634–2637. doi:10.1109/IEMBS.2008.4649741.
Shibasaki, H., and Hallet, M. (2006).What is the Bereitschaftspotential?Clin. Neurophysiol. 117, 2341–2356.doi: 10.1016/j.clinph.2006.04.025
Subasi, A. (2006). EEG signal clas-sification using wavelet featureextraction and a mixture of expertmodel. Expert Syst. Appl. 31,320–328.
Thut, G., Hauert, C. A., Viviani, P.,Morand, S., Spinelli, L., Blanke,O., et al. (2000). Internally drivenvs. externally cued movement selec-tion: a study on timing of brainactivity. Brain Res. Cogn. Brain Res.9, 261–269.
Vandenberghe, A., Bosmans, L., DeSchutter, J., Swinnen, S., andJonkers, I. (2012). Quantifyingindividual muscle contribution tothree-dimensional reaching tasks.Gait Posture 35, 579–584. doi:10.1016/j.gaitpost.2011.11.028
Vankov, A., Bigdely-Shamlo,N., and Makeig, S. (2010).“DataRiver – a software plat-form for real-time management ofmultiple data streams,” in FourthInternational BCI Meeting Asilomar(California).
Wang, C. H., Wai, Y. Y., and Kuo, B.C. (2008). Cortical control of gaitin healthy humans: an fMRI study.J. Neural. Transm. 115, 1149–1158.doi: 10.1007/s00702-008-0058-z
Wang, J. J., Wai, Y. Y., Weng, Y. H.,Ng, K. K., Huang, Y. Z., Ying, L.,et al. (2009). Functional MRI inthe assessment of cortical activationduring gait-related imaginary tasks.J. Neural. Transm. 116, 1087–1092.doi: 10.1007/s00702-009-0269-y
Wang, Y. T., Wang, Y., and Jung,T. P. (2011). A cell-phone basedbrain-computer interface for com-munication in daily life. J. Neural.Eng. 8, 025018. doi: 10.1088/1741-2560/8/2/025018
Wang, Y., and Makeig, S. (2009).Predicting intended movementdirection using EEG from humanposterior parietal cortex. AugmentedCogn. LNAI 5638, 437–446. doi:10.1007/978-3-642-02812-0_52
Wagner, J., Solis-Escalante, T.,Grieshofer, P., Neuper, C., Müller-Putz, G. R., and Scherer, R.(2012). Level of participationin robotic-assisted treadmillwalking modulates midlinesensorimotor EEG rhythms inable-bodied subjects. Neuroimage63, 1203–1211. doi: 10.1016/j.neuroimage.2012.08.019
Yazawa, S., Shibasaki, H., Ikeda,A., Terada, K., Nagamine, T.,and Honda, M. (1997). Corticalmechanism underlying exter-nally cued gait initiation studiedby contingent negative varia-tion. Electroencephalogr. Clin.Neurophysiol. 105, 390–399.
Yasui, Y. (2009). A brainwave signalmeasurement and data processingtechnique for daily life applications.J. Physiol. Anthropol. 28, 145–150.
Conflict of Interest Statement: Theauthors declare that the researchwas conducted in the absence of anycommercial or financial relationshipsthat could be construed as a potentialconflict of interest.
Received: 07 May 2012; accepted: 07 May2013; published online: 11 June 2013.Citation: Velu PD and de Sa VR(2013) Single-trial classification of gaitand point movement preparation fromhuman EEG. Front. Neurosci. 7:84. doi:10.3389/fnins.2013.00084This article was submitted to Frontiers inNeuroprosthetics, a specialty of Frontiersin Neuroscience.Copyright © 2013 Velu and de Sa.This is an open-access article dis-tributed under the terms of the CreativeCommons Attribution License, whichpermits use, distribution and repro-duction in other forums, providedthe original authors and source arecredited and subject to any copyrightnotices concerning any third-partygraphics etc.
www.frontiersin.org June 2013 | Volume 7 | Article 84 | 11