detecting transient changes in gait using fractal scaling of gait … · detecting transient...
TRANSCRIPT

Detecting Transient Changes in Gait Using Fractal Scaling of Gait Variability in Conjunction with
Gaussian Continuous Wavelet Transform
Daniel J Jaskowak
Thesis submitted to the faculty of the Virginia Polytechnic Institute and State University in partial
fulfillment of the requirements for the degree of
Master of Science
In
Human Nutrition, Foods, and Exercise
Jay Williams, Committee Chair
David Brown
David Tegarden
October 29, 2018
Blacksburg, Virginia
Keywords: Time series analysis, trunk-mounted accelerometry, autocorrelation, fatigue, detrended
fluctuation analysis, gait analysis, Gaussian continuous wavelet transform

Detecting Transient Changes in Gait Using Fractal Scaling of Gait Variability in Conjunction with
Gaussian Continuous Wavelet Transform
Daniel J Jaskowak
Abstract
Accelerometer data can be analyzed using a variety of methods which are effective in the
clinical setting. Time-series analysis is used to analyze spatiotemporal variables in various
populations. More recently, investigators have focused on gait complexity and the structure of
spatiotemporal variations during walking and running.
This study evaluated the use of time-series analyses to determine gait parameters during
running. Subjects were college-age female soccer players. Accelerometer data were collected
using GPS-embedded trunk-mounted accelerometers. Customized Matlab® programs were
developed that included Gaussian continuous wavelet transform (CWT) to determine
spatiotemporal characteristics, detrended fluctuation analysis (DFA) to examine gait complexity
and autocorrelation analyses (ACF) to assess gait regularity. Reliability was examined using
repeated running efforts and intraclass correlation. Proof of concept was determined by
examining differences in each variable between various running speeds. Applicability was
established by examining gait before and after fatiguing activity.
The results showed most variables had excellent reliability. Test-retest R2 values for
these variables ranged from 0.8 to 1.0. Low reliability was seen in bilateral comparisons of gait
symmetry. Increases in running speed resulted in expected changes in spatiotemporal and
acceleration variables. Fatiguing exercise had minimal effects on spatiotemporal variables but
resulted in noticeable declines in complexity.
This investigation shows that GPS-embedded trunk-mounted accelerometers can be
effectively used to assess running gait. CWT and DFA yield reliable measures of spatiotemporal
characteristics of gait and gait complexity. The effects of running speed and fatigue on these
variables provides proof of concepts and applicability for this analytical approach.

Detecting Transient Changes in Gait Using Fractal Scaling of Gait Variability in Conjunction with
Gaussian Continuous Wavelet Transform
Daniel J Jaskowak
General Audience Abstract
Fitness trackers have become widely accessible and easy to use. So much so that athletic
teams have been using them to track activity throughout the season. Researchers are able to
manipulate data generated from the fitness monitors to assess many different variables including
gait. Monitoring gait may generate important information about the condition of the individual.
As a person fatigues, running form is theorized to breakdown, which increases injury risk.
Therefore the ability to monitor gait may be advantageous in preventing injury. The purpose of
this study is to show that the methods in this study are reproducible, respond reasonably to
changes in speed, and to observe the changes of gait in the presence of fatigue or on tired legs.
Three analyses are used in this study. The first method called autocorrelation, overlays
acceleration signals of consecutive foot strikes, and determines the similarity between them. The
second method utilizes a wave transformation technique that is able to determine foot contact
times. The final method attempts to determine any pattern in the running stride. This method
looks for changes in the structure of the pattern. Less structure would indicate a stride that is
fatigued. The results showed that the methods of gait analysis used in this study were
reproducible and responded appropriately with changes in speed. Small changes in gait were
observed due to the presence of fatigue. Further investigation into the use of these methods to
determine changes in gait due to the presence of fatigue are warranted.

v
Table of Contents
Chapter Page
Abstract ii
General Audience Abstract iv
List of Figures vii
List of Tables viii
Abbreviations ix
1 Introduction 1
1.1 Introduction 1
1.2 Specific Aims 2
1.3 Limitations and Delimitations 3
2 Literature Review 4
2.1 Introduction 4
2.2 Gait 4
2.3 Accelerometry and Gait Analysis 8
2.4 Alterations in Gait 20
2.5 Conclusions 28
3 Methods 30
3.1 GPSports SPI HPU Units 30
3.2 Analytic Procedures 31
3.3 Specific Experiments 34
4 Results 39
4.1 Raw Data 39
4.2 Test-Retest Analyses 44
4.3 Varied Speed 50
4.4 Acute Exercise Data 53
5 Discussion 58
5.1 Reliability 58

vi
5.2 Effects of Running Speed 59
5.3 Effects of Fatiguing Exercise 61
5.4 Applications and Limitations 62
6 Conclusions 64
References 65
Appendix 76

vii
List of Figures
Figure Page
1 A first order Gaussian wavelet. 9
2 Example of how CWT can be used to calculate contact times. 10
3 Determination of right and left foot strikes using ML axis acceleration. 12
4 Determination of vertical displacement (h) for use in the calculation of step
length.
12
5 ACF of gait acceleration. 14
6 Detrended fluctuation analysis 18
7 Matlab graphical output. 34
8 Typical raw accelerometer data obtained from a single trial. 39
9 Partial CWT analysis obtained from a single trial. 40
10 Calculation of peak acceleration and the acceleration area variable within a
single trial.
40
11 Spatiotemporal variables recorded during a running trial at constant, self-
selected speed.
41
12 Results of the DFA analysis. 42
13 Effect of random shuffling of StpL data on the DFA. 43
14 Results of the autocorrelation analyses from each axis as well as the
calculated resultant.
44
15 Examples of running speed (top) and resultant vector acceleration (bottom)
during the acute exercise bout.
54
16 GPS data showing the acute exercise bout overlaid on the practice field. 54
17 Effects of fatigue on gait characteristics. 57

viii
List of Tables
Table Page
1 Description of the variables used in this study 37
2 Within-Day Reliability. Intraclass correlation, mean and SD values for each
of the variables recorded during three trials conducted on the same day
(n=48, 16 subjects x 3 trials).
46 46
3 Between-Day Reliability. Intraclass correlation, mean and SD values for
each of the variables recorded during three trials conducted on different days
(n=33, 11 subjects x 3 days).
48
4 Effects of Varied Speed on Gait Variables. Mean comparison of each
variable recoded during different running speeds (n=18 subjects for each
speed).
51
5 Work load during the acute exercise bout. Values describing the workload
experienced during the training session (n=10 players).
55
6 Effects of Exercise on Gait Variables. Mean comparisons between pre- and
post-training session.
56
ix
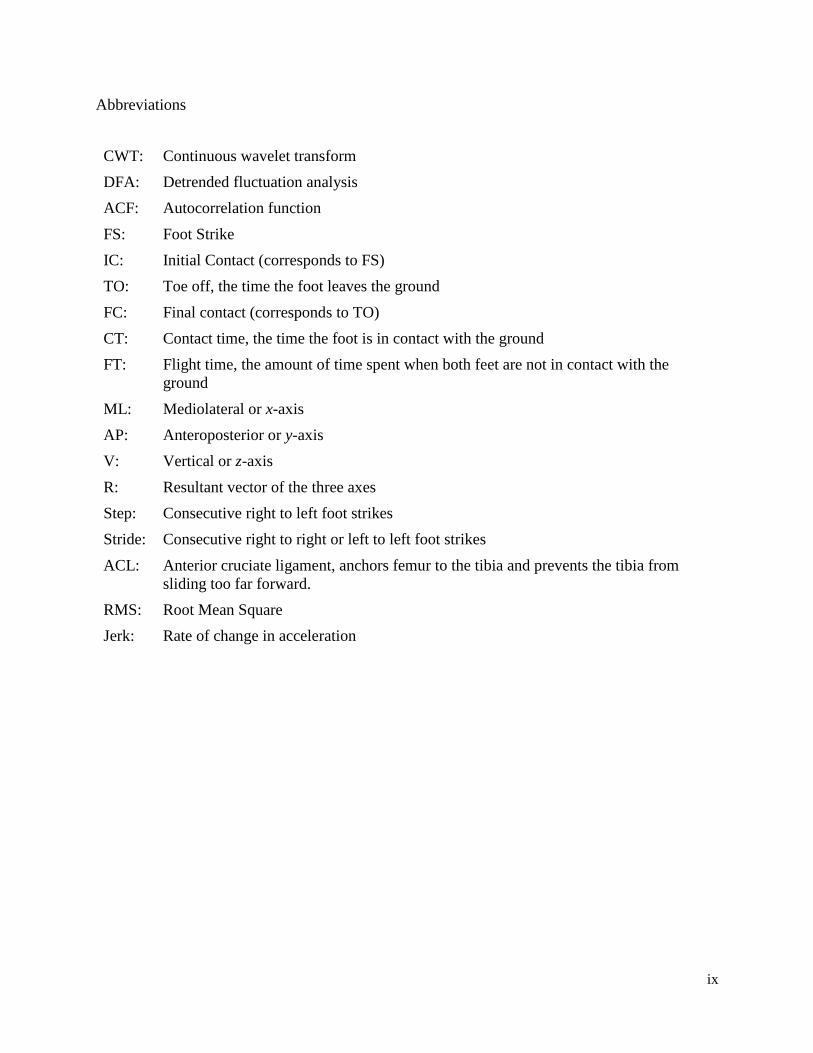
Abbreviations
CWT: Continuous wavelet transform
DFA: Detrended fluctuation analysis
ACF: Autocorrelation function
FS: Foot Strike
IC: Initial Contact (corresponds to FS)
TO: Toe off, the time the foot leaves the ground
FC: Final contact (corresponds to TO)
CT: Contact time, the time the foot is in contact with the ground
FT: Flight time, the amount of time spent when both feet are not in contact with the
ground
ML: Mediolateral or x-axis
AP: Anteroposterior or y-axis
V: Vertical or z-axis
R: Resultant vector of the three axes
Step: Consecutive right to left foot strikes
Stride: Consecutive right to right or left to left foot strikes
ACL: Anterior cruciate ligament, anchors femur to the tibia and prevents the tibia from
sliding too far forward.
RMS: Root Mean Square
Jerk: Rate of change in acceleration
1
Chapter 1
Introduction
1.1 Introduction
Laboratory methods of simulating team sports-based situations have struggled to provide
ecologically valid data. Creating a simulated environment in order to estimate observable
physiologic variables does not adequately describe the stresses that athletes are subject to during
regular practice and competition. Recent developments in technology have provided new
methods of fitness tracking that act as promising replacements for lab simulated experiments.
Wearable fitness trackers have begun to become reliable methods of physiological monitoring in
team-based sports. Accelerometers and GPS devices are now small enough to wear on a person
in the form of a watch, band, or a trunk mounted monitor. The ease in which these devices can
be worn combined with their ability to simultaneously collect large amounts of data, makes
fitness trackers a valuable tool in measuring physiologic changes during team sports activities.
A key hindrance to athletic performance is fatigue and injury. Therefore, it would be
advantageous to have the ability to conveniently monitor fatigue and assess injury risk.
Physiological monitor-derived measures of training load have been used to monitor training
habits through competitive seasons in team sports. However, the interpretation of training load
data is not sensitive to the day or even the workout. Ratings of perceived exertion (RPE) are
another measure of fatigue that have some validity, however in team sports they tend to become
less valid as the team adopts a group RPE (rather than a true RPE) in order to maintain status
(i.e. are in as good of shape as others). Therefore, having a marker of fatigue that would be
sensitive enough to detect changes from workout to workout, while also observing individual
athletes independent of bias, would be advantageous. Accelerometric gait analysis could provide

2
an opportunity to achieve this objective. In clinical populations, accelerometric gait analysis has
been shown to be able to distinguish changes in gait due to different pathologies. It has not been
extensively studied in athletic populations or while running.
1.2 Specific Aims
The overall aim of this investigation is develop a method of gait analysis using
continuous wavelet transform (CWT), peak acceleration detection and autocorrelation
procedures. Specifically, this study sought to:
1. Develop a system to generate variable describing spatiotemporal, accelerometric and
structural variability parameters of the running gait. Specifically to employ:
a. Gaussian CWT to generate spatiotemporal variables.
b. Peak analysis to generate accelerometric variables.
c. Autocorrelation analysis to determine step and stride regularity.
d. Detrended fluctuation analysis (DFA) to generate fractal scaling indices
describing the structural variability of the spatiotemporal variables.
2. Determine the within and between day reliability of these variables generated by
these methods.
3. Establish proof of concept for these methods by perturbing gait using varied running
speeds.
4. Establish applicability by applying the analysis to gait before and after fatiguing
exercise.

3
1.3 Limitations and Delimitations
1.3.1 Limitations
Data collection was done during the fall season which consists of competitive games and
practices. The consistency of weather was hard to maintain. Likewise, instances of altitude,
surface, time, and athlete training status may change trial to trial. Injuries occurring in season,
pre-existing injuries, diet, well-being, and school or social stress cannot be controlled.
1.3.2 Assumptions
Weather conditions had negligible effect on change in gait variables. All players were
physically healthy and not suffering from acute or chronic injury.
1.3.3 Delimitations
Subjects were delimited to female collegiate soccer players (members of a Division I
NCAA team). Speed and acceleration data were generated the GPSports SPI HPU GPS and
accelerometric receivers that come with wearable vests and proprietary software package. The
location of the accelerometer was between the scapulae.
4
Chapter 2
Literature Review
2.1 Introduction
For years, researchers have studied the spatial and temporal patterns of the human gait.
More recently, interest in the variability and complexity of the gait pattern has increased. Tools
used to quantify gait are now being employed to analyze gait of various populations and under
various conditions. In short, changes in gait complexity seem to be associated with abnormal
gait that is often present in conditions of neuromuscular disease, injury and fatigue. The purpose
of this literature review is to summarize the current state of gait analysis and its application to the
understanding and identification of normal and pathological gait. The second goal of this
chapter is to lay the foundation for further characterizing gait in athletic populations.
2.2 Gait
2.2.1 Effects of Fatigue
A common side effect of training is muscle fatigue. While regular muscle fatigue is
necessary in creating advantageous muscle adaptations, fatigue alters the physiological
properties of the muscles in order to continue carrying out the exercise. This alteration in
physiological properties may make individuals more susceptible to injury. Fatigue decreases
muscle force and increases reflex loop times (More et al. 1993, Nelson and Hutton 1985,
Behrens et al. 2015, Yavuz et al. 2014) as well as reducing stretch reflex activity (Avela and
Komi 1998, Nicol et al. 1996). Avela and Komi (1998) found that exercise induced muscle
fatigue leads to a decrease in the excitability of the Ia afferent pathway. A consequence of this
afferent impairment, decreases muscle stiffness (Avela and Komi 1998). Furthermore Avela and

5
Komi (1998) showed a reduction in stretch reflex sensitivity and muscle stiffness after prolonged
stretch shortening cycles of exercise. Assessment of fatigue on coactivation of the quadriceps
was assessed by Nyland et al. (1997). They found that quadriceps femoris fatigue lead to “earlier
gastrocnemius activation and delayed vastus medialis, rectus femoris, and vastus lateralis
activation” (Nyland et al.1997). Quadriceps femoris fatigue showed earlier activation of the
gastrocnemius during the stance phase of running (Nyland et al. 1997). Delayed activation due to
fatigue is not unique to the muscles in the thigh. Sinkjaer et al. (1996) saw that the calf muscles
had low reflex stiffness which was attributed to the cocontraction of the dorsiflexors and plantar
flexors at the ankle joint. Clearly, when fatigue is introduced the muscular function deteriorates.
The deterioration of proper muscle function may lead to asymmetries in gait and could even lead
to injury.
2.2.2 Hamstring Injuries
A common location for injury during running related activities is the hamstring muscle
group. The hamstring muscle group coordinates the movements between the sacroiliac joint and
the patellofemoral joint. This group of muscles is composed of the biceps femoris, the
semitendinosus, and the semimembranosus. Two common hamstring related injuries are
hamstring strain and anterior cruciate ligament (ACL) tear.
Hamstring strains arise from explosive overloading of the hamstring muscle. The
majority of the activation of the hamstrings during gait is during late swing and initial stance
(Chumanov et al 2012, Daly et al. 2016, Duysens et al. 1998, Kuitunen et al. 2002, Kyrolainen et
al. 1999, Schache et al. 2009). The hamstrings are substantially loaded during both swing and
stance phases of running (Chumanov et al. 2011). Injuries normally arise during swing phase
because of the substantial loading pattern combined with an eccentric contraction (Chumanov et
6
al. 2011). During the swing phase the hamstrings are working to eccentrically extend the knee.
The eccentric contraction works to decrease the acceleration of the tibia as it extends forward.
At the patellofemoral joint the hamstrings work to both flex and rotate the knee. The hamstrings
work to eccentrically slow the acceleration of knee extension during the late swing phase in
order to initiate knee flexion (Schache et al. 2009, Chumanov et al. 2012, Daly et al. 2016). At
the sacroiliac joint, the hamstrings work to extend the hip during terminal swing (Schache et al.
2009). Furthermore EMG analysis during running has shown that the biceps femoris become
more active during periods of exercise engaging higher %VO2max (Camic et al. 2015).
Increasing activation at higher intensity puts the hamstrings at increased strain due to the load
they are trying to accommodate.
ACL tears are a common injury in team sports athletes which can be caused by hamstring
muscle deficiency. Though non-contact ACL injury is a multifactorial problem (Shultz et al.
2015), a risk factor is unbalanced hamstring to quadriceps strength ratios. Specifically, weak
hamstring muscles in comparison to quadriceps lead to increased risk of ACL injury. A
comparison of male and female thigh muscle characteristics done by Hannah et al. (2015)
showed that males had larger maximum and explosive voluntary force production of the
hamstring muscles when weight was normalized. The authors postulate that the hamstring
muscles of females may just be smaller than in males, and therefore risk of ACL injury is
increased in females. Biomechanical differences at the hip and knee (differences in joint angles)
as well as improper proprioceptive training increase risk of ACL injury in women (Shultz et al.
2015).
Furthermore Daly et al. (2016) found that previous injuries to the biceps femoris led to
the following running asymmetries in gait: increased anterior pelvic tilt, increased hip flexion,

7
and increased medial knee rotation. It has been shown that injury to the biceps femoris caused
an increase in activation of the ipsilateral erector spinae, gluteus maximus and external obliques,
and the contralateral rectus femoris (Daly et al. 2016). Monitoring gait in individuals susceptible
to hamstring related injuries may help in injury prevention.
2.2.3 Laterality
Assessment of foot dominance showed that there is a tendency for one foot to take on
movements involved with more neuromuscular control, while the other acts to stabilize the body
(Sadeghi et al. 2000). Sadeghi et al. (2000) assert that the dominant foot’s primary role is
forward progression whereas the nondominant foot acts to stabilize gait. This idea is seen in
how older individuals’ gait adapts over time. Nagano et al. (2011) found that older individuals
tend to have a higher step with their nondominant foot. This action is seen as a defensive
strategy against falling, allowing the dominant foot to help recover from the fall. If the dominant
foot does indeed have higher neuromuscular control, it would be advantageous to try to catch
oneself with the dominant leg during a fall. Interestingly, Echeverria et al. (2010) found that
limb dominance switches between steps. They conclude that foot dominance is not static, rather
dynamic during running. In addition to the fluid limb dominance seen during running, fatigue
appears to have no significant interaction between the dominant and non-dominant leg with
respect to joint kinetics (Brown et al. 2014). Therefore, while it appears that the dominant foot
plays a bigger role in movements utilizing neuromuscular specialization, foot dominance was
seen to switch during running (from step to step) and to not show significant differences in knee,
hip, or ankle kinetics and kinematics during running.

8
2.3 Accelerometry and Gait Analysis
2.3.1 Accelerometers
Accelerometers are a noninvasive technology useful in estimating gait metrics.
Accelerometers are inertial sensor units that estimate accelerations. Tri-axial accelerometers
estimate accelerations in three axes: vertical, anteroposterior, and mediolateral. Advances in
technology have made accelerometers cheap and convenient for field work due to their being
small and easily attachable to the body without causing physiological hindrances. Popular
locations for accelerometers are on the L3 spinous process of the back, and between the
scapulae. They are placed on the body by a range of methods including adhesives, pouches, and
specialized vests. Placing the accelerometer on the trunk while convenient leads to dampened
acceleration signals. However, despite the dampening effect of trunk-mounted accelerometers,
their validity has been shown to be good (Del Din et al. 2016). Researchers have found that
accelerometers show good to excellent agreement in measuring gait variables when compared to
motion capture systems (Byun et al. 2016, Hartmann et al. 2009, Cole et al. 2014).
Of interest to trainers is the pattern of an athlete’s stride or gait. When players are
injured and/or fatigued, gait characteristics can change. For example, an injured player
who may “limp” on one leg will show gait differences between the right and left limb –
gait imbalance or asymmetry. Also, fatigue may cause change in the timing of the gait
such as prolonged ground contact time with one or both feet as well as alterations in
stride length.
To analyze gait, raw signals are obtained from the accelerometer such as the
GPSports SPI HPU units. This device yields accelerations along three axes as well as a
9
resultant. In addition, jerk or the rate of change in acceleration can be computed (jerk is often
used as a measure of “body load”).
Superoinferior Axis z-axis or vertical (V)
Mediolateral Axis x-axis or mediolateral (ML)
Anteroposterior Axis y-axis or anteroposterior (AP)
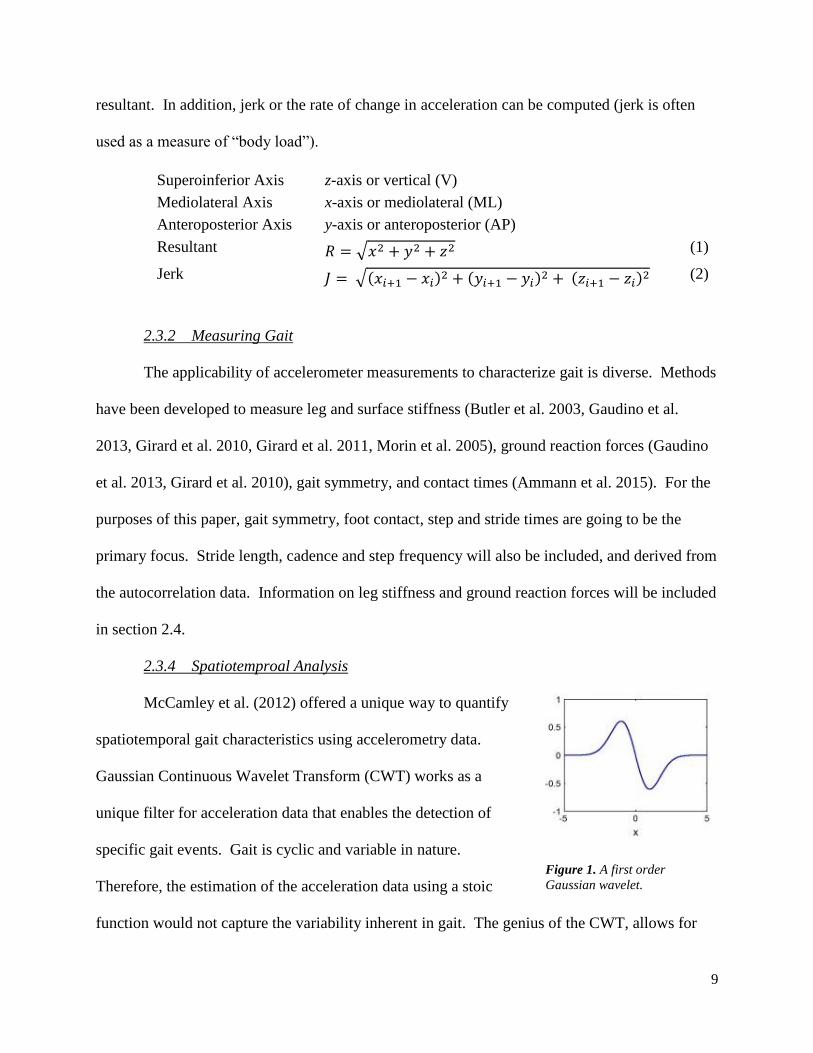
Resultant 𝑅 = √𝑥2 + 𝑦2 + 𝑧2 (1)
Jerk 𝐽 = √(𝑥𝑖+1 − 𝑥𝑖)2 + (𝑦𝑖+1 − 𝑦𝑖)2 + (𝑧𝑖+1 − 𝑧𝑖)2 (2)
2.3.2 Measuring Gait
The applicability of accelerometer measurements to characterize gait is diverse. Methods
have been developed to measure leg and surface stiffness (Butler et al. 2003, Gaudino et al.
2013, Girard et al. 2010, Girard et al. 2011, Morin et al. 2005), ground reaction forces (Gaudino
et al. 2013, Girard et al. 2010), gait symmetry, and contact times (Ammann et al. 2015). For the
purposes of this paper, gait symmetry, foot contact, step and stride times are going to be the
primary focus. Stride length, cadence and step frequency will also be included, and derived from
the autocorrelation data. Information on leg stiffness and ground reaction forces will be included
in section 2.4.
2.3.4 Spatiotemproal Analysis
McCamley et al. (2012) offered a unique way to quantify
spatiotemporal gait characteristics using accelerometry data.
Gaussian Continuous Wavelet Transform (CWT) works as a
unique filter for acceleration data that enables the detection of
specific gait events. Gait is cyclic and variable in nature.
Therefore, the estimation of the acceleration data using a stoic
function would not capture the variability inherent in gait. The genius of the CWT, allows for
Figure 1. A first order
Gaussian wavelet.

10
each individual step to be fitted to a wavelet (Figure 1), which allows for the variability in gait
metrics. This wavelet consists of a single, alternating positive and negative deflections. This is
similar to the tri-axial acceleration patterns seen during running as well as vertical acceleration.
The first step in the transform, is to integrate the raw acceleration data to velocity, and
then differentiate it using the CWT to get a smoothed acceleration signal. The minima of the
new signal represent initial contact (IC) times (McCamley et al. 2012, Godfrey et al. 2015, Del
Din et al. 2016.). Further differentiation using the CWT gives the jerk function. The maxima of
the jerk function are representative of the final contact (FC) times or toe off (McCamley et al.
2012, Godfrey et al. 2015, Del Din et al. 2016). It is important to note that this process has been
demonstrated using the raw accelerations from the vertical axis and not the other axes
(mediolateral, anteroposterior).
Figure 2. Example of how CWT can be used to calculate contact times. The black line represents the raw
vertical acceleration data. The red line represents the first differentiation using the CWT, and the blue line is the
second differentiation of the CWT. The minima of the dashed line represents the initial contact period, and the
maxima of the dotted line represent the final contact period. The time between the minima of the dashed line and
the maxima of the dotted line is the contact time.
6 6.2 6.4 6.6 6.8 7 7.2 7.4 7.6 7.8 8
Time (sec)
-15
-10
-5
0
5
10
Acce
lera
tion (
m/s
2)
Initial Contact -Foot StrikePeak negative Accelerations
Final Contact -Toe OffPeak Positive Acceleration Rate (Jerk)
Contact Time
Step Time
— Raw Z Acceleration— Gaussian CWT (Transformed Acceleration)— Transformed Acceleration Rate (Jerk)
Stride Time

11
The difference between adjacent IC and FC times represent the contact time (CT). The
difference between adjacent initial contacts represent step time StpT while the difference
between “every other” IC is the stride time (StrT) (see Figure 2).
Contact Time (s) CT = FCi - ICi (3)
Step Time (s) StpT = ICi+1 – ICi (4)
Stride Time (s) StrT = ICi+2 - ICi (5)
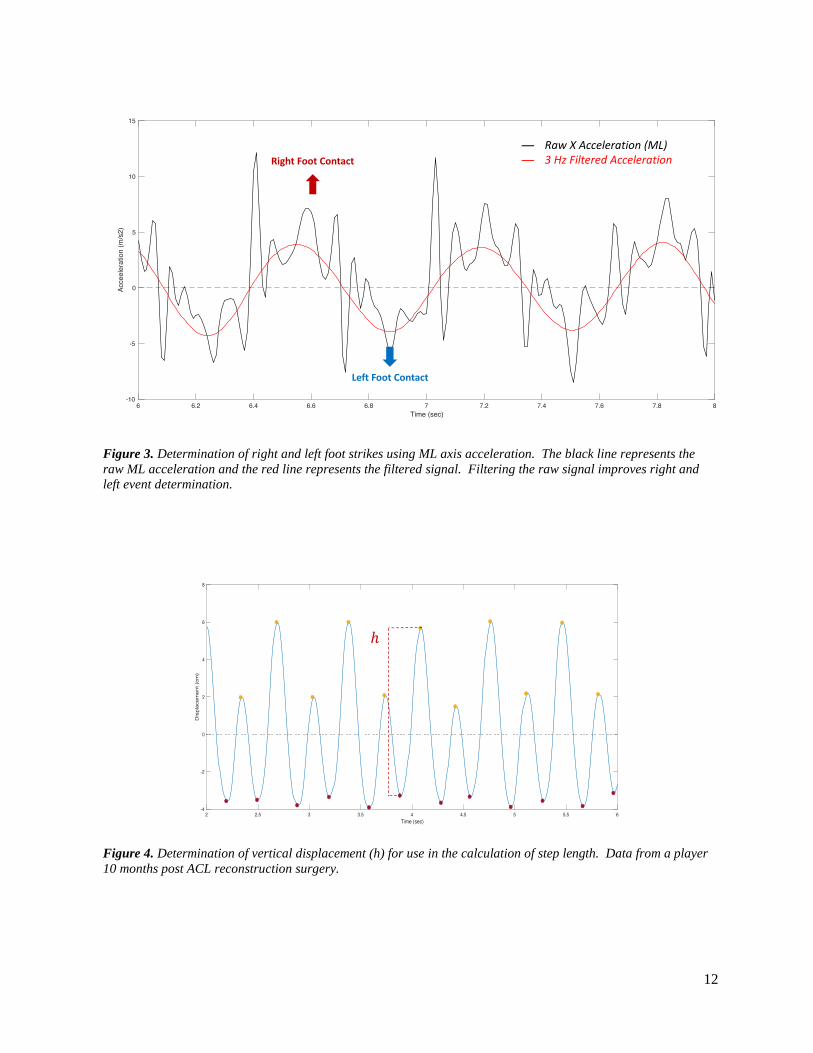
Zijlstra and Hof (2003) demonstrated a convenient way to delineate the left from right
foot contacts. During stance, the center of mass accelerates to the left when stepping with the
right leg, and vice versa. Therefore, in reference to the mediolateral accelerations, positive
accelerations correspond to right foot step, and negative accelerations correspond to left foot step
(Zijlstra and Hof, 2003) (see Figure 3). Once right and left steps are identified, right and left foot
contact times can be identified. In addition, R L and L R step times as well as R R and
L L stride times can be determined. By identifying right and left limb values, difference
values can be calculated. For example, CT difference is calculated as:
Difference (%) = 200 ⋅𝐶𝑇𝑅− 𝐶𝑇𝐿
(𝐶𝑇𝑅+ 𝐶𝑇𝐿) (6)
Traditionally, step and stride length (StpL, StrL) have been calculated using vertical
displacement (double integration of the z-axis acceleration signal) (Figure 4) and an inverted
pendulum model (Zijlstra & Hoff, 2003). The following equation is then applied to determine
step length (StpL),
Step Length (m) 𝑆𝑡𝑝𝐿 = 2 √(2𝑙ℎ − ℎ2) (7)
where l = height of the unit and h = vertical displacement of the unit. As before,
mediolateral accelerations can be used to determine right and left step lengths.
12
Figure 3. Determination of right and left foot strikes using ML axis acceleration. The black line represents the
raw ML acceleration and the red line represents the filtered signal. Filtering the raw signal improves right and
left event determination.
Figure 4. Determination of vertical displacement (h) for use in the calculation of step length. Data from a player
10 months post ACL reconstruction surgery.

13
Double integration of the acceleration signal can be affected by signal noise and drift as
well as movement artifact. This requires bandpass filtering of the raw and integrated signals. As
a result, vertical displacement values can be less reliable than anticipated. Alternitavely, using
the GPS derived velocity signals obtained from the units coupled with StpT and StrT, StpL and
StrL can be computed as:
Step Length (m) 𝑆𝑡𝑝𝐿 = 𝑆𝑡𝑝𝑇 ⋅ 𝑣 ̅𝑆𝑡𝑝 (8)
Stride Length (m) 𝑆𝑡𝑟𝐿 = 𝑆𝑡𝑟𝑇 ⋅ �̅�𝑆𝑡𝑟 (9)
where �̅�𝑆𝑡𝑝 and �̅�𝑆𝑡𝑟 are the average velocities during the corresponding step and stride,
respectively.
2.3.3 Autocorrelation and Gait Regularity
Auto and cross correlation as a statistical comparison method has become more popular
within the exercise physiology field. Its effectiveness has been demonstrated in both evaluating
gate and cardiorespiratory kinetics (Gouwanda et al. 2011, Nelson-Wong et al. 2009, Koschate et
al. 2016, Hoffmann et al. 2013, Drescher et al. 2016). Autocorrelation takes periodic data sets,
shifts adjacent periods back to match the time of the first period in order to correlate consecutive
periods to the first period. For example, a common autocorrelation is taking accelerometry data
and comparing foot strike accelerations. The first foot strike is compared to the second, third,
fourth, etc. Each comparison corresponds with a lag that is equal to the amount of time between
each shift. The comparison at each time shift produces an autocorrelation coefficient. The
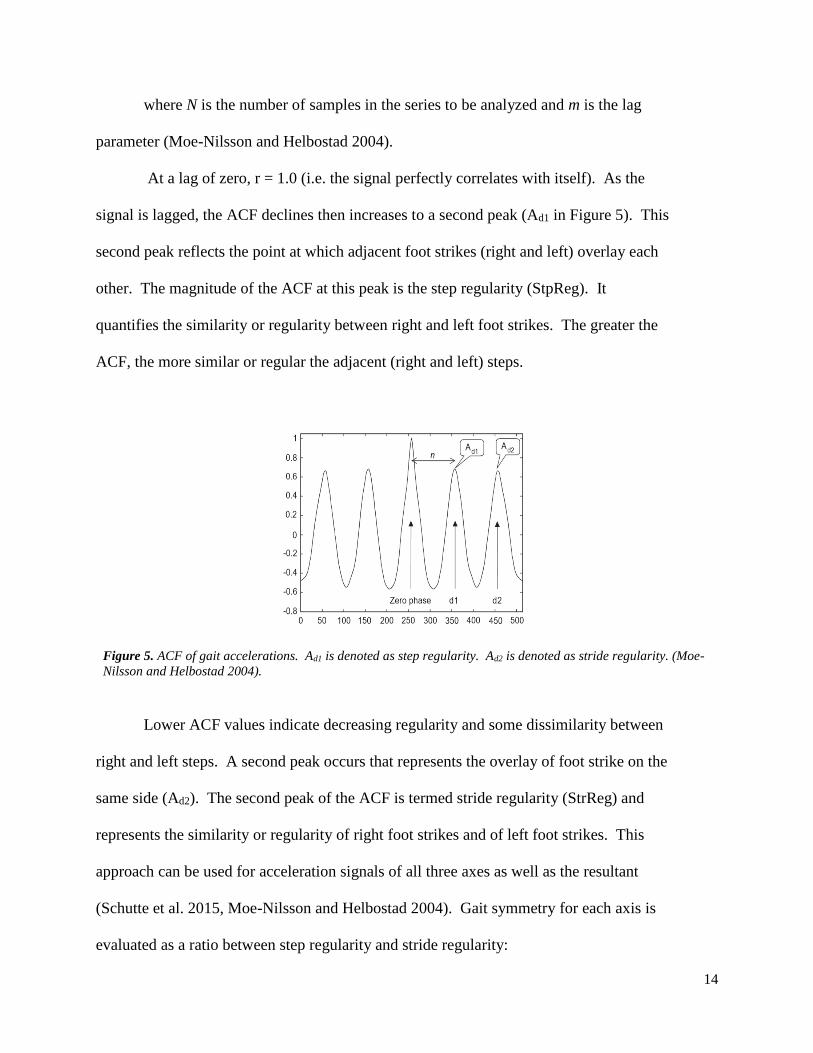
coefficients are used in order to create a new autocorrelation function (ACF) (Figure 5). To
compute the ACF, the following equation is used,
𝐴𝐶𝐹 = 1
𝑁−|𝑚| ∑ 𝑥𝑖𝑥𝑖+𝑚
𝑁−|𝑚|𝑖=1 (10)
14
where N is the number of samples in the series to be analyzed and m is the lag
parameter (Moe-Nilsson and Helbostad 2004).
At a lag of zero, r = 1.0 (i.e. the signal perfectly correlates with itself). As the
signal is lagged, the ACF declines then increases to a second peak (Ad1 in Figure 5). This
second peak reflects the point at which adjacent foot strikes (right and left) overlay each
other. The magnitude of the ACF at this peak is the step regularity (StpReg). It
quantifies the similarity or regularity between right and left foot strikes. The greater the
ACF, the more similar or regular the adjacent (right and left) steps.
Figure 5. ACF of gait accelerations. Ad1 is denoted as step regularity. Ad2 is denoted as stride regularity. (Moe-
Nilsson and Helbostad 2004).
Lower ACF values indicate decreasing regularity and some dissimilarity between
right and left steps. A second peak occurs that represents the overlay of foot strike on the
same side (Ad2). The second peak of the ACF is termed stride regularity (StrReg) and
represents the similarity or regularity of right foot strikes and of left foot strikes. This
approach can be used for acceleration signals of all three axes as well as the resultant
(Schutte et al. 2015, Moe-Nilsson and Helbostad 2004). Gait symmetry for each axis is
evaluated as a ratio between step regularity and stride regularity:

15
x-axis Symmetry (%) 𝑋𝑆𝑦𝑚𝑚 = 200 ⋅ |𝑆𝑡𝑝𝑅𝑒𝑔 − 𝑆𝑡𝑟𝑅𝑒𝑔|
𝑆𝑡𝑒𝑝𝑅𝑒𝑔 + 𝑆𝑡𝑟𝑅𝑒𝑔 (11)
where StpReg and StrReg represent the ACF coefficients in the same period (Kobsar et al. 2015).
The closer the number to zero, the better the gait symmetry (Kobsar et al. 2015). Stride length
(l) and cadence ( c) were derived from the autocorrelation data using equations developed by
Moe-Nilsson and Helbostad (2004).
Stride Cadence (strides per min) 𝑐 = 60 ⋅ 𝑓
𝑛
(12)
Stride Length (m) 𝑙 = 𝑣
𝑓
(13)
where f is the sampling frequency (Hz), n is the number of samples per dominant period
(dominant period is the periodicity of the ACF also known as lag), and v is the running velocity
in m/s (Moe-Nilsson and Helbostad 2004).
2.3.5 Detrended Fluctuation Analysis
While early work focused on the extent or amount of variability one displays during
walking and running, more recent efforts emphasize the importance of addressing the structure of
variability (Harbourne & Stergiou, 2009; Decker et al., 2010). For example, in healthy
individuals, the variability in step or stride interval during a walking or running task is not
random but contains underlying structure, incorporating long-range correlations. Several
analytical tools are available to assess the non-linear dynamics of gait (Decker et al., 2010).
Detrended fluctuation analysis (DFA) evaluates long-term correlations within a time series and
has been applied to the study of gait complexity (Peng et al., 1995; Hausdorff et al., 1995; 1996).
DFA is an adapted root mean square analysis of a “random walk” that generates a self-similarity
16
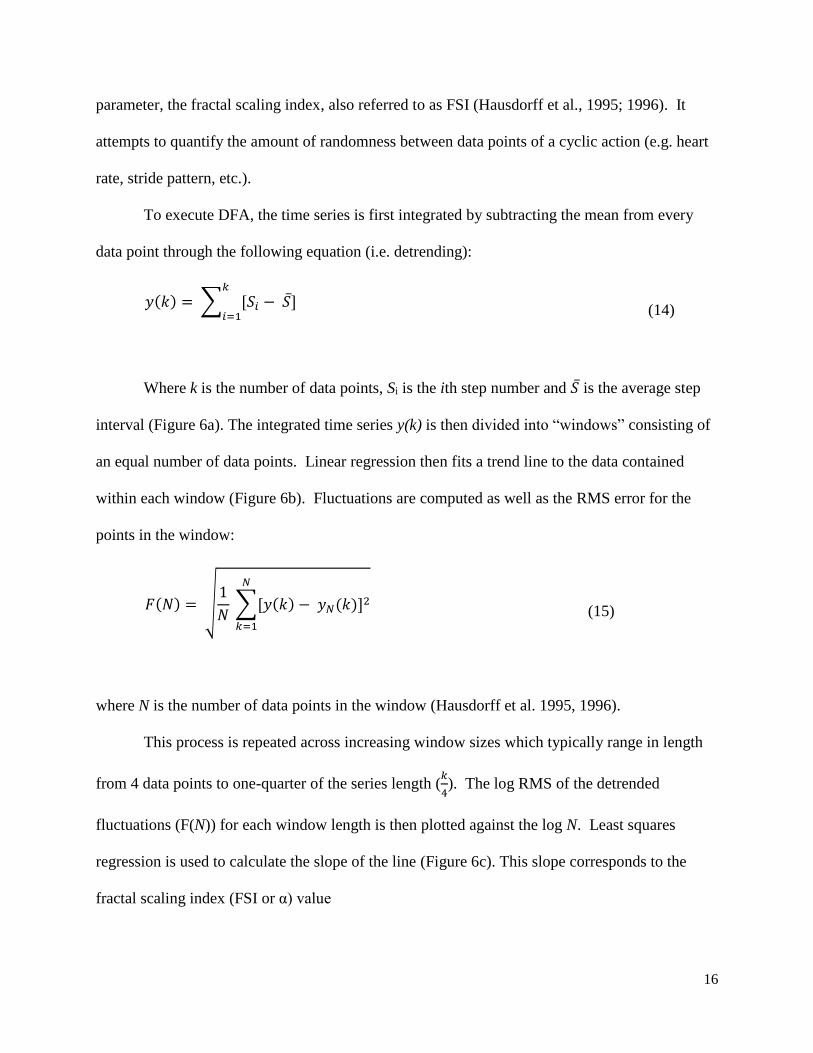
parameter, the fractal scaling index, also referred to as FSI (Hausdorff et al., 1995; 1996). It
attempts to quantify the amount of randomness between data points of a cyclic action (e.g. heart
rate, stride pattern, etc.).
To execute DFA, the time series is first integrated by subtracting the mean from every
data point through the following equation (i.e. detrending):
𝑦(𝑘) = ∑ [𝑆𝑖 − 𝑆̅]𝑘
𝑖=1
(14)
Where k is the number of data points, Si is the ith step number and 𝑆̅ is the average step
interval (Figure 6a). The integrated time series y(k) is then divided into “windows” consisting of
an equal number of data points. Linear regression then fits a trend line to the data contained
within each window (Figure 6b). Fluctuations are computed as well as the RMS error for the
points in the window:
𝐹(𝑁) = √1
𝑁 ∑[𝑦(𝑘) − 𝑦𝑁(𝑘)]2
𝑁
𝑘=1
(15)
where N is the number of data points in the window (Hausdorff et al. 1995, 1996).
This process is repeated across increasing window sizes which typically range in length
from 4 data points to one-quarter of the series length (𝑘
4). The log RMS of the detrended
fluctuations (F(N)) for each window length is then plotted against the log N. Least squares
regression is used to calculate the slope of the line (Figure 6c). This slope corresponds to the
fractal scaling index (FSI or α) value

17
FSI values of 0.5 represent random variability whereas values between 0.5 and 1.0
indicate the presence of persistent long-range correlations. Thus, FSI values above 0.5 indicate
gait variability that is structured rather than random over time (Decker et al., 2010; Hausdorff et
al., 1995). This procedure is often verified by randomly shuffling the time series data then
recalculating α. Shuffling the data will retain the mean values and underlying variability (i.e.
standard deviation). However, any long-term correlations or structural pattern is destroyed.
Using this approach, α-values will approach 0.5.
FSI values increase during maturation (Hausdorff et al., 1999) and decline with aging
(Hausdorff et al., 2001) and with certain neurodegenerative diseases (Hausdorff et al., 2009). In
addition, low back pain (Newell & van der Laan, 2010), fatigue (Meardon et al., 2011), injury
(Meardon et al., 2011) and overtraining (Fuller et al., 2017) are associated with reduced FSI.
However, physical training increases gait structure (Nakayama et al., 2010; Gow et al., 2017).
Based on these results, Decker et al., (2010) suggest that a decline in the FSI value towards 0.5
represents a decrease in gait complexity and structure. This in turn, reflects a decline in motor
control and progression towards an “unhealthy” gait (Decker et al., 2010).
18
Figure 6. Detrended fluctuation analysis (taken from Rhea and Kiefer, 2014). Panel a) shows the raw,
detrended time series data. Panel b) shows the time series partitioned into two different window sizes. Also, a
line if fit through the data within the window. The distance of each points from the line represents the
“fluctuation”. Panel c) shows the log-log plot of the average RMS error within each window versus the window
size. The slope of this relationship represents the FSI or α.

19
2.3.6 Ground Reaction Forces
GPSports fitness monitors have been used in many team sports to estimate innumerable
physiologic variables during performance (Buchheit et al. 2015, Gaudino et al. 2013, Higham et
al. 2016, Wellman et al. 2016, Scott et al. 2015). As such the reliability and validity of these
fitness devices have been under intense scrutiny, yielding promising results (Buchheit et al.
2015, Scott et al. 2015, Gaudino et al. 2013, Waldron et al. 2011). Gaudino et al. (2013) were
able to demonstrate high validity and reliability in the GPSports software to serve as an estimate
of ground reaction forces. They used flight time and contact time of the foot to estimate the
maximum force experienced by the foot or the max ground reaction force (Gaudino et al. 2013).
Their primary purpose was to account for the characteristics of the surface and how that would
affect the ground reaction forces experienced by the athletes. In doing so they were able to relate
the maximum ground reaction forces to leg stiffness and the vertical change of the center of mass
(Eq 5-8). The calculations for leg stiffness were developed by Morin et al. (2005), but adapted
by Gaudino et al. (2013). Morin et al. (2005) derived the following equations in an effort to find
an alternative to measuring ground reaction forces with a force plate:
Total Spring Constant Ktot= Fpeak/∆ytot (16)
Peak force (N) Fpeak = 𝑚𝑔𝜋
2∗ (
𝐹𝑇
𝐶𝑇+ 1) (17)
Vertical Displacement (m) ∆ytot= Fpeak*CT2/(m*π2) + g* CT2/8 (18)
Gaudino et al. (2013) observed the legs and the running surface as springs in series which results
in the following relationship:
Total Spring Constant ktot = (kleg-1 +ksurf
-1)-1 (19)
Gaudino et al. (2013) was looking at the difference in running surface and how that
would affect the ground reaction forces experience by the foot during foot strike. Cormack et al.

20
(2013) used a similar approach to measure leg fatigue during a jumping test by measuring the
ratio of flight time to contact time in Australian football players. It would not make sense to
apply this ratio to a running test, however using the same group of equations, the GPSports
technology should be able to detect a decrease in leg stiffness represented by the value kleg in the
equation 19.
2.4 Alterations in Gait
2.4.1 Gait Analysis in Clinical Populations
The majority of gait analysis has been done with clinical purpose. Gait analysis has been
assessed of patients with osteoarthritis (Barden et al. 2016, Barrois et al. 2016, Hodt-Billington et
al. 2012, Staab et al. 2014), amputees (Iosa et al. 2014, Tura et al. 2010), joint arthroplasty (Rapp
et al. 2015, Calliess et al. 2014), hemiparesis (Saremi et al. 2006), ageing (Auvinet et al. 2002,
Valenti et al. 2015), Parkinson’s disease (Demonceau et al. 2015, Yogev et al. 2007), stroke
(Sanchez et al. 2015), and previous lower leg injuries (Setuain et al. 2017, Zifchock et al. 2008,
Zifchock et al. 2006),
Tura et al. (2010) examined the usefulness of inertial sensors in maintaining proper use of
prostheses in transfemoral amputees. The accelerometer was placed on the thorax, and
autocorrelation analysis was used to determine step and stride regularity. Tura et al. determined
that the accelerometers could detect differences in step and stride symmetry in a rectilinear path
with 15 and 20 steps respectively.
Barden et al. (2016) examined gait variables in older adults with bilateral knee
osteoarthritis. Using autocorrelation, the authors were able to detect a significant difference in

21
step regularity in the vertical and anteroposterior directions, whereas the same was not found
with stride regularity.
Yang et al. (2011) analyzed gait in a population with complex regional pain syndrome
(CRPS). The accelerometer was place on the lower back and autocorrelation analysis was used
to assess step and stride symmetry. Participants went through a short physical performance
battery (SPPB) which is used to measure lower limb function. The authors found that in the
vertical direction, accelerations had the same magnitude as the controls, which is contrary to the
decreased magnitudes in accelerations in the mediolateral and anteroposterior axes for the CRPS
group. The accelerometer was sufficient in detecting differences in the control and the CRPS
group.
Trojaniello et al. (2015) observed the gait of hemiparetic, elderly, Huntington’s, and
Parkinson’s patients using accelerometers mounted on the lower back. In doing so they were
attempting to validate the ability of the accelerations to detect different gait events using
specified methods against a motion capture system. The first method was smoothing the
acceleration data in order to detect gait events using both calculus and physics properties of the
acceleration curve. The second method is a filtered integration of the acceleration data and the
third method used Gaussian continuous wavelet transform which was referenced earlier. The
results showed that the accelerometer could accurately detect gait events in the healthy elderly
population. However, using the methods of gait event detection described above, the researchers
noted that the presence of a pathological gait hinders the reliability and accuracy of the methods.
Hausdorff et al. (1997; 1999) found that the FSI, α, was greater in young adults compared
to the elderly. Hausdorff and colleagues (for review see Hausdorff, 2007) have also studied the
fractal scaling index in healthy individuals and those with neuromuscular disorders. They found
22
that patients with Huntington’s and Parkinson’s diseases showed lower α values than healthy
individuals (Hausdorff et al. 1997; 1998; 2001; 2003). Healthy individuals showed α ~ 0.7
whereas the patient’s values were closer to 0.5, indicating greater randomness in their gait
variability. This has been attributed to possible degeneration of the central motor system,
altering the control of rhythmic movement (Ducharme & van Emmerik, 2018). Several groups
have also shown that declines in α in the elderly and patients with neurodegenerative disorders
are associated with a “cautious gait” and increased risk of falling (Herman et al., 2005;
Hausdorff et al., 2001).
Interestingly, peripheral neuropathies do not impact α to nearly the same extent as do
diseases of the central nervous system. Gates et al., (2007) and Richardson et al. (2004) found
that patients with diabetic neuropathy as well as other general neuropathies maintained α near
0.85, values that compared closely to healthy controls. Despite changes in proprioception and
increased stride to stride variability, these patients maintained gait complexity. This has lead
these researchers to conclude that control of gait complexity and long-range correlations in stride
to stride variability reside within the supra-spinal control regions of the nervous system.
A further test of this central control of the fractal-like structure of gait was performed by
Hausdorff et al., (1996). Researchers had subjects freely walk at their self-selected pace. They
were also asked to walk at that pace while coordinating gait to a metronome. This later trial
resulted in the breakdown of the long-range correlations and reduced α. Thus when the control
of the central nervous system is perturbed, individuals take on a more randomly structured gait.
2.4.2 Gait Analysis in Walking
The usefulness of accelerometric analysis of gait has been studied in walkers. Byun et al.
(2016) set out to test the test-retest reliability and validity of an accelerometer to measure

23
spatiotemporal gait parameters. The test was done in older healthy adults. Contact times were
measured using the raw acceleration data, interpolating it and then resampling it at 100 Hz (was
originally 32 Hz). The contact time was then observed as the time between the two troughs of
the interpolated resampled acceleration data. Test-retest reliability was assessed by computing
intraclass correlation coefficients between the second and third walking trials. Four steps were
required to obtain most gait measurements with great reliability. Step time needed 26 steps to
obtain great reliability. Further, the most reliable results came from gait parameters derived from
the vertical axis. The validity of the accelerometer findings were compared with the data
computed by a GAITRite system. In terms of validity, the accelerometer had great levels of
agreement in the vertical and anteroposterior axes. The mediolateral axis showed poor
agreement with the GAITRite data.
Helbostad et al. (2007) observed the effects of fatigue on gait parameters in elderly
subjects. A fatiguing protocol was performed and then a walking test to observe gait. The
accelerometer was placed on the lumbar vertebrae and autocorrelation was used for gait analysis.
The fatigue group had increases in variability in the anteroposterior and the vertical directions
and decreased variability in the mediolateral direction.
Wundersitz et al. (2015) observed recreationally active individuals walking, running, and
jogging on an instrumented treadmill to determine the validity of using an accelerometer. The
researchers were interested in measuring peak acceleration. They found that while walking, the
accelerometers provided the most agreeable data to the instrumented treadmill. As speed
increased, agreement and validity decreased. It was postulated by the researchers that the
increase in speed creates a more unstable environment for the accelerometer unit, thereby
increasing the noise experienced by the unit.
24
Auvinet et al. (2002) set out to learn about the progression of gait through the human
lifespan. They found that vertical acceleration was greater in men at heel contact, mid-stance,
and at initial push-off. The only metrics that declined with age was impulse, speed and stride
length. Stride length was longer in men, even when height was accounted for.
Another study by McGrath et al. looked into determining the reliability of the
accelerometer to detect heel strike and toe off using different methods they found in the
literature. Walking tests showed excellent agreement in stride time, whereas running yielded
moderate agreement. Stride time was the most reliable metric across all variables and methods
of calculation.
Jordan et al., (2007, 2008) showed that fractal scaling of the walking gait is altered by
speed. They found that a preferred or self-selected pace, α-values were minimized. Increasing
or decreasing speed increased the FSI values. Interestingly, this does not seem to be the case
with running (Nakayama et al., 2010). Jordan et al. (2007, 2008) suggested that at a preferred
speed, any given stride is less constrained by those that preceded it and more readily adaptable
that when subjects are forced to walk at sub-optimal speeds.
2.4.3 Gait Analysis in Running
Running gait has also been assessed, however not as extensively. Analysis has been used
extensively in clinical settings, but not in field settings. Ammann et al. (2015) observed the
change in ground contact times (CT) during a 5 km time trial in elite runners. CT differed
between the right and the left foot, with the left foot having a significantly longer CT.
Interestingly, CT did not change appreciably during the 5 km time trial. The time trial was
performed on a 400 meter track surface and 200 meter segments were observed for analysis.
Another study by Gilman-Ammann et al. (2017) measured gait symmetry in terms of ground CT
25
in previously injured vs. uninjured runners. They found that shorter running distances led to
quicker CT and greater asymmetries. CT did not change appreciably throughout the intervals.
For the uninjured group, no difference in CT between the dominant and non-dominant leg were
observed. In the previously injured group the CT were significantly longer on the injured side.
Furthermore, CT were seen to decrease after a fatiguing hopping protocol (Mudie et al.
2016) and after a long-distance race (Willems et al. 2012). However, Garcia-Perez (2013) found
that CT were not changed due to fatigue. What they did find that was interesting was that fatigue
decreased stride frequency and increased stride length. Furthermore, it was seen that CT were
greater on a treadmill than during overground running (Garcia-Perez et al. 2013).
Schutte et al. (2015) observed the different effects that running surface had on
accelerometry signals. Their experiment tested three surfaces: asphalt, a synthetic track, and
wood chips. No significant differences in acceleration signals were found between the asphalt
and synthetic track however, the wood chip trials had surprising results. Wood chip running led
to a decrease in step frequency, step regularity in the anteroposterior and mediolateral axes, the
RMS ratio in the vertical axis, and the anteroposterior step entropy. Schutte et al. (2016 Surface)
later released a paper performing the exact experiment a second time, this time with slightly
different outcome measures. They found that between the synthetic track and the concrete,
synthetic track had higher vertical stride regularity. Again woodchip running showed significant
differences in gait metrics. Woodchip running led to lower step frequency, lower vertical RMS,
higher anteroposterior RMS, and lower step and stride regularity in the mediolateral direction.
Furthermore woodchip running decreased the impact force of landing and decreased
anteroposterior braking accelerations which the authors hypothesize could lead to differences in
performance and injury risk between surfaces.
26
Patterson et al. (2011) did a case study on a recreational distance runner testing the
effects of fatigue on gait dynamics. An accelerometer paired with a motion capture system were
used to measure gait kinematics and kinetics. The fatiguing protocol on a treadmill began with a
10 minute warmup at an easy pace, and then ran 5 minutes at faster than 10k pace, and then did
5x45 second pickups with a minute rest between intervals and then a cooldown. The researchers
found that as early as his second rep (of the five) the runner’s gait mechanics were starting to
breakdown. The author’s did not comment on the validity of the accelerometer data in
comparison to the motion capture system, but rather combined the data together to pinpoint
accelerometric gait events with different stages of running.
Girard et al. (2010) attempted to measure ground reaction forces, vertical stiffness, and
leg stiffness using a similar method to that proposed above by Gaudino et al. (2013) but was
originally derived by Butler et al. (2003) (the difference between the two methods, is that
Gaudino et al. (2013) observe the leg during stance as a spring in series with the ground, whereas
Butler et al. (2003) and Girard et al. (2010) observed the leg during stance as a single spring
acting against the ground). Girard et al. (2010) showed that leg stiffness remained constant
during a fatiguing exercise protocol. The researchers also concluded that contact time was
inversely related to aerobic capacity. This data is consistent with conclusions drawn from other
studies testing the effect of fatigue on leg stiffness (De Ste Croix et al. 201x, Hunter and Smith
2007, Oliver et al. 2014).
On the other hand, there have been studies showing contrary data to the above point
(Girard et al. 2011, Lehnert et al. 2017, Fourchet et al. 2015). The above study by Girard et al.
(2010) was done during a 5k run on a 200 meter indoor track. In 2011, Girard et al. released a
paper assessing fatigue on leg stiffness using a sprinting protocol. What they found was that as

27
speed increased, kleg decreased, which lead to shorter contact times, longer stride lengths and
smaller stride frequencies (Girard et al. 2011). Furthermore, population bias may be present in
the data. Multiple studies were done in adolescents (De Ste Croix et al. 201x, Fourchet et al.
2015, Lehnert et al. 2017, Oliver et al. 2014) while others were less in mature populations
(Girard et al. 2010, Girard et al. 2011, Hunter and Smith 2007). Clearly there is some
uncertainty in the role of fatigue on effecting the kleg during exercise.
Running exercise can lead to the development of fatigue. Fatigue is a complex process
that is dependent on the volume and intensity of activity as well as the fitness status of the
individual. It also involves alterations in both the central and peripheral nervous systems as well
as within the muscle fiber. There are few studies using DFA to understand the fatigue process.
Meardon et al., (2011) found that during a prolonged run, α-values decreased. This was the case
in healthy, non-injured runners as well as those with previous injury. Bellenger et al. (2018) and
Fuller et al. (2017) showed that a period of overtraining in trained runners resulted in reduced
fractal scaling of running gait. Further, subjective measures of fatigue, exhaustion and lethargy
were correlated to the degree of change in α. While the effects of fatigue on gait complexity is
poorly understood, the perceptual data presented in the latter two studies suggest a role for the
central nervous system. It is possible that muscular pain or discomfort, increased perception of
effort or staleness associated with short- and/or long-term fatigue may alter gait structure.
Accordingly, Newell and van der Laan (2010) showed that the gait variability of patients with
chronic low back pain was less than their healthy counterparts (i.e. lower α). A preliminary
report (Roberts 2004) suggests that this can be resolved by using analgesia treatments. However,
further work is clearly warranted before such ideas can be confirmed.
28
2.5 Conclusions
Fatigue decreases the integrity of musculature and reflexes which makes the muscle more
susceptible to injury. If the muscles of the legs are losing integrity, then it would stand to reason
that fatigue would alter gait mechanics (Patterson et al. 2008). Futher, the central nervous
system plays an important role in the development of fatigue (Maclaren et al., 1989; Carroll et
al., 2016). Monitoring gait metrics during fatiguing exercise bouts may have a protective effect
on athletes. Observing gait variables may be able to alert researchers, coaches, and players to
susceptibility to injury due to fatigue.
Autocorrelation has been used extensively in clinical populations to evaluate walking
gait. Little research has been done using autocorrelation analysis in healthy, athletic populations
in the field, particularly while running. The ease in which accelerometers can be worn on masses
of athletes is incredibly useful for data collection. Accelerometers make it possible for data
recording during athletic competition and practices. In fact, a lot of collected accelerometric data
is paired with GPS technology to determine training loads in rugby, soccer, and Australian Rules
Football athletes. As stated before, the presence of fatigue may deteriorate normal running gait
(Patterson et al. 2008). Another method of measuring gait deterioration is assessing changes in
contact times (Ammann et al. 2015). As the muscles fatigue, muscle stiffness decreases (Avel
and Komi 1998). If the spring constant of the leg is decreasing, then there would be less elastic
energy for the leg to use to continue the cyclic motion of running. As a result contact times are
expected to decrease.
The intent of collecting and manipulating this data is so that players and coaches have an
extra tool that can help strategize training to more effectively condition athletes. Overworking a
tired athlete will result in injury, over training, and poor performance. Our goal is to take some

29
of the guess work out of producing training plans in order to more efficiently cater to the needs
of athletes.

30
Chapter 3
Methods
3.1 GPSports SPI HPU Units
Player movements (accelerations, running distances, speeds, etc) and heart rates were
recorded non-invasively using a GPSports SPI HPU unit and Polar heart rate monitor (or strap).
Each unit was assigned a number and the numbers were assigned to each players randomly
generated identification number. The units contain a 15 Hz GPS receiver and a 100Hz, 16g
accelerometer. They record positional data at 5 Hz which is then supplemented or augmented by
accelerometer data to record interpolated position at 15 Hz. The triaxial accelerometer
orientation is determined by a 50 Hz magnetometer (used to orient the axes of the
accelerometer). Each unit measures 74mm x 42mm x 16mm and weighs 56g. The units also
communicate with a Polar T31 coded heart rate monitor/transmitter (15Hz determination of heart
rate).
During training sessions, subjects were asked to wear the units and heart rate straps. The
units were secured on the back, between the scapulae, using a custom designed vest (similar to a
women’s sports bra). Heart rate monitors were also secured to the vests and situated on the front
of the thorax, just below the sternum. Signals from the units are transmitted in real time to a
receiver located adjacent to the playing field using two-way wireless encryption and
manufacturer’s software (GPSport RealTime). Following each session, data stored on the units
were downloaded onto a laptop computer, stored on a secured hard-drive and analyzed off-line.

31
Data were initially analyzed off-line using manufacturer’s software (GPSports,
TeamAMS). Each subject’s data (heart rate, accelerometer and GPS) will be split into segments
corresponding to various drills and activities.
3.2 Analytic Procedures
3.2.1 Signal Preprocessing
For the spatiotemporal measurements, the method of McCamley et al. (2012) and
Godfrey et al. (2015) was used. All analyses were performed using the Matlab Signal Processing
Toolbox (v 7.5). Data from the SPI HPU units are initially downloaded and pre-processed and
split into desired segments using the manufacturer’s proprietary software (Team AMS).
Accelerometer and velocity data (from GPS signals) were then exported to an Excel spreadsheet.
A custom program was developed using Matlab to import data from Excel and perform all of the
analyses.
Accelerometer signals (x-, y-, z-axes and R) were low-pass filtered at 40 Hz (4th order
Butterworth) to remove noise and high-pass filtered 0.9 Hz to remove baseline drift (e.g. 0.9-40
Hz bandpass filter) (using <butter> and <filtfilt> MatLab functions). In addition, the
mediolateral signal was low-pass filtered at 3 Hz for the detection of right and left steps.
After filtering, correction for offset and alignment (i.e. tilt) of the tri-axial data was
performed as described by Moe-Nilsson (1998) and Millecamps et al. (2004). In short, this
procedure estimates the gravitational acceleration components in the anteroposterior and
mediolateral directions and transforms the data to a horizontal-vertical coordinate system.
3.2.2 Spatiotemporal Variables
For the spatiotemporal measurements, the method of McCamley et al. (2012), Godfrey et
al. (2015) and Del Din et al. (2016) were followed with minor changes. The preprocessed

32
vertical acceleration signal was integrated to obtain vertical velocity (<cumtrapz>) then
differentiated by a Gaussian CWT using a scale of 10 (<cwt>). The differentiated signal
further differentiated to obtain a jerk signal. Initial contact (IC) times were identified as
the minima of the CWT acceleration signal and final contact times (FC) were identified
as the maxima of the jerk signal (<findpeaks>). The sign of the mediolateral acceleration
signal (positive or negative) at the IC and FC points was used to identify left and right
foot contact values. Subsequent analyses were arbitrarily chosen to begin with the first
right foot IC.
Difference between subsequent ICs and FCs was identified as the CT. The
difference between subsequent right and left IC’s was determined as StpT (RL and
LR StpT) and the differences between subsequent right and subsequent left ICs was the
StrTs (RR and LL StrT).
The speed variable, determined from the GPS and accelerometer data, was used to
calculate step and stride lengths (StpL, StrL). This was done for two reasons. First, the
inverted pendulum approach (Zijistra & Hoff, 2003) is not applicable for running as the
running gait is characterized by periods of non-support. Thus, the accelerometer
movement during a single step does not simulate that of an inverted pendulum. In this
case, the pendulum axis translates during the period of non-support (defines running).
Second, we have shown that the SPI HPU units used here are very accurate and reliable
for distance measurements during rapid movements (Tessaro & Williams, 2018). Thus, it
is reasonable to use distance traveled between IC times for computing StpL and StrL.
For StpL, average speed between subsequent IC times of alternating limbs were
integrated to give distance. This value was divided by the corresponding StpT to yield

33
StpL. StrL was computed the same way except that average speed between subsequent IC values
from the same limb were used (see Equations 8 and 9).
3.2.3 Peak Acceleration and Area Acceleration
A resultant vector (R) was calculated using the x-, y- and z-axis accelerations. Using the
IC and FC time points, the peak acceleration (Peak) of the resultant vector was determined for
each step. In addition, the area under the acceleration curve (Area) was calculated using
trapezoid approximation for each step (IC to FC).
3.2.4 Step and Stride Regularity
Step and stride regularity are determined using the approach of Moe-Nilssen and
Helbostad (2004). Filtered Ra signals are processed using the autocorrelation (<xcov>) function.
This function removes any offset (mean value) from the signal then performs an autocorrelation
(<xcorr>) function. By definition, the values of the ACF function at zero lag is 1.0 as the signal
perfectly correlates to itself. Step regularity is determined as the first local maxima of the ACF
function while stride regularity is determined as the second maxima. The location of these
values (lags) also represent StpT and StrT. The ratio of step and stride regularity is defined as
step symmetry (see Equation 11).
3.2.5 Graphical Output
For visual inspection, graphical outputs are generated by the MatLab program (<plot>).
Graphical outputs for two players are shown below and specific variables are shown in Figure 7.
This figure represents a player who is returning from ACL reconstruction surgery (10 months
post-operation) who is expected to have right-left gait asymmetries. As can be seen, several of
the variables (e.g. CT, StpL and Peak) show bilateral differences.

34
Figure 7. Matlab graphical output. The data are from a player 10 months post ACL reconstruction surgery with
expected bilateral gait differences.
3.3. Specific experiments
3.3.1 Subjects
For this study, all subject were 20 members of the Virginia Tech Women’s soccer
team (168.2 ± 1.5 cm, 65.1 ± 8.0 kg). Subjects ranged in age from 18 to 22 years and were cleared
for participation by the Virginia Tech Sports Medicine staff. Prior to data collection, all
procedures were approved by the Virginia Tech Institutional Review Board and the Virginia
Tech Athletic Department and informed consent was obtained for each subject (see Appendix for
approval letters, signed forms, subject recruiting script and consent form). All data were
collected during regular training sessions.
3.3.2 Within and Between Day Reliability
0 2 4 6 8 10 12 14 16 18
Time (s)
-30
-20
-10
0
10
20A
cce
lera
tion
Raw
Accel
Jerk
0 5 10 15 20 25
Steps
0.2
0.3
0.4
Con
tact T
ime (
s)
Left
Right
0 5 10 15 20 25
Steps
0.2
0.3
0.4
0.5
Ste
p T
ime
(s)
R->L
L->R
0 5 10 15 20 25
Steps
0.5
0.6
0.7
0.8
Str
ide T
ime
(s)
Left
Right
0 5 10 15 20 25
Steps
0.8
1
1.2
1.4
Ste
p L
en
gth
(m
)
Left
Right
0 10 20 30 40 50 60 70 80
Lags
-1
0
1
AC
F
1 1.5 2 2.5 3 3.5 4 4.5 5 5.5 6
Time (s)
0
20
40
Re
su
lta
nt

35
A key aim of the study was to establish the reliability of the CWT, DFA, ACF and
acceleration analysis methods. To do this, reliability was examined by subjects performing
performing repeated efforts on the same day and on three different days. For the within-day
day reliability study, players performed three 90 m runs at a moderate to high pace (~15 km/hr).
In this instance, players received verbal feedback regarding pace (i.e. 5 sec intervals “called
out”). However, each player did set her own pace.
For the between-day reliability study, the above protocol was repeated with at least two
weeks between trials.
Data from each trial were collected and analyzed as described above. Mean values and
standard deviations for each parameters were determined. Intraclass correlations (ICC) were
used to determine the reliability of each variable generated by the spatiotemporal, DFA,
autocorrelation and peak acceleration analyses. For the within-day trial, the three individual
efforts were compared. For the between-day trials, the three efforts on the same day were
averaged and compared across days.
3.3.3 Proof of Concept
It is well established that the spatiotemporal and vertical acceleration characteristics of
gait change with variations in running speed. This concept was used to establish proof of
concept. If the approach used here is valid, speed-induced changes in gait should be reflected in
expected alterations in the CWT and acceleration derived variables. For example, CT, StpT and
StrT were expected to decrease with faster running speed while StpL, StrL, Peak and Area values
were expected to increase. Players performed 70 m runs at a jog and at slow, moderate and high-
speed running approximating 8, 12, 15 and 20 km/hr. A one-way repeated measures ANOVA
with a Tukey’s post-hoc exam was used to determine differences between running speeds.

36
3.3.4 Application
The final experiment was evaluating gait alterations in the presence of acute fatigue.
Fatigue alters neuromuscular coordination that could increase injury risk in the presence of over
exertion. For this study, players performed a series of 40, 90m sprints of increasing then
decreasing speed. Each sprint was separated by a 90m jog. The trial was structured so that the
90m sprint and subsequent jog was performed within 60 sec. Thus, as sprint speed increased, the
recovery (jogging) speed decreased. Data were collected throughout the trial. To examine the
effects of fatigue, the first and final sprints were compared (these were performed at the same
speed). The volume and intensity of the session was quantified using measures of running speed
and distance obtained from GPS signals. To determine differences in pre-and post-fatigued
conditions, pair t-tests were utilized.
37
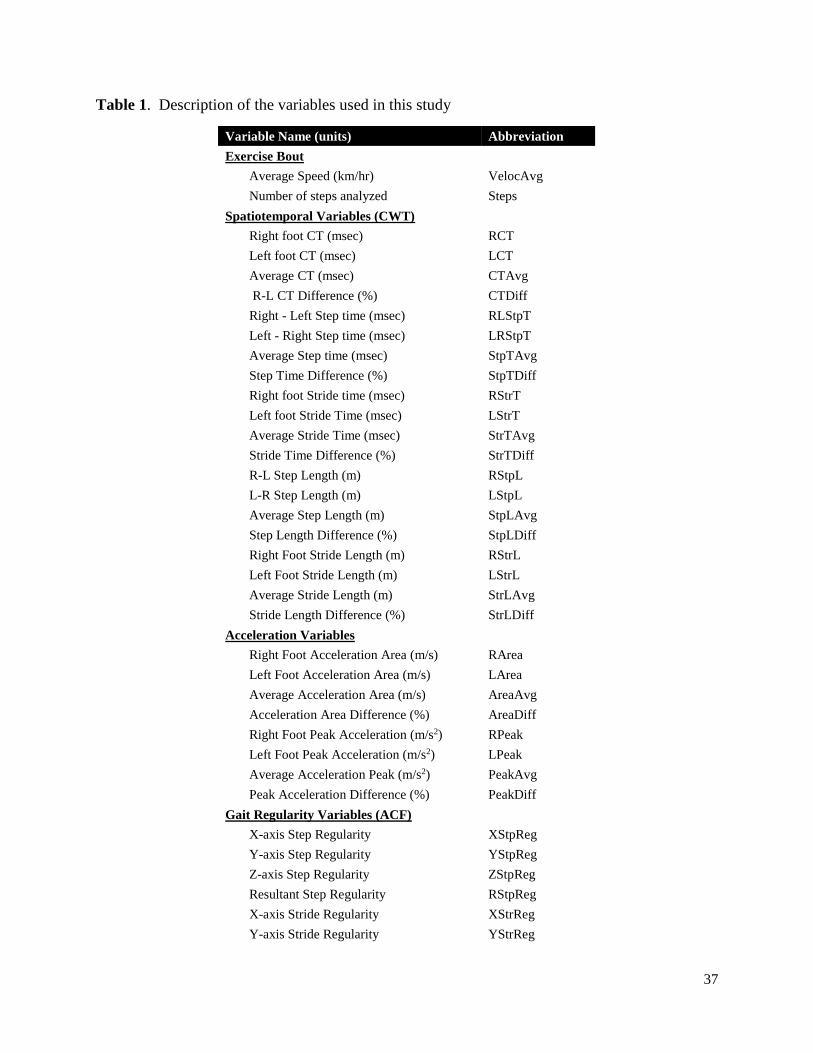
Table 1. Description of the variables used in this study
Variable Name (units) Abbreviation
Exercise Bout
Average Speed (km/hr) VelocAvg
Number of steps analyzed Steps
Spatiotemporal Variables (CWT)
Right foot CT (msec) RCT
Left foot CT (msec) LCT
Average CT (msec) CTAvg
R-L CT Difference (%) CTDiff
Right - Left Step time (msec) RLStpT
Left - Right Step time (msec) LRStpT
Average Step time (msec) StpTAvg
Step Time Difference (%) StpTDiff
Right foot Stride time (msec) RStrT
Left foot Stride Time (msec) LStrT
Average Stride Time (msec) StrTAvg
Stride Time Difference (%) StrTDiff
R-L Step Length (m) RStpL
L-R Step Length (m) LStpL
Average Step Length (m) StpLAvg
Step Length Difference (%) StpLDiff
Right Foot Stride Length (m) RStrL
Left Foot Stride Length (m) LStrL
Average Stride Length (m) StrLAvg
Stride Length Difference (%) StrLDiff
Acceleration Variables
Right Foot Acceleration Area (m/s) RArea
Left Foot Acceleration Area (m/s) LArea
Average Acceleration Area (m/s) AreaAvg
Acceleration Area Difference (%) AreaDiff
Right Foot Peak Acceleration (m/s2) RPeak
Left Foot Peak Acceleration (m/s2) LPeak
Average Acceleration Peak (m/s2) PeakAvg
Peak Acceleration Difference (%) PeakDiff
Gait Regularity Variables (ACF)
X-axis Step Regularity XStpReg
Y-axis Step Regularity YStpReg
Z-axis Step Regularity ZStpReg
Resultant Step Regularity RStpReg
X-axis Stride Regularity XStrReg
Y-axis Stride Regularity YStrReg

38
Z-axis Stride Regularity ZStrReg
Resultant Stride Regularity RStrReg
X-axis ACF Symmetry XSymm
Y-axis ACF Symmetry YSymm
Z-axis ACF Symmetry ZSymm
Resultant ACF Symmetry RSymm
Gait Complexity Variables (DFA)
Contact Time DFA alpha CTa
Step Time DFA alpha StpTa
Stride Time DFA alpha StrTa
Step Length DFA alpha StpLa
Stride Length DFA alpha StrLa
Acceleration Area alpha Areaa
Acceleration Peak alpha Peaka

39
Chapter 4
Results
4.1 Raw Data
Figure 8 shows raw accelerometer tracings recorded during a typical trial. In all cases,
accelerometer signals were clear and easily analyzed using CWT.
Figure 8. Typical raw accelerometer data obtained from a single trial.
4.1.1 Detection of Spatiotemporal Variables
Figure 9 shows a portion of those data analyzed by CWT. In this example, the raw signal
as well as the transformed acceleration (green) and jerk (red) signals are shown. Also, the
detected times of initial and final foot contacts are shown (green and red symbols, respectively).
The mediolateral acceleration signal was used to identify right and left foot values (not shown).
In no case was the CWT analysis unable to analyze acceleration data.

40
Figure 9. Partial CWT analysis obtained from a single trial. The black line represents the raw vertical axis
acceleration. The green and red lines represent the continuous wavelet transformed acceleration and jerk
signals. The solid dots represent initial (green) and final (red) foot contact times.
Figure 10 shows the resultant acceleration from a portion of a single trial. This figure
also shows peak acceleration (symbols) as well as the area under the acceleration curve during
foot contact for each step (shaded area).
Figure 10. Calculation of peak acceleration and the acceleration area variable within a single trial. The black
dots represent peak values. The shaded region is the area between initial and final foot contact.
41
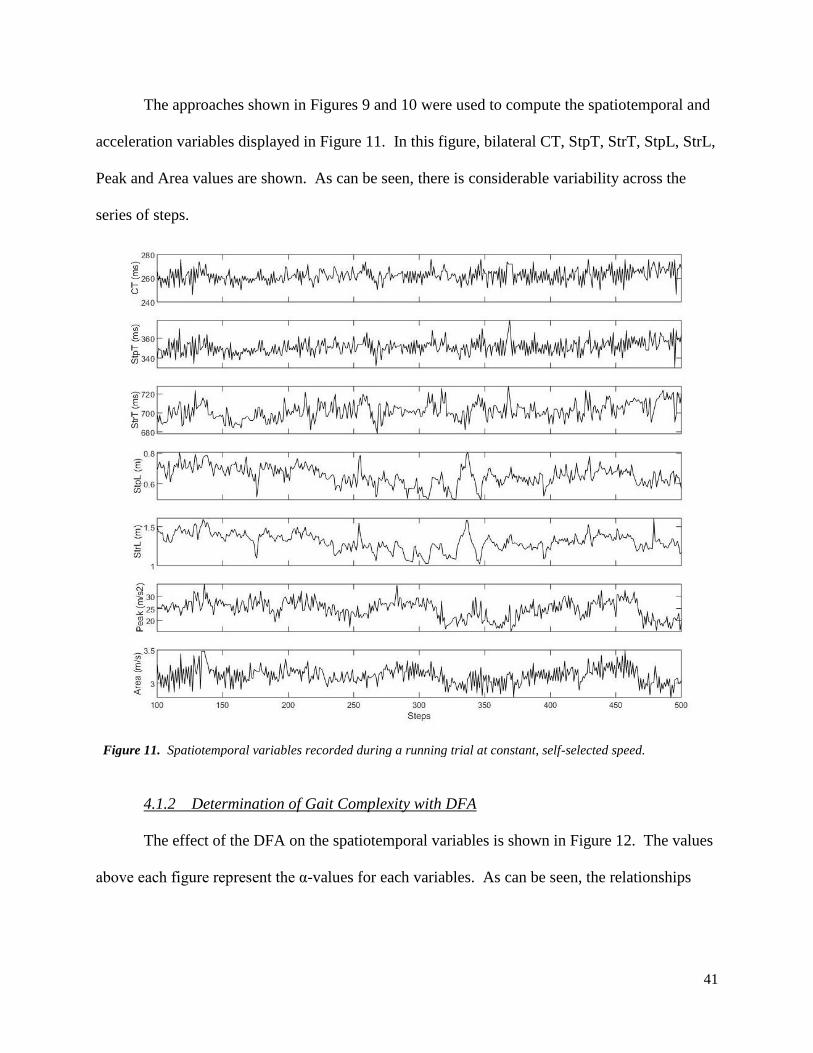
The approaches shown in Figures 9 and 10 were used to compute the spatiotemporal and
acceleration variables displayed in Figure 11. In this figure, bilateral CT, StpT, StrT, StpL, StrL,
Peak and Area values are shown. As can be seen, there is considerable variability across the
series of steps.
Figure 11. Spatiotemporal variables recorded during a running trial at constant, self-selected speed.
4.1.2 Determination of Gait Complexity with DFA
The effect of the DFA on the spatiotemporal variables is shown in Figure 12. The values
above each figure represent the α-values for each variables. As can be seen, the relationships

42
between log F(N) and log N are linear. It was found that detrending the data using 2nd order
polynomial (quadratic) did not improve the relationship between these two variables.
Figure 12. Results of the DFA analysis. Shown are the relationships between the log (F(n)) vs the log (n).
Shown are typical examples of all five spatiotemporal variables along with running velocity.
To confirm the use of DFA as a measure of structured variability, individual parameter
values for each subject were randomly shuffled 5 times and FSI recomputed. Random shuffling
retains the mean and standard deviation of the original data but destroys any long-range
correlations and structured variability. Typical results of this procedure are also shown in
Figure 13. The α-value for the shuffled data is less than the original data (i.e. flatter slope) and
very close to 0.5. The mean FSI for 81 sets of shuffled data (within and between day reliability
data) was 0.499 ± 0.003 (p>.05 vs 0.500, effect size = 0.04).

43
Figure 13. Effect of random shuffling of StpL data on the DFA. In this figure, α values were 0.923 for the raw
data (●) and 0.498 for the shuffled data (○).
4.1.3 Determination of Gait Regularity Using Autocorrelation
An example of the autocorrelation analyses of the accelerometry signal is shown in
Figure 14. Local peaks of the ACFs are identified by the symbols. The magnitude of the first
peak to the right of zero lag represents StpReg while the magnitude of the adjacent local peak
represents StrReg. The location of the peaks (lags) are proportional to and represent StpT and
StrT, respectively. For the mediolateral axis, the first local peak is negative, indicating the
alternating positive and negative accelerations of right and left foot contact.

44
Figure 14. Results of the autocorrelation analyses from each axis as well as the calculated resultant. In these
figures, the horizontal axis represents the lag (in points) and the vertical axis is the correlation coefficient. The
first two symbols to the right of 0 lag represent step and stride similarity, respectively.
4.2 Test Retest Analyses
Test-retest reliability was assessed two ways. First, reliability between three trials
performed within a single day were evaluated (within-day). Second, reliability between
individual trials performed on three different days (between-day).
4.2.1 Within-Day Reliability
Within-day intraclass correlation coefficient (ICC) values for all variables are shown in
Table 2 along with mean values (± SD). For the spatiotemporal variables, there was excellent
agreement across all variables except those indicating bilateral difference. ICC values ranged
between 0.86 and 0.97. For the difference variables, poor ICC values were found (<0.35).
Calculations of the resultant acceleration showed excellent agreement except for the
difference variables with ICC values ranging from 0.93 to 0.98. For AreaDiff and PeakDiff, ICC
values were fair to poor (0.34 and 0.65, respectively).
45
Gait regularity generally showed good to excellent agreement with all ICC’s being above
0.70. In general, StrReg variables showed better agreement than the StpReg variables. The X
component had excellent agreement, the Y and Z components had good agreement, and the
resultant symmetry had fair agreement. For the symmetry variables, agreement ranged from fair
to good (R2 = 0.53 - 0.86).
All of the DFA variables showed good to excellent agreement for all variables observed.
ICC values ranged from 0.79 to 0.92.
4.2.2 Between-Day Reliability
Between-day ICC values are shown in Table 3 along with mean values. Mean values for
the between-day conditions were not compared to the within-day due to differences in the speed
of the exercise bout. In general, between-day reliability measures were similar to those of the
within-day study. Agreement was very good for the spatiotemporal and acceleration variables
except for the difference variables. Also, most of the gait regularity and complexity variables
showed good to excellent ICC. The only exception was YStpReg. Overall, ICC values for the
between-day study tended to be greater than for the within-day study. This may be due to more
consistent running speed between the sets of trials (ICC = 0.80 vs 0.65).

46
Table 2. Within-Day Reliability. Intraclass correlation, mean and SD values for each of the
variables recorded during three trials conducted on the same day (n=48, 16 subjects x 3 trials).
Variable Name (units) Variable ICC Mean SD
Average Speed (km/hr) VelocAvg 0.6450 13.71 0.30
Steps analyzed Steps 0.7416 61.92 2.65
Spatiotemporal Variables
Right foot CT (msec) RCT 0.9215 253.66 2.85
Left foot CT (msec) LCT 0.9343 253.80 2.86
Average CT (msec) CTAvg 0.9724 253.73 1.73
R-L CT Difference (%) CTDiff 0.3224 -0.03 1.61
Right - Left Step time (msec) RLStpT 0.9126 339.14 4.04
Left - Right Step time (msec) LRStpT 0.9451 338.34 3.71
Average Step time (msec) StpTAvg 0.9727 338.74 2.47
Step Time Difference (%) StpTDiff 0.2088 -0.17 2.29
Right foot Stride time (msec) RStrT 0.9739 677.91 4.78
Left foot Stride Time (msec) LStrT 0.9722 678.04 4.85
Average Stride Time (msec) StrTAvg 0.9732 677.98 4.81
Stride Time Difference (%) StrTDiff 0.1041 0.19 0.71
R-L Step Length (m) RStpL 0.8191 1.30 0.04
L-R Step Length (m) LStpL 0.8701 1.31 0.03
Average Step Length (m) StpLAvg 0.8763 1.31 0.03
Step Length Difference (%) StpLDiff 0.2083 -0.17 2.28
Right Foot Stride Length (m) RStrL 0.8616 2.61 0.06
Left Foot Stride Length (m) LStrL 0.8835 2.62 0.06
Average Stride Length (m) StrLAvg 0.8761 2.61 0.20
Stride Length Difference (%) StrLDiff 0.0968 0.19 0.70
Acceleration Variables
Right Foot Acceleration Area (m/s) RArea 0.9356 3.61 0.07
Left Foot Acceleration Area (m/s) LArea 0.9377 3.62 0.07
Average Acceleration Area (m/s) AreaAvg 0.9781 3.62 0.04
Acceleration Area Difference (%) AreaDiff 0.3415 -0.42 2.86
Right Foot Peak Acceleration (m/s2) RPeak 0.9430 35.75 1.35
Left Foot Peak Acceleration (m/s2) LPeak 0.9312 36.19 1.14
Average Acceleration Peak (m/s2) PeakAvg 0.9663 35.97 0.90
Peak Acceleration Difference (%) PeakDiff 0.6543 -1.71 4.19
Gait Regularity Variables
X-axis Step Regularity XStpReg 0.9180 -0.72 0.02
Y-axis Step Regularity YStpReg 0.8955 0.81 0.02
Z-axis Step Regularity ZStpReg 0.9298 0.88 0.01
Resultant Step Regularity RStpReg 0.8820 0.86 0.02
X-axis Stride Regularity XStrReg 0.7567 0.78 0.02
Y-axis Stride Regularity YStrReg 0.8197 0.81 0.02
Z-axis Stride Regularity ZStrReg 0.7567 0.78 0.02
Resultant Stride Regularity RStrReg 0.7089 0.82 0.03

47
X-axis ACF Symmetry XSymm 0.8581 -0.93 0.03
Y-axis ACF Symmetry YSymm 0.6285 1.01 0.02
Z-axis ACF Symmetry ZSymm 0.6363 1.04 0.02
Resultant ACF Symmetry RSymm 0.5289 1.05 0.02
Gait Complexity Variables
Contact Time DFA alpha CTa 0.8854 0.49 0.02
Step Time DFA alpha StpTa 0.8506 0.50 0.03
Stride Time DFA alpha StrTa 0.7937 0.86 0.03
Step Length DFA alpha StpLa 0.9039 0.90 0.02
Stride Length DFA alpha StrLa 0.8608 1.13 0.02
Acceleration Area alpha Areaa 0.8665 0.50 0.02
Acceleration Peak alpha Peaka 0.9214 0.63 0.02
ICC values in red are considered “excellent” while values in green are considered “good”.

48
Table 3. Between-Day Reliability. Intraclass correlation, mean and SD values for each of the
variables recorded during three trials conducted on different days (n=33, 11 subjects X 3 days).
Variable Name Variable ICC Mean SD
Average Speed (km/hr) VelocAvg 0.8028 10.14 0.27
Steps analyzed Steps 0.8770 350.09 16.49
Spatiotemporal Variables
Right foot CT (msec) RCT 0.9518 261.12 12.66
Left foot CT (msec) LCT 0.9580 260.36 12.51
Average CT (msec) CTAvg 0.9677 260.74 12.44
R-L CT Difference (%) CTDiff 0.3786 0.29 1.49
Right - Left Step time (msec) RLStpT 0.9563 347.55 16.52
Left - Right Step time (msec) LRStpT 0.9653 347.14 17.06
Average Step time (msec) StpTAvg 0.9665 347.35 16.57
Step Time Difference (%) StpTDiff 0.2371 0.20 2.00
Right foot Stride time (msec) RStrT 0.9669 694.71 33.14
Left foot Stride Time (msec) LStrT 0.9670 694.71 33.14
Average Stride Time (msec) StrTAvg 0.9670 694.71 33.14
Stride Time Difference (%) StrTDiff 0.5820 0.25 0.57
R-L Step Length (m) RStpL 0.9678 0.98 0.05
L-R Step Length (m) LStpL 0.8886 0.98 0.05
Average Step Length (m) StpLAvg 0.9524 0.98 0.05
Step Length Difference (%) StpLDiff 0.2453 0.21 2.03
Right Foot Stride Length (m) RStrL 0.9301 1.96 0.10
Left Foot Stride Length (m) LStrL 0.9468 1.96 0.10
Average Stride Length (m) StrLAvg 0.9389 1.96 0.10
Stride Length Difference (%) StrLDiff 0.5554 0.24 0.57
Acceleration Variables
Right Foot Acceleration Area (m/s) RArea 0.9267 3.54 0.24
Left Foot Acceleration Area (m/s) LArea 0.9170 3.55 0.24
Average Acceleration Area (m/s) AreaAvg 0.9684 3.54 0.23
Acceleration Area Difference (%) AreaDiff 0.3661 -0.24 4.17
Right Foot Peak Acceleration (m/s2) RPeak 0.9204 30.27 5.16
Left Foot Peak Acceleration (m/s2) LPeak 0.9391 30.94 4.24
Average Acceleration Peak (m/s2) PeakAvg 0.9404 30.60 4.54
Peak Acceleration Difference (%) PeakDiff 0.7424 -2.54 8.54
Gait Regularity Variables
X-axis Step Regularity XStpReg 0.8760 -0.74 0.06
Y-axis Step Regularity YStpReg 0.4936 0.85 0.04
Z-axis Step Regularity ZStpReg 0.9025 0.90 0.04
Resultant Step Regularity RStpReg 0.8828 0.89 0.04
X-axis Stride Regularity XStrReg 0.8691 0.81 0.06
Y-axis Stride Regularity YStrReg 0.8402 0.86 0.04
Z-axis Stride Regularity ZStrReg 0.9291 0.81 0.06
Resultant Stride Regularity RStrReg 0.8509 0.87 0.04
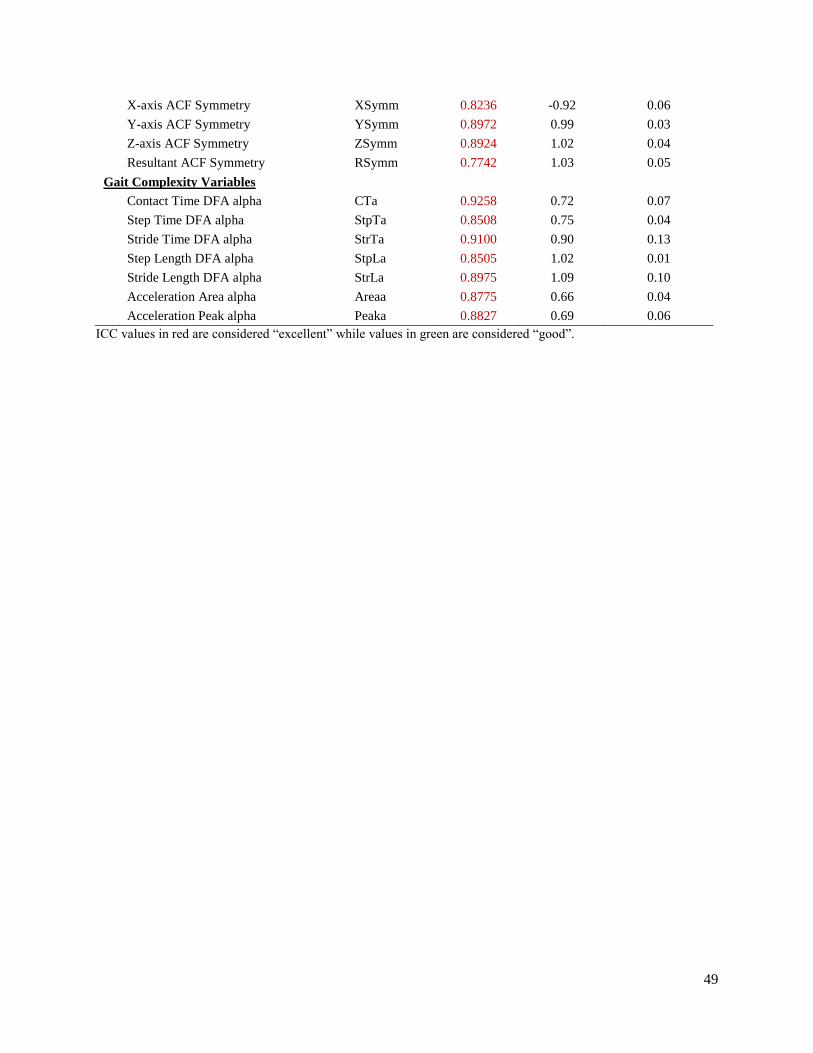
49
X-axis ACF Symmetry XSymm 0.8236 -0.92 0.06
Y-axis ACF Symmetry YSymm 0.8972 0.99 0.03
Z-axis ACF Symmetry ZSymm 0.8924 1.02 0.04
Resultant ACF Symmetry RSymm 0.7742 1.03 0.05
Gait Complexity Variables
Contact Time DFA alpha CTa 0.9258 0.72 0.07
Step Time DFA alpha StpTa 0.8508 0.75 0.04
Stride Time DFA alpha StrTa 0.9100 0.90 0.13
Step Length DFA alpha StpLa 0.8505 1.02 0.01
Stride Length DFA alpha StrLa 0.8975 1.09 0.10
Acceleration Area alpha Areaa 0.8775 0.66 0.04
Acceleration Peak alpha Peaka 0.8827 0.69 0.06
ICC values in red are considered “excellent” while values in green are considered “good”.

50
4.3 Varied speed
Data for the varied speed trials are presented in Table 4. For this analysis, bilateral data
were not included. This was due to the poor reliability of these measures. Thus, only average
data are shown. Shown in Table 4 are mean values (± SEM) for each speed along with the
ANOVA p-value. For significance ANOVA’s Tukey post-hoc exam results are shown. Lastly
the correlation coefficient for speed versus each variable is shown.
Spatiotemporal and accelerations variables showed significant differences between
speeds whereas the difference variables were not significant. Post-hoc exams showed some
differences with speed. Also, temporal variables increased with running speed while spatial
variables decreased. In short, increased running speed was associated with decreased contact,
stride and step times and increased acceleration.
Gait regularity also changed with running speed as indicated by the significant ANOVA
p-values. As speed increased, regularity tended to decrease.
Varied speed data did not yield significant differences in gait complexity between speeds
for the DFA. The -values were not significantly different between speeds. Also, the strengths
of the relationships between and speed were small or trivial. This suggests that the structure of
gait variability remains consistent as speed varies.
In summary, increasing running speed decreased the temporal variables associated with
gait and increased the spatial variables. In addition, peak acceleration increased while the area of
the acceleration curve associated with foot strike decreased. Similarly gait and stride regularity
decreased with increasing speed. On the other hand, measures of gait complexity were not
affected by running speed.

51
Table 4. Effects of Varied Speed on Gait Variables. Mean comparison of each variable recoded during different running speeds
(n=18 subjects for each speed).
Jog Low Medium High ANOVA Tukey Post-Hoc Correl
Variable Mean SEM Mean SEM Mean SEM Mean SEM p-Value Jog Low Med High vs Speed
AvgVeloc 8.36 0.04 12.09 0.06 15.16 0.08 20.41 0.13 0.0001 A A A A
Spatiotemporal Variables
CTAvg 260.80 2.37 252.15 2.91 244.27 2.44 235.12 3.11 0.0475 A AB AB B -0.7584
CTDiff 0.33 0.59 -0.24 0.50 0.03 0.62 2.34 1.12 0.0945 0.2281
StpTAvg 347.55 3.23 335.61 3.95 325.31 3.35 292.29 3.37 0.0001 A B C D -0.8051
StpTDiff 0.21 0.49 -0.37 0.57 -0.44 0.73 -0.33 1.27 0.9453 -0.0543
StrTAvg 695.31 6.44 672.60 7.85 652.02 6.74 589.93 6.81 0.0001 A B C D -0.7931
StrTDiff 0.19 0.20 0.29 0.20 -0.18 0.30 0.38 0.20 0.3517 0.0382
StpLAvg 0.81 0.01 1.15 0.01 1.40 0.02 1.72 0.02 0.0001 A B C D 0.9790
StpLDiff 0.22 0.48 -0.37 0.58 -0.44 0.73 -0.27 1.25 0.9435 -0.0501
StrLAvg 1.62 0.02 2.29 0.03 2.80 0.04 3.44 0.04 0.0001 A B C D 0.9787
StrLDiff 0.19 0.20 0.29 0.20 -0.17 0.30 0.43 0.20 0.3117 0.0538
Acceleration Variables
AreaAvg 4.35 0.42 3.54 0.06 3.56 0.05 3.66 0.19 0.0398 A A A A -0.1978
AreaDiff 0.49 1.10 -0.74 1.38 -0.06 1.36 1.04 1.55 0.8394 0.0541
PeakAvg 29.88 1.77 34.89 1.44 36.75 1.32 44.09 1.31 0.0001 A B B C 0.6337
PeakDiff -0.87 1.74 -0.54 2.35 2.53 2.94 2.64 1.89 0.5456 0.1679
Gait Complexity Variables
CTa 0.65 0.02 0.69 0.05 0.68 0.06 0.82 0.17 0.0641 0.1608
StTa 0.64 0.02 0.73 0.07 0.62 0.07 0.67 0.08 0.6522 0.0093
StrTa 0.84 0.03 1.12 0.07 1.01 0.08 1.01 0.09 0.0606 0.1463
StpLa 0.96 0.05 0.82 0.09 0.88 0.09 1.05 0.10 0.2860 0.1250
StrLa 1.10 0.04 1.12 0.08 1.23 0.09 1.29 0.14 0.3612 0.1935
Areaa 0.51 0.04 0.64 0.04 0.58 0.08 0.79 0.17 0.2960 0.2089
Peaka 0.57 0.04 0.73 0.05 0.72 0.06 0.71 0.10 0.2899 0.1781
Gait Regularity Variables
XStpReg -0.75 0.02 -0.65 0.02 -0.67 0.02 -0.51 0.03 0.0001 A B B C 0.6190

52
YStpReg 0.84 0.02 0.70 0.03 0.72 0.03 0.50 0.03 0.0001 A B B C -0.6363
ZStpReg 0.92 0.01 0.84 0.01 0.85 0.01 0.58 0.02 0.0001 A B B C -0.8499
RStpReg 0.86 0.04 0.81 0.02 0.82 0.01 0.52 0.02 0.0001 A A A B -0.6994
XStrReg 0.84 0.01 0.67 0.03 0.66 0.02 0.46 0.02 0.0001 A B B C -0.8368
YStrReg 0.85 0.01 0.68 0.04 0.69 0.03 0.38 0.03 0.0001 A B B C -0.7812
ZStrReg 0.84 0.01 0.67 0.03 0.66 0.02 0.46 0.02 0.0001 A B B C -0.8368
RStrReg 0.87 0.02 0.73 0.03 0.74 0.01 0.34 0.03 0.0001 A B B C -0.8391
XSymm -0.90 0.03 -0.99 0.03 -1.01 0.02 -1.12 0.03 0.0001 A AB B C -0.5651
YSymm 0.98 0.01 1.06 0.05 1.04 0.02 1.41 0.11 0.0001 A B B B 0.5047
ZSymm 1.02 0.01 1.12 0.03 1.11 0.01 1.63 0.08 0.0001 A B B B 0.7070
RSymm 0.98 0.04 1.14 0.03 1.11 0.01 1.66 0.08 0.0001 A B B B 0.7318
p-values in red are statistically significant (p<.05). ES values in red are “small”, those in green are “medium” and those in blue are “large”.
53
4.4 Acute Exercise Data
The acute exercise bout for a single player is shown in Figure 15. In this figure, both
running speed and acceleration are shown. For determining the effects of fatigue on gait
characteristics, the first and last sprint trial were used. Figure 16 shows that raw GPS data
overlaid on the practice field. These data show the path characteristics of the bout.
The work load during the acute exercise session are shown in Table 5. Players covered
nearly 7500m and exercise at an average HR of 166 bpm (approximately 82% of maximal).
Peak HR values indicated that players did not reach their measured maximal HR of 202.47 bpm.
Energy expenditure during the session was approximately 516 kcal.
Significance was detected (p<0.05) for CTAvg, StTAvg, StrTAvg, AreaAvg, and Areaa
(Table 6). Despite this, effect sizes for several variables, between the two conditions were small
and medium. For gait complexity, effect sizes in StpLa, StrLa, Areaa between pre-and post-
exercise were medium. Step regularity in the Y, Z and resultant had small effect sizes. Stride
regularity had small effect sizes in all fields except for Z and the resultant. Symmetry in the x-
and y-axis direction had small effect sizes.
In order to more clearly visualize pre-post changes in each variable, differences are
plotted as percent differences (Figure 17).
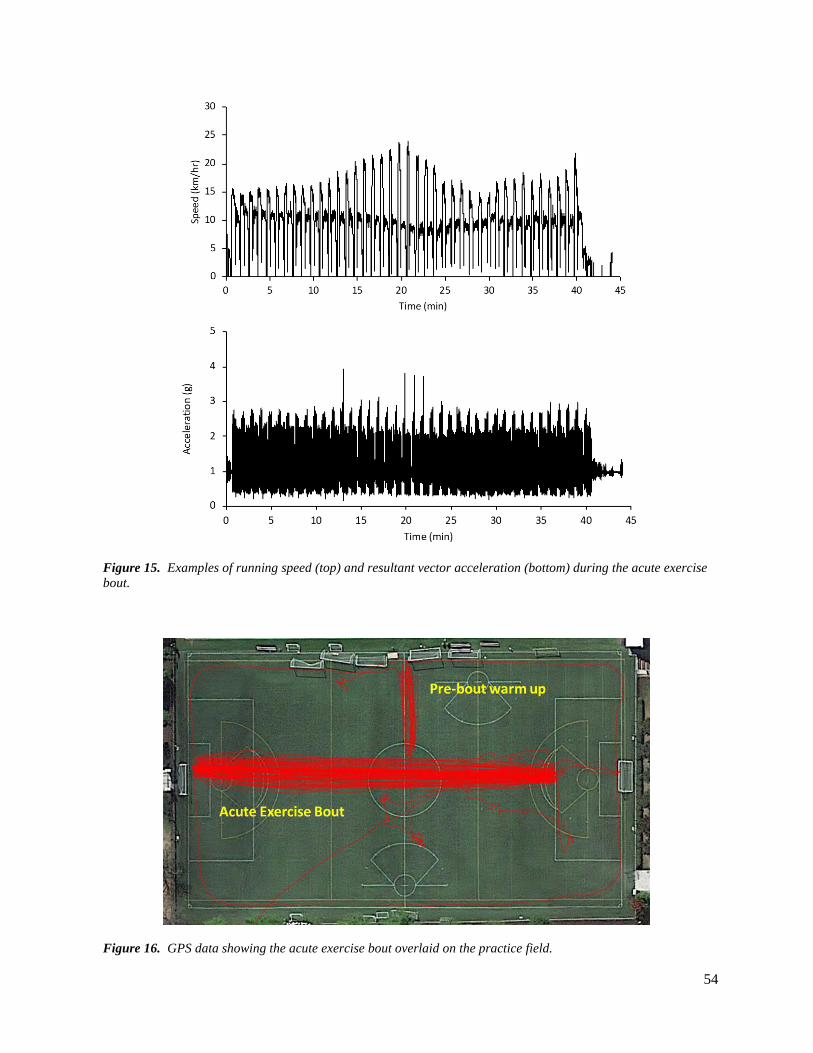
54
Figure 15. Examples of running speed (top) and resultant vector acceleration (bottom) during the acute exercise
bout.
Figure 16. GPS data showing the acute exercise bout overlaid on the practice field.

55
Table 5. Work load during the acute exercise bout. Values describing the workload experienced
during the training session (n=10 players).
Variable Mean S/D
Total Distance (m) 7404.25 173.89
Maximal Speed (km/hr) 22.57 2.52
Average Speed (km/hr) 9.90 0.46
Peak Heart Rate (bpm) 190.92 16.17
Average Heart Rate (bpm) 166.08 24.02
Body Load (au) 86.68 40.96
Energy Expended (kJ/kg) 34.40 1.96
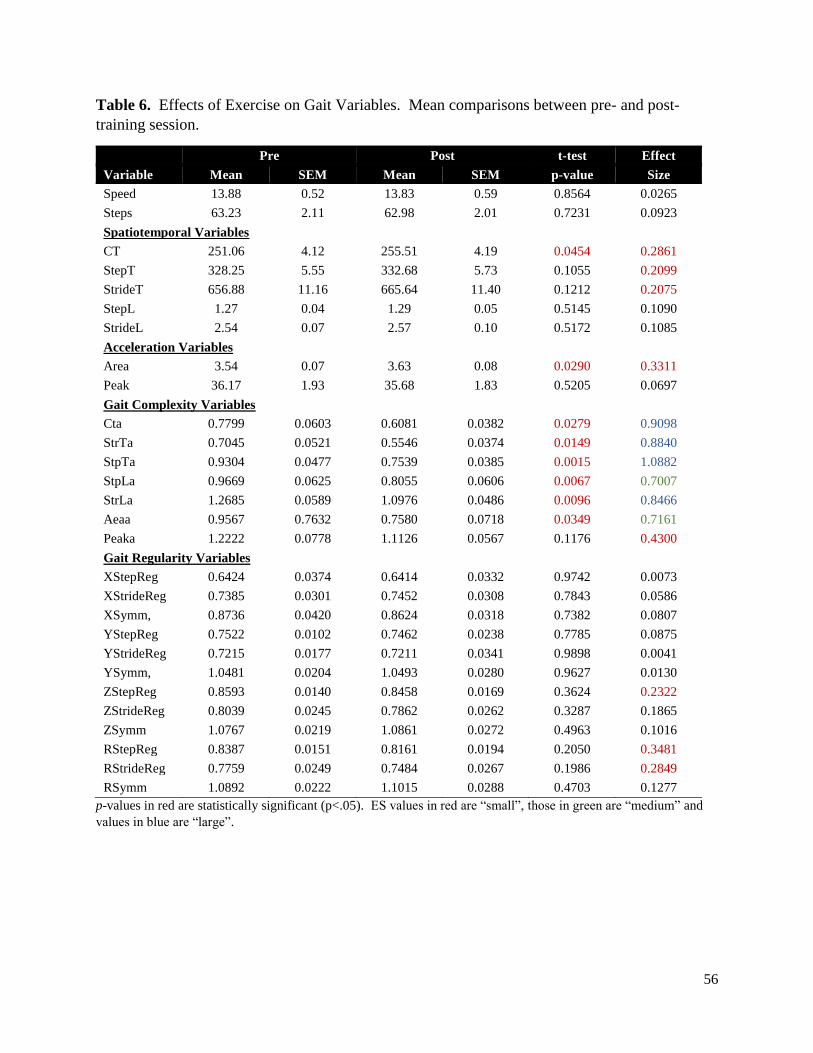
56
Table 6. Effects of Exercise on Gait Variables. Mean comparisons between pre- and post-
training session.
Pre Post t-test Effect
Variable Mean SEM Mean SEM p-value Size
Speed 13.88 0.52 13.83 0.59 0.8564 0.0265
Steps 63.23 2.11 62.98 2.01 0.7231 0.0923
Spatiotemporal Variables
CT 251.06 4.12 255.51 4.19 0.0454 0.2861
StepT 328.25 5.55 332.68 5.73 0.1055 0.2099
StrideT 656.88 11.16 665.64 11.40 0.1212 0.2075
StepL 1.27 0.04 1.29 0.05 0.5145 0.1090
StrideL 2.54 0.07 2.57 0.10 0.5172 0.1085
Acceleration Variables
Area 3.54 0.07 3.63 0.08 0.0290 0.3311
Peak 36.17 1.93 35.68 1.83 0.5205 0.0697
Gait Complexity Variables
Cta 0.7799 0.0603 0.6081 0.0382 0.0279 0.9098
StrTa 0.7045 0.0521 0.5546 0.0374 0.0149 0.8840
StpTa 0.9304 0.0477 0.7539 0.0385 0.0015 1.0882
StpLa 0.9669 0.0625 0.8055 0.0606 0.0067 0.7007
StrLa 1.2685 0.0589 1.0976 0.0486 0.0096 0.8466
Aeaa 0.9567 0.7632 0.7580 0.0718 0.0349 0.7161
Peaka 1.2222 0.0778 1.1126 0.0567 0.1176 0.4300
Gait Regularity Variables
XStepReg 0.6424 0.0374 0.6414 0.0332 0.9742 0.0073
XStrideReg 0.7385 0.0301 0.7452 0.0308 0.7843 0.0586
XSymm, 0.8736 0.0420 0.8624 0.0318 0.7382 0.0807
YStepReg 0.7522 0.0102 0.7462 0.0238 0.7785 0.0875
YStrideReg 0.7215 0.0177 0.7211 0.0341 0.9898 0.0041
YSymm, 1.0481 0.0204 1.0493 0.0280 0.9627 0.0130
ZStepReg 0.8593 0.0140 0.8458 0.0169 0.3624 0.2322
ZStrideReg 0.8039 0.0245 0.7862 0.0262 0.3287 0.1865
ZSymm 1.0767 0.0219 1.0861 0.0272 0.4963 0.1016
RStepReg 0.8387 0.0151 0.8161 0.0194 0.2050 0.3481
RStrideReg 0.7759 0.0249 0.7484 0.0267 0.1986 0.2849
RSymm 1.0892 0.0222 1.1015 0.0288 0.4703 0.1277
p-values in red are statistically significant (p<.05). ES values in red are “small”, those in green are “medium” and
values in blue are “large”.

57
Figure 17. Effects acute fatigue on gait characteristics. Shown are the percent changes from the initial bout to the final.

58
Chapter 5
Discussion
Overall, the results of this study show that many of the derived spatiotemporal, regularity
and complexity measures of gait are very reliable with the majority of metrics having large ICC
values. The only major exceptions were variables of bilateral differences. For these variables,
ICC values were poor. The results also provide proof of concept for the spatiotemporal
measures. As running speed increased, expected changes in spatiotemporal variables were
found. That is contact, step and stride times decreased while step and stride lengths increased,
while gait regularity variables were decreased with increasing speed. On the other hand, gait
complexity variables were not affected by changes in running speed. Lastly, in terms of
application, fatiguing exercise had minimal effects on spatiotemporal and regularity gait
parameters. However, Gait complexity was noticeably affected FSI values were
decreased. Overall, the results of this study show that gait spatiotemporal, complexity and
regularity variables derived using CWT, DFA and ACF applied to trunk-mounted accelerometry
during running are both reliable and valid as are measures of gait regularity. Further, this
approach appears to be both valid and applicable to the study of running gait.
5.1 Reliability
The tests for reliability showed consistency with the majority of the variables having
excellent ICC’s. The only exceptions were the bilateral comparison variables. Across these
parameters, the percent difference between left and right events yielded poor reliability. Given
that the other gait variables have excellent reliability, it would be expected that the difference in
left and right gait components would also have excellent reliability. However, our data show the
opposite effect, suggesting that between stride differences are a commonality in gait resulting
59
from the complexity of human locomotion. Also, it is possible that the bilateral comparisons are
not robust enough to detect true differences in running symmetry. Measures of gait regularity
using autocorrelation produced repeatable step and stride regularities. In this approach, the
autocorrelation function is “shifted” until right and left foot strikes “overlap”. In short, this is a
direct comparison of the accelerometer signal from alternating right and left events, using the
entire signal. Such an approach may be more sensitive to bilateral differences. Thus,
autocorrelation using mediolateral, anteroposterior, vertical and/or the resultant accelerations
may be a better measure of bilateral symmetry than the comparison of right and left
spatiotemporal events.
Across all variables, measures of gait complexity using DFA showed excellent
reliability. This is the first study to demonstrate with- and between-day reliability of these
measures. The validity of DFA for measuring complexity during running is indicated by the use
of “shuffled” data (Figure 5.6). As noted earlier, randomly shuffling the spatiotemporal data
destroys any embedded complexity as well as long-term correlations. It does not alter the total
variance with the sample. When the DFA was performed on the shuffled data, α values
approached 0.5. A value of 0.5 indicated true random variation while values above 0.5 indicate
structured variation including long-term correlations. In short, α >0.5 indicates a gait pattern
whereby successive steps are dependent on previous event with that dependency decaying over
time. Thus, the present data suggest that the present DFA measures obtained during running are
both reliable and valid.
5.2 Effects of Running Speed
The variables from the present study respond appropriately to changes in speed; peak
acceleration and stride length increased, and contact times decreased in response to increasing
60
speeds. As early as 1952 physiologists have noticed that certain spatiotemporal characteristics
increased with speed. Hogberg (1952) found that stride length increased with increases in speed
and contact times decreased with increases in speed. Likewise in 1989 Nilsson and Thorstensson
found that contact times were decreasing with increases in speed. Weyand et al. (2000)
described their findings in the following manner: “Speed increases were made primarily through
increasing stride lengths and decreasing contact times” (Weyand et al. 2000). Mercer et al.
(2002) saw that stride length increased with speed, and peak accelerations increased with
increases in speed. Thus, the CWT analysis used here was able to confirm expected changes in
spatiotemporal variables as running speed increased.
The present study indicates that DFA measures of gait complexity are not altered by
running speed, within the range of speed used here. This is in contrast to others (Jordan et al.
2006; 2007). These groups showed a U-relationship between α and preferred walking and
running speed. As subjects increased or decreased walking speed, α increased. This was the
case for several spatiotemporal gait variables. The authors suggested that “biological stress”
may increase the gait complexity. They further suggest that a source of biological stress may be
the available range of stride length and stride time combinations that allow the individual to
maintain the appropriate running speed. Differences between the present results and those of
Jordan et al. (2006; 2007), may reside in the subjects included in the studies. Here, trained
athletes were used as subjects. In fact, Nakayama et al. (2010) showed that trained runners
exhibit higher α values across a range of speeds than non-runners. A second source of difference
may lie in the speeds selected for study. In the aforementioned studies, subjects selected a
preferred speed and that speed was increased and decreased. In the present study, subjects ran as
61
a group at the same speed (instructed to jog or run at high, medium and low speeds). Thus,
preferred speed was not measured.
That running speed did not affect the DFA variables suggesting that this measure could
be used to assess gait complexity independent of running speed. For example, using α to
monitor long-term changes in gait (such as might occur with injury or overtraining), small day-
to-day fluctuations in running speed would not have a major impact on observed changes.
5.3 Effects of Fatiguing Exercise
One of the few articles found to compare running gait symmetry in pre-fatigue and post-
fatigue conditions, had a more lab based approach (Schutte et al. 2015). Step and stride
regularity values were computed using a motion capture system, a treadmill, and accelerometers
mounted on the participant’s lower back. The participants then ran until termination criteria
were reached signaling exhaustion. Despite signal dampening experienced by the accelerometers
used in the present study, Schutte et al. (2015) had similar step and stride regularity values in the
vertical axis for both conditions. The only significant change in regularity was a decrease in step
regularity in the AP axis from pre-fatigue to the fatigued state.
A more field-based approach was executed by Le Bris et al. (2006). An accelerometer
placed on the lower back continuously measured accelerations during a 3200 meter time trial to
exhaustion. A significant decrease in regularity was observed over the course of the run. The
present data showed small effect sizes for increases in regularity in the fatigued state.
Contact times reported in this paper are similar to those reported elsewhere (Gilman-
Ammann et al. 2017 and Ammann et al. 2015). Likewise, α values for stride interval (StrTa) in
the present study are similar to those found by others (Jordan et al. 2009, Meardon et al.
2011). Meardon et al. examined long range correlations of stride interval variability in distance

62
runners. They found that as participants fatigued, StrTa decreased. This finding is consistent
with the findings in the current study. Further, chronic exercise leading to overtraining can
negatively impact the structure of gait variability and the FSI (Bellenger et al., 2018; Fuller et al.,
2017).
At present, it is not clear how fatiguing activity might alter gait complexity. If earlier
work suggesting that the FSI is dependent on the CNS rather than peripheral factors (see
Hausdorff, 2007), then some aspect of central fatigue would lead to reductions in α. In this
regard, pain, muscle soreness and discomfort during and after exercise may be responsible. The
work of Newell and van der Laan (2010) and Roberts et al. (2004) suggest that pain may play a
role. However, it should be pointed out that the mechanisms by Hausdorff (2007) were based on
walking data in healthy adults and diseased patients. In the present study, highly trained, young
adult athletes were examined. It is possible that the mechanisms responsible for gait complexity
and structured variability are different in the present subjects and those described by Hausdorff
(2007).
5.4 Application and Limitations
As with any study, the results lend themselves to practical applications. The
convenience of using accelerometers in collecting mass amounts of field data makes them a more
attractive option for sports scientists with budgetary limitations to monitor gait and activity
patterns. As these devices are used by numerous sports teams (Aughey, 2011, Cummins et al,
2013), one could evaluate gait in a large number of subjects simultaneously. Such evaluations
could lend themselves to monitoring injury or overtraining (Buchheit et al., 2015; Ehrmann et al.,
2016). Further, given that the spatiotemporal variables are affected by running speed, inclusion

63
of a GPS system with the accelerometer allows for simultaneous measurement of speed. Thus,
researchers and clinicians would be able to adjust for speed in the evaluation of gait.
On the other hand, there are several issues that limit the applicability of the results. First,
an important limitation to this study is the inability to precisely control running speed. Ideally
the current subjects would be running at a constant speed regulated by a treadmill. However, as
indicated in Tables 2 and 3, the reliability of the subjects to reproduce a consistent running speed
was quite good.
Second, along that same line of thinking, this study did not impose a verified method to
fatigue its participants. Instead a more realistic (in terms of in-season training plan) approach to a
fatiguing protocol was used. In addition, fatigue was not evaluated by a pre-post session
evaluation. Thus, the condition of the subjects after the training session should not be described
as “fatigued” but simply post-exercise.
Third, the majority of papers using CWT, DFA, and ACF’s are using accelerometers
mounted on the lower back. Dampening of the accelerometer signal will likely impact the data
obtained from our results. However, Del Din et al. (2016) has shown that trunk-mounted
accelerometry has produced similar results to accelerometers placed near the center of mass.
Lastly, it should also be noted, that the participants in this experiment were elite women’s
soccer players participating in the National Collegiate Athletics Association (NCAA) at the
Division 1 level. Thus, the results obtained my not be applicable for other populations,
particularly clinical populations. The data generated from this experiment is in an effort to
generate methods of injury prevention based upon quantifiably activity variables.

64
Chapter 6
Conclusions
The reliability and reproducibility of the results of this paper are excellent, validating the
use of our methods to offer consistent data. Furthermore, the analyses responded predictably
with increases in speed thereby validating their ability to appropriately address changes in
speed. This paper has provided evidence in support of using changes in contact, step, and stride
times as markers for fatigue in exercising individuals. Future research should be dedicated to
exploring DFA and stride variability as they appeared to have the largest change in the fatigued
state. Further, entropy is a method that has been used to try and measure the complexity of gait.
It may serve as a superior assessment of the variation of the between stride differences in gait
components. Changes in sample entropy may also be more sensitive in detecting fatigue than
examining gait symmetry (Schutte et al. 2018), and therefore should be included in future studies
of gait characteristics.
Validation of a fatigue protocol that coaches could implement in season with little impact
on player training load would allow for more accurate descriptions of gait data experienced by
soccer players during regular season training. Also exploration of fatigue responses in track and
field and cross country student athletes would offer a unique perspective on gait deterioration
with fatigue. As track athletes are trained to maintain form through the influence of fatigue, a
similar experiment on this population should yield interesting results.

65
References
Ammann R, Wyss T. Running asymmetries during a 5-km time trial and their changes over
time. In Proceedings of the 3rd International Congress on Sport Sciences Research and
Technology Support (icSPORTS 2015): 161-164.
Aughey RJ. Applications of GPS technologies to field sports. International Journal of Sports
Physiology and Performance 6: 295-310, 2011.
Auvinet B, Berrut G, Touzard C, Moutel L, Collet N, Chaleil D, Barrey E. Reference data
for normal subjects obtained with an accelerometric device. Gait & Posture.16:124-134,
2002.
Avela J, Komi PV. Reduced stretch reflex sensitivity and muscle stiffness after long-lasting
stretch-shortening cycle exercise in humans. European Journal of Applied Physiology
78:403–410, 1998.
Bellenger CR, Arnold JB, Buckley JD, Thewlis D, Fuller JT. Detrended fluctuation analysis
detects altered coordination of running gait in athletes following a heavy period of
training. Journal of Science and Medicine in Sport. 2018 Sep 7.
Barden JM, Clermont CA, Kobsar D, Beauchet O. Accelerometer-based step regularity is
lower in older adults with bilateral knee osteoarthritis. Frontiers in Human Neruoscience
10(625):1-9, 2016.
Barrois R, Gregory T, Oudre L, Moreau T, Truong C, Pulini AA, Vienne A, Labourdette
C, Vayatis N, Buffat S, Yelnik A, de Waele C, Laporte S, Vidal PP, Ricard D. An
automated recording method in clinical consultation to rate the limp in lower limb
osteoarthritis. PLoS ONE 11(10):e0164975, 2016.
Behrens M, Mau-Moeller A, Wassermann F, Plewka A, Bader R, Bruhn S. Repetitive
jumping and sprinting until exhaustion alters hamstring reflex responses and tibial
translation in males and females. Journal of Orthopaedic Research 33:1687-1692, 2015.
Brown AM, Zifchock RA, Hillstrom HJ. The effects of limb dominance and fatigue on
running biomechanics. Gait & Posture. 39:915-919, 2014.
Buchheit M, Gray A, Morin JB. Assessing stride variables and vertical stiffness with GPS-
embedded accelerometers: preliminary insights for the monitoring of neuromuscular
fatigue on the field. Journal of Sports Science and Medicine 14:698-701, 2015.
Butler RJ, Crowell III PH, McClay Davis I. Lower extremity stiffness: implications for
performance and injury. Clinical Biomechanics 18:511-517, 2003.
Byun S, Han JW, Kim TH, Kim KW. Test-retest reliability and concurrent validity of a single
tri-axial accelerometer-based gait analysis in older adults with normal cognition. PLoS
ONE 11(7):e0158956, 2016.
66
Calliess T, Bocklage R, Karkosch R, Marschollek M, windhagen H, Schulze M. Clinical
evaluation of a mobile sensor-based gait anaylsis method for outcome measurement after
knee arthroplasty. Sensors 14:15953-15964, 2014.
Camic CL, Kovacs AJ, Enquist EA, McLain TA, Hill EC. Muscle activation of the
quadriceps and hamstrings during incremental running. Muscle & Nerve 52(6): 1023-
1029, 2015.
Carroll TJ, Taylor JL, Gandevia SC. Recovery of central and peripheral neuromuscular
fatigue after exercise. Journal of Applied Physiology 122(5):1068-76, 2016.
Chapman RF, Laymon AS, Wilhite DP, Mckenzie JM, Tanner DA, Stager JM. Ground
contact time as an indicator of metabolic cost in elite distance runners. Medicine &
Science in Sports & Exercise 44(5):917-925, 2012.
Chumanov ES, Heiderscheit BC, Thelen DG. Hamstring musculotendon dynamics during
stance and swing phases of high speed running. Medicine & Science in Sports &
Exercise 43(3):525-532, 2011.
Chumanov ES, Schache AG, Heiderscheit BC, Thelen DG. Hamstrings are most susceptible
to injury during the late swing phase of sprinting. British Journal of Sports Medicine
46:90, 2012.
Cole MH, van den Hoorn W, Kavanagh JK, Morrison S, Hodges PW, Smeathers JE, Kerr
GK. Concurrent validity of accelerations measured using a tri-axial inertial measurement
unit while walking on firm, compliant and uneven surfaces. PLoS ONE 9(5):e98395,
2014.
Cormack SJ, Mooney MG, Morgan W, McGuigan MR. Influence of neuromuscular fatigue
on accelerometer load in elite Australian football players. International Journal of Sports
Physiology and Performance 8:373-378, 2013.
Cummins C, Orr R, O’Connor H, West C. Global positioning systems (GPS) and
microtechnology sensors in team sports: a systematic review. Sports Medicine 43: 1025-
1042, 2013.
Daly C, McCarthy Persson U, Twycross-Lewis R, Woledge RC, Morrissey D. The
biomechanics of running in athletes with previous hamstring injury: a case-control study.
Scandinavian Journal of Medicine & Science in Sports 26:413-420, 2016.
Decker LM, Cignetti F, Stergiou N. Complexity and human gait. Revista Andaluza de
Medicina del Deporte 3: 2-12, 2010.
Del Din S, Hickey A, Ladha C, Stuart S, Bourke AK, Esser P, Rochester L, Godfrey A.
Instrumented gait assessment with a single wearable: an introductory tutorial [version 1;
referees: 1 approved, 1 approved with reservations]. F1000 Research 5:2323, 2016.
Demonceau M, Donneau AF, Croisier JL, Skawiniak E, Boutaayamou M, Maquet D,
Garraux G. Contribution of a trunk accelerometer system to the characterization of gait
67
in patients with mild-to-moderate Parkinson’s Disease. IEEE Journal of Biomedical and
Health Informatics 19(6):1803-1808, 2015.
De Ste Croix MBA, Hughes J, Lloyd RS, Oliver JL, Read P. Leg stiffness in female soccer
players: inter-session reliability and the fatiguing effects of soccer-specific exercise.
Journal of Strength and Conditioning Research 31(11):3052-3058, 2017.
Drescher U, Koschate J, Schiffer T, Hoffman U. Analysis of cardio-pulmonary and respiratory
kinetics in different body positions: impact of venous return on pulmonary
measurements. European Journal of Applied Physiology 116:1343-1353, 2016.
Ducharme SW, van Emmerik REA. Fractal dynamics, variability, and coordination in human
locomotion. Kinesiology Review 7:26-35, 2018.
Duysens J, van Wezel BMH, van de Crommert HWAA, Faist M, Kooloos JGM. The role of
afferent feedback in the control of hamstrings activity during human gait. European
Journal of Morphology 36(4-5):293-299, 1998.
Echeverria JC, Rodriguez E, Velasco A, Alvarez-Ramirez J. Limb dominance changes in
walking evolution explored by asymmetric correlations in gait dynamics. Physica A
389:1625-1634, 2010.
Elias JJ, Faust AF, Chu YH, Chao EY, Cosgarea AJ. The soleus muscle acts as an agonist for
the anterior cruciate ligament. The American Journal of Sports Medicine 31(2):241-246,
2003.
Ehrmann FE, Duncan CS, Sindhusake D, Franzsen WN, Greene DA. GPS and injury
prevention in professional soccer. The Journal of Strength & Conditioning Research
30(2):360-367, 2016
Fourchet F, Girard O, Kelly L, Horobeanu C, Millet GP. Changes in leg spring behaviour,
plantar loading and foot mobility magnitude induced by an exhaustive treadmill run in
adolescent middle-distance runners. Journal of Science and Medicine in Sport 18:199-
203, 2015.
Fuller JT, Bellenger CR, Thewlis D, Arnold J, Thomson RL, Tsiros MD, Robertson EY,
Buckley JD. Tracking performance changes with running-stride variability when athletes
are functionally overreached. International Journal of Sports Physiology and
Performance 12: 357-363, 2017.
Garcia-Perez JA, Perez-Soriano P, Llana S, Martinez-Nova A, Sanchez-Zuriaga D. Effect
of overground vs treadmill running on plantar pressure: influence of fatigue. Gait &
Posture 38:929-933, 2013.
Gates DH, Dingwell JB. Peripheral neuropathy does not alter the fractal dynamics of stride
intervals of gait. Journal of Applied Physiology 102:965-971, 2007.

68
Gaudino P, Gaudino C, Giampietro A, Minetti AE. Biomechanics and predicted energetics of
sprinting on sand: hints for soccer training. Journal of Science and Medicine in Sport
16:271-275, 2013.
Gilgen-Ammann R, Taube W, Wyss T. Gait asymmetry during 400 to 1000 m high-intensity
track running in relation to injury history. International Journal of Sports Physiology
and Performance 12:S2-157 -S2-160, 2017.
Girard O, Millet G, Slawinski J, Racinais S, Micallef JP. Changes in leg-spring behavior
during a 5000 m self-paced run in differently trained athletes. Science & Sports 25:99-
102, 2010.
Girard O, Micallef JP, Millet GP. Changes in spring-mass model characteristics during
repeated running sprints. European Journal of Applied Physiology 111:125-134, 2011.
Godfrey A, Del Din S, Barry G, Mathers JC, Rochester L. Instrumenting gait with an
accelerometer: a system and algorithm examination. Medical Engineering and Physics
37:400-407, 2015.
Gouwanda D, Arosha Senanayake SMN. Identifying gait asymmetry using gyroscopes-A
cross-correlation and Normalized Symmetry Index approach. Journal of Biomechanics
44:972-978, 2011.
Gow BJ, Hausdorff JM, Manor B, Lipsitz LA, Macklin EA, Bonato P, Novak V, Peng CK,
Ahn AC, Wayne PM. Can Tai Chi training impact fractal stride time dynamics, an index
of gait health, in older adults? Cross-sectional and randomized trial studies. PLoS ONE
12:e0186212, 2017
Hannah R, Folland J, Smith SL, Minshull C. Explosive hamstrings-to-quadriceps force ratio
of males versus females. European Journal of Applied Physiology 115:837-847, 2015.
Harbourne RT, Stergiou N. Movement variability and the use of nonlinear tool: Principles to
guide physical therapist practice. Physical Therapy 89: 267-282, 2009
Hartmann A, Luzi S, Murer K, de Bie RA, de Bruin ED. Concurrent validity of a trunk tri-
axial accelerometer system for gait analysis in older adults. Gait & Posture 29:444-448,
2009.
Hausdorff JM. Gait dynamics, fractals and falls: Finding meaning in the stride-to-stride
fluctuations of human walking. Human Movement Science 26:555-589, 2007.
Hausdorff JM. Gait dynamics in Parkinson’s disease: common and distinct behavior among
stride length, gait variability, and fractal-like scaling. CHAOS 19: 026113, 2009.
Hausdorff JM, Ashkenazy Y, Peng CK, Ivanov PC, Stanley HE, Goldberger AL. When
human walking becomes random walking: fractal analysis and modeling of gait rhythm
fluctuations. Physica A: Statistical Mechanics and its Applications 302: 138-147, 2001.

69
Hausdorff JM, Cudkowicz ME, Firtion R, Wei JY, Goldberger AL. Gait variability and
basal ganglia disorders: stride‐to‐stride variations of gait cycle timing in Parkinson's
disease and Huntington's disease. Movement disorders 13(3):428-37, 1998.
Hausdorff JM, Mitchell SL, Firtion R, Peng CK, Cudkowicz ME, Wei JY, Goldberger AL.
Altered fractal dynamics of gait: reduced stride-interval correlations with aging and
Huntington’s disease. Journal of Applied Physiology 82(1):262-269, 1997.
Hausdorff JM, Peng C-K, Ladin Z, Wei J, Goldberger AL. Is walking a random walk?
Evidence for long-range correlations in stride interval of human gait. Journal of Applied
Physiology 78: 349-358, 1995.
Hausdorff JM, Purdon PL, Peng C-K, Ladin Z, Wei JY, Goldberger AL. Fractal dynamics
of human gait: stability of long-range correlations in stride interval fluctuations. Journal
of Applied Physiology 80:1448-1457, 1996.
Hausdorff JM, Rios DA, Edelberg HK. Gait variability and fall risk in community-living older
adults: a 1-year prospective study. Archives of Physical Medicine and Rehabilitation.
82(8):1050-1056, 2001.
Hausdorff JM, Schaafsma JD, Balash Y, Bartels AL, Gurevich T, Giladi N. Impaired
regulation of stride variability in Parkinson's disease subjects with freezing of gait.
Experimental Brain Research 149(2):187-194, 2003.
Hausdorff JM, Zemany L, Peng C-K, Goldberger AL. Maturation of gait dynamics: stride-to-
stride variability and its temporal organization in children. Journal of Applied Physiology
86: 1040-1047, 1999.
Helbostad JL, Leirfall S, Moe-Nilssen R, Sletvold O. Physical fatigue affects gait
characteristics in older persons. The Journals of Gerontology, Series A: Biological
Sciences and Medical Sciences 62(9):1010-1015, 2007.
Herman T, Giladi N, Gurevich T, Hausdorff JM. Gait instability and fractal dynamics of
older adults with a “cautious” gait: why do certain older adults walk fearfully? Gait &
Posture 21:178-185, 2005.
Higham DG, Pyne DB, Anson JM, Hopkins WG, Eddy A. Comparison of activity profiles and
physiological demands between international rugby sevens matches and training. Journal
of Strength and Conditioning Research 30(5): 1287–1294, 2016.
Hodt-Billington C, Helbostad JL, Vervaat W, Rognsvag T, Moe-Nilssen R. Criteria of gait
asymmetry in patients with hip osteoarthritis. Physiotherapy Theory and Practice
28(2):134-141, 2012.
Hoffman U, Dresher U, Benson AP, Rossiter HB, Essfeld D. Skeletal muscle VO2 kinetics
from cardio-pulmonary measurements: assessing distortions through O2 transport by
means of stochastic work-rate signals and circulatory modelling. European Journal of
Applied Physiology 113:1745-1754, 2013.
70
Hogberg P. Length of stride, stride frequency, “flight” period and maximum distance between
the feet during running with different speeds. Arbeitsphysiologie 14:431-436, 1952.
Hunter I, Smith GA. Preferred and optimal stride frequency, stiffness and economy: changes
with fatigue during 1-h high-intensity run. European Journal of Applied Physiology
100:653-661, 2007.
Iosa M, Paradisi F, Brunelli S, Delussu AS, Pellegrini R, Zenardi D, Paolucci S, Traballesi
M. Assessment of gait stability, harmony, and symmetry in subjects with lower-limb
amputation evaluated by trunk accelerations. JRRD 51(4):623-634, 2014.
Jordan K, Challis JH, Cusumano JP, Newell KM. Stability and time-dependent structure of
gait variability in walking and running. Human Movement Science:28:113-128, 2009.
Jordan K, Challis JH, Newell KM. Long range correlations in the stride interval of running.
Gait & Posture 24:120-125, 2006.
Jordan K, Challis JH, Newell KM. Speed influences on the scaling behavior of gait cycle
fluctuations during treadmill running. Human Movement Science 26(1):87-102, 2007.
Jordan K, Challis JH, Newell KM. Walking speed influences on gait cycle variability. Gait &
Posture 26(1): 128-134, 2007.
Jordan K, Newell KM. The structure of variability in human walking and running is speed-
dependent. Exercise and Sports Sciences Reviews 36(4):200-204, 2008.
Jorgensen L, Crabtree NJ, Reeve J, Jacobsen BK. Ambulatory level and asymmetrical weight
bearing after stroke affects bone loss in the upper and lower part of the femoral neck
differently: bone adaptation after decreased mechanical loading. Bone 27(5):701-707,
2000.
Kobsar D, Osis ST, Hettinga BA, Ferber R. Gait biomechanics and patient-reported function
as predictors of response to a hip strengthening exercise intervention in patients with
knee osteoarthritis. PLoS ONE 10(10)e0139923, 2015.
Koschate J, Drescher U, Brinkmann C, Baum K, Schiffer T, Latsch J, Brixius K,
Hoffmann U. Faster heart rate and muscular oxygen uptake kinetics in type 2 diabetes
patients following endurance training. Applied Physiology, Nutrition, and Metabolism
41:1146-1154, 2016.
Kuitunen S, Komi PV, Kyrolainen H. Knee and ankle stiffness in sprint running. Medicine &
Science in Sports & Exercise 34:166-173, 2002.
Kyrolainen H, Komi PV, Belli A. Changes in muscle activity patterns and kinetics with
increasing running speed. Journal of Strength and Conditioning Research 13:400-406,
1999.

71
Le Bris R, Billat V, Auvinet B, Chaleil D, Hamard L, Barrey E. Effect of fatigue on stride
pattern continuously measured by an accelerometric gait recorder in middle distance
runners. Journal of Sports Medicine and Physical Fitness 46(2):227-231, 2006.
Lehnert M, De Ste Croix M, Zaatar A, Hughes J, Varekova R, Lastovicka O. Muscular and
neuromuscular control following soccer-specific exercise in male youth: changes in
injury risk mechanisms. Scandinavian Journal of Medicine & Science in Sports 27:975-
982, 2017.
Maclaren DP, Gibson H, Parry-Billings MA, Edwards RH. A review of metabolic and
physiological factors in fatigue. Exercise and Sport Sciences Reviews 17(1):29-66, 1989.
Marchand-Pauvert V, Nielsen JB. Modulation of heteronymous reflexes from ankle
dorsiflexors to hamstring muscles during human walking. Experimental Brain Research
142:402-408, 2002.
McGrath D, Greene BR, O’Donovan KJ, Caulfield B. Gyroscope-based assessment of
temporal gait parameters during treadmill walking and running. Sports Engineering
15:207-213, 2012.
McCamley J, Donati M, Grimpampi E, Mazza C. An enhanced estimate of initial contact and
final contact instants of time using lower trunk inertial sensor data. Gait & Posture
36:316-318, 2012.
Meardon SA, Hamill J, Derrick TR. Running injury and stride variability over a prolonged
run. Gait & Posture 33:36-40, 2011.
Mercer JA, Vance J, Hreljac A, Hamill J. Relationship between shock attenuation and stride
length during running at different velocities. European Journal of Applied Physiology
87:403-408, 2002.
Millecamps A, Lowry KA, Brach JS, Perera S, Redfern MS, Sejdić E. Understanding the
effects of pre-processing on extracted signal features from gait accelerometry signals.
Computers in Biology and Medicine 62: 164-174, 2015.
Moe-Nilssen R. A new method for evaluating motor control in gait under real-life environmental
conditions. Part 1: The instrument. Clinical Biomechanics 13: 320-327, 1998.
Moe-Nilsson R, Helbostad JL. Estimation of gait cycle characteristics by trunk accelerometry.
Journal of Biomechanics 37:121-126, 2004.
More RC, Karras BT, Neiman R, Fritschy D, Woo SLY, Daniel DM. Hamstrings—an
anterior cruciate ligament protagonist. An in vitro study. American Journal of Sports
Medicine 21(2):231–237, 1993.
Morin JB, Dalleau G, Kyrolainen H, Jeannin T, Belli A. A simple method for measuring
stiffness during running. Journal of Applied Biomechanics 21:167-180, 2005.

72
Mudie KL, Gupta A, Green S, Clothier PJ. Adaptation of lower limb movement patterns when
maintaining performance in the presence of muscle fatigue. Human Movement Science
48:28-36, 2016.
Nagano H, Begg RK, Sparrow WA, Taylor S. Ageing and limb dominance effects on foot-
ground clearance during treadmill and overground walking. Clinical Biomechanics
26:962-968, 2011.
Nakayama Y, Kudo K, Ohtsuki T. Variability and fluctuation in running gait cycle of trained
runners and non-runners. Gait & Posture 31: 331-335, 2010.
Nelson DL, Hutton RS Dynamic and static stretch responses in muscle spindle receptors in
fatigued muscle. Medicine & Science in Sports & Exercise 17:445–450, 1985.
Nelson-Wong E, Howarth S, Winter DA, Callaghan JP. Application of autocorrelation and
crosscorrelation analyses in human movement and rehabilitation research. Journal of
Orthopaedic & Sports Physical Therapy 39(4):287-295, 2009.
Newell D, van der Laan M. Measures of complexity during walking in chronic non-specific low
back pain patients. Clinical Chiropractic 2010; 13: 8-14.
Nicol C, Komi PV, Horita T, Kyrolainen H, Takala TE Reduced stretch-reflex sensitivity
after exhausting stretch-shortening cycle exercise. European Journal of Applied
Physiology and Occupational Physiology 72:401–409, 1996.
Nilsson J, Thorstensson A. Ground reaction forces at different speeds of human walking and
running. Acta Physiologica Scandinavica 136:217-227, 1989.
Nyland JA, Caborn DNM, Shapiro R, Johnson DL. Fatigue after eccentric quadriceps femoris
work produces earlier gastrocnemius and delayed quadriceps femoris activation during
crossover cutting among normal athletic women. Knee Surgery, Sports Traumatology,
Arthroscopy 5:162-167, 1997.
Oliver JL, De Ste Croix MBA, Lloyd RS, Williams CA. Altered neuromuscular control of leg
stiffness following soccer-specific exercise. European Journal of Applied Physiology
114:2241-2249, 2014.
Patterson KK, Parafianowicz I, Danells CJ, Closson V, Verrier MC, Staines WR, Black SE,
McIlroy WE. Gait asymmetry in community-ambulating stroke survivors. Archive of
Physical Medicine and Rehabilitation 89:304-310, 2008.
Patterson M, McGrath D, Caulfield B. Using a tri-axial accelerometer to detect technique
breakdown due to fatigue in distance runners: a preliminary perspective. 33rd Annual
International Conference of the IEEE EMBS Boston, Massachusetts, August 30 –
September 3, 2011: 6511-6514.
Peng C-K, Havlin S, Stanley HE, Goldberger AL. Quantification of scaling exponents and
cross over phenomena in nonstationary heartbeat time series. CHAOS 5: 82-87, 1995.

73
Rapp W, Brauner T, Weber L, Grau S, Mundermann A, Horstmann T. Improvement of
walking speed and gait symmetry in older patients after hip arthroplasty: a prospective
cohort study. BMC Musculoskeletal Disorders 16:291, 2015.
Rhea CK, Kiefer AW. Patterned variability in gait behavior: How can it be measured and what
does it mean. Gait Biometrics: Basic Patterns, Role of Neurological Disorders and
Effects of Physical Activity. Hauppauge, NY: Nova Science Publishers. 2014:17-44.
Richardson JK, Thies SB, DeMott TK, Ashton-Miller JA. A comparison of gait
characteristics between older women with and without peripheral neuropathy in standard
and challenging environments. Journal of the American Geriatrics Society 52(9):1532-
1537, 2004.
Roberts D, Hamill-Ruth R, Parker B, Maximous S, Clark B, Nelson K. Clinical outcomes
measurement: A new method for evaluating efficacy of low back pain therapy. The
Journal of Pain 5(3):S116, 2004
Sadeghi H, Allard P, Prince F, Labelle H. Symmetry and limb dominance in able-bodied gait:
a review. Gait & Posture 12:34-45, 2000.
Sanchez MC, Bussmann J, Janssen W, Horemans H, Chastin S, Heijenbrok M, Stam H.
Accelerometric assessment of different dimensions of natural walking during the first
year after stroke: recovery of amount, distribution, quality and speed of walking. Journal
of Rehabilitation Medicine 47:714-721, 2015.
Saremi K, Marehbian J, Yan X, Regnaux JP, Elashoff R, Bussel B, Dobkin BH. Reliability
and validity of bilateral thigh and foot accelerometry measures of walking in healthy and
hemiparetic subjects. Neurorehabilitation and Neural Repair 20:297-305, 2006.
Schache AG, Wrigly TV, Baker R, Pandy MG. Biomechanical response to hamstring muscle
strain injury. Gait & Posture 29:332-338, 2009.
Schutte KH, Aeles J, Op De Beeck T, van der Zwaard BC, Venter R, Vanwanseele B.
Surface effects on dynamic stability and loading during outdoor running using wireless
trunk accelerometry. Gait & Posture 48:220-225, 2016.
Schutte KH, Aeles J, Venter R, Berckmans D, Vanwanseele B. Acute effects of outdoor
surfaces on running gait symmetry and regularity assessed by truck accelerometry. 33rd
International Conference on Biomechanics in Sports, Poitiers, France, June 29- July 3,
2015: 703-706.
Schutte KH, Mass EA, Exadaktylos V, Berckmans D, Venter RE, Vanwanseele B. Wireless
tri-axial trunk accelerometer detects deviations in dynamic center of mass motion due to
running-induced fatigue. PLoS One 10(10):e0141957, 2015.
Schutte KH, Sackey S, Venter R, Vanwanseel B. Energy cost of running instability evaluated
with wearable trunk accelerometry. Journal of Applied Physiology, 2017.

74
Schutte KH, Seerden S, Venter R, Vanwanseele B. Fatigue-related asymmetry and instability
during a 3200-m time-trial performance in healthy runners. 34th International Conference
on Biomechanics in Sports, Tsukuba, Japan July 18-22, 2016: 933-936.
Schutte KH, Seerden S, Venter R, Vanwanseele B. Influence of outdoor running fatigue and
medial tibial stress syndrome on accelerometer-based loading and stability. Gait &
Posture 59:222-228, 2018.
Scott MTU, Scott TJ, Kelly VG. The validity and reliability of global positioning systems in
team sport: a brief review. Journal of Strength and Conditioning Research 30(5):1470-
1490, 2016.
Setuain I, Lecumberri P, Izquierdo M. Sprint mechanics return to completion follow-up after
hamstring injury on a professional soccer player: a case study with an inertial sensor unit
based methodological approach. Journal of Biomechanics 63:186-191, 2017.
Shultz SJ, Schmitz RJ, Benjaminse A, Collins M, Ford K, Kulas AS. ACL research retreat
VII: an update on anterior cruciate ligament injury risk factor identification, screening,
and prevention. Journal of Athletic Training 50(10):1076-1093, 2015.
Sinkjaer T, Andersen JB, Larsen B. Soleus stretch reflex modulation during gait in humans.
Journal of Neurophysiology 76(2): 1112-1120, 1996.
Staab W, Hottowitz R, Sohns C, Sohns JM, Gilbert F, Menke J, Niklas A, Lotz J.
Accelerometer and gyroscope based gait analysis using spectral analysis of patients with
osteoarthritis of the knee. Journal of Physical Therapy Science 26:997-1002, 2014.
Tessaro, E, Williams, JH. Validity and reliability of a 15 Hz GPS device for court-based sports
movements. Sport Performance & Science Reports 2018; 1: May 29.
Trojaniello D, Ravaschio A, Hausdorff JM, Cereatti A. Comparative assessment of different
methods for the estimation of gait temporal parameters using a single inertial sensor:
application to elderly, post-stroke, Parkinson’s disease and Huntington’s disease subjects.
Gait & Posture 42:310-316, 2015.
Tura A, Raggi M, Rocchi L, Cutti AG, Chiari L. Gait symmetry and regularity in transfemoral
amputees assessed by trunk accelerations. Journal of Neuroengineering and
Rehabilitation 7:4, 2010.
Valenti G, Bonomi AG, Westerterp KR. Body acceleration as indicator for walking economy
in an ageing population. PLoS ONE 10(10): e0141431, 2015.
Waldron M, Worsfold P, Twist C, Lamb K. Concurrent validity and test-retest reliability of a
global positioning system (GPS) and timing gates to assess sprint performance variables.
Journal of Sports Sciences 29(15):1613-1619, 2011.
Wellman AD, Coad SC, Goulet GC, McLellan CP. Quantification of competitive game
demands of NCAA Division I college football players using global positioning systems.
Journal of Strength and Conditioning Research 30(1): 11–19, 2016.
75
Weyand PG, Sternlight DB, Bellizzi MJ, Wright S. Faster top running speeds are achieved
with greater ground forces not more rapid leg movements. Journal of Applied Physiology
89:1991-1999, 2000.
Willems TM, De Ridder R, Roosen P. The effect of a long-distance run on plantar pressure
distribution during running. Gait & Posture 35:405-409, 2012.
Wundersitz DWT, Gastin PB, Richter C, Robertson SJ, Netto KJ. Validity of a trunk-
mounted accelerometer to assess peak accelerations during walking, jogging and running.
European Journal of Sports Science 15(5):382-390, 2015.
Yang CC, Hsu YL, Shih KS, Lu JM. Real-time gait cycle parameter recognition using a
wearable accelerometry system. Sensors 11:7314-7326, 2011.
Yavuz SU, Mrachacz-Kersting N, Sebik O, Unver MB, Farina D, Turker KS. Human stretch
reflex pathways reexamined. Journal of Neurophysiology 111:602-612, 2014.
Yogev G, Plotnik M, Peretz C, Giladi N, Hausdorff JM. Gait asymmetry in patients with
Parkinson’s disease and elderly fallers: when does the bilateral coordination of gait
require attention? Experimental Brain Research 177:336-346, 2007.
Zifchock RA, Davis I, Hamill J. Kinetic asymmetry in female runners with and without
retrospective tibial stress fractures. Journal of Biomechanics 39(15):2792-2797, 2006.
Zifchock RA, Davis I, Higginson J, McCaw S, Royer T. Side-to-side differences in overuse
running injury susceptibility: a retrospective study. Human Movement Science
27(6):888-902, 2008.
Zijlstra W, Hof AL. Assessment of spatio-temporal gait parameters from trunk accelerations
during human walking. Gait and Posture 18:1-10, 2003.

76
Appendix
The appendix.
Approval Letter and forms are shown for the 2017-2018 period. Renewal of the application was
approved for data collection during 2018-2019
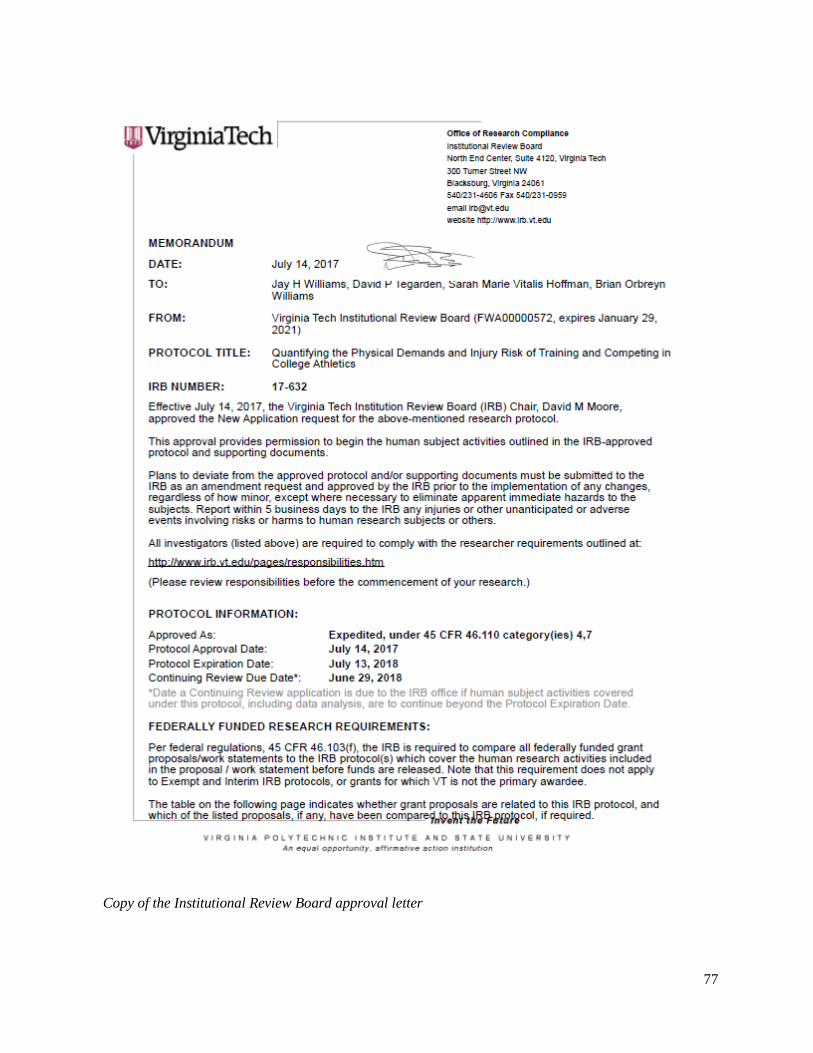
77
Copy of the Institutional Review Board approval letter

78
Copy of the signed Virginia Tech Athletics Department Coach’s Approval form
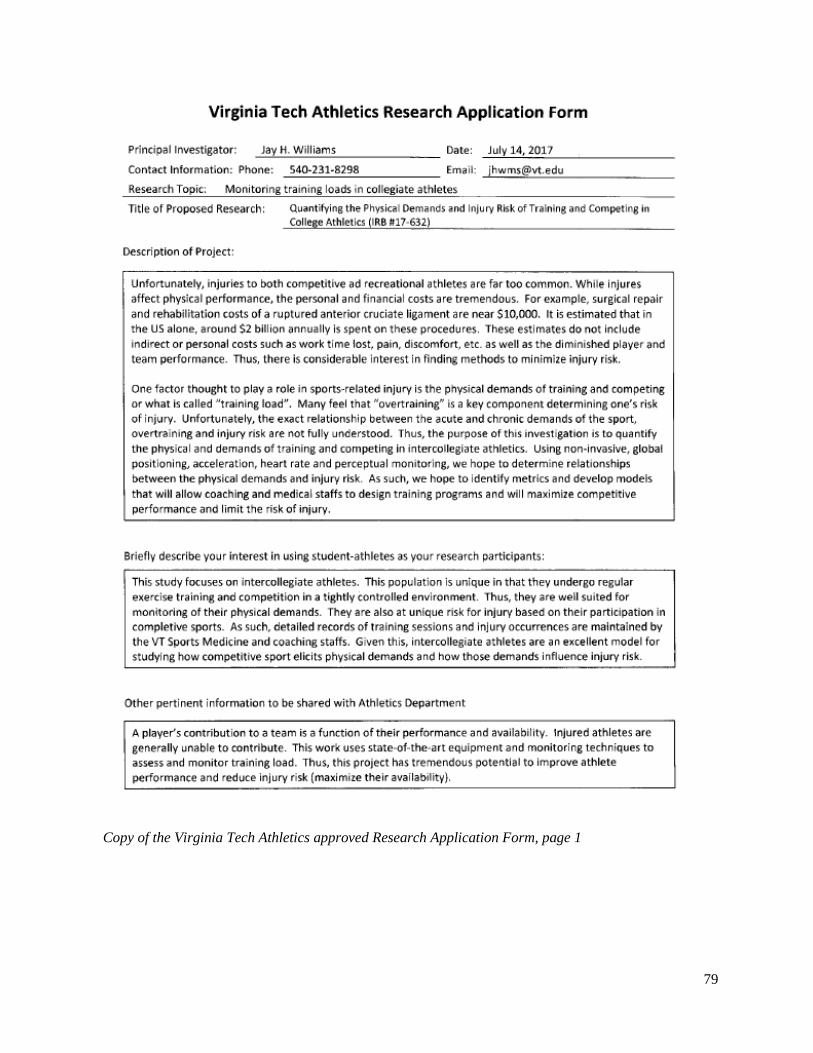
79
Copy of the Virginia Tech Athletics approved Research Application Form, page 1

80
Copy of the Virginia Tech Athletics approved Research Application Form, page 2

81
Copy of the IRB approved Informed Consent form, page 1

82
Copy of the IRB approved Informed Consent form, page 2

83
Copy of the IRB approved Informed Consent form, page 3
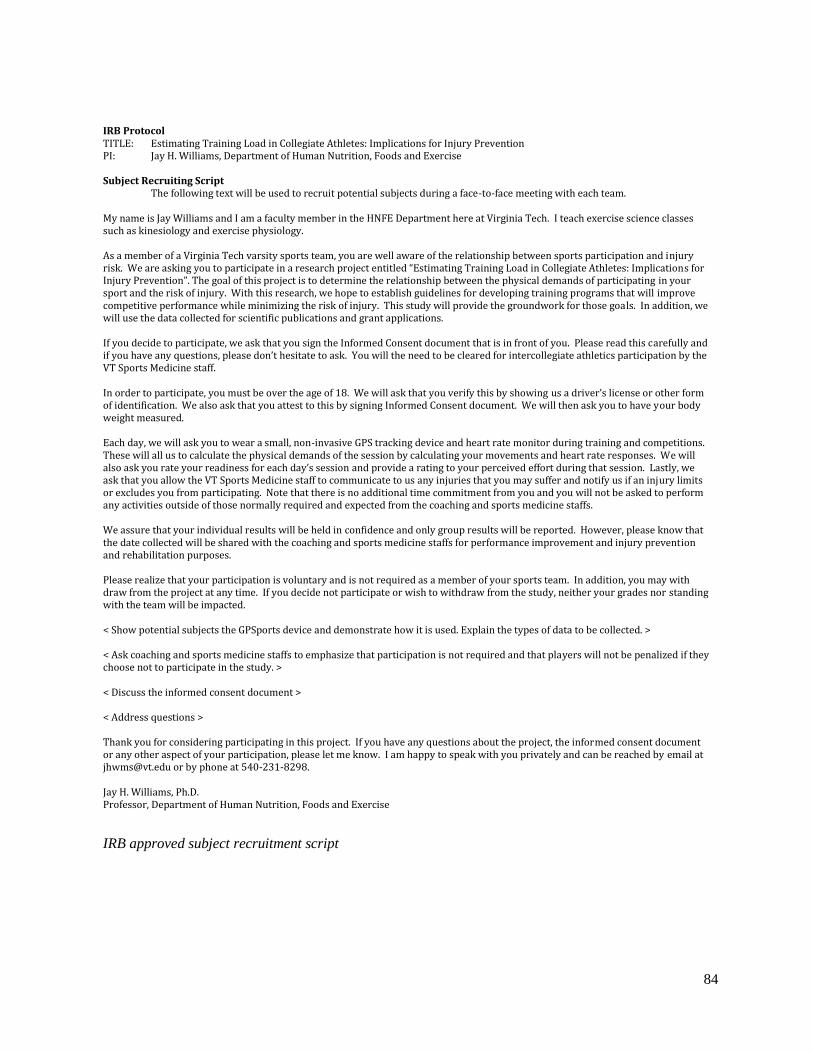
84
IRB Protocol TITLE: Estimating Training Load in Collegiate Athletes: Implications for Injury Prevention PI: Jay H. Williams, Department of Human Nutrition, Foods and Exercise Subject Recruiting Script
The following text will be used to recruit potential subjects during a face-to-face meeting with each team. My name is Jay Williams and I am a faculty member in the HNFE Department here at Virginia Tech. I teach exercise science classes such as kinesiology and exercise physiology. As a member of a Virginia Tech varsity sports team, you are well aware of the relationship between sports participation and injury risk. We are asking you to participate in a research project entitled “Estimating Training Load in Collegiate Athletes: Implications for Injury Prevention”. The goal of this project is to determine the relationship between the physical demands of participating in your sport and the risk of injury. With this research, we hope to establish guidelines for developing training programs that will improve competitive performance while minimizing the risk of injury. This study will provide the groundwork for those goals. In addition, we will use the data collected for scientific publications and grant applications. If you decide to participate, we ask that you sign the Informed Consent document that is in front of you. Please read this carefully and if you have any questions, please don’t hesitate to ask. You will the need to be cleared for intercollegiate athletics participation by the VT Sports Medicine staff. In order to participate, you must be over the age of 18. We will ask that you verify this by showing us a driver’s license or other form of identification. We also ask that you attest to this by signing Informed Consent document. We will then ask you to have your body weight measured. Each day, we will ask you to wear a small, non-invasive GPS tracking device and heart rate monitor during training and competitions. These will all us to calculate the physical demands of the session by calculating your movements and heart rate responses. We will also ask you rate your readiness for each day’s session and provide a rating to your perceived effort during that session. Lastly, we ask that you allow the VT Sports Medicine staff to communicate to us any injuries that you may suffer and notify us if an injury limits or excludes you from participating. Note that there is no additional time commitment from you and you will not be asked to perform any activities outside of those normally required and expected from the coaching and sports medicine staffs. We assure that your individual results will be held in confidence and only group results will be reported. However, please know that the date collected will be shared with the coaching and sports medicine staffs for performance improvement and injury prevention and rehabilitation purposes. Please realize that your participation is voluntary and is not required as a member of your sports team. In addition, you may with draw from the project at any time. If you decide not participate or wish to withdraw from the study, neither your grades nor standing with the team will be impacted. < Show potential subjects the GPSports device and demonstrate how it is used. Explain the types of data to be collected. > < Ask coaching and sports medicine staffs to emphasize that participation is not required and that players will not be penalized if they choose not to participate in the study. > < Discuss the informed consent document > < Address questions > Thank you for considering participating in this project. If you have any questions about the project, the informed consent document or any other aspect of your participation, please let me know. I am happy to speak with you privately and can be reached by email at [email protected] or by phone at 540-231-8298. Jay H. Williams, Ph.D. Professor, Department of Human Nutrition, Foods and Exercise
IRB approved subject recruitment script

85
Graphic used to demonstrate use of the GPSports device.