a pilot randomized controlled trial of exercise to improve...
TRANSCRIPT
A pilot randomized controlled trial of exercise to
improve walking energetics among older adults with
mobility limitation: The HealthySteps Study
by
Kristina J. Collins
Bachelor of Science (Honours), Simon Fraser University, 2015
Thesis Submitted in Partial Fulfillment of the
Requirements for the Degree of
Master of Science
in the
Department of Biomedical Physiology and Kinesiology
Faculty of Science
© Kristina J. Collins
SIMON FRASER UNIVERSITY
Summer 2017
Copyright in this work rests with the author. Please ensure that any reproduction or re-use is done in accordance with the relevant national copyright legislation.
ii
Approval
Name: Kristina Collins
Degree: Master of Science
Title: A pilot randomized controlled trial of exercise to
improve walking energetics among older adults
with mobility limitation: The HealthySteps Study
Examining Committee: Chair: Dr. Thomas Claydon Associate Professor
Dr. Dawn Mackey Senior Supervisor Assistant Professor
Dr. Angela Brooks-Wilson Supervisor Professor
Dr. Jennifer Schrack Supervisor Assistant Professor Epidemiology and Center on Aging and Health Johns Hopkins University
Dr. Kristin Campbell External Examiner Associate Professor Department of Physical Therapy University of British Columbia
Date Defended/Approved: July 11, 2017

iii
Ethics Statement

iv
Abstract
Mobility is a fundamental component of healthy aging; however, mobility limitation is a
prevalent, energetically costly problem among older adults. We conducted a pilot
randomized controlled trial to compare the effects of two, 12-week exercise interventions
(timing and coordination, TC; aerobic walking, AW) to an active control (stretching and
relaxation; SR) on outcomes related to mobility among community-dwelling older adults
with mobility limitation (n=72). At 12 weeks, TC reduced mean energy cost of walking by
13-15% versus SR. Among those with high baseline cost, TC reduced mean energy cost
by 20-26% versus SR. Reductions were maintained at 24-week follow-up. AW had no
effect at 12 or 24 weeks. Fatigability, daily physical activity, endurance, physical
function, and life-space mobility did not change with TC or AW versus SR at 12 or 24
weeks. In summary, 12 weeks of TC, but not AW, improved walking economy among
older adults with mobility limitation.
Keywords: older adults; mobility; energy cost of walking; fatigability; exercise;
randomized controlled trial
v
Acknowledgements
First and foremost, I would like to acknowledge my senior supervisor, Dr. Dawn
Mackey, for her guidance, support, and encouragement throughout this process. Thank
you for the opportunity to work with you, and for being so generous with your time and
expertise. I have learned so much from you throughout this experience.
I would like to thank my supervisory committee members, Drs. Angela Brooks-
Wilson and Jennifer Schrack, for their thoughtful contributions throughout my training. I
would also like to thank my external examiner, Dr. Kristin Campbell, for her willingness
to review my thesis and attend my defense. I appreciate the feedback from my
committee members and examiner, as their suggestions will positively influence my
research and future academic pursuits.
Thank you to the Neuromechanics Group and my fellow graduate students, for
creating a supportive and collaborative training environment, and for providing positive
feedback throughout my training. I would also like to thank my current and former lab
mates in the Aging and Population Health Lab, for sharing their knowledge and
supporting my research endeavours. In particular, I must thank Dr. Chantelle Lachance,
Stephanie Maganja, Tim Ainge, Ashley Kwon, Valeriya Zaborska, and Michal Jurkowski.
In addition, I would like to thank Sabrina Abram for her friendship, encouragement, and
expertise throughout my time as a graduate student. Thank you all for the motivation,
conversations, and laughs, both inside and outside the lab.
Thank you to the HealthySteps Research Team, including the study coordinator,
Michelle Pospisil, and research assistant, Veronica Gant, for their indispensable
involvement while conducting this study. Further, I would like to thank the research staff,
including the fitness instructors, research assessors, and student volunteers, for
facilitating the exercise classes and completing the data collection, the Centre for Hip
Health and Mobility for collaborating on this study, and the Drummond Foundation for
funding the HealthySteps Study. I would also like to acknowledge the contributions of the
HealthySteps participants for volunteering their time.
Most importantly, I would like to thank my family, Eva, Peter, Jenna, Aaron, and
Brooke, and friends for their endless love and support throughout my studies at Simon
Fraser University.
vi
Table of Contents
Approval .......................................................................................................................... ii
Ethics Statement ............................................................................................................ iii
Abstract .......................................................................................................................... iv
Acknowledgements ......................................................................................................... v
Table of Contents ........................................................................................................... vi
List of Tables ................................................................................................................. viii
List of Figures................................................................................................................. ix
List of Acronyms .............................................................................................................. x
Chapter 1. Introduction .............................................................................................. 1
1.1. Older Adult Mobility ............................................................................................... 1
1.1.1. Determinants of Mobility ................................................................................ 1
1.1.2. Mobility Limitation .......................................................................................... 4
1.2. Age-Related Changes in Walking Energetics ........................................................ 5
1.2.1. Energetic Pathway to Mobility Loss ............................................................... 7
1.3. Interventions to Modify Walking Energetics ......................................................... 10
1.3.1. Impairment-Based Training.......................................................................... 10
1.3.2. Motor Skill Training ...................................................................................... 11
Timing & Coordination of Gait Training ................................................................... 11
1.4. Thesis Objectives ................................................................................................ 14
1.4.1. Rationale ..................................................................................................... 14
1.4.2. Objective ..................................................................................................... 14
Chapter 2. Methods .................................................................................................. 16
2.1. Study Design ....................................................................................................... 16
2.2. Recruitment ......................................................................................................... 16
2.3. Participants .......................................................................................................... 16
2.4. Measures ............................................................................................................ 17
2.4.1. Descriptive Measures .................................................................................. 17
Energy Cost of Walking. ......................................................................................... 19
2.4.2. Secondary Outcome Measures ................................................................... 20
Fatigability. ............................................................................................................. 20
Daily Physical Activity. ........................................................................................... 21
Endurance. ............................................................................................................ 21
Physical Function. .................................................................................................. 21
Life-Space Mobility. ................................................................................................ 22
2.5. Randomization .................................................................................................... 22
2.6. Sample Size ........................................................................................................ 22
2.7. Interventions ........................................................................................................ 23
2.7.1. Timing and Coordination of Gait Training (TC)............................................. 23
2.7.2. Outdoor Aerobic Walk Training (AW) ........................................................... 27
2.7.3. Stretching and Relaxation Training (SR) ...................................................... 28
vii
2.8. Assessments ....................................................................................................... 28
2.9. Statistical Analysis ............................................................................................... 28
Chapter 3. Results .................................................................................................... 30
3.1. Flow of Participants and Intervention Adherence ................................................. 30
3.2. Participant Characteristics ................................................................................... 30
3.3. Primary Outcome ................................................................................................. 30
Energy Cost of Treadmill Walking at 0.8 m/s. ......................................................... 33
Energy Cost of Treadmill Walking at Preferred Speed. .......................................... 33
Energy Cost of Overground Walking at Preferred Speed. ...................................... 34
3.4. Secondary Outcomes .......................................................................................... 34
Chapter 4. Discussion .............................................................................................. 48
4.1. Study Limitations ................................................................................................. 50
4.2. Future Directions ................................................................................................. 51
4.3. Conclusion........................................................................................................... 52
References ................................................................................................................... 53
viii
List of Tables
Table 1 Summary of baseline participant characteristics (n=72). ........................ 31
Table 2 Flow of participants through the energy cost of walking tests (n=72). ..... 32
Table 3 Energy cost of walking outcomes. Group comparisons are reported as mean difference (95% CI) based on ANCOVA analyses. ....................... 35
Table 4 Fatigability outcomes. Group comparisons are reported as mean difference (95% CI) based on ANCOVA analyses unless otherwise stated. .................................................................................................... 37
Table 5 Daily physical activity outcomes. Group comparisons are reported as mean difference (95% CI) based on ANCOVA analyses. ....................... 40
Table 6 Endurance outcome. Group comparisons are reported as mean difference (95% CI) based on ANCOVA analysis. .................................. 42
Table 7 Physical function outcomes. Group comparisons are reported as mean difference (95% CI) based on ANCOVA analyses. ................................. 43
Table 8 Life-space mobility outcomes. Group comparisons are reported as mean difference (95% CI) based on ANCOVA analyses unless otherwise stated. .................................................................................................... 44
Table 9 Energy cost of walking outcomes separated into higher or lower than median baseline energy cost for each walk test. Group comparisons are reported as mean difference (95% CI) based on ANCOVA analyses. .... 47

ix
List of Figures
Figure 1 Flow diagram of participants. T0 indicates baseline, T1 indicates 12-week follow-up, and T2 indicates 24-week follow-up. ...................................... 18
Figure 2 Timing and Coordination of Gait Training ............................................... 25
Figure 3 Outdoor Aerobic Walk Training. ............................................................. 26
Figure 4 Stretching and Relaxation Training......................................................... 27
Figure 5 Treadmill energy cost of walking at 0.8 m/s. Intervention effects (n=58): (Top-Left) Individual participant change from T0 to T1. (Top-Right) Mean difference from T0 to T1. Maintenance effects (n=50): (Bottom-Left) Individual participant change from T0 to T2. (Bottom-Right) Mean difference from T0 to T2 for each group. Dashed line represents the median baseline energy cost across all participants. Error bars represent 95% CI. T0: baseline; T1: 12-week follow-up; T2: 24-week follow-up. .... 45
Figure 6 Treadmill energy cost of walking at preffered speed. Intervention effects (n=55): (Top-Left) Individual participant change from T0 to T1. (Top-Right) Mean difference from T0 to T1. Maintenance effects (n=48): (Bottom-Left) Individual participant change from T0 to T2. (Bottom-Right) Mean difference from T0 to T2. Dashed line represents the median baseline energy cost across all participants. Error bars represent 95% CI. T0: baseline; T1: 12-week follow-up; T2: 24-week follow-up. ........................ 46
x
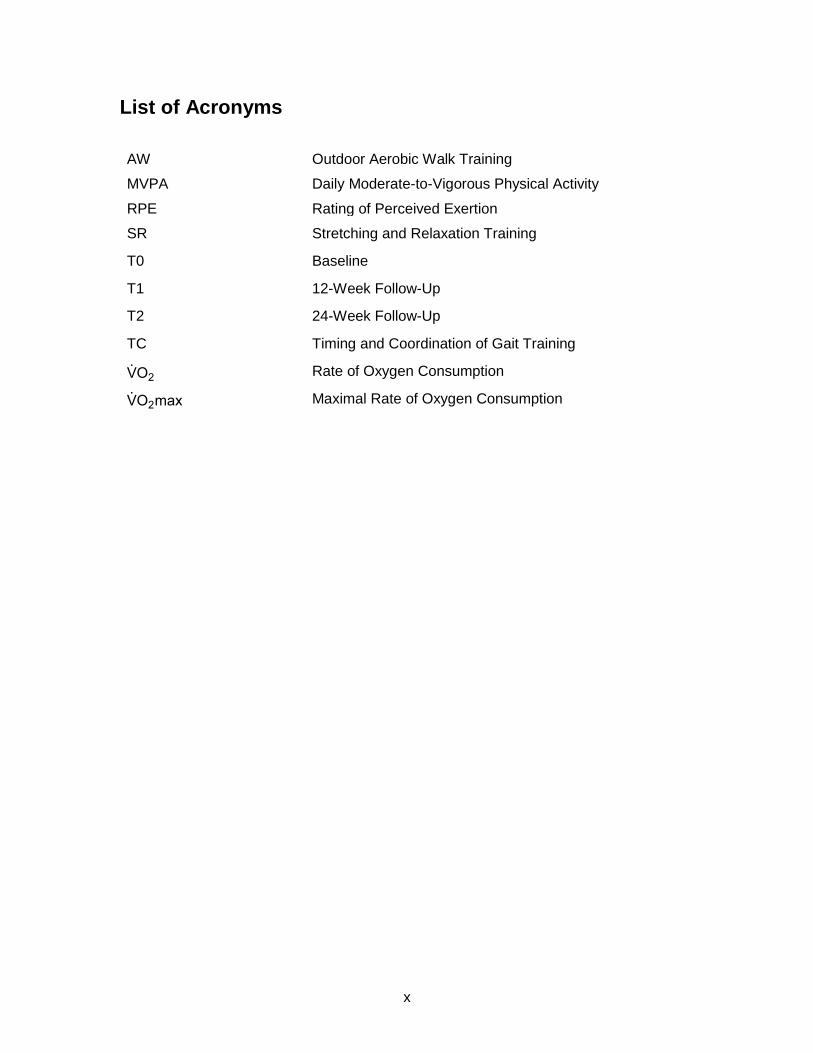
List of Acronyms
AW Outdoor Aerobic Walk Training
MVPA Daily Moderate-to-Vigorous Physical Activity
RPE Rating of Perceived Exertion
SR Stretching and Relaxation Training
T0 Baseline
T1 12-Week Follow-Up
T2 24-Week Follow-Up
TC Timing and Coordination of Gait Training
V̇O2 Rate of Oxygen Consumption
V̇O2max Maximal Rate of Oxygen Consumption
1
Chapter 1. Introduction
1.1. Older Adult Mobility
Mobility is necessary to maintain independent functioning and autonomy, and it is
fundamental to continued participation in processes that optimize health and well-being
across the life-course (Active Ageing: A Policy Framework, 2002). For example, mobility
is necessary to access commodities, make use of neighbourhood facilities, and
participate in meaningful social, cultural, and physical activities. Mobility also promotes
healthy aging as it relates to the basic human need of physical movement (Rantanen,
2013). Mobility is broadly defined as “the ability to move oneself (either independently or
by using assistive devices for transportation) within environments that expand from one’s
home, to the neighbourhood, and to regions beyond” (Webber, Porter, & Menec, 2010).
In this thesis, I investigate if targeted exercise training can reduce the energy
cost of walking and improve markers of mobility among older adults. In Chapter 1, I
provide a concise review of three research areas. Firstly, I introduce the determinants of
older adult mobility, discuss the impact of mobility limitation on older adults, and highlight
important risk factors for mobility limitation. Secondly, I examine age-related changes in
gait and present a framework proposing that walking energetics underlie mobility loss.
Thirdly, I discuss current and emerging interventions aimed to improve walking
energetics. I close Chapter 1 by hypothesizing that exercise training can reduce the
energy cost of walking and alleviate difficulty in walking, and contribute to positive
changes in older adult mobility.
1.1.1. Determinants of Mobility
To conceptualize mobility, Webber and colleagues (Webber et al., 2010) have
proposed a theoretical framework of mobility that takes an interdisciplinary approach that
addresses the complexity of factors influencing mobility. Due to the broad definition of
mobility, the framework includes five main categories of interrelated determinants that
influence mobility throughout the life-course: cognitive, psychosocial, physical,
environmental, and financial. It also emphasizes that gender, culture, and biography
2
greatly impact the five determinants of mobility throughout an individual’s life-course and
across the life spaces in which they are mobile (Webber et al., 2010).
Cognitive Determinants. Cognitive determinants of mobility include such factors
as mental status, memory, processing speed, and executive function (Webber et al.,
2010). For example, deciding to go from one’s home to the grocery store requires
executive function to plan, organize, and complete the task; individuals with lower
executive function may require assistance to help them plan their trip to the grocery
store, whereas, those with higher executive function will be able to appropriately
determine whether they will drive themselves or use another form of transportation. Mild
cognitive impairment and dementia can also seriously challenge older adult mobility,
especially when interacting with the environment outside of one’s home (Webber et al.,
2010).
Psychosocial Determinants. Psychosocial determinants are those factors that
impact confidence, self-efficacy, mental health, social support, coping behaviours, and
relationships that affect interest or motivation to be mobile (Webber et al., 2010).
Expanding upon the example above, whether an older adult will travel to the grocery
store can be influenced by their motivation for social interactions. It is more likely that an
older adult will be mobile if there is a social component to their travel, whether it is
routinely going shopping with a friend, or having a personal interaction with the grocery
store cashier.
Physical Determinants. Physical determinants include reaction time, balance,
biomechanics, vision and hearing impairments, pain, injury, chronic disease, and
physical activity engagement (Webber et al., 2010). For example, pain while walking
may discourage older adults from using active modes of transportation to travel to and
shop at the grocery store or even getting outside of their home regularly.
Environmental Determinants. Environmental determinants include walkability,
stairs, lighting, outdoor terrain, slippery surfaces, weather conditions, modes of
transportation, density, safety, and geographical location of one’s home to services
(Webber et al., 2010). For example, the environment in which an individual interacts
greatly influences the extent and frequency for an older adult to be mobile throughout
their community. Sidewalks with smooth terrain and good lighting positively impact older

3
adults’ mobility, as these conditions are perceived as safe and welcoming for older
adults with impaired balance or physical limitations to participate in active transportation
and maintain their mobility.
Financial Determinants. Financial determinants include income and economic
resources (Webber et al., 2010). For example, older adults with higher incomes have
access to more economic resources. If an older adult with high income requires
assistance to travel to and from the grocery store, he/she can more easily hire in-home
support to help, while another older adult with low income who requires assistance
cannot afford to hire in-home care to help with transporting groceries to their home,
therefore, limiting their mobility.
Gender, Culture, and Biography. Each determinant is largely affected by an
individual’s experiences, opportunities, and behaviours based on their gender, culture,
and biography (Webber et al., 2010). This framework recognizes these factors and how
they influence mobility throughout the life-course. For example, mobility limitations are
not equally distributed amongst those with and without a spouse; those without a spouse
or partner have worse mobility (Umstattd Meyer, Janke, & Beaujean, 2014).
Life-Space. Life spaces are incorporated into the framework, such that as the
levels of life-space expand from one’s home, to their neighbourhood, to their community
and beyond, there are increasing factors, either in number or weight, that influence
mobility (Webber et al., 2010). For example, at the level of one’s home, each
determinant has fewer factors that contribute to overall mobility, as the home is a
relatively known and stable setting; whereas, at the level of the community, the
environment is constantly changing and this adds factors to each determinant that are of
greater importance outside the home.
The determinants of mobility interact with each other to define an older adult’s
mobility status. For example, if an older adult is both confident in their physical ability
and physically capable of transporting themselves to the grocery store, then
psychosocial and physical determinants would be positively influencing the individual’s
ability and interest in being mobile beyond the confines of their home. The determinants,
and the interactions between determinants, allows for the conceptualization of mobility in
different contexts (Webber et al., 2010). The determinants of mobility connect

4
interdisciplinary mobility research and emphasize the complex interactions between
factors that impact mobility. As Webber’s comprehensive framework of mobility outlines,
the maintenance of mobility greatly influences how older adults engage with their
surroundings and their ability to remain active and independent throughout their life
course (Webber et al., 2010). In this thesis, I focus on testing the ability of exercise to
improve physical determinants of mobility in older adults, including energy cost of
walking, fatigability, physical activity, endurance, physical function, and life-space
mobility.
1.1.2. Mobility Limitation
Over the past decade, mobility limitation (typically defined as self-reported
difficulty walking one-quarter mile or climbing one flight of stairs without resting due to a
health or physical problem) has been consistently reported by 30-40% of persons aged
65 years and older in Canada and USA (Fuller-Thomson, Yu, Nuru-Jeter, Guralnik, &
Minkler, 2009; Shumway-Cook, Ciol, Yorkston, Hoffman, & Chan, 2005; Statistics
Canada, 2006). However, because many older adults do not engage in regular volitional
walking and are therefore not aware of their own difficulties, the actual prevalence is
likely higher (Fried, Bandeen-Roche, Chaves, & Johnson, 2000; Simonsick et al., 2008).
Moreover, the burden of mobility limitation is expected to grow significantly in the future.
As in many developed countries, Canada’s population is aging. In 2017, 16.9% (5.9
million) of Canadians are over the age of 65 (Statistics Canada, 2017). And by 2036, it is
projected that older adults will account for approximately 23% of the Canadian
population (Census, 2016). With this growing number of older adults, it is projected that
the number and proportion of older adults with mobility limitation could nearly double by
2036 (Statistics Canada, 2006).
Mobility limitation is a precursor to more severe mobility disability, and increased
dependence in activities of daily living and loneliness (Perissinotto, Stijacic Cenzer, &
Covinsky, 2012; Verbrugge & Jette, 1994), entry into nursing homes (Foley et al., 1992),
and mortality (Hirvensalo, Rantanen, & Heikkinen, 2000; Newman et al., 2006). With an
aging population in Canada, addressing mobility limitations is an important public health
concern, and additional research and action are imperative to combat mobility limitations
and the associated consequences (Statistics Canada, 2006).
5
Several clinical and epidemiological studies have been conducted to assess an
array of risk factors for mobility decline (Stuck et al., 1999). Overall, the findings of these
studies have revealed that age-related decline in mobility is multifactorial in which
demographic and lifestyle factors, health status, and physiological and psychological
functioning contribute to observed changes in mobility over time. Demographic factors
that are associated with increased risk for mobility limitations are advanced age, female
sex, low socioeconomic status, and income level. Higher education is associated with a
reduced risk of mobility decline (Brown & Flood, 2013; Shumway-Cook et al., 2005;
Stuck et al., 1999). Lifestyle factors linked to mobility decline are low levels of physical
activity, current or former smoking, and no or heavy drinking, such that low- to moderate-
alcohol consumption is associated with greater mobility (Brown & Flood, 2013;
Shumway-Cook et al., 2005; Stuck et al., 1999). Health status is a strong predictor of
mobility decline among older adults. Multiple comorbidities are risk factors for mobility
limitations, including blood pressure (e.g., hypertension), cardiovascular (e.g., angina,
heart failure, and stroke), gastrointestinal, hematological, metabolic (e.g., diabetes),
musculoskeletal (e.g., arthritis, hip fracture or broken bones, and joint or back pain),
neurologic, pulmonary diseases, and cancer (Brown & Flood, 2013; Ferrucci et al., 2000;
Shumway-Cook et al., 2005; Stenholm, Shardell, Bandinelli, Guralnik, & Ferrucci, 2015;
Stuck et al., 1999). Additionally, cognitive and visual impairments, poor or fair self-rated
health, multiple medication use, and a history of falls are associated with increased risk
for mobility decline. Normal body mass index is protective against mobility limitations.
Psychosocial functioning, including anxiety, depression, and social isolation are risk
factors for mobility decline (Stuck et al., 1999).
1.2. Age-Related Changes in Walking Energetics
With age, the physical determinants of mobility change. The Baltimore
Longitudinal Study of Aging found that the ability to maintain a fast gait speed over
moderate distances declines with age (Schrack, Simonsick, & Ferrucci, 2013). Gait
speed and energy cost of walking have a U-shaped relationship, at which preferred
walking speed in healthy adults is located at the minimum energy cost (Zarrugh, Todd, &
Ralston, 1974). The relationship holds for individuals with abnormal gait; however, the
curve is shifted upward or to the left, which demonstrates that walking is more
energetically costly and slower for older adults with impaired gait (VanSwearingen &
6
Studenski, 2014). With age, peak walking energy and maximum energy expenditure
decline with age (Schrack et al., 2013). In addition, the energy cost of walking rises
progressively with aging, meaning older adults use more energy to walk a given distance
at a given speed compared to young adults (Schrack et al., 2013). Among healthy young
adults, walking at preferred speed averages approximately 0.15 mL O2/kg/m, whereas,
older adults with difficulty walking may use up to two times this energy to walk at
preferred speed (VanSwearingen et al., 2009; Waters & Mulroy, 1999). These changes
suggest that walking becomes slow and less economical with increasing age.
In addition, as maximum energy expenditure declines and the energy cost of
walking increases, the energy available for productive and essential activity becomes
progressively smaller (Schrack, Zipunnikov, Simonsick, Studenski, & Ferrucci, 2016).
Young and healthy individuals perform most activities of daily living at a workload well
below their maximum energetic capacity and can sustain such activity for a prolonged
period (Ferrucci et al., 2016). With age, overall compression and downward shift of
available energy reduces this capacity substantially, and even the most basic tasks can
challenge energetic limits. As a consequence, walking can be physiologically demanding
for older adults, occupying up to 90% of reserve aerobic capacity (Fiser et al., 2010),
likely contributing to high perceived fatigability during walking (Fiser et al., 2010;
Richardson, Glynn, Ferrucci, & Mackey, 2015).
The mechanisms that contribute to an increase in the energy cost of walking
among older adults are not clearly understood – it is most likely a combination of multiple
factors, including impaired aerobic capacity and metabolic processes and movement
inefficiencies that result from age-related changes in gait biomechanics and movement
control. Movement inefficiencies have been widely studied among aging populations.
Biomechanics, in particular the kinematics and kinetics, of gait change over time. Older
adults often experience decreased gait speed, reduced hip, knee, ankle, pelvic and trunk
range of motion, and reduced ankle and knee power. (Aboutorabi, Arazpour,
Bahramizadeh, Hutchins, & Fadayevatan, 2015). Increased trunk flexion, less hip and
knee extension in mid- to late-stance, reduced ankle dorsiflexion angle at heel-strike,
and decreased ankle plantarflexion and power during toe-off are associated with aging
(Wert, Brach, Perera, & VanSwearingen, 2010). In addition, changes in movement
control of gait are observed among older adults, such that stride length, cadence, and
gait symmetry decrease, and stride width and step time increase. This is to say that the
7
timing of steps is disrupted, as there are increases in double-support time, stance time,
reduced rate of forward momentum, and loss of rhythm while transitioning from stance to
swing phases (Wert et al., 2010). These factors appear to interact and result in
alterations to the timing and coordination of gait with age, which coincide with alterations
in the energy cost of walking.
1.2.1. Energetic Pathway to Mobility Loss
An emerging body of evidence supports the hypothesis that high energy
requirements for daily activities, such as walking, play a central role in the development
of mobility limitation among older adults (Fiser et al., 2010; Schrack, Simonsick, &
Ferrucci, 2010b; Schrack et al., 2013; VanSwearingen et al., 2009). Schrack and
colleagues (Schrack et al., 2010b) contend that, as the energy required for usual walking
approaches maximum energy expenditure, thus inducing fatigue, compensation
strategies, such as reducing walking speed, are used to ensure individuals remain within
the limits of their energetic boundaries. Simply, they hypothesize that the high energy
cost of walking contributes to high fatigability, which negatively impacts mobility.
Fatigability is recognized as a major source of activity limitation, such that older adults
opt to walk more slowly or walk less to minimize feelings of fatigue (Eldadah, 2010; Fiser
et al., 2010; Gill, Desai, Gahbauer, Holford, & Williams, 2001; Vestergaard et al., 2009).
This compensatory strategy can lead to reduced physical activity and, in turn,
endurance, physical function, and mobility decline because of deconditioning.
This hypothesis stresses the importance of older adults retaining the ability to
perform essential activities, such as walking, at a moderate or submaximal level to
maintain mobility. Schrack and colleagues (Schrack et al., 2010b) postulate that
interventions that reduce the energy cost of walking could decrease fatigability, and
thereby may increase daily physical activity, endurance, physical function, and life-space
mobility. Below, I will briefly outline the relevance and measurement of these concepts,
as they are key outcomes in my thesis.
Energy Cost of Walking. Energy cost, commonly referred to as metabolic cost,
energy expenditure, or energy consumption, measures the rate of physiological work, as
determined by the amount of metabolic energy consumed or ATP used, by a specific
motor task (VanSwearingen & Studenski, 2014). It is defined by 1) the rate of oxygen
8
delivered through the blood to the skeletal muscles, and 2) the rate of oxygen extracted
and used by the muscles (G. A. Brooks, Fahey, & Baldwin, 2000). A widely used proxy
measure for the energy cost of walking is the rate of oxygen consumption (V̇O2)
measured over a given distance at a constant submaximal speed. After several minutes
working at a constant load, V̇O2 reaches a level sufficient to meet the energy demands
of the tissue and the energy cost plateaus to achieve a steady state condition (Waters &
Mulroy, 1999). In relation to the above hypothesis, the ability to perform functional tasks,
such as walking, is linked to energy expenditure. For example, if the energy cost of an
activity exceeds a certain threshold, the activity may be performed at a lower intensity or
it may not be completed at all (Schrack, Simonsick, Chaves, & Ferrucci, 2012). In this
paradigm, high energy cost of walking can have profound negative implications on an
individual’s overall mobility status.
Fatigability. Fatigability describes how fatigued an individual is in relation to
performance of a defined activity with a specific intensity, volume, and frequency
(Eldadah, 2010). This outcome normalizes subjective measures of fatigue in relation to
performing a standardized activity to control for self-pacing and allow for meaningful
comparisons between individuals (Eldadah, 2010; Simonsick, Schrack, Glynn, &
Ferrucci, 2014). Fatigability has recently emerged as a construct to systematically
measure fatigue, which is commonly reported among many older adults (Simonsick et
al., 2014). Reports have shown that higher fatigability is associated with greater
frequency of global fatigue symptoms, such as unusual tiredness and lower energy
levels, and worse physical performance (Simonsick et al., 2016). Longitudinal
investigations of fatigability measures are still needed to determine the usefulness in
predicting relevant health outcomes (Simonsick et al., 2014). Fatigability has been linked
to walking energetics; thereby, reducing the energy cost of walking may reduce
fatigability among older adults (Richardson et al., 2015).
Daily Physical Activity. Daily physical activity is “any bodily movement
produced by the skeletal muscles that requires energy expenditure” (Canadian Society
of Exercise Physiology, 2012). Physical activity is a modifiable behavioural risk factor
that is an important determinant for health, fitness, and daily functioning throughout the
life course (Colley et al., 2011). Walking is the most common form of physical activity
amongst older adults, which makes it critical for the maintenance of functional
independence. Low levels of daily physical activity are associated with mortality and

9
many age-related health conditions (Mackey et al., 2011; Schrager, Schrack, Simonsick,
& Ferrucci, 2014). Daily physical activity is linked to energy availability (Schrager et al.,
2014); thus, reducing the energy cost of walking increases available energy, which
facilitates increases in daily physical activity.
Physical Function. Physical function is the ability to perform mobility tasks and
activities of daily living that are essential for maintaining independence and autonomy
(Brach, VanSwearingen, Newman, & Kriska, 2002). Performance based physical
measures are typically used to assess physical function, which can include balance
tasks, ability to stand-up from a chair, and leg strength assessments. A reduction in the
energy cost of walking has been associated with greater physical function amongst older
adults with mobility impairments (Wert et al., 2010).
Endurance. Endurance is a measure of aerobic fitness, or the capacity to do
work, which is predictive of morbidity and mortality among older adults (VanSwearingen
& Studenski, 2014). Endurance is often quantified by the maximal rate of oxygen
consumption (V̇O2max), which approximates the maximal amount of energy that can be
expended within a day (Schrack et al., 2010b). However, it is difficult to assess
endurance in older adults using a maximal exercise test because of safety concerns
outlined by exercise testing guidelines, required oversight by medical professionals, and
high equipment costs (Simonsick, Montgomery, Newman, Bauer, & Harris, 2001).
Instead, extended overground walking tests have been used to assess endurance in
community dwelling older adults (Newman et al., 2006). Although reducing the energy
cost of walking will not directly impact endurance, lowering the energy cost of walking
can increase the energy available to complete daily physical activities that conditions
older adults to improve their endurance.
Life-Space Mobility. Traditional performance-based measures of mobility
assess the ability to complete functional tasks at a given point in time. In contrast, life-
space mobility incorporates the extent, frequency, and independence of movement
within the environment over a period of time (Mackey et al., 2014). The Life-Space
Assessment (Stalvey, Owsley, Sloane, & Ball, 1999) is a novel tool that measures an
individual’s mobility in relation to 1) the distance they move from their home to beyond
their city 2) the frequency of movement per week, and 3) whether the movement is
completed independently. In accordance with the energetic pathway to mobility loss
10
hypothesis, energy is diverted toward the essential systems that maintain homeostatic
regulation due to reduced available energy with age. Since skeletal muscles demand
high amounts of energy, decreased mobility develops to allow for greater energy
utilization toward the regulation of homeostasis (Schrack et al., 2010b). With this
reasoning, reducing the energy cost of walking would allow for more movement and the
ability to move throughout one’s environment and increase life-space mobility
measurements.
1.3. Interventions to Modify Walking Energetics
1.3.1. Impairment-Based Training
Traditionally, exercise interventions have been implemented to mitigate lower
limb impairments related to walking difficulty (Brach & VanSwearingen, 2013). These
multifactorial interventions that focus on impairments associated with age-related
changes include strength, flexibility, and endurance training, with the primary goal to
improve the physiologic capacity of the body systems involved in movement, and the
secondary goal to relieve walking difficulty. By this notion, resistance training is used to
increase the size and quality of lower limb muscle fibers, which enhances muscular
strength and power (Liu & Latham, 2009). Stretching is used to increase joint range of
motion, which increases muscle length or modifies proprioception of the lower limbs to
improve joint functioning in the lower limbs. Endurance training is used to enhance
delivery and extraction of oxygen to muscle fibers, which improves exercise tolerance for
sustained movement during walking. Although standard exercise interventions that
target deficiencies in strength, flexibility, and endurance have led to improvements in
physical function, they do not appear to reduce the energy cost of walking (Mian et al.,
2007; VanSwearingen et al., 2009). An impairment-based intervention approach that
improves the capacity of the body may not be an optimal strategy to directly improve
walking difficulty because this type of training does not update how the body should
utilize its increased capacity for movement (Brach & VanSwearingen, 2013). Rather,
training that aims to reduce the energy cost of walking and incorporates goal-oriented
motor skill training may have a greater effect on reducing functional walking difficulties
among older adults.

11
1.3.2. Motor Skill Training
Timing & Coordination of Gait Training
Walking is a highly skilled motor task, acquired through motor learning, which
requires complex interactions between the motor system, sensory, control, and cognitive
functions (VanSwearingen & Studenski, 2014). Walking integrates the locomotor pattern
of stepping with the cyclic biomechanical phases of gait, while managing the postural
demands to keep the body in an upright position in a smooth, automatic, and efficient
manner. Developed by physical therapists, timing and coordination of gait training is
based on task-oriented motor skill training (Brach & VanSwearingen, 2013;
VanSwearingen & Studenski, 2014). Timing and coordination of gait training targets
correcting biomechanical and neuromuscular deficits in the activation of stepping
patterns, and aims to integrate these patterns with postures involved in each phase of
the gait cycle. It does this by using task-oriented, progressive stepping and walking
tasks, and treadmill-paced practice (VanSwearingen, Perera, Brach, Wert, & Studenski,
2011). The stepping and walking tasks provide recent and relevant movement
experiences in walking, which informs the neural circuity that the capacity of the body’s
systems have changed and they need to be updated in order for older adults to select a
correct motor plan (V. B. Brooks, 1986). The goal is to train the older adult to select an
appropriate motor plan for a given walking task that minimizes the neural, muscle, and
joint motion requirements to successfully complete the task (Brach & VanSwearingen,
2013; Brach et al., 2015; V. B. Brooks, 1986). With each movement experience, more
information is gained and adjustments are made to the motor plan selection for various
changes in limb positions, muscle activation, and postural control (Brach &
VanSwearingen, 2013).
Four components of task-oriented motor skill training were included in the
development of the timing and coordination of gait training program (Brach &
VanSwearingen, 2013): defined movement goal; move to gain knowledge; practice to
refine and develop a repertoire of motor plans; and challenges to select the optimal
motor plan. These components provide different movement experiences which allow the
body to learn and adapt to task demands.
1. Defined movement goal. Defining the goal of the task limits the degrees of
freedom and increases the likelihood that the appropriate neuromuscular
12
circuitry will be activated to generate the desired motor sequence of muscles
and movements (Brach & VanSwearingen, 2013). Having a defined goal for
step initiation in gait, such as ‘step across’, initiates forward momentum within
the gait cycle. It does not require older adults to consciously focus their
attention on recruiting specific muscles or timing the movement series; rather,
by stepping across, the center of mass automatically accelerates forward to
continue the gait cycle.
2. Movement to gain knowledge. Movement through different muscle activation
patterns, which requires the smooth transition between agonist and
antagonist muscle groups within the gait cycle, facilitates experience and
movement-related feedback of the locomotor pattern of walking (Brach &
VanSwearingen, 2013). Moving through different stepping patterns, such as
‘step backward and across’ prior to stepping forward and across, provides the
experience of smoothly moving the body’s center of mass without asking an
older adult to consciously think about weight shifting and progression.
3. Practice to refine and develop a repertoire of motor plans. Accurate practice
of the selected motor plan drives experience-dependent changes in neural
connectivity (Brach & VanSwearingen, 2013). First, experience with a given
task is required to select an accurate motor plan. Second, repetition is
needed to become skilled at the task. Repeating the same stepping and
walking patterns during multiple training sessions promotes skilled
movement. Once the mover becomes skilled, the stepping and walking
patterns are incorporated into modified tasks at subsequent sessions,
promoting refinement of the motor skill acquisition.
4. Challenges to select the optimal motor plan. Challenges to the accuracy,
amplitude, and direction of movement enhances motor skill acquisition (Brach
& VanSwearingen, 2013). The overall goal is to promote problem-solving and
to focus on the movement goal of the task, which minimizes attention on the
specific task components. By introducing challenges in a controlled setting,
the motor program is able to enhance its ability to recognize, select, and
modify motor plans to accomplish tasks encountered in daily life. Walking in

13
an oval path or walking past another individual are tasks that add variability to
the motor program and promote the expansion of motor skill.
Throughout each component, feedback of successful task performance
enhances motor skill outcomes, as the individual’s neuromuscular system is rewarded,
which reinforces the motor plan selection (VanSwearingen & Studenski, 2014).
Timing and coordination of gait training has been implemented in two
randomized control trials (Brach et al., 2015; Brach, VanSwearingen, Perera, Wert, &
Studenski, 2013; VanSwearingen et al., 2009, 2011). In the first study, among older
adults selected for slow and variable gait, 12 weeks of one-to-one physical therapist
instructed timing and coordination training reduced the energy cost of walking by 15%
(0.10 mL of O2/kg/m) compared to a standard exercise group (VanSwearingen et al.,
2009). Furthermore, among those with high baseline energy cost (>median across all
participants), the timing and coordination of gait training reduced the energy cost of
walking by 0.15 mL of O2/kg/m compared to the standard exercise group. In the second
study, among older adults with subclinical gait dysfunction, 12 weeks of timing and
coordination of gait training increased the number of participants who had a normal
energy cost of walking, although the mean energy cost of walking was not reduced over
the intervention compared to the standard exercise group (Brach et al., 2013).
In addition to reductions in the energy cost of walking, timing and coordination of
gait training has been reported to increase walking confidence, gait speed, and motor
control during walking tasks, and decrease self-reported disability compared to standard
exercise (Brach et al., 2013; VanSwearingen et al., 2009). Timing and coordination of
gait training has also improved double support time variability, the time spent with two
feet in contact with the ground, and led to greater improvements in the smoothness of
walking, both markers of motor skill, compared to standard exercise (Brach et al., 2015).
It is important to note that walking endurance also increased in both the timing and
coordination group and the standard exercise group, but no significant differences were
observed between groups (Brach et al., 2013). Physical function, physical activity, and
lower-extremity functioning have also been assessed in subsequent studies; however,
no differences were found between pre- and post-measurements. Definitive trials are still
needed to assess these outcomes (Brach et al., 2013; VanSwearingen et al., 2011).
14
1.4. Thesis Objectives
1.4.1. Rationale
The population of older adults in Canada will almost double in the next 20 years;
therefore, the prevention and treatment of age-related mobility limitation is a major
clinical and public health priority. Although there have been promising findings from
previous trials of task-oriented motor skill training, it remains unknown whether a
reduction in energy cost can be sustained following timing and coordination of gait
training cessation, and there has been limited investigation of the intervention effects on
fatigability, daily physical activity, endurance, physical function, and mobility. Moreover,
the effectiveness of the timing and coordination of gait training intervention has not been
reported when delivered in small-group settings by certified fitness instructors to
community-dwelling older adults. Such a delivery mechanism would be more scalable
and cost effective than the one-to-one physical therapist led training used in the past.
Alternatively, aerobic conditioning and walking practice may improve walking
energetics. Aerobic exercise improves oxidative metabolism in the active muscles and
practice is a fundamental component of motor learning to enhance motor skill. Thus, the
regular practice of walking may also improve gait efficiency, but no randomized
controlled trial to date has assessed the effect of aerobic walking on the energy cost of
walking.
1.4.2. Objective
The objective of my thesis was to test the hypothesis that two independent, 12-
week, twice-weekly small-group exercise programs (timing and coordination; aerobic
walking) could reduce the energy cost of walking and fatigability, and increase daily
physical activity, endurance, physical function, and life-space mobility among
community-dwelling older adults with mobility limitation, relative to an active control
(stretching and relaxation).
15
In my thesis, I use data from the HealthySteps Study, a pilot randomized control
trial of exercise training in older adults with mobility limitations. In Chapter 2, I describe
the design and methods of the study. In Chapter 3, I report the effects of the exercise
interventions on the study’s primary and secondary outcomes. Finally, in Chapter 4, I
discuss the findings, limitations, and future directions of this research.

16
Chapter 2. Methods
2.1. Study Design
We conducted a three-arm, 12-week, pilot randomized controlled trial of exercise
among older adults with mobility limitation who were able to ambulate independently
(ClinicalTrials.gov #NCT01740505). Participants were assessed at three time points:
baseline (T0); 12-weeks (end of intervention phase, T1); 24-weeks (end of maintenance
phase, T2). The trial was approved by the Research Ethics Boards at Simon Fraser
University and Vancouver Coastal Health Research Institute, and was conducted at the
Centre for Hip Health and Mobility in Vancouver, British Columbia, from February to
November 2013. All participants provided written informed consent.
2.2. Recruitment
Recruitment was primarily focused on newspaper, poster, and email
advertisement in the Vancouver and Burnaby area. Newspapers targeted were the
Vancouver Courier, Vancouver Sun, Coffee News, Black Press, Burnaby Now, and
Royal City Record. Posters were displayed in the Vancouver General Hospital corridors
and common areas, such as entrance bulletins, elevators, and cafeterias, at community
centers and libraries in both Vancouver and Burnaby, and at local grocery stores.
Posters were also listed on websites, including Craigslist, Backpage, and Kijiji. In
addition, email advertisements were sent to all Vancouver General Hospital staff.
Incentives were listed on advertisements, which highlighted participants would receive
free exercise classes and functional assessments, and would be paid $20 for each
assessment completed.
2.3. Participants
Community-dwelling men (n=19) and women (n=53) were recruited from the
Vancouver area from February to April 2013. Individuals that met the following criteria
during telephone screening were eligible for inclusion: 1) ≥65 years; 2) living
independently in the community; 3) reported mobility limitation, defined as any difficulty
walking one quarter mile (i.e., 2-3 blocks) outside on level ground or climbing one flight
17
of stairs (i.e., 10 steps) without resting due to a health or physical problem (Simonsick et
al., 2008); 4) able to walk without assistance of a device or another person; and 5)
willing to be randomized to one of three intervention groups. Similar to past research
(Richardson et al., 2015), we excluded those who presented with any of the following: 1)
history of medical conditions that might alter gait energetics or the ability to safely
complete treadmill walking tests or exercise classes, which included hip fracture or
stroke in past 12 months, cerebral hemorrhage in past 6 months, heart attack,
angioplasty, or heart surgery in past 3 months, chest pain during walking in past 30
days, current treatment for shortness of breath or a lung condition, usual or excessive
aching, stiffness, or pain in lower limbs and joints while walking, 2) participation in an
exercise trial in past 6 months, 3) reported walking for ≥30 minutes, twice per week at a
self-identified moderate-to-vigorous intensity, 4) were unable to wear an armband
activity monitor continuously for one week because of left arm disability, participation in a
water-based activity more than once per week, or household use of supplemental
oxygen, or 5) did not speak, write, or understand English fluently. During telephone
screening, we assessed exercise readiness with the PAR-Q (Canadian Society of
Exercise Physiology, 2002); individuals who answered ‘yes’ to any of the questions were
advised to discuss their answers with their physician.
Following telephone screening, eligible participants were mailed a package
containing additional study information, informed consent form, and letter to be signed
by their physician indicating their appropriateness to participate in an exercise training
program. They were also asked to attend a 60-minute in-person information session
which provided details about the intervention groups and randomization and concluded
with the provision of written informed consent. Figure 1 shows participant flow through
the study stages (Schulz, Altman, & Moher, 2010).
2.4. Measures
2.4.1. Descriptive Measures
Height was measured with a wall-mounted Harpenden stadiometer, and weight was
measured with a standard balance beam digital scale (both SECA model 2841300109).
Body mass index was calculated as weight (kg) divided by the square of height (m2).
Grip strength of both hands was measured with a handheld dynamometer

18
Figure 1 Flow diagram of participants. T0 indicates baseline, T1 indicates 12-week follow-up, and T2 indicates 24-week follow-up.
Average adherence was calculated by excluding the seven participants that withdrew from the HealthySteps Study between T0 and T1. Average adherence for the participants that attended at least one intervention class was 84% for TC, 75% for AW, and 84% for SR.
196 Telephone Screens
80 Information Session
78 Informed Consent
276 Individual Contacts
74 Baseline Assessment
4 Did not continue
3 Health concerns
1 Long absence in summer
72 Randomization to Interventions
24 Allocation to Timing & Coordination 24 Allocation to Stretching & Relaxation
Withdrew
1 Moved away
Intervention adherence - 86%
23 Attempted 12-week assessment 20 Attempted 12-week assessment 22 Attempted 12-week assessment
Withdrew
4 Did not like the program
Intervention adherence - 81%
Withdrew
2 Lost contact due to illness
Intervention adherence - 90%
31 Did not continue
20 No longer interested or lost contact
6 Health and safety concerns
5 Doctor did not consent
2 Did not continue
1 Doctor did not consent
1 Lost contact
2 Excluded
1 Requires assistive device
1 Disliked Cosmed mask
80 Did not receive screening
34 Excluded before screening
46 No longer interested or lost contact
85 Ineligible
31 No mobility limitation
23 Medical conditions that exercise is contraindicated
14 Require assistive device
14 Walks or swims for exercise > 2 times per week
2 Lives in assistive living
1 Refused to divulge age
111 Eligible Participants
Screen
Contacts
T0 Assessment
Randomized
EN
RO
LL
ME
NT
Consented
AL
LO
CA
TIO
NF
OL
LO
W-U
P T1 Assessment T1 Assessment T1 Assessment
23 Attempted 24-week assessment 20 Attempted 24-week assessment 22 Attempted 24-week assessment
T2 Assessment T2 Assessment T2 Assessment
AN
AL
YS
IS
Measurements
22 0.8 m/s walk
21 Preferred speed walk
22 3-minute walk
22 400-m walk
23 Questionnaires
22 SPPB
21 Armband
Measurements
17 0.8 m/s walk
18 Preferred speed walk
18 3-minute walk
17 400-m walk
20 Questionnaires
19 SPPB
17 Armband
Measurements
18 0.8 m/s walk
16 Preferred speed walk
17 3-minute walk
17 400-m walk
22 Questionnaires
21 SPPB
18 Armband
Measurements
18 0.8 m/s walk
17 Preferred speed walk
19 3-minute walk
19 400-m walk
23 Questionnaires
21 SPPB
19 Armband
Measurements
17 0.8 m/s walk
15 Preferred speed walk
15 3-minute walk
15 400-m walk
22 Questionnaires
19 SPPB
18 Armband
Measurements
15 0.8 m/s walk
16 Preferred speed walk
16 3-minute walk
14 400-m walk
20 Questionnaires
18 SPPB
15 Armband
Eligible
1 Mailed assessment 2 Mailed assessment 3 Mailed assessment
4 Mailed assessment 4 Mailed assessment 4 Mailed assessment
65 Completed T0 & T1 Assessments
Intervention Effects
65 Completed T0 & T2 Assessments
Maintenance Effects
24 Allocation to Aerobic Walking
19
(Jamar Plus Digital Hand Dynamometer). Global cognitive function was assessed with
the Mini Mental State Examination (Folstein, Folstein, & McHugh, 1975; Teng & Chui,
1987). Racial background, smoking history, alcohol use, previous physician diagnoses of
medical conditions, and self-rated health were ascertained by standard questionnaires
developed by the HealthySteps Study research personnel. Depressive symptoms were
assessed with the 20-item Center for Epidemiologic Studies Depression Scale (CES-D)
(Radloff, 1977).
Primary Outcome Measure
Energy Cost of Walking. We determined the mean energy cost of walking
(mL/kg/m) during three submaximal walking tests (two treadmill, one overground) by
measuring the rate of oxygen consumption (V̇O2) in mL/min via open circuit indirect
calorimetry with a portable metabolic system (Cosmed K4b2, Cosmed, Rome, Italy)
(Schrack, Simonsick, & Ferrucci, 2010a). Prior to testing, the Cosmed was warmed-up
for a minimum of 20 minutes, and the O2 and CO2 analyzers were calibrated using
reference gases of known concentrations according to the manufacturer’s instructions.
Participants were ineligible for walking tests if blood pressure was > 180/110 mmHg, or
resting heart rate was > 120 bpm. Wearing a light weight (<3.5 lbs) portable metabolic
monitor, such as the Cosmed K4b2, does not impact gait characteristics of older adults
with mobility limitation (Wert, Vanswearingen, Perera, Studenski, & Brach, 2016).
After being outfitted with the Cosmed, participants sat for two minutes to adapt to
the equipment. Prior to beginning the two treadmill tests, participants were given time to
become familiar with treadmill walking before data was collected. Participants then
walked at sub-maximal intensity for 5 minutes at 0.8 m/s and 6-meter overground
preferred speed on a motor-driven treadmill (0° incline). The standard speed of 0.8 m/s
was chosen to maximize participant inclusion at a speed that was not uncomfortably
slow for participants (Richardson et al., 2015). Next, participants walked for 3 minutes on
an overground course (20-meter per segment, 40 meters per lap) with the instruction to
“walk at your usual pace without overexerting yourself”, which has application to
everyday walking. Indirect calorimetry measures of oxygen consumption during
overground walking have high test-retest reliability in older adults with mobility limitation
(Wert, VanSwearingen, Perera, & Brach, 2015). Five-minute rest breaks were provided
between each walking test to minimize fatigue.
20
To calculate mean V̇O2 during steady state for each test, the beginning minutes
of breath-by-breath data were discarded to allow participants to adjust to the workload
and reach stable V̇O2, the remaining data were averaged. If the 5-minute test was
completed, we discarded the first 3 minutes of data and averaged over the final 2
minutes of data. If the participant or examiner chose to end the test early (such that test
duration was between 3 and 5 minutes), we discarded the first 2 minutes of data and
averaged over the remaining minutes. If the 3-minute overground test was completed,
we discarded the first 2 minutes of data and averaged over the final 1 minute. If the
treadmill or overground test duration was less than 3 minutes, we investigated the data
on a case-by-case basis to determine if the participant reached a stable rate of oxygen
consumption. After averaging, mean V̇O2 was converted to mean energy cost of walking
per distance unit (mL/kg/m) using the participant’s measured weight (kg) and average
walking speed (m/s) (Richardson et al., 2015).
2.4.2. Secondary Outcome Measures
To understand the range of effects that exercise training may have on older
adults with mobility limitation, we assessed secondary outcomes related to the World
Health Organization International Classification of Functioning, Disability, and Health
(World Health Organization, 2002) domains of activity, defined as execution of a task or
action by an individual, and participation, defined as involvement in a life situation.
Activity outcomes included fatigability, endurance, and physical function, and
participation outcomes included daily physical activity and life-space mobility.
Fatigability. We assessed fatigability using three different measures. Perceived
fatigability, defined as self-reported fatigue in relation to a standardized task (Eldadah,
2010), was assessed by the Borg Rating of Perceived Exertion (RPE) Scale from 6-20
(Borg, 1982) at the end of the three walking tests (0.8 m/s and 6-m overground preferred
speed treadmill tests and the 3-minute overground test) (Richardson et al., 2015).
Performance deterioration, defined as decrements in performance during objective tests
of physical function, was assessed via a 400-meter, 20-meter per segment, overground
walk (Simonsick et al., 2014). Participants were instructed to “walk as quickly as you
can, without running, at a pace you can maintain” (Newman et al., 2006; Simonsick, Fan,
& Fleg, 2006). We identified participants with performance deterioration if they did not
21
attempt the 400-meter walk, did not complete the 400-meter walk, or had ≥6.5% decline
in pace between the second and ninth laps of the 400-meter walk (Simonsick et al.,
2014). The Pittsburgh Fatigability Scale assessed physical fatigability (Glynn et al.,
2015); participants rated their physical fatigue from 0 (‘No Fatigue’) to 5 (‘Extreme
Fatigue’) in relation to 10 activities of a specified intensity and duration. We calculated
the Physical Fatigability Score (range 0-50) by summing the ratings for the activities
(Glynn et al., 2015).
Daily Physical Activity. We measured daily physical activity using a
SenseWear Pro Armband (Bodymedia Inc., Pittsburgh, PA) worn for 7 days following
each assessment (Jakicic et al., 2004; Mackey et al., 2011). Mean time (mins/day) spent
in moderate-to-vigorous physical activity (MVPA, 3-6+ METs), mean number of steps per
day, and mean daily energy expenditure (kilocalories/day) were calculated over a
minimum of 5 valid wear days (wear time > 90% of 24 hours). We also measured self-
reported occupational, household, and leisure physical activities over the past 7 days
using the Physical Activity Scale for the Elderly (PASE) (Washburn, Smith, Jette, &
Janney, 1993). We scored the questionnaire by multiplying the amount of time spent in
each type of activity (hours per 7 days) by the corresponding intensity weight and
summing across all activities; for possible scores ranging from 0 to about 400
(Washburn et al., 1993).
Endurance. We measured endurance as the time (minutes) to complete the
400-meter, 20-meter per segment, overground walk described above with the instruction
to “walk as quickly as you can, without running, at a pace you can maintain” (Newman et
al., 2006; Simonsick et al., 2006), as described above.
Physical Function. We implemented the Short Physical Performance Battery
(SPPB) to assess: standing balance, preferred gait speed over 6 meters, and ability and
time to complete five repeated chair stands (Guralnik, Ferrucci, Simonsick, Salive, &
Wallace, 1995). Standing balance was assessed by having participants hold three
positions (side-by-side, semi-tandem, and tandem) for 10 seconds. Participants then
completed two timed 6-meter walks at preferred speed. Lastly, participants were timed
while they completed five repeated chair stands as fast as they could. Inability to perform
any individual component of the battery resulted in a score of 0, while completion of the
maneuver resulted in a score of 1 to 4 based on the time to completion. We summed the
22
component scores to obtain an aggregate score from 0 to 12 (Guralnik et al., 1995). In
addition, gait speed was assessed on a 3-minute overground course. Participants were
instructed to “walk at your usual pace without overexerting yourself”, as described
above.
Life-Space Mobility. We conducted the Life-Space Assessment (Peel et al.,
2005) to examine the extent, frequency, and independence of movement during four
weeks prior to assessment across five levels of life-space (1=outside bedroom,
2=outside home, 3=neighbourhood, 4=town, 5=outside town). The Life-Space
Questionnaire was scored by multiplying the life-space level (1-5), by a value for
independence (1=use of another person with or without equipment, 1.5=use of
equipment only, 2=no assistance) by a value for frequency (1=less than 1 time/week,
2=1-3 times/week, 3=4-6 times/week, 4=daily), then summing across five life-space
levels; composite scores range from 0 (restricted to one’s bedroom on a daily basis) to
120 (travels out of one’s town without assistance on a daily basis) (Peel et al., 2005). We
also identified participants who had restricted life-space, defined as confinement to one’s
neighbourhood if assistance was not used (Mackey et al., 2014; Stalvey et al., 1999).
2.5. Randomization
Randomization of participants was performed after T0 assessments were
complete. The randomization sequence was computer generated and concealed by a
research assistant until interventions were assigned. Participants were randomized and
enrolled by the research assistant, in 1:1:1 ratio.
2.6. Sample Size
We calculated that 22 participants per group were required to yield statistical
power of 0.80 to detect a clinically meaningful 15% reduction in the energy cost of
walking between the exercise and control groups with a two-sided alpha of 0.05 and
20% loss to follow-up over 12 weeks. We estimated baseline mean energy cost of
walking on a treadmill at 0.8 m/s with 0° incline would be between 0.25 and 0.30
mL/kg/m with SD of 0.06 mL/kg/m based on data from community-dwelling adults aged
70-89 years in the Study of Energy and Aging Pilot (Richardson et al., 2015).
23
2.7. Interventions
Participants were scheduled for two, small-group (eight or fewer participants), 60-
minute classes per week for 12 weeks from May to July 2013. Classes were led by
certified fitness instructors who received in-person training specific to three possible
interventions: timing and coordination of gait training (TC), outdoor aerobic walk training
(AW), and stretching and relaxation training (SR). All classes involved a 10-minute
warm-up, 40 minutes of intervention-specific content, and 10-minute cool down.
Summaries of the interventions are included below. Participants were not permitted to
attend classes for which they were not assigned. When a participant missed two
consecutive classes, follow-up phone calls were made to provide support and encourage
continued adherence. Participants were not blinded to their assigned intervention;
however, they were instructed not to describe their group assignment with others who
were also participating in the study. To ensure consistent program delivery throughout
the study, quality assurance assessments were conducted by the project coordinator
every four weeks to correct inconsistencies in intervention protocol. Following
intervention end, all participants were encouraged to continue exercising on their own
over the following 12 weeks, and were given a handout with examples of home
exercises and a list of exercise programs within their communities.
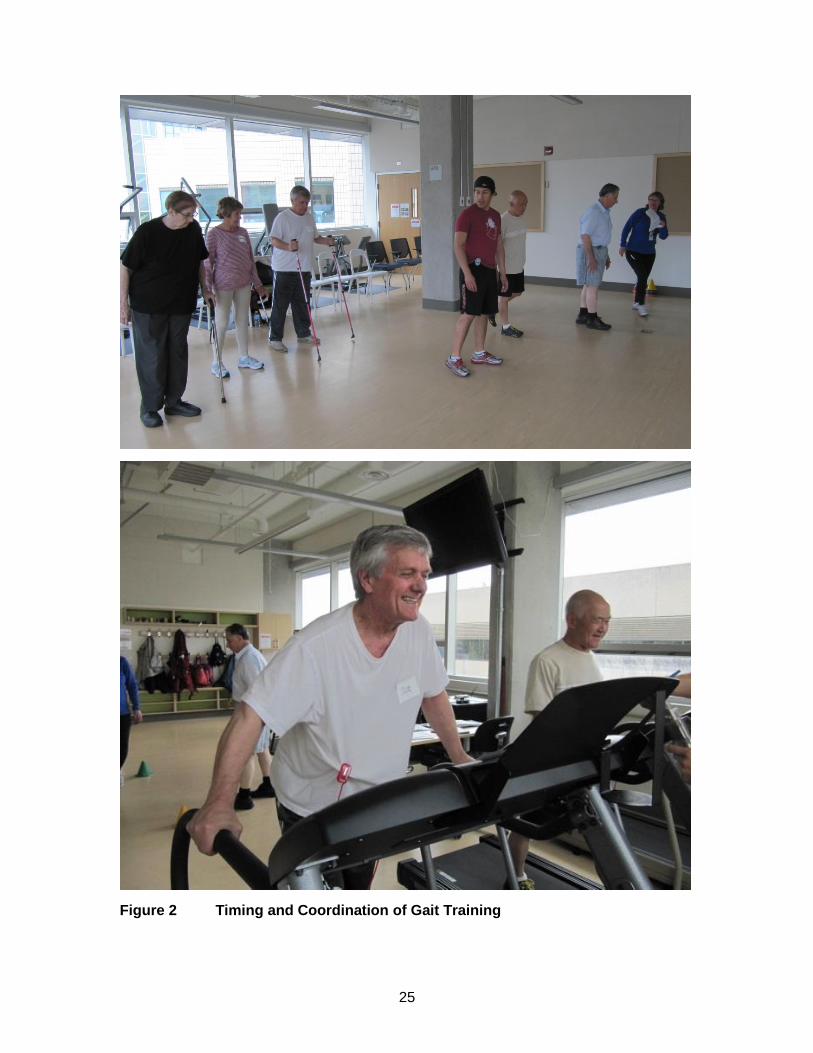
2.7.1. Timing and Coordination of Gait Training (TC)
The TC program was adapted from a motor skill training program developed by
investigators at the University of Pittsburgh (Brach & VanSwearingen, 2013; Brach et al.,
2015, 2013; VanSwearingen et al., 2009, 2011). The program incorporated four
elements of task-oriented motor skill training (Brach & VanSwearingen, 2013): (1) a
defined movement goal, (2) movement to gain knowledge of muscles and postures, (3)
practice to correct errors in movement by developing and adjusting motor plans, and (4)
challenges to select the optimal motor plan. The TC program specifically used stepping
and walking patterns to promote timing and coordination within the gait cycle.
Progression for stepping and walking tasks was accomplished by increases in the
speed, amplitude, and accuracy of performance. Object manipulation (e.g., bouncing a
ball), and the introduction of more complex tasks that combined these aspects (e.g.,
walking past other people while bouncing a ball) were incorporated. Participants also
24
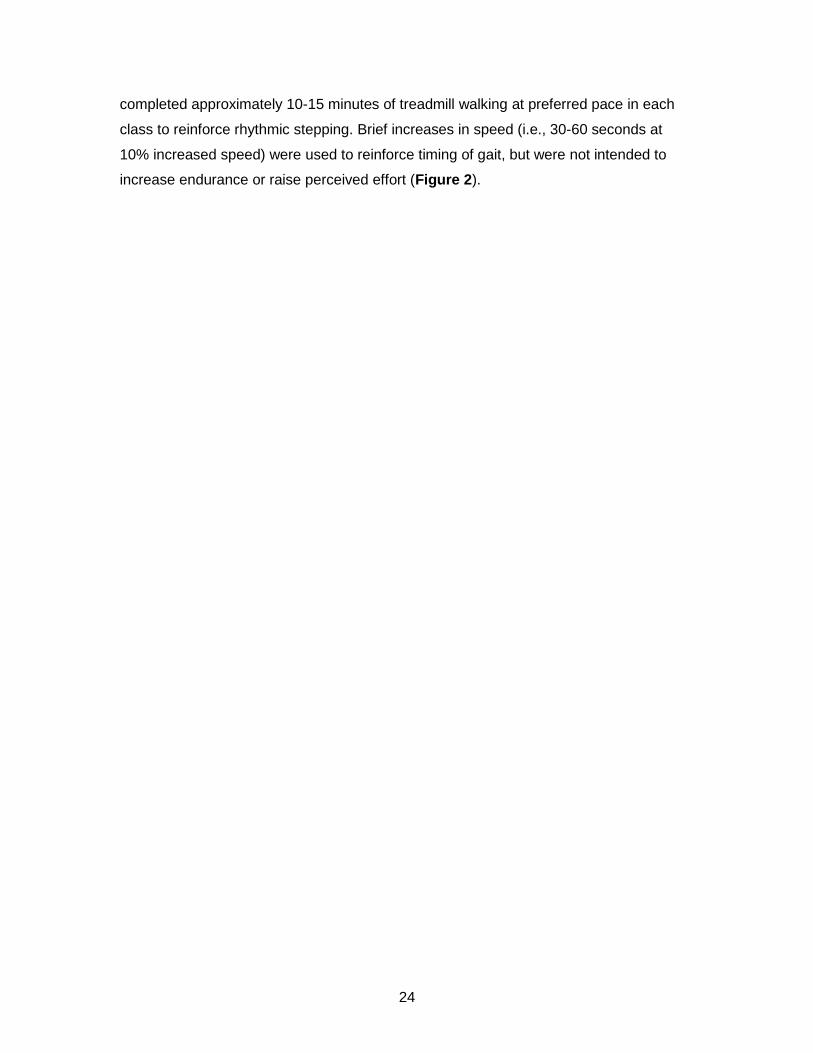
completed approximately 10-15 minutes of treadmill walking at preferred pace in each
class to reinforce rhythmic stepping. Brief increases in speed (i.e., 30-60 seconds at
10% increased speed) were used to reinforce timing of gait, but were not intended to
increase endurance or raise perceived effort (Figure 2).
25
Figure 2 Timing and Coordination of Gait Training
26
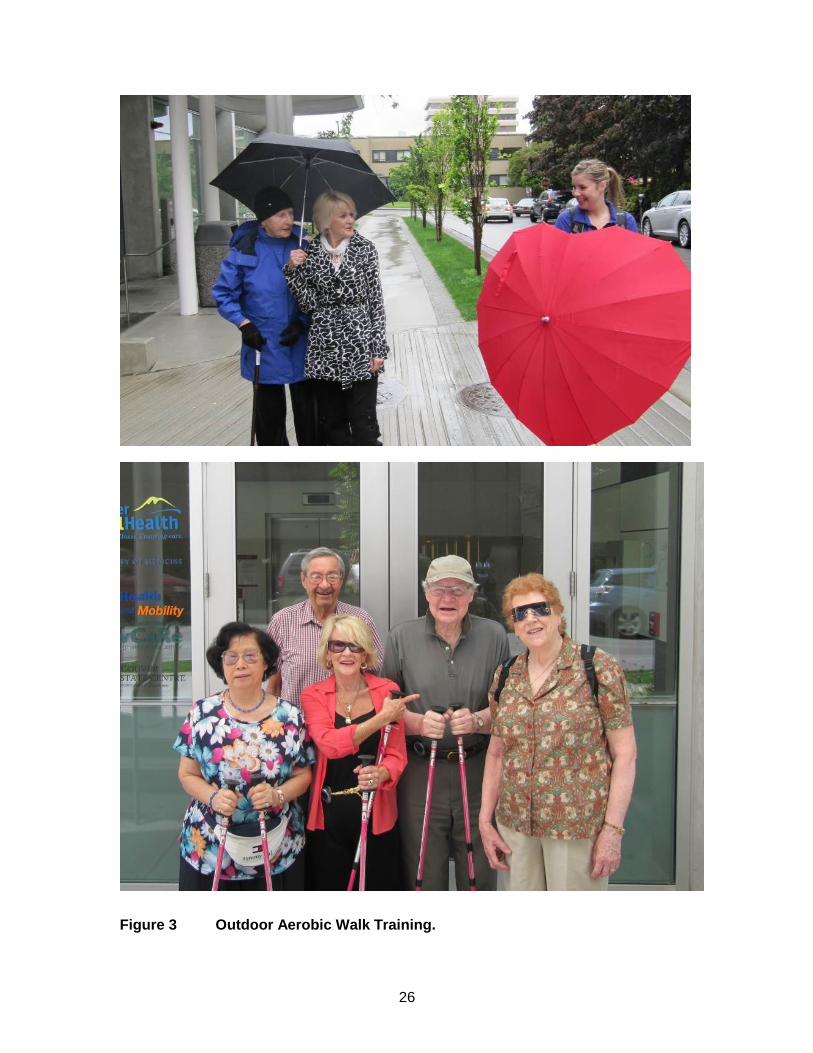
Figure 3 Outdoor Aerobic Walk Training.
27
2.7.2. Outdoor Aerobic Walk Training (AW)
The AW program focused on outdoor walking in surrounding neighbourhoods.
Participants were instructed to gradually progress walking intensity over the intervention
period to a target Borg RPE of 14-15 (Borg, 1982), corresponding to ‘hard’. To further
guide intensity, participants were instructed to use a simple “talk” test (Levine et al.,
2008) and to initially walk at a pace they could talk comfortably without effort and
gradually progress to a pace at which conversation required more effort. Accordingly, the
walking routes increased in distance and incorporated more slopes as the intervention
period progressed (Figure 3).
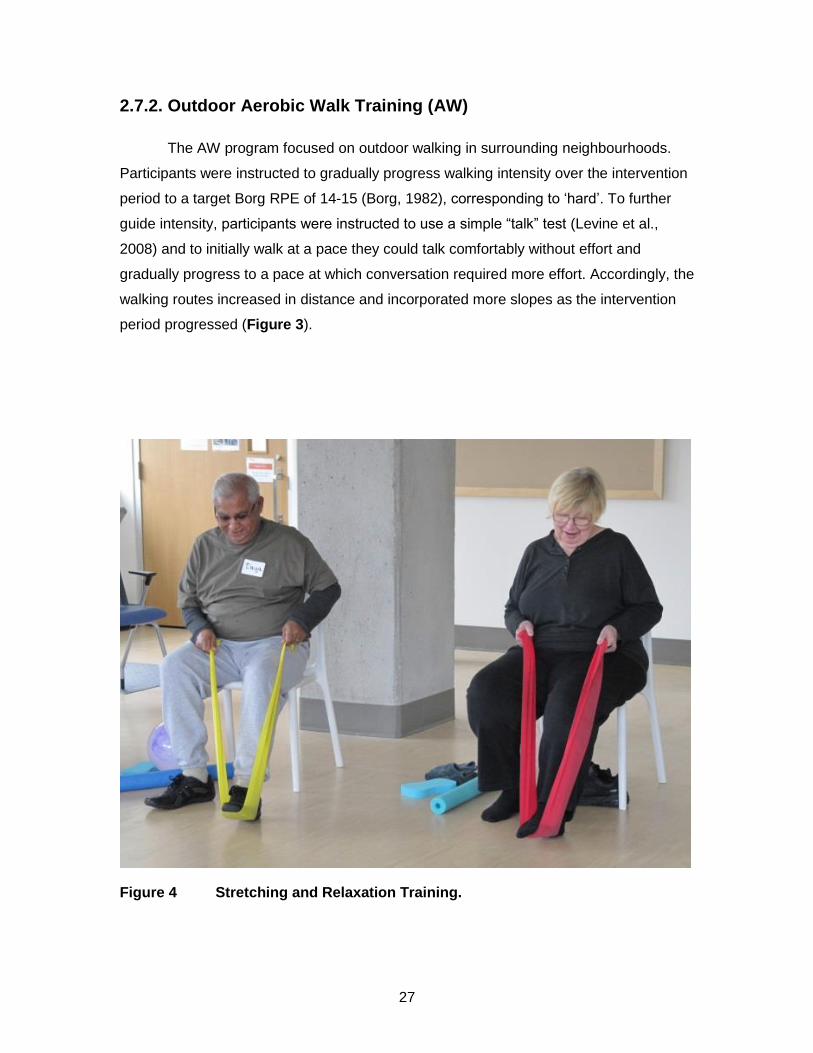
Figure 4 Stretching and Relaxation Training.
28
2.7.3. Stretching and Relaxation Training (SR)
The SR program served as an active control to account for potential effects
related to traveling to the training center, social interactions, and changes in lifestyle
secondary to study participation. Each class involved full-body stretching, range-of-
motion activities, and relaxation techniques for which there was no available evidence to
suggest an effect on the energy cost of walking or other outcomes (Figure 4).
2.8. Assessments
Descriptive measures and outcomes were assessed within a 3-4 week time
frame at baseline (T0), 12 weeks (intervention end, T1), and 24 weeks (12 weeks after
intervention end to measure maintenance of intervention effects, T2). Outcome
assessors were blinded to intervention assignments at T0, but not at T1 or T2. For
participants who could not attend T1 or T2 assessments, an assessment booklet was
mailed to complete on their own; these participants did not complete the physical
measurements that research personnel assessed on-site (e.g., walking tests, SPPB).
2.9. Statistical Analysis
Normally distributed continuous variables were summarized as mean (standard
deviation [SD]), and categorical variables as count [N] (percent [%]). We compared
continuous primary and secondary outcomes between the exercise (TC, AW) and
control (SR) groups using an analysis of covariance model with Tukey multiple
comparisons procedure. Results are reported as mean (95% confidence interval [CI]).
We analyzed 1) the intervention effects by comparing T1 measurements between
exercise (TC, AW) and control (SR) groups, adjusting for T0 measurements, and 2) the
maintenance effects by T2 measurements between exercise and control groups,
adjusting for T0 measurements. Categorical secondary outcomes were analyzed using
odds ratios to compare between the exercise (TC, AW) and control (SR) groups at T1
and T2. Results are reported as odds ratios [OR] (95% CI).
We conducted multiple analyses to gain a complete understanding of the
intervention effects. First, we performed standard intention-to-treat analysis for each
outcome. Second, we repeated the analysis, including baseline age and MVPA as

29
covariates, as age influences study outcome and baseline MVPA values were slightly
unequal between groups. Third, we completed as-treated analyses by restricting to
participants with ≥ 85% class adherence (≥21/24 classes). Fourth, we conducted two
sets of subgroup analyses: 1) for the energy cost of walking outcomes, we divided
participants into high and low baseline energy cost groups based on the overall median
baseline energy cost, similar to past research (VanSwearingen et al., 2009), and 2) for
all outcomes, we classified participants based on presence or absence of osteoarthritis
(OA) because a large proportion of participants (61%) reported OA at baseline, and we
hypothesized that OA may affect responsiveness to the interventions. We examined
these subgroups to determine if those with high baseline energy cost and those without
OA had greater intervention and maintenance effects.
The alpha level was set at 0.05 for intention-to-treat and as-treated analyses, and
at 0.20 for subgroup analyses. We did not adjust the p-value for multiple endpoints since
a Type II error is of greater concern than a Type I error in pilot studies (Schoenfeld,
1980).

30
Chapter 3. Results
3.1. Flow of Participants and Intervention Adherence
Of 196 individuals screened by telephone, 111 were eligible to participate in the
study, and 80 attended an on-site information session (Figure 1). Baseline assessments
were completed for 74 participants, of which 72 were randomized to intervention groups.
Average intervention adherence was 86% (86% for TC, 81% for AW, and 90% for SR).
Seven participants withdrew from the study, while 65 (90%) completed the T1 and T2
assessments.
3.2. Participant Characteristics
At baseline, participants had a mean age of 74.2 (SD: 6.6) years, and were
predominantly white (67%) women (74%), with 61% reporting OA, and mean BMI within
the obese range (30.2, SD: 6.3 kg/m2). Participants had mean 3-minute gait speed of 0.9
(SD: 0.2) m/s and mean energy cost of walking on the 0.8 m/s treadmill walk of 0.260
(SD: 0.052) mL/kg/m. Participant characteristics were well balanced across intervention
groups (Table 1). Marginal differences were observed in MVPA between groups at
baseline (TC: 81 (SD: 82) minutes, AW: 67 (SD: 85) minutes, SR: 48 (SD: 44) minutes)
(Table 5).
3.3. Primary Outcome
At T0, for the primary outcome, 66 participants completed the 0.8 m/s treadmill
walk test, 66 completed the preferred speed treadmill walk test, and 68 completed the 3-
minute overground walk test (Table 2). At T1, 57 participants completed the 0.8 m/s
treadmill walk test, 55 completed the preferred speed treadmill walk test, and 57
completed the 3-minute overground walk test (Table 2). At T2, 50 completed the 0.8 m/s
treadmill walk test, 48 completed the preferred speed treadmill walk test, and 50
completed the 3-minute overground walk test (Table 2).
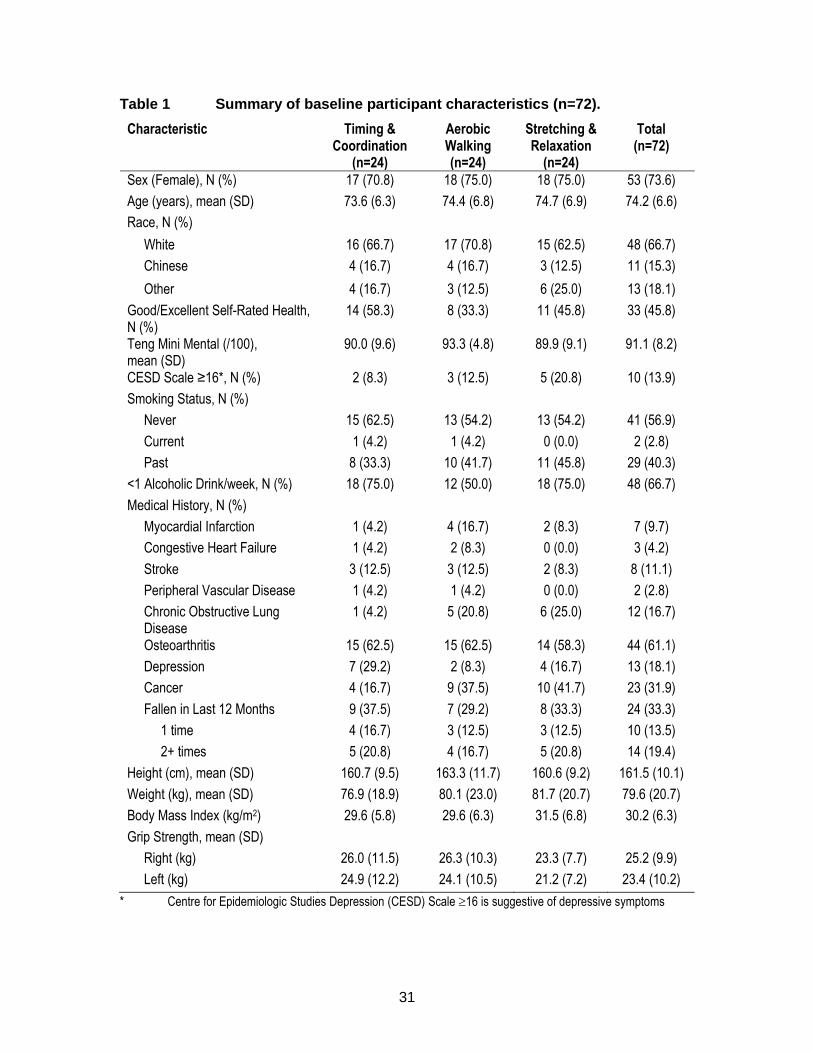
31
Table 1 Summary of baseline participant characteristics (n=72).
Characteristic Timing & Coordination
(n=24)
Aerobic Walking (n=24)
Stretching & Relaxation
(n=24)
Total (n=72)
Sex (Female), N (%) 17 (70.8) 18 (75.0) 18 (75.0) 53 (73.6)
Age (years), mean (SD) 73.6 (6.3) 74.4 (6.8) 74.7 (6.9) 74.2 (6.6)
Race, N (%)
White 16 (66.7) 17 (70.8) 15 (62.5) 48 (66.7)
Chinese 4 (16.7) 4 (16.7) 3 (12.5) 11 (15.3)
Other 4 (16.7) 3 (12.5) 6 (25.0) 13 (18.1)
Good/Excellent Self-Rated Health, N (%)
14 (58.3) 8 (33.3) 11 (45.8) 33 (45.8)
Teng Mini Mental (/100), mean (SD)
90.0 (9.6) 93.3 (4.8) 89.9 (9.1) 91.1 (8.2)
CESD Scale ≥16*, N (%) 2 (8.3) 3 (12.5) 5 (20.8) 10 (13.9)
Smoking Status, N (%)
Never 15 (62.5) 13 (54.2) 13 (54.2) 41 (56.9)
Current 1 (4.2) 1 (4.2) 0 (0.0) 2 (2.8)
Past 8 (33.3) 10 (41.7) 11 (45.8) 29 (40.3)
<1 Alcoholic Drink/week, N (%) 18 (75.0) 12 (50.0) 18 (75.0) 48 (66.7)
Medical History, N (%)
Myocardial Infarction 1 (4.2) 4 (16.7) 2 (8.3) 7 (9.7)
Congestive Heart Failure 1 (4.2) 2 (8.3) 0 (0.0) 3 (4.2)
Stroke 3 (12.5) 3 (12.5) 2 (8.3) 8 (11.1)
Peripheral Vascular Disease 1 (4.2) 1 (4.2) 0 (0.0) 2 (2.8)
Chronic Obstructive Lung Disease
1 (4.2) 5 (20.8) 6 (25.0) 12 (16.7)
Osteoarthritis 15 (62.5) 15 (62.5) 14 (58.3) 44 (61.1)
Depression 7 (29.2) 2 (8.3) 4 (16.7) 13 (18.1)
Cancer 4 (16.7) 9 (37.5) 10 (41.7) 23 (31.9)
Fallen in Last 12 Months 9 (37.5) 7 (29.2) 8 (33.3) 24 (33.3)
1 time 4 (16.7) 3 (12.5) 3 (12.5) 10 (13.5)
2+ times 5 (20.8) 4 (16.7) 5 (20.8) 14 (19.4)
Height (cm), mean (SD) 160.7 (9.5) 163.3 (11.7) 160.6 (9.2) 161.5 (10.1)
Weight (kg), mean (SD) 76.9 (18.9) 80.1 (23.0) 81.7 (20.7) 79.6 (20.7)
Body Mass Index (kg/m2) 29.6 (5.8) 29.6 (6.3) 31.5 (6.8) 30.2 (6.3)
Grip Strength, mean (SD)
Right (kg) 26.0 (11.5) 26.3 (10.3) 23.3 (7.7) 25.2 (9.9)
Left (kg) 24.9 (12.2) 24.1 (10.5) 21.2 (7.2) 23.4 (10.2)
* Centre for Epidemiologic Studies Depression (CESD) Scale 16 is suggestive of depressive symptoms

32
Table 2 Flow of participants through the energy cost of walking tests (n=72).
Timing & Coordination
(n=24)
Aerobic Walking (n=24)
Stretching & Relaxation
(n=24) Total (n=72)
T0 Assessment
Eligible for Walk Tests, N (%) 24 (100.0) 24 (100.0) 24 (100.0) 72 (100.0)
Treadmill Walk - Speed: 0.8 m/s, N (%)
Attempted Test 22 (91.7) 23 (95.8) 22 (91.7) 67 (93.1)
Included in Analysis 22 (91.7) 23 (95.8) 21 (87.5) 66 (91.7)
Treadmill Walk - Speed: 6-m Overground Preferred Speed, N (%)
Attempted Test 23 (95.8) 23 (95.8) 24 (100.0) 70 (97.2)
Included in Analysis 23 (95.8) 23 (95.8) 20 (83.3) 66 (91.7)
Overground Walk - Speed: Preferred Speed, N (%)
Attempted Test 24 (100.0) 24 (100.0) 24 (100.0) 72 (100.0)
Included in Analysis 24 (100.0) 23 (95.8) 21 (87.5) 68 (94.4)
T1 Assessment
Withdrew from Study, N (%) 1 (4.2) 4 (16.7) 2 (8.3) 7 (9.7)
Mailed Assessment, N (%) 1 (4.2) 2 (8.3) 3 (12.5) 6 (8.3)
Treadmill Walk - Speed: 0.8 m/s, N (%)
Attempted Test 22 (100.0) 18 (100.0) 18 (94.7) 58 (98.3)
Included in Analysis 22 (100.0) 17 (94.4) 18 (94.7) 57 (96.6)
Treadmill Walk - Speed: 6-m Overground Preferred Speed, N (%)
Attempted Test 21 (95.5) 18 (100.0) 16 (84.2) 55 (93.2)
Included in Analysis 21 (95.5) 18 (100.0) 16 (84.2) 55 (93.2)
Overground Walk - Speed: Preferred Speed, N (%)
Attempted Test 22 (100.0) 18 (100.0) 18 (94.7) 58 (98.3)
Included in Analysis 22 (100.0) 18 (100.0) 17 (89.5) 57 (96.6)
T2 Assessment
Mailed Assessment 4 (16.7) 4 (16.7) 4 (16.7) 12 (16.7)
Treadmill Walk - Speed: 0.8 m/s, N (%)
Attempted Test 18 (94.7) 15 (93.8) 17 (94.4) 50 (94.3)
Included in Analysis 18 (94.7) 15 (93.8) 17 (94.4) 50 (94.3)
Treadmill Walk - Speed: 6-m Overground Preferred Speed, N (%)
Attempted Test 17 (89.5) 16 (100.0) 15 (83.3) 48 (90.6)
Included in Analysis 17 (89.5) 16 (100.0) 15 (83.3) 48 (90.6)
Overground Walk - Speed: Preferred Speed, N (%)
Attempted Test 19 (100.0) 16 (100.0) 17 (94.4) 52 (98.1)
Included in Analysis 19 (100.0) 16 (100.0) 15 (83.3) 50 (94.3)
Included in Analysis Participant completed at least 3 minutes of walking test T0 Baseline T1 12-week follow-up T2 24-week follow-up
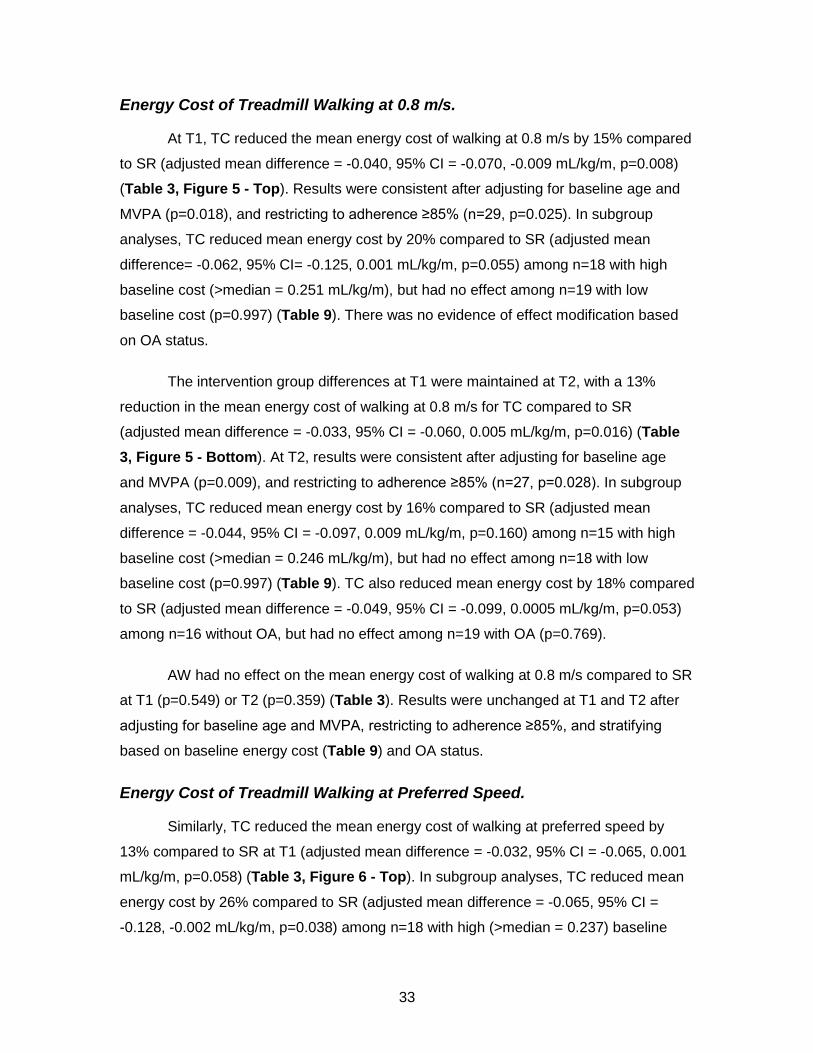
33
Energy Cost of Treadmill Walking at 0.8 m/s.
At T1, TC reduced the mean energy cost of walking at 0.8 m/s by 15% compared
to SR (adjusted mean difference = -0.040, 95% CI = -0.070, -0.009 mL/kg/m, p=0.008)
(Table 3, Figure 5 - Top). Results were consistent after adjusting for baseline age and
MVPA (p=0.018), and restricting to adherence ≥85% (n=29, p=0.025). In subgroup
analyses, TC reduced mean energy cost by 20% compared to SR (adjusted mean
difference= -0.062, 95% CI= -0.125, 0.001 mL/kg/m, p=0.055) among n=18 with high
baseline cost (>median = 0.251 mL/kg/m), but had no effect among n=19 with low
baseline cost (p=0.997) (Table 9). There was no evidence of effect modification based
on OA status.
The intervention group differences at T1 were maintained at T2, with a 13%
reduction in the mean energy cost of walking at 0.8 m/s for TC compared to SR
(adjusted mean difference = -0.033, 95% CI = -0.060, 0.005 mL/kg/m, p=0.016) (Table
3, Figure 5 - Bottom). At T2, results were consistent after adjusting for baseline age
and MVPA (p=0.009), and restricting to adherence ≥85% (n=27, p=0.028). In subgroup
analyses, TC reduced mean energy cost by 16% compared to SR (adjusted mean
difference = -0.044, 95% CI = -0.097, 0.009 mL/kg/m, p=0.160) among n=15 with high
baseline cost (>median = 0.246 mL/kg/m), but had no effect among n=18 with low
baseline cost (p=0.997) (Table 9). TC also reduced mean energy cost by 18% compared
to SR (adjusted mean difference = -0.049, 95% CI = -0.099, 0.0005 mL/kg/m, p=0.053)
among n=16 without OA, but had no effect among n=19 with OA (p=0.769).
AW had no effect on the mean energy cost of walking at 0.8 m/s compared to SR
at T1 (p=0.549) or T2 (p=0.359) (Table 3). Results were unchanged at T1 and T2 after
adjusting for baseline age and MVPA, restricting to adherence ≥85%, and stratifying
based on baseline energy cost (Table 9) and OA status.
Energy Cost of Treadmill Walking at Preferred Speed.
Similarly, TC reduced the mean energy cost of walking at preferred speed by
13% compared to SR at T1 (adjusted mean difference = -0.032, 95% CI = -0.065, 0.001
mL/kg/m, p=0.058) (Table 3, Figure 6 - Top). In subgroup analyses, TC reduced mean
energy cost by 26% compared to SR (adjusted mean difference = -0.065, 95% CI =
-0.128, -0.002 mL/kg/m, p=0.038) among n=18 with high (>median = 0.237) baseline
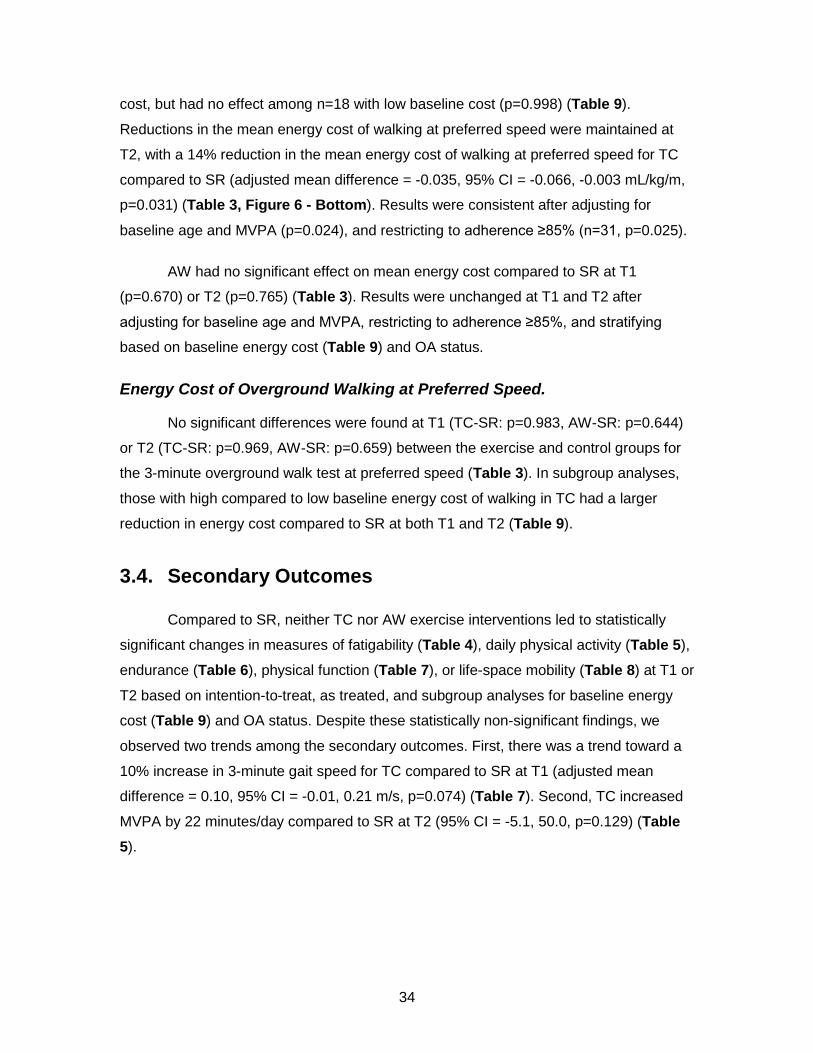
34
cost, but had no effect among n=18 with low baseline cost (p=0.998) (Table 9).
Reductions in the mean energy cost of walking at preferred speed were maintained at
T2, with a 14% reduction in the mean energy cost of walking at preferred speed for TC
compared to SR (adjusted mean difference = -0.035, 95% CI = -0.066, -0.003 mL/kg/m,
p=0.031) (Table 3, Figure 6 - Bottom). Results were consistent after adjusting for
baseline age and MVPA (p=0.024), and restricting to adherence ≥85% (n=31, p=0.025).
AW had no significant effect on mean energy cost compared to SR at T1
(p=0.670) or T2 (p=0.765) (Table 3). Results were unchanged at T1 and T2 after
adjusting for baseline age and MVPA, restricting to adherence ≥85%, and stratifying
based on baseline energy cost (Table 9) and OA status.
Energy Cost of Overground Walking at Preferred Speed.
No significant differences were found at T1 (TC-SR: p=0.983, AW-SR: p=0.644)
or T2 (TC-SR: p=0.969, AW-SR: p=0.659) between the exercise and control groups for
the 3-minute overground walk test at preferred speed (Table 3). In subgroup analyses,
those with high compared to low baseline energy cost of walking in TC had a larger
reduction in energy cost compared to SR at both T1 and T2 (Table 9).
3.4. Secondary Outcomes
Compared to SR, neither TC nor AW exercise interventions led to statistically
significant changes in measures of fatigability (Table 4), daily physical activity (Table 5),
endurance (Table 6), physical function (Table 7), or life-space mobility (Table 8) at T1 or
T2 based on intention-to-treat, as treated, and subgroup analyses for baseline energy
cost (Table 9) and OA status. Despite these statistically non-significant findings, we
observed two trends among the secondary outcomes. First, there was a trend toward a
10% increase in 3-minute gait speed for TC compared to SR at T1 (adjusted mean
difference = 0.10, 95% CI = -0.01, 0.21 m/s, p=0.074) (Table 7). Second, TC increased
MVPA by 22 minutes/day compared to SR at T2 (95% CI = -5.1, 50.0, p=0.129) (Table
5).

35
Table 3 Energy cost of walking outcomes. Group comparisons are reported as mean difference (95% CI) based on ANCOVA analyses.
Mean (95% CI) Mean Difference (95% CI)
Timing & Coordination
(TC) Aerobic Walking
(AW) Stretching & Relaxation
(SR) TC-SR AW-SR
Treadmill at 0.8 m/s (mL/kg/m)
T0 0.266 (0.248, 0.285) 0.265 (0.238, 0.292) 0.248 (0.227, 0.270) --- ---
T1 0.236 (0.220, 0.252) 0.263 (0.228, 0.298) 0.255 (0.225, 0.284) --- ---
T1* 0.227 (0.210, 0.244) 0.252 (0.233, 0.272) 0.267 (0.248, 0.285) -0.040 (-0.070, -0.009)
p = 0.008 -0.014 (-0.047, 0.018)
p=0.549
T1** 0.227 (0.208, 0.245) 0.252 (0.232, 0.272) 0.267 (0.246, 0.288) -0.040 (-0.074, -0.006)
p=0.018 -0.015 (-0.050, 0.021)
p=0.580
T2 0.238 (0.223, 0.253) 0.255 (0.224, 0.286) 0.255 (0.234, 0.276) --- ---
T2* 0.229 (0.213, 0.245) 0.245 (0.228, 0.263) 0.262 (0.246, 0.278) -0.033 (-0.060, -0.005)
p=0.016 -0.017 (-0.046, 0.013)
p=0.359
T2** 0.228 (0.212, 0.243) 0.246 (0.229, 0.262) 0.262 (0.246, 0.279) -0.035 (-0.062, -0.008)
p=0.009 -0.017 (-0.045, 0.012)
p=0.334
Treadmill at Preferred Speed (mL/kg/m)
T0 0.253 (0.233, 0.272) 0.243 (0.217, 0.270) 0.244 (0.217, 0.272) --- ---
T1 0.216 (0.200, 0.232) 0.238 (0.205, 0.270) 0.238 (0.201, 0.275) --- ---
T1* 0.214 (0.197, 0.232) 0.234 (0.214, 0.253) 0.246 (0.225, 0.267) -0.032 (-0.065, 0.001)
p=0.058 -0.012 (-0.047, 0.022)
p=0.670
T1** 0.214 (0.197, 0.231) 0.233 (0.215, 0.251) 0.237 (0.217, 0.258) -0.024 (-0.056, 0.009)
p=0.187 -0.004 (-0.037, 0.029)
p=0.943
T2 0.217 (0.196, 0.238) 0.242 (0.198, 0.285) 0.240 (0.209, 0.270) --- ---
T2* 0.213 (0.196, 0.230) 0.238 (0.219, 0.256) 0.247 (0.227, 0.267) -0.035 (-0.066, -0.003)
p=0.031 -0.010 (-0.043, 0.024)
p=0.765
T2** 0.211 (0.194, 0.228) 0.238 (0.220, 0.255) 0.246 (0.227, 0.265) -0.035 (-0.065, -0.004)
p=0.024 -0.008 (-0.039, 0.023)
p=0.805

36
Mean (95% CI) Mean Difference (95% CI)
Timing & Coordination
(TC) Aerobic Walking
(AW) Stretching & Relaxation
(SR) TC-SR AW-SR
Overground at Preferred Speed (mL/kg/m)
T0 0.215 (0.198, 0.232) 0.220 (0.196, 0.244) 0.244 (0.205, 0.283) --- ---
T1 0.207 (0.190, 0.223) 0.240 (0.191, 0.288) 0.236 (0.199, 0.274) --- ---
T1* 0.219 (0.198, 0.240) 0.237 (0.213, 0.260) 0.222 (0.198, 0.245) -0.003 (-0.041, 0.035)
p=0.983 0.015 (-0.025, 0.055)
p=0.644
T1** 0.218 (0.196, 0.240) 0.236 (0.212, 0.260) 0.220 (0.195, 0.245) -0.002 (-0.043, 0.039)
p=0.992 0.016 (-0.026, 0.058)
p=0.634
T2 0.214 (0.191, 0.237) 0.241 (0.183, 0.300) 0.233 (0.203, 0.263) --- ---
T2* 0.221 (0.195, 0.246) 0.243 (0.214, 0.271) 0.225 (0.197, 0.254) -0.005 (-0.051, 0.041)
p=0.969 0.017 (-0.031, 0.066)
p=0.659
T2** 0.220 (0.193, 0.246) 0.244 (0.215, 0.272) 0.225 (0.196, 0.254) -0.006 (-0.054, 0.042)
p=0.951 0.018 (-0.031, 0.067)
p=0.646 Treadmill at 0.8 m/s TC: T0 (n=22), T1 (n=22), T2 (n=18); AW: T0 (n=23), T1 (n=17), T2 (n=15); SR: T0 (n=21), T1 (n=18), T2 (n=17) Treadmill at Preferred Speed TC: T0 (n=23), T1 (n=21), T2 (n=18); AW: T0 (n=23), T1 (n=18), T2 (n=16); SR: T0 (n=20), T1 (n=16), T2 (n=15) Overground at Preferred Speed TC: T0 (n=23), T1 (n=22), T2 (n=19); AW: T0 (n=23), T1 (n=18), T2 (n=16); SR: T0 (n=22), T1 (n=17), T2 (n=15) T0 Baseline * T0 adjusted T1 12-week follow-up ** T0, age, and MVPA adjusted T2 24-week follow-up

37
Table 4 Fatigability outcomes. Group comparisons are reported as mean difference (95% CI) based on ANCOVA analyses unless otherwise stated.
Mean (95% CI) Mean Difference (95% CI)
Timing & Coordination
(TC) Aerobic Walking
(AW) Stretching & Relaxation
(SR) TC-SR AW-SR
RPE at End of Treadmill at 0.8 m/s (Borg Scale: 6-20)
T0 11.3 (10.0, 12.6) 11.3 (10.1, 12.5) 12.6 (11.4, 13.9) --- ---
T1 11.5 (9.1, 12.2) 10.7 (9.1, 12.2) 12.2 (10.7, 13.6) --- ---
T1* 11.3 (10.3, 12.2) 10.8 (9.7, 11.8) 11.6 (10.6, 12.6) -0.3 (-2.0, 1.4)
p=0.892 -0.9 (-2.6, 0.9)
p=0.460
T1** 11.3 (10.3, 12.3) 10.6 (9.6, 11.6) 11.4 (10.3, 12.4) -0.1 (-1.8, 1.7)
p=0.994 -0.8 (-2.5, 1.0)
p=0.558
T2 10.9 (10.0, 11.7) 10.9 (9.3, 12.4) 11.8 (10.5, 13.2) --- ---
T2* 10.9 (10.0, 11.7) 10.9 (9.9, 11.8) 11.3 (10.5, 12.2) -0.5 (-1.9, 1.0)
p=0.717 -0.5 (-2.0, 1.1)
p=0.759
T2** 10.7 (9.9, 11.6) 10.9 (9.9, 11.8) 11.3 (10.4, 12.2) -0.6 (-2.1, 0.9)
p=0.638 -0.4 (-2.0, 1.2)
p=0.804
RPE at End of Treadmill at Preferred Speed (Borg Scale: 6-20)
T0 12.8 (11.5, 14.1) 12.2 (11.1, 13.4) 13.4 (12.3, 14.5) --- ---
T1 12.5 (11.2, 13.8) 12.6 (11.2, 13.9) 12.6 (11.3, 14.0) --- ---
T1* 12.6 (11.4, 13.7) 12.6 (11.4, 13.7) 12.3 (11.1, 13.5) 0.2 (-1.8, 2.3)
p=0.954 0.2 (-1.8, 2.3)
p=0.957
T1** 12.6 (11.4, 13.8) 12.5 (11.3, 13.7) 12.3 (11.0, 13.6) 0.3 (-1.9, 2.4)
p=0.952 0.2 (-2.0, 2.3)
p=0.979
T2 12.7 (11.9, 13.5) 13.1 (11.7, 14.5) 12.1 (10.4, 13.8) --- ---
T2* 12.7 (11.5, 14.0) 12.7 (11.5, 13.9) 12.0 (10.8, 13.2) 0.7 (-1.4, 2.8)
p=0.702 0.7 (-1.4, 2.8)
p=0.688
T2** 12.6 (11.3, 14.0) 12.7 (11.5, 13.9) 12.0 (10.8, 13.2) 0.6 (-1.6, 0.9)
p=0.775 0.7 (-1.3, 2.8)
p=0.687
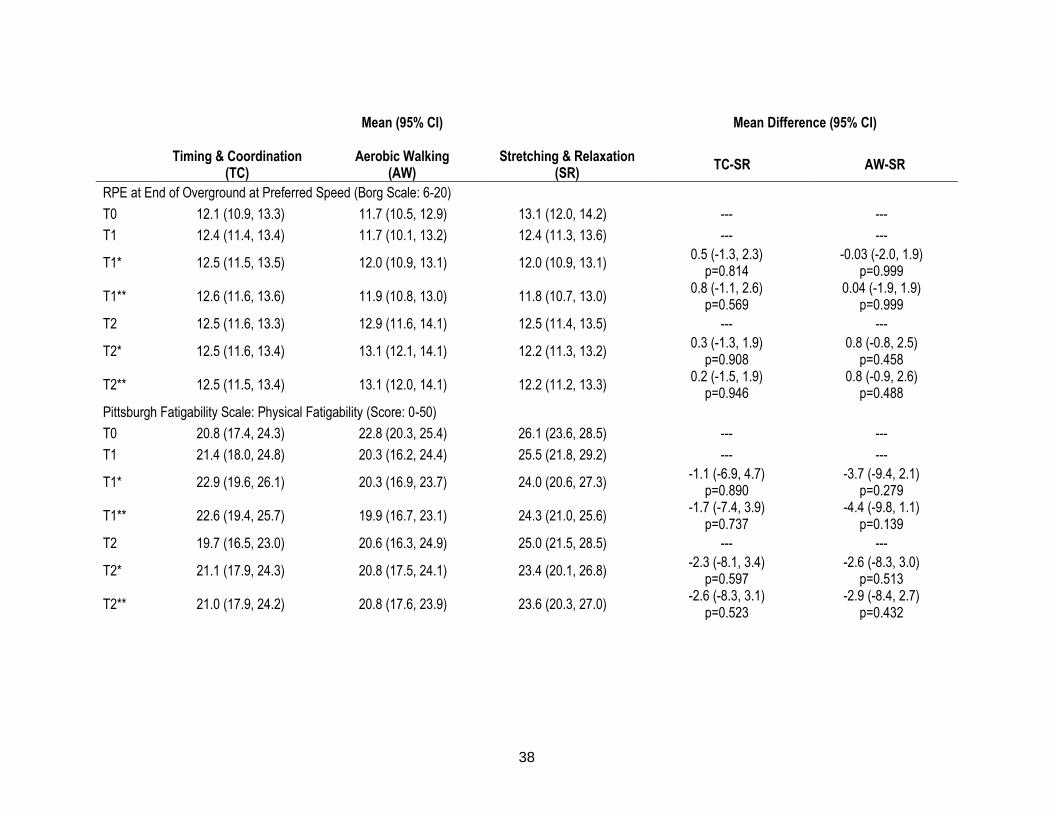
38
Mean (95% CI) Mean Difference (95% CI)
Timing & Coordination
(TC) Aerobic Walking
(AW) Stretching & Relaxation
(SR) TC-SR AW-SR
RPE at End of Overground at Preferred Speed (Borg Scale: 6-20)
T0 12.1 (10.9, 13.3) 11.7 (10.5, 12.9) 13.1 (12.0, 14.2) --- ---
T1 12.4 (11.4, 13.4) 11.7 (10.1, 13.2) 12.4 (11.3, 13.6) --- ---
T1* 12.5 (11.5, 13.5) 12.0 (10.9, 13.1) 12.0 (10.9, 13.1) 0.5 (-1.3, 2.3)
p=0.814 -0.03 (-2.0, 1.9)
p=0.999
T1** 12.6 (11.6, 13.6) 11.9 (10.8, 13.0) 11.8 (10.7, 13.0) 0.8 (-1.1, 2.6)
p=0.569 0.04 (-1.9, 1.9)
p=0.999
T2 12.5 (11.6, 13.3) 12.9 (11.6, 14.1) 12.5 (11.4, 13.5) --- ---
T2* 12.5 (11.6, 13.4) 13.1 (12.1, 14.1) 12.2 (11.3, 13.2) 0.3 (-1.3, 1.9)
p=0.908 0.8 (-0.8, 2.5)
p=0.458
T2** 12.5 (11.5, 13.4) 13.1 (12.0, 14.1) 12.2 (11.2, 13.3) 0.2 (-1.5, 1.9)
p=0.946 0.8 (-0.9, 2.6)
p=0.488
Pittsburgh Fatigability Scale: Physical Fatigability (Score: 0-50)
T0 20.8 (17.4, 24.3) 22.8 (20.3, 25.4) 26.1 (23.6, 28.5) --- ---
T1 21.4 (18.0, 24.8) 20.3 (16.2, 24.4) 25.5 (21.8, 29.2) --- ---
T1* 22.9 (19.6, 26.1) 20.3 (16.9, 23.7) 24.0 (20.6, 27.3) -1.1 (-6.9, 4.7)
p=0.890 -3.7 (-9.4, 2.1)
p=0.279
T1** 22.6 (19.4, 25.7) 19.9 (16.7, 23.1) 24.3 (21.0, 25.6) -1.7 (-7.4, 3.9)
p=0.737 -4.4 (-9.8, 1.1)
p=0.139
T2 19.7 (16.5, 23.0) 20.6 (16.3, 24.9) 25.0 (21.5, 28.5) --- ---
T2* 21.1 (17.9, 24.3) 20.8 (17.5, 24.1) 23.4 (20.1, 26.8) -2.3 (-8.1, 3.4)
p=0.597 -2.6 (-8.3, 3.0)
p=0.513
T2** 21.0 (17.9, 24.2) 20.8 (17.6, 23.9) 23.6 (20.3, 27.0) -2.6 (-8.3, 3.1)
p=0.523 -2.9 (-8.4, 2.7)
p=0.432
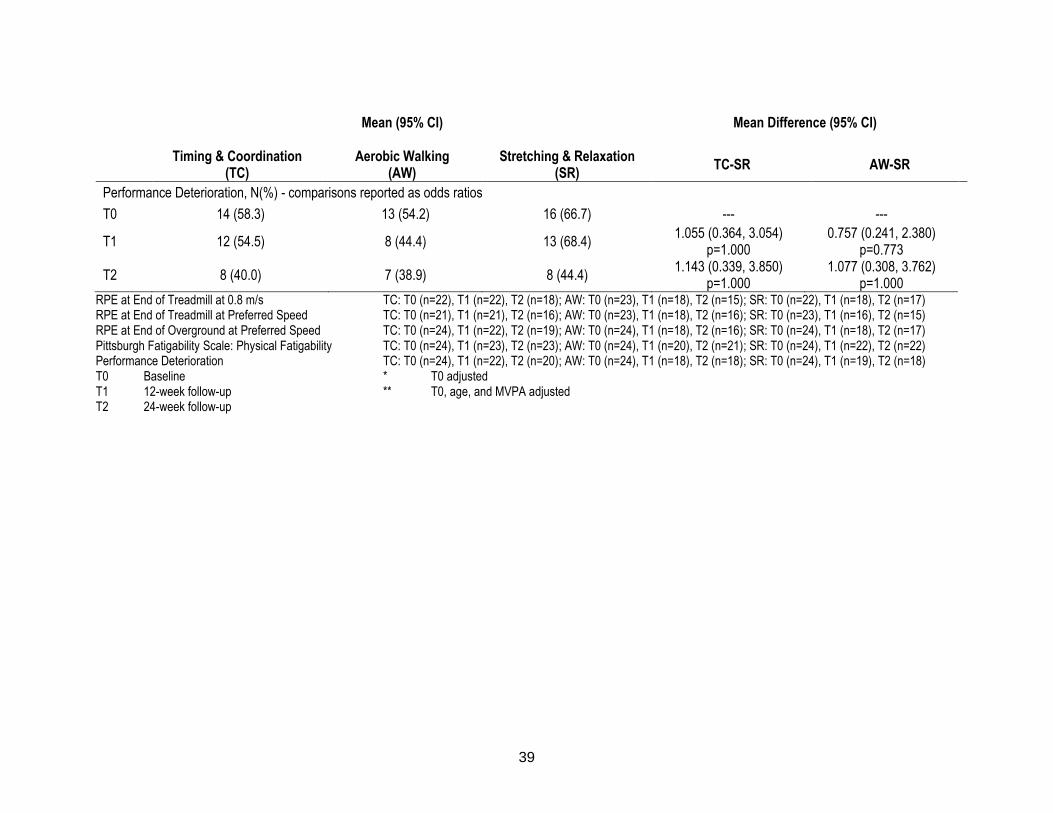
39
Mean (95% CI) Mean Difference (95% CI)
Timing & Coordination
(TC) Aerobic Walking
(AW) Stretching & Relaxation
(SR) TC-SR AW-SR
Performance Deterioration, N(%) - comparisons reported as odds ratios
T0 14 (58.3) 13 (54.2) 16 (66.7) --- ---
T1 12 (54.5) 8 (44.4) 13 (68.4) 1.055 (0.364, 3.054)
p=1.000 0.757 (0.241, 2.380)
p=0.773
T2 8 (40.0) 7 (38.9) 8 (44.4) 1.143 (0.339, 3.850)
p=1.000 1.077 (0.308, 3.762)
p=1.000 RPE at End of Treadmill at 0.8 m/s TC: T0 (n=22), T1 (n=22), T2 (n=18); AW: T0 (n=23), T1 (n=18), T2 (n=15); SR: T0 (n=22), T1 (n=18), T2 (n=17) RPE at End of Treadmill at Preferred Speed TC: T0 (n=21), T1 (n=21), T2 (n=16); AW: T0 (n=23), T1 (n=18), T2 (n=16); SR: T0 (n=23), T1 (n=16), T2 (n=15) RPE at End of Overground at Preferred Speed TC: T0 (n=24), T1 (n=22), T2 (n=19); AW: T0 (n=24), T1 (n=18), T2 (n=16); SR: T0 (n=24), T1 (n=18), T2 (n=17) Pittsburgh Fatigability Scale: Physical Fatigability TC: T0 (n=24), T1 (n=23), T2 (n=23); AW: T0 (n=24), T1 (n=20), T2 (n=21); SR: T0 (n=24), T1 (n=22), T2 (n=22) Performance Deterioration TC: T0 (n=24), T1 (n=22), T2 (n=20); AW: T0 (n=24), T1 (n=18), T2 (n=18); SR: T0 (n=24), T1 (n=19), T2 (n=18) T0 Baseline * T0 adjusted T1 12-week follow-up ** T0, age, and MVPA adjusted T2 24-week follow-up
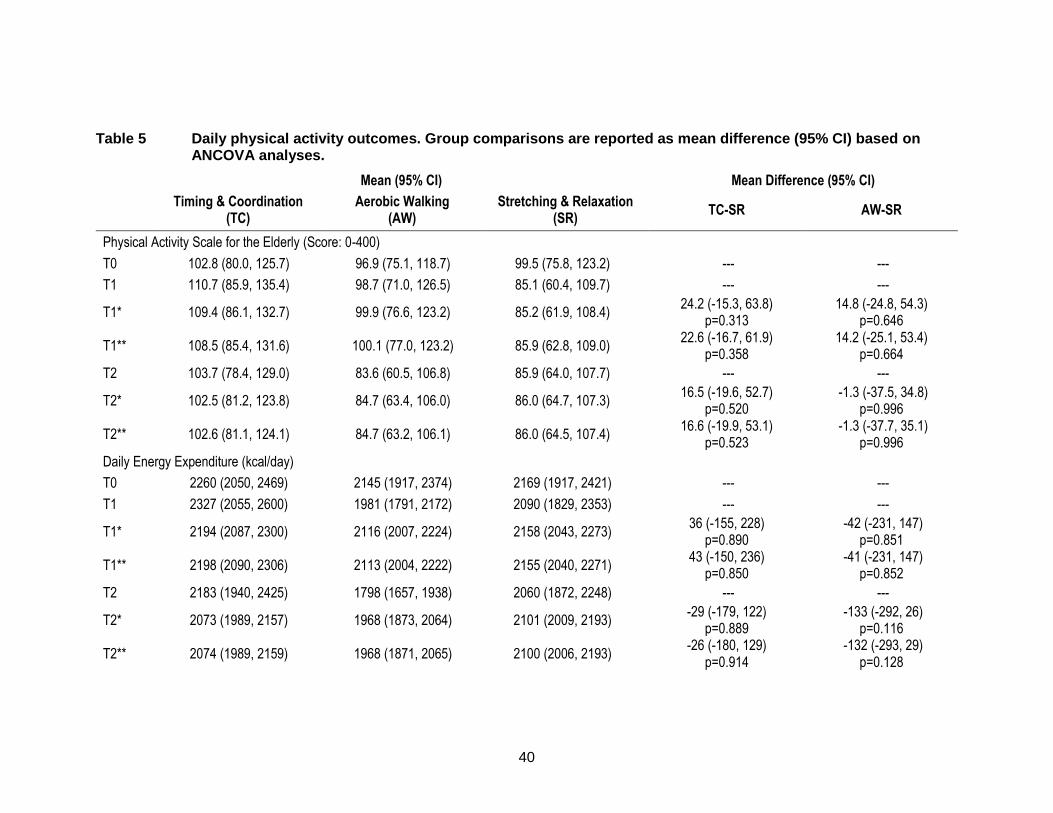
40
Table 5 Daily physical activity outcomes. Group comparisons are reported as mean difference (95% CI) based on ANCOVA analyses.
Mean (95% CI) Mean Difference (95% CI)
Timing & Coordination
(TC) Aerobic Walking
(AW) Stretching & Relaxation
(SR) TC-SR AW-SR
Physical Activity Scale for the Elderly (Score: 0-400)
T0 102.8 (80.0, 125.7) 96.9 (75.1, 118.7) 99.5 (75.8, 123.2) --- ---
T1 110.7 (85.9, 135.4) 98.7 (71.0, 126.5) 85.1 (60.4, 109.7) --- ---
T1* 109.4 (86.1, 132.7) 99.9 (76.6, 123.2) 85.2 (61.9, 108.4) 24.2 (-15.3, 63.8)
p=0.313 14.8 (-24.8, 54.3)
p=0.646
T1** 108.5 (85.4, 131.6) 100.1 (77.0, 123.2) 85.9 (62.8, 109.0) 22.6 (-16.7, 61.9)
p=0.358 14.2 (-25.1, 53.4)
p=0.664
T2 103.7 (78.4, 129.0) 83.6 (60.5, 106.8) 85.9 (64.0, 107.7) --- ---
T2* 102.5 (81.2, 123.8) 84.7 (63.4, 106.0) 86.0 (64.7, 107.3) 16.5 (-19.6, 52.7)
p=0.520 -1.3 (-37.5, 34.8)
p=0.996
T2** 102.6 (81.1, 124.1) 84.7 (63.2, 106.1) 86.0 (64.5, 107.4) 16.6 (-19.9, 53.1)
p=0.523 -1.3 (-37.7, 35.1)
p=0.996
Daily Energy Expenditure (kcal/day)
T0 2260 (2050, 2469) 2145 (1917, 2374) 2169 (1917, 2421) --- ---
T1 2327 (2055, 2600) 1981 (1791, 2172) 2090 (1829, 2353) --- ---
T1* 2194 (2087, 2300) 2116 (2007, 2224) 2158 (2043, 2273) 36 (-155, 228)
p=0.890 -42 (-231, 147)
p=0.851
T1** 2198 (2090, 2306) 2113 (2004, 2222) 2155 (2040, 2271) 43 (-150, 236)
p=0.850 -41 (-231, 147)
p=0.852
T2 2183 (1940, 2425) 1798 (1657, 1938) 2060 (1872, 2248) --- ---
T2* 2073 (1989, 2157) 1968 (1873, 2064) 2101 (2009, 2193) -29 (-179, 122)
p=0.889 -133 (-292, 26)
p=0.116
T2** 2074 (1989, 2159) 1968 (1871, 2065) 2100 (2006, 2193) -26 (-180, 129)
p=0.914 -132 (-293, 29)
p=0.128
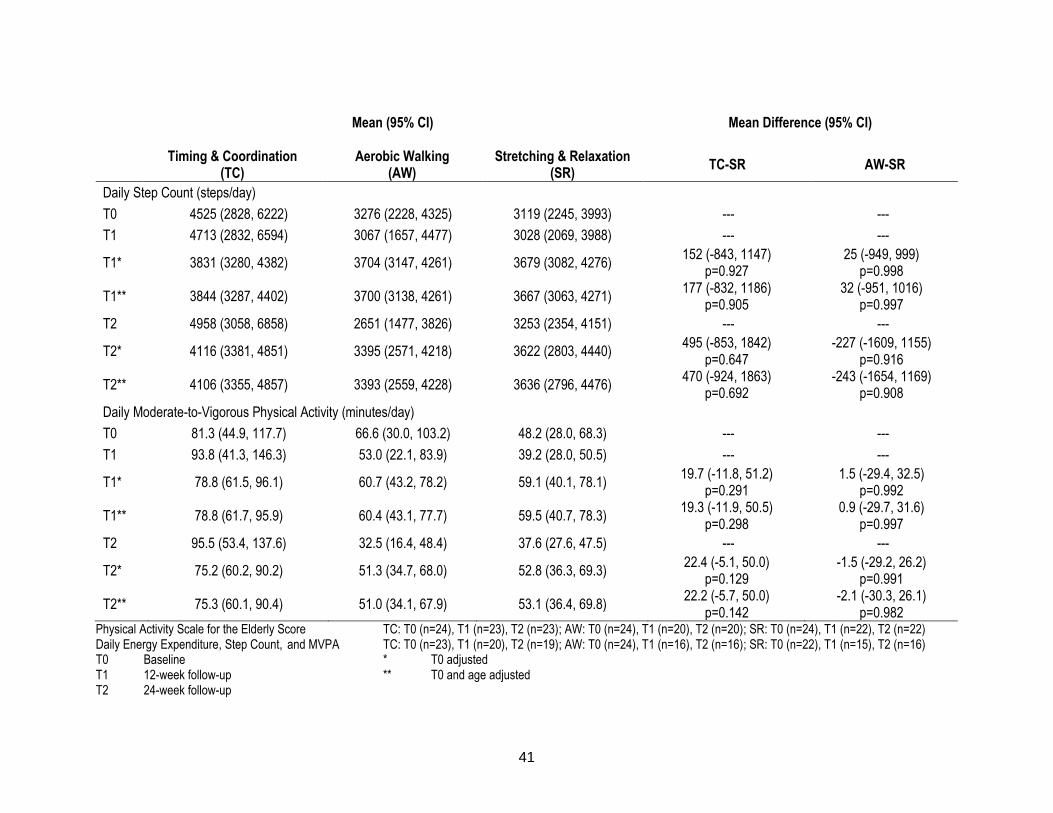
41
Mean (95% CI) Mean Difference (95% CI)
Timing & Coordination
(TC) Aerobic Walking
(AW) Stretching & Relaxation
(SR) TC-SR AW-SR
Daily Step Count (steps/day)
T0 4525 (2828, 6222) 3276 (2228, 4325) 3119 (2245, 3993) --- ---
T1 4713 (2832, 6594) 3067 (1657, 4477) 3028 (2069, 3988) --- ---
T1* 3831 (3280, 4382) 3704 (3147, 4261) 3679 (3082, 4276) 152 (-843, 1147)
p=0.927 25 (-949, 999)
p=0.998
T1** 3844 (3287, 4402) 3700 (3138, 4261) 3667 (3063, 4271) 177 (-832, 1186)
p=0.905 32 (-951, 1016)
p=0.997
T2 4958 (3058, 6858) 2651 (1477, 3826) 3253 (2354, 4151) --- ---
T2* 4116 (3381, 4851) 3395 (2571, 4218) 3622 (2803, 4440) 495 (-853, 1842)
p=0.647 -227 (-1609, 1155)
p=0.916
T2** 4106 (3355, 4857) 3393 (2559, 4228) 3636 (2796, 4476) 470 (-924, 1863)
p=0.692 -243 (-1654, 1169)
p=0.908
Daily Moderate-to-Vigorous Physical Activity (minutes/day)
T0 81.3 (44.9, 117.7) 66.6 (30.0, 103.2) 48.2 (28.0, 68.3) --- ---
T1 93.8 (41.3, 146.3) 53.0 (22.1, 83.9) 39.2 (28.0, 50.5) --- ---
T1* 78.8 (61.5, 96.1) 60.7 (43.2, 78.2) 59.1 (40.1, 78.1) 19.7 (-11.8, 51.2)
p=0.291 1.5 (-29.4, 32.5)
p=0.992
T1** 78.8 (61.7, 95.9) 60.4 (43.1, 77.7) 59.5 (40.7, 78.3) 19.3 (-11.9, 50.5)
p=0.298 0.9 (-29.7, 31.6)
p=0.997
T2 95.5 (53.4, 137.6) 32.5 (16.4, 48.4) 37.6 (27.6, 47.5) --- ---
T2* 75.2 (60.2, 90.2) 51.3 (34.7, 68.0) 52.8 (36.3, 69.3) 22.4 (-5.1, 50.0)
p=0.129 -1.5 (-29.2, 26.2)
p=0.991
T2** 75.3 (60.1, 90.4) 51.0 (34.1, 67.9) 53.1 (36.4, 69.8) 22.2 (-5.7, 50.0)
p=0.142 -2.1 (-30.3, 26.1)
p=0.982 Physical Activity Scale for the Elderly Score TC: T0 (n=24), T1 (n=23), T2 (n=23); AW: T0 (n=24), T1 (n=20), T2 (n=20); SR: T0 (n=24), T1 (n=22), T2 (n=22) Daily Energy Expenditure, Step Count, and MVPA TC: T0 (n=23), T1 (n=20), T2 (n=19); AW: T0 (n=24), T1 (n=16), T2 (n=16); SR: T0 (n=22), T1 (n=15), T2 (n=16) T0 Baseline * T0 adjusted T1 12-week follow-up ** T0 and age adjusted T2 24-week follow-up
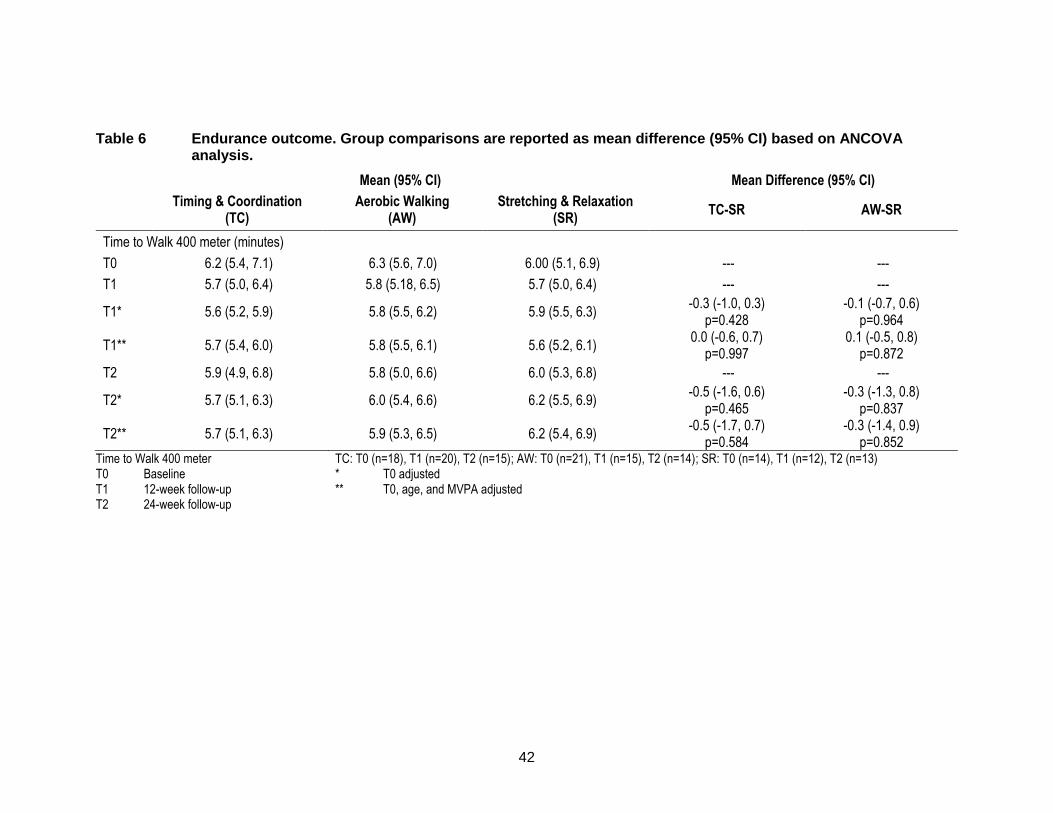
42
Table 6 Endurance outcome. Group comparisons are reported as mean difference (95% CI) based on ANCOVA analysis.
Mean (95% CI) Mean Difference (95% CI)
Timing & Coordination
(TC) Aerobic Walking
(AW) Stretching & Relaxation
(SR) TC-SR AW-SR
Time to Walk 400 meter (minutes)
T0 6.2 (5.4, 7.1) 6.3 (5.6, 7.0) 6.00 (5.1, 6.9) --- ---
T1 5.7 (5.0, 6.4) 5.8 (5.18, 6.5) 5.7 (5.0, 6.4) --- ---
T1* 5.6 (5.2, 5.9) 5.8 (5.5, 6.2) 5.9 (5.5, 6.3) -0.3 (-1.0, 0.3)
p=0.428 -0.1 (-0.7, 0.6)
p=0.964
T1** 5.7 (5.4, 6.0) 5.8 (5.5, 6.1) 5.6 (5.2, 6.1) 0.0 (-0.6, 0.7)
p=0.997 0.1 (-0.5, 0.8)
p=0.872
T2 5.9 (4.9, 6.8) 5.8 (5.0, 6.6) 6.0 (5.3, 6.8) --- ---
T2* 5.7 (5.1, 6.3) 6.0 (5.4, 6.6) 6.2 (5.5, 6.9) -0.5 (-1.6, 0.6)
p=0.465 -0.3 (-1.3, 0.8)
p=0.837
T2** 5.7 (5.1, 6.3) 5.9 (5.3, 6.5) 6.2 (5.4, 6.9) -0.5 (-1.7, 0.7)
p=0.584 -0.3 (-1.4, 0.9)
p=0.852 Time to Walk 400 meter TC: T0 (n=18), T1 (n=20), T2 (n=15); AW: T0 (n=21), T1 (n=15), T2 (n=14); SR: T0 (n=14), T1 (n=12), T2 (n=13) T0 Baseline * T0 adjusted T1 12-week follow-up ** T0, age, and MVPA adjusted T2 24-week follow-up
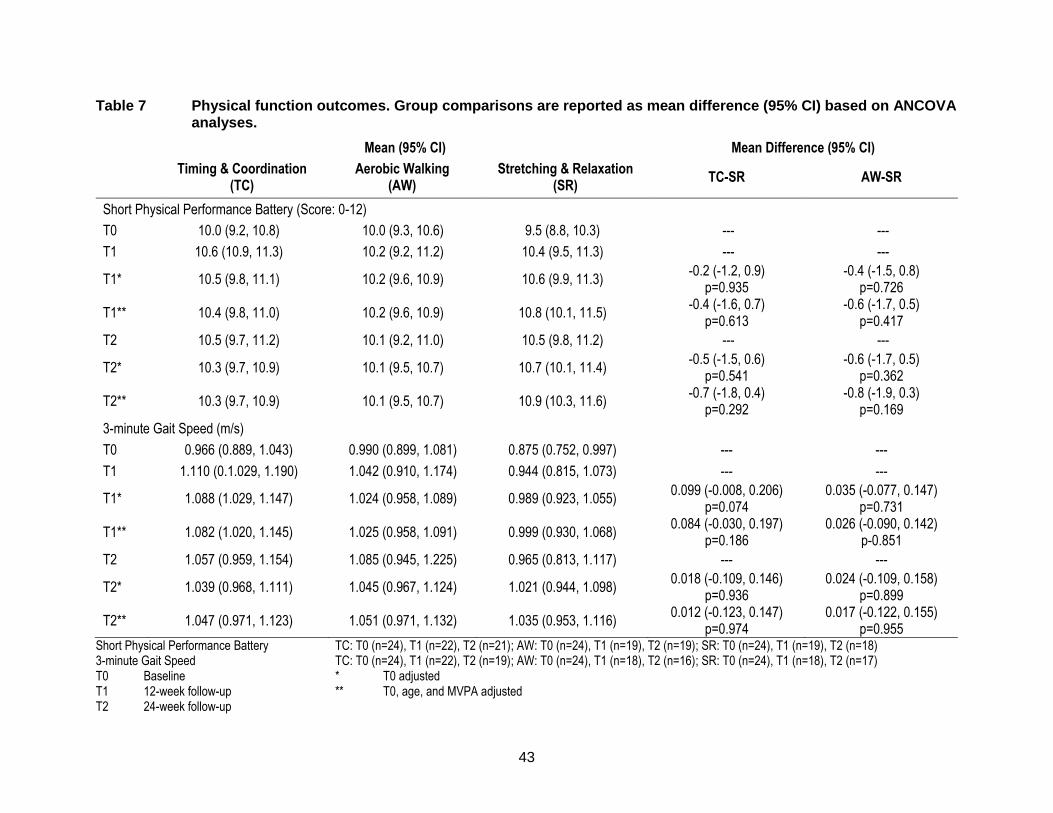
43
Table 7 Physical function outcomes. Group comparisons are reported as mean difference (95% CI) based on ANCOVA analyses.
Mean (95% CI) Mean Difference (95% CI)
Timing & Coordination
(TC) Aerobic Walking
(AW) Stretching & Relaxation
(SR) TC-SR AW-SR
Short Physical Performance Battery (Score: 0-12)
T0 10.0 (9.2, 10.8) 10.0 (9.3, 10.6) 9.5 (8.8, 10.3) --- ---
T1 10.6 (10.9, 11.3) 10.2 (9.2, 11.2) 10.4 (9.5, 11.3) --- ---
T1* 10.5 (9.8, 11.1) 10.2 (9.6, 10.9) 10.6 (9.9, 11.3) -0.2 (-1.2, 0.9)
p=0.935 -0.4 (-1.5, 0.8)
p=0.726
T1** 10.4 (9.8, 11.0) 10.2 (9.6, 10.9) 10.8 (10.1, 11.5) -0.4 (-1.6, 0.7)
p=0.613 -0.6 (-1.7, 0.5)
p=0.417
T2 10.5 (9.7, 11.2) 10.1 (9.2, 11.0) 10.5 (9.8, 11.2) --- ---
T2* 10.3 (9.7, 10.9) 10.1 (9.5, 10.7) 10.7 (10.1, 11.4) -0.5 (-1.5, 0.6)
p=0.541 -0.6 (-1.7, 0.5)
p=0.362
T2** 10.3 (9.7, 10.9) 10.1 (9.5, 10.7) 10.9 (10.3, 11.6) -0.7 (-1.8, 0.4)
p=0.292 -0.8 (-1.9, 0.3)
p=0.169
3-minute Gait Speed (m/s)
T0 0.966 (0.889, 1.043) 0.990 (0.899, 1.081) 0.875 (0.752, 0.997) --- ---
T1 1.110 (0.1.029, 1.190) 1.042 (0.910, 1.174) 0.944 (0.815, 1.073) --- ---
T1* 1.088 (1.029, 1.147) 1.024 (0.958, 1.089) 0.989 (0.923, 1.055) 0.099 (-0.008, 0.206)
p=0.074 0.035 (-0.077, 0.147)
p=0.731
T1** 1.082 (1.020, 1.145) 1.025 (0.958, 1.091) 0.999 (0.930, 1.068) 0.084 (-0.030, 0.197)
p=0.186 0.026 (-0.090, 0.142)
p-0.851
T2 1.057 (0.959, 1.154) 1.085 (0.945, 1.225) 0.965 (0.813, 1.117) --- ---
T2* 1.039 (0.968, 1.111) 1.045 (0.967, 1.124) 1.021 (0.944, 1.098) 0.018 (-0.109, 0.146)
p=0.936 0.024 (-0.109, 0.158)
p=0.899
T2** 1.047 (0.971, 1.123) 1.051 (0.971, 1.132) 1.035 (0.953, 1.116) 0.012 (-0.123, 0.147)
p=0.974 0.017 (-0.122, 0.155)
p=0.955 Short Physical Performance Battery TC: T0 (n=24), T1 (n=22), T2 (n=21); AW: T0 (n=24), T1 (n=19), T2 (n=19); SR: T0 (n=24), T1 (n=19), T2 (n=18) 3-minute Gait Speed TC: T0 (n=24), T1 (n=22), T2 (n=19); AW: T0 (n=24), T1 (n=18), T2 (n=16); SR: T0 (n=24), T1 (n=18), T2 (n=17) T0 Baseline * T0 adjusted T1 12-week follow-up ** T0, age, and MVPA adjusted T2 24-week follow-up

44
Table 8 Life-space mobility outcomes. Group comparisons are reported as mean difference (95% CI) based on ANCOVA analyses unless otherwise stated.
Mean (95% CI) Mean Difference (95% CI)
Timing & Coordination
(TC) Aerobic Walking
(AW) Stretching & Relaxation
(SR) TC-SR AW-SR
Life-Space Assessment (Score: 0-120)
T0 65.6 (57.2, 74.0) 63.1 (53.3, 72.9) 53.1 (44.2, 61.9) --- ---
T1 79.5 (72.0, 86.8) 63.6 (54.3, 72.8) 64.3 (55.0, 73.6) --- ---
T1* 76.6 (69.8, 83.3) 63.2 (56.0, 70.3) 68.1 (61.2, 75.0) 8.5 (-3.3, 20.3)
p=0.204 -4.9 (-16.9, 7.0)
p=0.585
T1** 74.9 (68.0, 81.9) 63.7 (56.6, 70.8) 69.8 (62.5, 77.1) 5.1 (-7.2, 17.5)
p=0.578 -6.1 (-18.3, 6.1)
p-0.456
T2 71.4 (63.5, 79.2) 67.6 (60.5, 74.7) 64.9 (56.0, 73.7) --- ---
T2* 68.7 (62.3, 75.1) 67.2 (60.5, 74.0) 68.0 (61.4, 74.6) 0.7 (-10.5, 11.9)
p=0.989 -0.8 (-12.1, 10.6)
p=0.986
T2** 69.5 (62.8, 76.2) 67.5 (60.6, 74.4) 69.6 (62.6, 76.6) -0.1 (-12.0, 11.8)
p=1.000 -2.1 (-13.9, 9.7)
p=0.900
Restricted Life-Space, N(%) - comparisons reported as odds ratios
T0 9 (37.5) 6 (25.0) 12 (50.0) --- ---
T1 2 (8.7) 6 (30.0) 10 (45.5) 0.267 (0.046, 1.530)
p=0.249 1.200 (0.293, 4.909)
p=1.000
T2 6 (26.1) 5 (25.0) 11 (50.0) 0.727 (0.195, 2.716)
p=0.744 0.909 (0.215, 3.843)
p=1.000 Life-Space Assessment TC: T0 (n=24), T1 (n=23), T2 (n=23); AW: T0 (n=24), T1 (n=20), T2 (n=20); SR: T0 (n=24), T1 (n=21), T2 (n=22) Restricted Life-Space TC: T0 (n=24), T1 (n=23), T2 (n=23); AW: T0 (n=24), T1 (n=20), T2 (n=20); SR: T0 (n=24), T1 (n=21), T2 (n=22) T0 Baseline * T0 adjusted T1 12-week follow-up ** T0, age, and MVPA adjusted T2 24-week follow-up
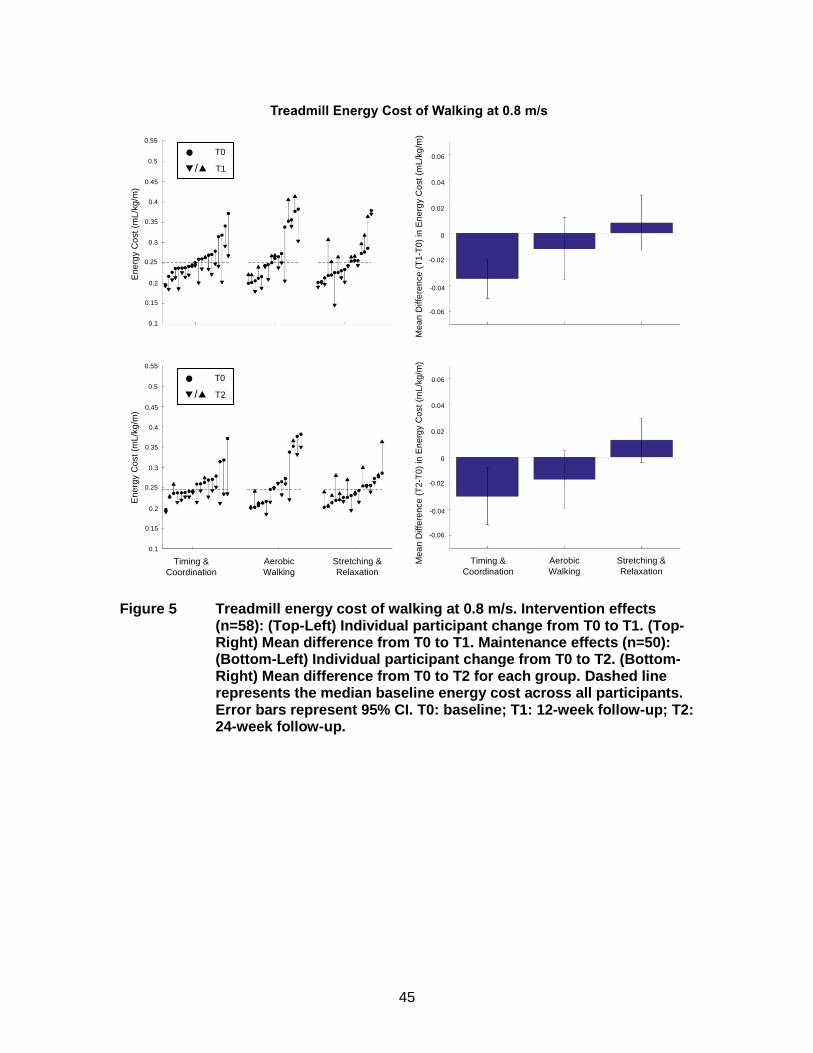
45
Figure 5 Treadmill energy cost of walking at 0.8 m/s. Intervention effects (n=58): (Top-Left) Individual participant change from T0 to T1. (Top-Right) Mean difference from T0 to T1. Maintenance effects (n=50): (Bottom-Left) Individual participant change from T0 to T2. (Bottom-Right) Mean difference from T0 to T2 for each group. Dashed line represents the median baseline energy cost across all participants. Error bars represent 95% CI. T0: baseline; T1: 12-week follow-up; T2: 24-week follow-up.
Energy Cost of Walking (T0 to T1)E
nerg
y C
ost
of W
alk
ing
at 0
.8 m
/s (
mL/k
g/m
)
Timing & Coordination (n=20)
Aerobic Walking (n=16)
Stretching & Relaxation(n=17)
T0
/ T1
Energy Cost of Walking (T0 to T2)
En
erg
y C
ost
of
Walk
ing
at
0.8
m/s
(m
L/k
g/m
)
Timing & Coordination (n=17)
Aerobic Walking (n=14)
Stretching & Relaxation(n=16)
T0
/ T2
En
erg
y C
ost
(mL
/kg
/m)
En
erg
y C
ost
(mL
/kg
/m)
Timing &
Coordination
Aerobic
Walking
Stretching &
RelaxationTiming &
Coordination
Aerobic
Walking
Stretching &
Relaxation
Me
an
Diffe
ren
ce
(T
2-T
0)
in E
ne
rgy C
ost
(mL
/kg
/m)
Me
an
Diffe
ren
ce
(T
1-T
0)
in E
ne
rgy C
ost
(mL
/kg
/m)
Treadmill Energy Cost of Walking at 0.8 m/s
0.55
0.5
0.45
0.4
0.35
0.3
0.25
0.2
0.15
0.1
0.55
0.5
0.45
0.4
0.35
0.3
0.25
0.2
0.15
0.1
0.06
0.04
0.02
0
-0.02
-0.04
-0.06
0.06
0.04
0.02
0
-0.02
-0.04
-0.06
T0
/ T2
T0
/ T1
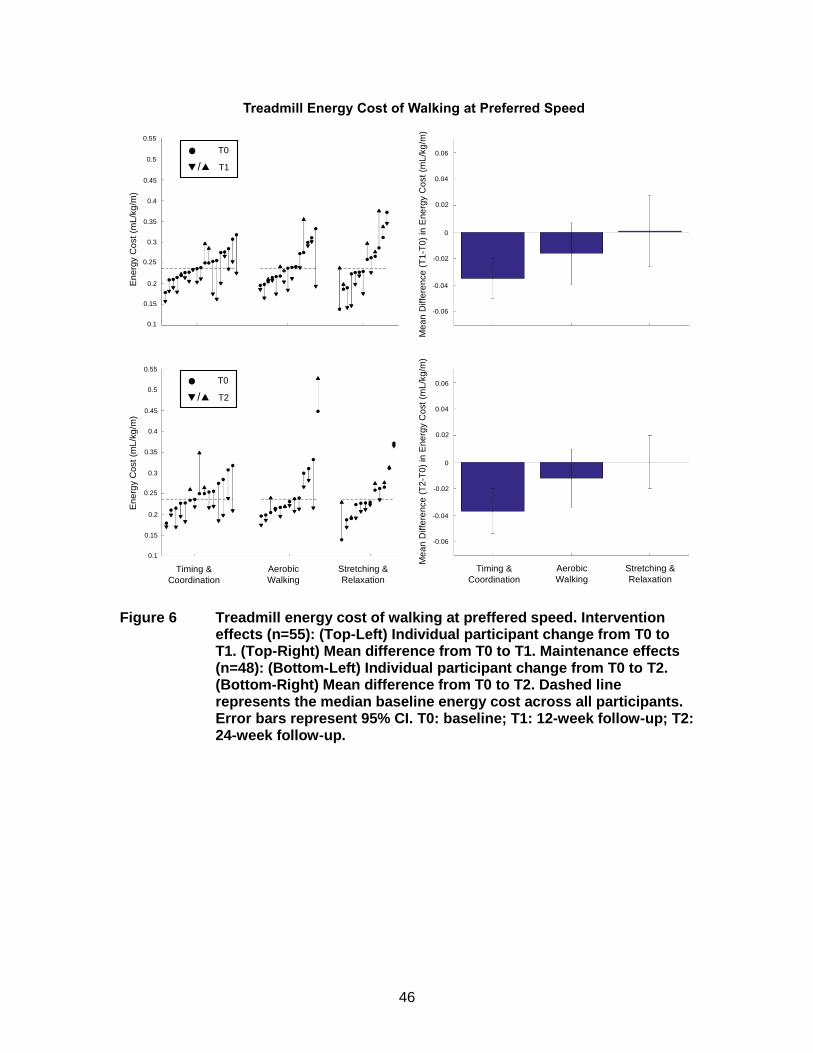
46
Figure 6 Treadmill energy cost of walking at preffered speed. Intervention effects (n=55): (Top-Left) Individual participant change from T0 to T1. (Top-Right) Mean difference from T0 to T1. Maintenance effects (n=48): (Bottom-Left) Individual participant change from T0 to T2. (Bottom-Right) Mean difference from T0 to T2. Dashed line represents the median baseline energy cost across all participants. Error bars represent 95% CI. T0: baseline; T1: 12-week follow-up; T2: 24-week follow-up.
Ene
rgy C
ost
of
Wa
lkin
g a
t P
refe
rre
d S
pe
ed
(m
L/k
g/m
)
Timing & Coordination
(n=19)
Aerobic Walking
(n=15)
Stretching & Relaxation
(n=13)
T0
/ T1
Energy Cost of Walking (T0 to T1)
Timing & Coordination
(n=15)
Aerobic Walking
(n=13)
Stretching & Relaxation
(n=12)
T0
/ T2
Ene
rgy C
ost
of
Wa
lkin
g a
t P
refe
rred
Spe
ed (
mL
/kg
/m)
Energy Cost of Walking (T0 to T2)
Timing &
Coordination
Aerobic
Walking
Stretching &
RelaxationTiming &
Coordination
Aerobic
Walking
Stretching &
Relaxation
Treadmill Energy Cost of Walking at Preferred Speed
En
erg
y C
ost
(mL
/kg
/m)
En
erg
y C
ost
(mL
/kg
/m)
0.55
0.5
0.45
0.4
0.35
0.3
0.25
0.2
0.15
0.1
0.55
0.5
0.45
0.4
0.35
0.3
0.25
0.2
0.15
0.1
Me
an
Diffe
ren
ce
(T
2-T
0)
in E
ne
rgy C
ost
(mL
/kg
/m)
Me
an
Diffe
ren
ce
(T
1-T
0)
in E
ne
rgy C
ost
(mL
/kg
/m)
0.06
0.04
0.02
0
-0.02
-0.04
-0.06
0.06
0.04
0.02
0
-0.02
-0.04
-0.06
T0
/ T2
T0
/ T1

47
Table 9 Energy cost of walking outcomes separated into higher or lower than median baseline energy cost for each walk test. Group comparisons are reported as mean difference (95% CI) based on ANCOVA analyses.
Mean Difference (95% CI)
Baseline Energy Cost TC-SR AW-SR
Treadmill at 0.8 m/s (mL/kg/m)
T1* High -0.062 (-0.125, 0.001) p=0.055
-0.0002 (-0.068, 0.070) p=1.000
Low -0.009 (-0.069, 0.050) p=0.997
-0.001 (-0.063, 0.061) p=1.000
T2* High -0.044 (-0.097, 0.009) p=0.160
0.002 (-0.053, 0.057) p=1.000
Low -0.008 (-0.056, 0.040) p=0.997
-0.022 (-0.075, 0.030) p=0.795
Treadmill at Preferred Speed (mL/kg/m)
T1* High -0.065 (-0.128, -0.002) p=0.038
-0.017 (-0.084, 0.050) p=0.974
Low 0.009 (-0.052, 0.070) p=0.998
0.009 (-0.055, 0.072) p=1.000
T2* High -0.046 (-0.132, 0.039) p=0.582
0.002 (-0.089, 0.094) p=1.000
Low -0.005 (-0.090, 0.080) p=1.000
0.002 (-0.083, 0.087) p=1.000
Overground at Preferred Speed (mL/kg/m)
T1* High -0.046 (-0.137, 0.046) p=0.676
-0.011 (-0.100, 0.078) p=0.999
Low -0.001 (-0.088, 0.086) p=1.000
0.007 (-0.094, 0.107) p=1.000
T2* High -0.032 (-0.134, 0.071) p=0.939
-0.010 (-0.095, 0.114) p=1.000
Low -0.009 (-0.105, 0.087) p=1.000
0.001 (-0.104, 0.106) p=1.000
Treadmill at 0.8 m/s High: TC: T0 (n=13), T1 (n=11), T2 (n=9); AW: T0 (n=11), T1 (n=8), T2 (n=7); SR: T0 (n=9), T1 (n=7), T2 (n=6) Low: TC: T0 (n=9), T1 (n=9), T2 (n=8); AW: T0 (n=12), T1 (n=8), T2 (n=7); SR: T0 (n=12), T1 (n=10), T2 (n=10) Treadmill at Preferred Speed High: TC: T0 (n=13), T1 (n=11), T2 (n=10); AW: T0 (n=9), T1 (n=8), T2 (n=6); SR: T0 (n=11), T1 (n=7), T2 (n=6) Low: TC: T0 (n=10), T1 (n=10), T2 (n=8); AW: T0 (n=14), T1 (n=9), T2 (n=9); SR: T0 (n=9), T1 (n=8), T2 (n=7) Overground at Preferred Speed High: TC: T0 (n=10), T1 (n=9), T2 (n=8); AW: T0 (n=11), T1 (n=9), T2 (n=7); SR: T0 (n=13), T1 (n=9), T2 (n=7) Low: TC: T0 (n=13), T1 (n=13), T2 (n=11); AW: T0 (n=12), T1 (n=8), T2 (n=8); SR: T0 (n=9), T1 (n=8), T2 (n=8) TC Timing and Coordination T0 Baseline AW Aerobic Walking T1 12-week follow-up SR Stretching and Relaxation T2 24-week follow-up * T0 adjusted
48
Chapter 4. Discussion
In community-dwelling older adults with self- reported mobility limitation enrolled
in the HealthySteps Study, we found that 12 weeks of twice-weekly TC training reduced
the energy cost of walking on a treadmill at 0.8 m/s by 15% and at preferred speed by
13%, relative to an active control; the reduction in energy cost was greater among those
with high (> median) baseline energy cost. The reduction in energy cost was also
maintained 12 weeks after the intervention end, particularly among those with high
baseline energy cost and those without OA. TC training was designed to improve gait
inefficiencies by improving the body’s capacity for movement through recent and
relevant training. Our findings indicate that this training program led to improved walking
energetics, and to a trend in a clinically meaningful increase in preferred gait speed.
The HealthySteps Study replicates and extends the previous work of
VanSwearingen et al. (VanSwearingen et al., 2009, 2011) and Brach et al.(Brach et al.,
2015, 2013) who reported that 12 weeks of one-to-one physical therapist guided, twice-
weekly TC training improved walking ability among older adults with a range of walking
difficulties, such that walking became faster, more efficient, and more skilled, and
walking confidence increased. Our results suggest that the effects of TC training are
sustained following 12-weeks of training cessation, which has not been previously
reported, and they appear to be robust to intervention setting, delivery mode, and
participant group. Specifically, we demonstrated that TC training can be reliably and
effectively delivered to small groups of older adults with self-reported mobility limitation
in community settings by fitness instructors. Importantly, the effect size reduction in the
energy cost of walking was consistent with those of one-to-one physical therapist guided
interventions (Brach & VanSwearingen, 2013), and average intervention adherence was
high at 86%.
Despite reductions in the energy cost of walking on a treadmill among those that
completed TC training compared to SR, reductions were not observed on the
overground walk. The most standardized test for the energy cost of walking
measurement in the HealthySteps Study was the 0.8 m/s test, as it standardized the
workload between and within all subjects at each time point. Neither the treadmill
preferred speed nor the overground preferred speed tests were standardized between
49
subjects; however, the treadmill preferred speed test was standardized within subjects.
For this reason, the overground walk introduced the most variability into the energy cost
of walking measurement, which may have contributed to the lack of intervention effect.
The observed reduction in the energy cost of walking was not accompanied by a
corresponding reduction in measured fatigability, as would have been predicted by
Schrack’s energetic pathway to mobility loss (Schrack et al., 2010b). Others have
recorded perceived exertion during walking tests and reported a similar lack of the
expected relationship between perceived effort and energy cost of walking (Julius,
Brach, Wert, & VanSwearingen, 2012); however, there are a few possible explanations
for this finding. One explanation is that the moderate reduction in energetic cost of
walking was not large enough to cause perceivable changes in fatigability, and
participants may not have obtained enough experience at the lower energetic cost to
perceive a change in their fatigability. A longer duration trial that elicits larger reductions
in energy cost or provides more experience at a lower energetic cost may lead to
changes in fatigability. A second explanation is that older adults with waking difficulty
have a high baseline level of fatigability that has developed over years of experience that
is insensitive to change. In support of this notion, HealthySteps participants reported
mean baseline Pittsburgh Fatigability Scale Physical scores of 20 or above for each
group, representing high baseline fatigability (Glynn et al., 2015).
Participants had a baseline gait speed of 0.9 m/s, which is consistent with older
adults who report walking difficulty. We observed a trend toward a clinically meaningful
increase in gait speed of 0.1 m/s at intervention end in TC compared to control,
consistent with other trials of TC training (Brach et al., 2013; VanSwearingen et al.,
2009). The TC intervention did not, however, lead to discernable changes in other
outcomes theorized to be downstream of the energy cost of walking (Schrack et al.,
2010b) including endurance, daily physical activity, or life-space mobility. TC training did
not specifically target lower extremity strength or endurance; thus, it might require more
than 12 weeks of training to realize improvements in these domains secondary to
reduced energetic cost. In addition, TC training did not incorporate behavior change
techniques, which may be necessary to achieve improvements in daily physical activity
and life-space mobility.
50
AW did not improve the energy cost of walking or any of the downstream
secondary outcomes. Walking difficulty in older adults is typically attributed to age-
related changes that impose inefficiencies within the gait cycle; specifically, alterations to
the biomechanics and movement control of walking that develop and produce slow,
inefficient, and unskilled movement (Brach & VanSwearingen, 2013). The results of this
study suggest that practicing outdoor walking regularly does not sufficiently address
these age-related changes in gait that impact walking ability.
The HealthySteps Study provides evidence in support of recommendations from
Brach and colleagues (Brach et al., 2016) to translate the novel TC program into group
exercise classes within the community setting. Brach and colleagues (Brach et al., 2016)
suggested that group class size be kept below 10 and include older adults who ambulate
independently, and that physical therapists should lead the groups. HealthySteps
classes involved groups of 5-6 participants with self-reported mobility limitation, and
were led by 1 fitness instructor and 2 student volunteers per class. We found this ratio of
instructor/volunteers to participants facilitated a positive class dynamic, as the instructor
was able to demonstrate the various stepping and walking patterns in the front of the
room, and the volunteers were able to work closely with the participants to ensure they
were understanding and following instructions. Brach and colleagues also recommended
using a large enough space to allow for performance of exercises without reducing the
intimacy of the setting. To this end, HealthySteps provided an inclusive environment that
was conducive to the implementation of the TC program HealthySteps focused on
creating a social, fun, and positive environment that participants enjoyed coming to each
week. Music was played during the TC classes, and participants were free to take rest
breaks as needed throughout the classes. Participants also seemed to enjoy interacting
with the younger generation volunteers, and this may have contributed to high
adherence.
4.1. Study Limitations
The HealthySteps Study has certain limitations. First, as this was a pilot study,
the sample size was small, and the study was not powered to detect changes in the
secondary outcomes. Nevertheless, the effect size estimates observed in HealthySteps
may help to plan appropriate sample sizes for future trials. Second, the 12-week
intervention period was relatively short in duration; the intervention and maintenance
51
effects may have been larger if the study was extended. Third, screening participants for
inclusion based on self-reported mobility limitation was efficient and precluded the need
for in-person screening, but it also resulted in a large degree of variability in baseline
energy cost of walking. Since results of this study showed that those with higher
baseline energy cost experienced larger intervention-induced reductions in the energy
cost of walking, future studies or community programs may benefit by screening for
inclusion based on energy cost. Fourth, TC participants completed treadmill walking
during their exercise classes, so the reduction in energy cost of walking observed in the
TC group may be due in part to a learning effect of repeated exposure to treadmill
walking during the intervention period; nevertheless, all participants had time to become
familiar with treadmill walking prior to each assessment.
4.2. Future Directions
As walking difficulty is a common characteristic of aging, addressing mobility
limitations are a major public health concern. With the combined impacts of an
increasingly aging and sedentary population, the burden of this condition will continue to
grow unless action is taken. It would be worthwhile to design and evaluate a
multicomponent exercise program that addresses a more comprehensive array of the
determinants of mobility to improve and maintain older adult mobility. For older adults,
strength and balance training have been successful in falls prevention (Karlsson,
Vonschewelov, Karlsson, Coster, & Rosengen, 2013; Shubert, 2011), resistance and
aerobic training have been shown to improve cognition (Bherer, Erickson, & Liu-
Ambrose, 2013; Karlsson et al., 2013), TC training can reduce the energy cost of
walking, and behaviour change strategies are effective at improving older adults’
motivation toward physical activity and being mobile within the community (Stewart et
al., 2006; Stewart, Sepsis, King, McLellan, & Ritter, 1997). By prescribing a
comprehensive exercise training program that is beneficial to overall older adult mobility,
rather than prescribing a single form of exercise, we could have greater benefits for
preventing disability and reducing admissions into long-term institutional care, and
maintaining functional autonomy in vulnerable older adults.
Beyond this direct application, a more fundamental question remains as to the
relationship between the energy cost of walking and fatigability. An observational trial
have shown an association between fatigability and the energy cost of walking
52
(Simonsick et al., 2016); however, changes in the energy cost of walking were not
reflected in fatigability measurements in the HealthySteps Study or in previous studies
(Julius et al., 2012). This lack of an associated change suggests there may be an
alternative pathway in which fatigability impacts mobility. Future research is needed to
investigate the determinants of fatigability among older adults.
4.3. Conclusion
In conclusion, we provide novel evidence from a randomized controlled trial that
a 12-week targeted TC training program delivered by fitness instructors to small groups
of community-dwelling older adults with mobility limitation led to a reduction in the
energy cost of walking, particularly among those with high baseline energy cost. This
effect was sustained following 12 weeks of training cessation. However, TC training did
not have an effect on fatigability, daily physical activity, endurance, physical function,
and life-space mobility. In addition, AW training had no effect on energy cost of walking
fatigability, daily physical activity, endurance, physical function, or life-space mobility.
53
References
Aboutorabi, A., Arazpour, M., Bahramizadeh, M., Hutchins, S. W., & Fadayevatan, R. (2015). The effect of aging on gait parameters in able-bodied older subjects: A literature review. Aging Clinical and Experimental Research, 28(3), 393–405. http://doi.org/10.1007/s40520-015-0420-6
Active Ageing: A Policy Framework. (2002). World Health Organization. Retrieved from http://www.informaworld.com/openurl?genre=article&doi=10.1080/713604647&magic=crossref%7C%7CD404A21C5BB053405B1A640AFFD44AE3
Bherer, L., Erickson, K. I., & Liu-Ambrose, T. (2013). A review of the effects of physical activity and exercise on cognitive and brain functions in older adults. Journal of Aging Research, 2013(657508). http://doi.org/10.1155/2013/657508
Borg, G. (1982). Ratings of perceived exertion and heart rates during short-term cycle exercise and their use in a new cycling strength test. International Journal of Sports Medicine, 3(3), 153–158. Retrieved from http://europepmc.org/abstract/MED/7129724
Brach, J. S., Francois, S. J., VanSwearingen, J. M., Gilmore, S., Perera, S., & Studenski, S. A. (2016). Translation of a motor learning walking rehabilitation program into a group-based exercise program for community-dwelling older adults. American Academy of Physical Medicine and Rehabilitation, 8(6), 520–528. http://doi.org/10.1016/j.pmrj.2015.10.004
Brach, J. S., Lowry, K., Perera, S., Hornyak, V., Wert, D., Studenski, S. A., & VanSwearingen, J. M. (2015). Improving motor control in walking: A randomized clinical trial in older adults with subclinical walking difficulty. Archives of Physical Medicine & Rehabilitationmedicine and Rehabilitation, 96(3), 388–394. http://doi.org/10.1016/j.apmr.2014.10.018
Brach, J. S., & VanSwearingen, J. M. (2013). Interventions to improve walking in older adults. Current Translational Geriatrics and Experimental Gerontology Reports, 2(4). http://doi.org/10.1016/j.micinf.2011.07.011.Innate
Brach, J. S., VanSwearingen, J. M., Newman, A. B., & Kriska, A. M. (2002). Identifying early decline of physical function in community-dwelling older women: Performance-based and self-report measures. Physical Therapy, 82(4), 320–328.
Brach, J. S., VanSwearingen, J. M., Perera, S., Wert, D. M., & Studenski, S. (2013). Motor learning versus standard walking exercise in older adults with subclinical gait dysfunction: A randomized clincial trial. Journal of the American Geriatrics Society, 61(11), 1879–1886. http://doi.org/10.1111/jgs.12506.Motor
Brooks, G. A., Fahey, T. D., & Baldwin, K. M. (2000). Exercise physiology: Human bioenergetics and its applications (6th ed.). Mountain View, California: Mayfield Pub.
Brooks, V. B. (1986). The neural basis of motor control.
54
Brown, C. J., & Flood, K. L. (2013). Mobility limitation in the older patient: A clinical review. Journal of the American Medical Association, 310(11), 1168–1677. http://doi.org/10.1001/jama.2013.276566
Canadian Society of Exercise Physiology. (2002). Physical activity readiness questionnaire - PAR-Q. Ottawa, Ontario.
Canadian Society of Exercise Physiology. (2012). Canadian physical activity and sedentary behaviour guidelines. Retrieved from www.csep.ca/guidelines
Colley, R. C., Garriguet, D., Janssen, I., Craig, C. L., Clarke, J., & Tremblay, M. S. (2011). Physical activity of Canadian adults: Accelerometer results from the 2007 to 2009 Canadian Health Measures Survey. Health Reports, 22(1), 7–14. http://doi.org/82-003-XPE
Eldadah, B. A. (2010). Fatigue and fatigability in older adults. American Academy of Physical Medicine and Rehabilitation, 2, 406–413. http://doi.org/10.1016/j.pmrj.2010.03.022
Ferrucci, L., Bandinelli, S., Benvenuti, E., Di Iorio, A., Macchi, C., Harris, T. B., & Guralnik, J. M. (2000). Subsystems contributing to the decline in ability to walk: Bridging the gap between epidemiology and geriatric practice in the InCHIANTI study. Journal of the American Geriatrics Society, 48, 1618–1625.
Ferrucci, L., Cooper, R., Shardell, M., Simonsick, E. M., Schrack, J. A., & Kuh, D. (2016). Age-related change in mobility: Perspectives from life course epidemiology and geroscience. The Journals of Gerontology Series A: Biological Sciences and Medical Sciences, 71(9), 1184–1194. http://doi.org/10.1093/gerona/glw043
Fiser, W. M., Hays, N. P., Rogers, S. C., Kajkenova, O., Williams, A. E., Evans, C. M., & Evans, W. J. (2010). Energetics of walking in elderly people: Factors related to gait speed. The Journals of Gerontology Series A: Biological Sciences and Medical Sciences, 65A(12), 1332–1337. http://doi.org/10.1093/gerona/glq137
Foley, D. J., Ostfeld, A. M., Branch, L. G., Wallace, R. B., McGloin, J., & Cornoni-Huntley, J. C. (1992). The risk of nursing home admission in three communities. Journal of Aging and Health, 4(2), 155–173.
Folstein, M. F., Folstein, S. E., & McHugh, P. R. (1975). “Mini-mental state”. A practical method for grading the cognitive state of patients for the clinician. Journal of Psychiatric Research, 12(3), 189–198. http://doi.org/10.1016/0022-3956(75)90026-6
Fried, L. P., Bandeen-Roche, K., Chaves, P. H., & Johnson, B. A. (2000). Preclinical mobility disability predicts incident mobility disability in older women. The Journals of Gerontology Series A: Biological Sciences and Medical Sciences, 55A(1), M43–M52. http://doi.org/Research Support, Non-U.S. Gov’t Research Support, U.S. Gov't, P.H.S.
Fuller-Thomson, E., Yu, B., Nuru-Jeter, A., Guralnik, J. M., & Minkler, M. (2009). Basic ADL disability and functional limitation rates among older americans from 2000-
55
2005: The end of the decline? The Journals of Gerontology Series A: Biological Sciences and Medical Sciences, 64(12), 1333–1336. http://doi.org/10.1093/gerona/glp130
Gill, T. M., Desai, M. M., Gahbauer, E. A., Holford, T. R., & Williams, C. S. (2001). Restricted activity among community-living older persons: Incidence, precipitants, and health care utilization. Annals of Internal Medicine, 135, 313–321.
Glynn, N. W., Santanasto, A. J., Simonsick, E. M., Boudreau, R. M., Beach, S. R., Schulz, R., & Newman, A. B. (2015). The pittsburgh fatigability scale for older adults: Development and validation. Journal of the American Geriatrics Society, 63(1), 130–135. http://doi.org/10.1111/jgs.13191
Guralnik, J. M., Ferrucci, L., Simonsick, E. M., Salive, M. E., & Wallace, R. B. (1995). Lower-extremity function in persons over the age of 70 years as a predictor of subsequent disability. The New England Journal of Medicine, 332(9), 556–561. http://doi.org/10.1017/CBO9781107415324.004
Hirvensalo, M., Rantanen, T., & Heikkinen, E. (2000). Mobility difficulties and physical activity as predictors of mortality and loss of independence in the community-living older population. Journal of the American Geriatrics Society, 48(5), 493–498. http://doi.org/10.1111/j.1532-5415.2000.tb04994.x
Jakicic, J. M., Marcus, M., Gallagher, K. I., Randall, C., Thomas, E., Goss, F. L., & Robertson, R. J. (2004). Evaluation of the SenseWear Pro Armband TM to assess energy expenditure during exercise. Medicine & Science in Sports & Exercise, 36(5), 897–904. http://doi.org/10.1249/01.MSS.0000126805.32659.43
Julius, L. M., Brach, J. S., Wert, D. M., & VanSwearingen, J. M. (2012). Perceived effort of walking: Relationship with gait, physical function and activity, fear of falling, and confidence in walking in older adults with mobility limitations. Physical Therapy, 92(10), 1268–1277. http://doi.org/10.2522/ptj.20110326
Karlsson, M. K., Vonschewelov, T., Karlsson, C., Coster, M., & Rosengen, B. E. (2013). Prevention of falls in the elderly: A review. Scandinavian Journal of Public Health, 41(5), 442–454. http://doi.org/10.1177/1403494813483215
Levine, J. A., McCrady, S. K., Lanningham-Foster, L. M., Kane, P. H., Foster, R. C., & Manohar, C. U. (2008). The role of free-living daily walking in human weight gain and obesity. Diabetes, 57(3), 548–554. http://doi.org/10.2337/db07-0815
Liu, C.-J., & Latham, N. K. (2009). Progressive resistance strength training for improving physical function in older adults. The Cochrane Database of Systematic Reviews, 3(CD002759). http://doi.org/10.1002/14651858.CD002759.pub2
Mackey, D. C., Cauley, J. A., Barrett-Connor, E., Schousboe, J. T., Cawthon, P. M., & Cummings, S. R. (2014). Life-space mobility and mortality in older men: A prospective cohort study. Journal of the American Geriatrics Society, 62(7), 1288–1296. http://doi.org/10.1111/jgs.12892
Mackey, D. C., Manini, T. M., Schoeller, D. a., Koster, A., Glynn, N. W., Goodpaster, B.
56
H., … Cummings, S. R. (2011). Validation of an armband to measure daily energy expenditure in older adults. The Journals of Gerontology Series A: Biological Sciences and Medical Sciences, 66A(10), 1108–1113. http://doi.org/10.1093/gerona/glr101
Mian, O. S., Thom, J. M., Ardigò, L. P., Morse, C. I., Narici, M. V, & Minetti, A. E. (2007). Effect of a 12-month physical conditioning programme on the metabolic cost of walking in healthy older adults. European Journal of Applied Physiology, 100, 499–505. http://doi.org/10.1007/s00421-006-0141-9
Newman, A. B., Simonsick, E. M., Naydeck, B. L., Boudreau, R. M., Kritchevsky, S. B., Nevitt, M. C., … Harris, T. B. (2006). Association of long-distance corridor walk performance with mortality, cardiovascular disease, mobility limitation, and disability. Journal of the American Medical Association, 295(17), 2018–2026. http://doi.org/10.1001/jama.295.17.2018
Peel, C., Sawyer Baker, P., Roth, D. L., Brown, C. J., Brodner, E. V, & Allman, R. M. (2005). Assessing mobility in older adults: the UAB Study of Aging Life-Space Assessment. Physical Therapy, 85(10), 1008–1019.
Perissinotto, C. M., Stijacic Cenzer, I., & Covinsky, K. E. (2012). Loneliness in older persons. Archives of Internal Medicine, 172(14), 1078–1084. http://doi.org/10.1001/archinternmed.2012.1993
Radloff, L. S. (1977). A self-report depression scale for research in the general population. Applied Psychological Measurement, 1(3), 385–401. http://doi.org/10.1177/014662167700100306
Rantanen, T. (2013). Promoting mobility in older people. Journal of Preventive Medicine and Public Health, 46(Suppl 1), S50–S54. http://doi.org/10.3961/jpmph.2013.46.S.S50
Richardson, C. A., Glynn, N. W., Ferrucci, L. G., & Mackey, D. C. (2015). Walking energetics, fatigability, and fatigue in older adults: The study of energy and aging pilot. The Journals of Gerontology Series A: Biological Sciences and Medical Sciences, 70(4), 487–494. http://doi.org/10.1093/gerona/glu146
Schoenfeld, D. (1980). Statistical considerations for pilot studies. International Journal of Radiation Oncology * Biology * Physics, 6(3), 371–374. http://doi.org/10.1016/0360-3016(80)90153-4
Schrack, J. A., Simonsick, E. M., Chaves, P. H. M., & Ferrucci, L. (2012). The role of energetic cost in the age-related slowing of gait speed. Journal of the American Geriatrics Society, 60(10), 1811–1816. http://doi.org/10.1111/j.1532-5415.2012.04153.x
Schrack, J. A., Simonsick, E. M., & Ferrucci, L. (2010a). Comparison of the Cosmed K4b2 portable metabolic system in measuring steady-state walking energy expenditure. PLoS ONE, 5(2), e9292. http://doi.org/10.1371/journal.pone.0009292
Schrack, J. A., Simonsick, E. M., & Ferrucci, L. (2010b). The energetic pathway to

57
mobility loss: An emerging new framework for longitudinal studies on aging. Journal of the American Geriatrics Society, 58, S329–S336. http://doi.org/10.1111/j.1532-5415.2010.02913.x
Schrack, J. A., Simonsick, E. M., & Ferrucci, L. (2013). The relationship of the energetic cost of slow walking and peak energy expenditure to gait speed in mid-to-late life. American Journal of Physical Medicine & Rehabilitation, 92(1), 28–35. http://doi.org/10.1097/PHM.0b013e3182644165
Schrack, J. A., Zipunnikov, V., Simonsick, E. M., Studenski, S., & Ferrucci, L. (2016). Rising energetic cost of walking predicts gait speed decline with aging. The Journals of Gerontology Series A: Biological Sciences and Medical Sciences, 00(00), 1–7. http://doi.org/10.1093/gerona/glw002
Schrager, M. a., Schrack, J. a., Simonsick, E. M., & Ferrucci, L. (2014). Association between energy availability and physical activity in older adults. American Journal of Physical Medicine & Rehabilitation, 93(10), 876–883. http://doi.org/10.1097/PHM.0000000000000108
Schulz, K. F., Altman, D. G., & Moher, D. (2010). CONSORT 2010 statement: Updated guidelines for reporting parallel group randomised trials. British Medical Journal, 340(c332). http://doi.org/10.1136/bmj.c332
Shubert, T. E. (2011). Evidence-based exercise prescription for balance and falls prevention. Journal of Geriatric Physical Therapy, 34(3), 100–108. http://doi.org/10.1519/JPT.0b013e31822938ac
Shumway-Cook, A., Ciol, M. A., Yorkston, K. M., Hoffman, J. M., & Chan, L. (2005). Mobility limitations in the medicare population: Prevalence and sociodemographic and clinical correlates. Journal of the American Geriatrics Society, 53, 1217–1221. http://doi.org/10.1111/j.1532-5415.2005.53372.x
Simonsick, E. M., Fan, E., & Fleg, J. L. (2006). Estimating cardiorespiratory fitness in well-functioning older adults: Treadmill validation of the long distance corridor walk. Journal of the American Geriatrics Society, 54, 127–132. http://doi.org/10.1111/j.1532-5415.2005.00530.x
Simonsick, E. M., Glynn, N. W., Jerome, G. J., Shardell, M., Schrack, J. A., & Ferrucci, L. (2016). Fatigued, but not frail: Perceived fatigability as a marker of impending decline in mobility-intact older adults. Journal of the American Geriatrics Society, 64, 1287–1292. http://doi.org/10.1111/jgs.14138
Simonsick, E. M., Montgomery, P. S., Newman, A. B., Bauer, D. C., & Harris, T. (2001). Measuring fitness in healthy older adults: The Health ABC long distance corridor walk. Journal of the American Geriatrics Society, 49(11), 1544–1548. http://doi.org/10.1046/j.1532-5415.2001.4911247.x
Simonsick, E. M., Newman, A. B., Visser, M., Goodpaster, B., Kritchevsky, S. B., Rubin, S., … Harris, T. B. (2008). Mobility limitation in self-described well-functioning older adults: Importance of endurance walk testing. The Journals of Gerontology Series A: Biological Sciences and Medical Sciences, 63A(8), 841–847.
58
http://doi.org/http://dx.doi.org/10.1093/gerona/63.8.841
Simonsick, E. M., Schrack, J. A., Glynn, N. W., & Ferrucci, L. (2014). Assessing fatigability in mobility-intact older adults. Journal of the American Geriatrics Society, 62(2), 347–351. http://doi.org/10.1111/jgs.12638
Stalvey, B. T., Owsley, C., Sloane, M. E., & Ball, K. (1999). The Life Space Questionnaire: A measure of the extent of mobility of older adults. Journal of Applied Gerontology, 18(4), 460–478. http://doi.org/10.1177/073346489901800404
Statistics Canada. (2006). Participation and Activity Limitation Survey 2006: Tables (part VI). http://doi.org/Catalogue no. 89-628-XIE — No. 002 ISSN 1915-0466 ISBN 978-0-662-47181-3
Statistics Canada. (2017). Census Profile. http://doi.org/Catalogue no. 98-316-X2016001
Stenholm, S., Shardell, M., Bandinelli, S., Guralnik, J. M., & Ferrucci, L. (2015). Physiological factors contributing to mobility loss over 9 years of follow-up-results from the InCHIANTI study. The Journals of Gerontology Series A: Biological Sciences and Medical Sciences, 70(5), 591–597. http://doi.org/10.1093/gerona/glv004
Stewart, A. L., Gillis, D., Grossman, M., Castrillo, M., Pruitt, L., McLellan, B., & Sperber, N. (2006). Diffusing a research-based physical activity promotion program for seniors into diverse communities: CHAMPS III. Preventing Chronic Disease, 3(2), A51.
Stewart, A. L., Sepsis, P. G., King, A. C., McLellan, B. Y., & Ritter, P. L. (1997). Evaluation of CHAMPS, a physical activity promotion program for older adults. Annals of Behavioral Medicine, 19(4), 353–361. http://doi.org/10.1007/BF02895154
Stuck, A. E., Walthert, J. M., Nikolaus, T., Büla, C. J., Hohmann, C., & Beck, J. C. (1999). Risk factors for functional status decline in community-living elderly people: A systematic literature review. Social Science & Medicine, 48(4), 445–469. http://doi.org/10.1016/S0277-9536(98)00370-0
Teng, E. L., & Chui, H. C. (1987). The Modified Mini-Mental State (3MS) Examination. Journal of Clinical Psychiatry, 48(8), 314–318.
Umstattd Meyer, M. R., Janke, M. C., & Beaujean, A. A. (2014). Predictors of older adults personal and community mobility: Using a comprehensive theoretical mobility framework. Gerontologist, 54(3), 398–408. http://doi.org/10.1093/geront/gnt054
VanSwearingen, J. M., Perera, S., Brach, J. S., Cham, R., Rosano, C., & Studenski, S. A. (2009). A randomized trial of two forms of therapeutic activity to improve walking: Effect on the energy cost of walking. The Journals of Gerontology Series A: Biological Sciences and Medical Sciences, 64(11), 1190–1198. http://doi.org/10.1093/gerona/glp098
VanSwearingen, J. M., Perera, S., Brach, J. S., Wert, D., & Studenski, S. A. (2011). Impact of exercise to improve gait efficiency on activity and participation in older
59
adults with mobility limitations: A randomized controlled trial. Physical Therapy, 91(12), 1740–51. http://doi.org/10.2522/ptj.20100391
VanSwearingen, J. M., & Studenski, S. A. (2014). Aging, motor skill, and the energy cost of walking: Implications for the prevention and treatment of mobility decline in older persons. The Journals of Gerontology Series A: Biological Sciences and Medical Sciences, 69A(11), 1429–1436. http://doi.org/10.1093/gerona/glu153
Verbrugge, L. M., & Jette, A. M. (1994). The disablement process. Social Science & Medicine, 38(1), 1–14.
Vestergaard, S., Nayfield, S. G., Patel, K. V, Eldadah, B., Cesari, M., Ferrucci, L., … Guralnik, J. M. (2009). Fatigue in a representative population of older persons and its association with functional impairment, functional limitation, and disability. The Journals of Gerontology Series A: Biological Sciences and Medical Sciences, 64A(1), 76–82. http://doi.org/10.1093/gerona/gln017
Washburn, R. A., Smith, K. W., Jette, A. M., & Janney, C. A. (1993). The physical activity scale for the elderly (PASE): Development and evaluation. Journal of Clinical Epidemiology, 46(2), 153–162. http://doi.org/10.1016/0895-4356(93)90053-4
Waters, R. L., & Mulroy, S. (1999). The energy expenditure of normal and pathological gait. Gait and Posture, 9, 207–231. http://doi.org/10.1016/S0966-6362(99)00009-0
Webber, S. C., Porter, M. M., & Menec, V. H. (2010). Mobility in older adults: A comprehensive framework. The Gerontologist, 50, 443–450. http://doi.org/10.1093/geront/gnq013
Wert, D. M., Brach, J., Perera, S., & VanSwearingen, J. M. (2010). Gait biomechanics, spatial and temporal characteristics, and the energy cost of walking in older adults with impaired mobility. Physical Therapy, 90, 977–985. http://doi.org/10.2522/ptj.20090316
Wert, D. M., VanSwearingen, J. M., Perera, S., & Brach, J. S. (2015). The Test-Retest Reliability of Indirect Calorimetry Measures of Energy Expenditure During Overground Walking in Older Adults With Mobility Limitations. Journal of Aging and Physical Activity, 23(3), 346–351. http://doi.org/10.1123/japa.2013-0268
Wert, D. M., Vanswearingen, J., Perera, S., Studenski, S., & Brach, J. S. (2016). The impact of a portable metabolic measurement device on gait characteristics of older adults with mobility limitations. Journal of Geriatric Physical Therapy, 39(2), 77–82. http://doi.org/10.1519/JPT.0000000000000053
World Health Organization. (2002). Towards a common language for functioning, disability and health ICF. International Classification, 1149, 1–22. http://doi.org/WHO/EIP/GPE/CAS/01.3
Zarrugh, M. Y., Todd, F. N., & Ralston, H. J. (1974). Optimization of energy expenditure during level walking. European Journal of Applied Physiology and Occupational Physiology, 33(4), 293–306.