seismic assessment of the matera cathedral
TRANSCRIPT
Seismic Assessment of the Matera Cathedral
E. Ramírez1(&), Paulo B. Lourenço2, and Michele D’Amato3
1 Department of Civil Engineering, University of Minho, Guimarães, [email protected]
2 Department of Civil Engineering, ISISE, University of Minho,Guimarães, Portugal
[email protected] Department of European and Mediterranean Cultures (Architecture,Environment and Heritage), University of Basilicata, Matera, Italy
Abstract. This paper presents the seismic assessment of the Cathedral ofMatera, in southern Italy, to determine the capacity of the structure when sub-jected to earthquakes. This church dates back to the 13th century and is one ofthe most representative monuments of the Apulian Romanesque architecture.Within the context of the evaluation of the seismic response of the cathedral,modal identification tests were performed in order identify and characterize themain dynamic properties of the structure. The results of these tests were used todevelop a representative finite element model, which is able to provide theresponse to seismic actions. A pushover analysis was performed to characterizethe seismic behavior of the structure. The results of the seismic analyses on thecathedral show that its vulnerability is high, being the transversal direction theless stiff and resistant. Elements as the nave and the façade, along with the belltower, might be the most vulnerable to seismic actions. Additionally, it wasobserved that components as the trusses of the central nave strongly modify theseismic response and capacity of the structure. Apparently, the structure mightnot be able to withstand a strong earthquake from the region or might presentseveral damage after one. Hence, it is recommendable to perform further studiesabout the seismic behavior, especially of the most vulnerable elements.
Keywords: Historical structures � Masonry structures � Seismic analysisPushover analysis � FE modelling
1 Introduction
Among the cultural heritage on the world, many monuments, buildings and historicalsites are located in areas with high seismic hazard. Probably, earthquakes are one of themain factors that cause the loss of heritage. In order to protect heritage buildings, it isimportant to perform assessment works that allow to understand their history anddiscuss the current state of the buildings.
The structural analysis of a historical construction is an important tool to determineits safety level to different actions and conditions, as well as to study the necessity toundertake remedial actions. However, the implementation of a model might face
© RILEM 2019R. Aguilar et al. (Eds.): Structural Analysis of Historical Constructions,RILEM Bookseries 18, pp. 1346–1354, 2019.https://doi.org/10.1007/978-3-319-99441-3_144

challenges regarding the main characteristics of the structure in study such as thegeometry and materials. For such cases, the use of non-destructive methodologiesmight be useful to complement the information obtained by traditional methods.
The development of modern inspection and diagnosis techniques represent animportant step on the conservation of historical structures. These methods normallyhave a non-destructive character and provide valuable information about the materials,morphology and/or structure characteristics. Nonetheless, many of these tests aremainly qualitative, and their results should be carefully interpreted. In the present work,the seismic assessment of the cathedral of Matera, located in a seismic-prone area,using nondestructive techniques and structural analysis is addressed.
2 Cathedral of Matera
The Cathedral of Matera named as Cattedrale della Madonna della Bruna e diSant’Eustachio is located in the south of Italy, in the historical center of Matera.Following the Cristian traditions, the façade is oriented facing the west and the altarfaces the east. The main body of the structure has a Latin cross distribution and iscomposed by three naves. The cross section of the main nave corresponds to a basilicachurch. A triumphal arch divides the nave with the presbytery and transept. Next to thepresbytery, at the back of the cathedral and behind the main altar, the apse is located.The architectural distribution of spaces is presented in Fig. 1.
Fig. 1. Plan of Matera cathedral
Seismic Assessment of the Matera Cathedral 1347

It is believed that the construction of the cathedral began between the years 1226and 1231 [1]. On the access of the bell tower, an inscription indicates that the con-struction finished on 1270 [2]. However, the chapels were annexed to the north sideseveral years later, between the 15th and 16th centuries [3]. During the 18th century, thechoir was completed in 1729 and reconstructed in 1738. Also, it is believed that thedome was reconstructed due to a partial collapse [3]. Regarding the bell tower, twosectors can be distinguished, as it is possible that the upper part, which is different thanthe rest, was added later [3].
3 Operational Modal Analysis
Operation modal analysis (OMA) tests were performed to determine the natural fre-quencies and modes of the structure. Four piezoelectric accelerometers were placed indifferent positions of the structure to measure the vibration caused by environmentalnoise (wind, traffic, etc.) as shown in Fig. 2. The accelerometers used had a sensitivityof 10 V/g and their measurement range equals ±0.5 g. Furthermore, a data acquisitionsystem and a portable computer were used to record the signals from the accelerom-eters. For each arrangement of the accelerometers the signals were recorded during30 min with a sampling frequency of 200 Hz.
As a first approach, the signals were processed using MATLAB [4] to remove noisefrom the reading and to determine their quality. After this, using the ARTeMIS Modalsoftware [5], the main dynamic characteristics (natural frequencies and modal shapes)were identified. The technique chosen for this task was the Frequency DomainDecomposition (FDD), which is implemented on the ARTeMIS software.
The first five natural modes and their respective frequencies could be identified.The first (1.60 Hz) and second (1.70 Hz) modes are local of the bell tower on thetransversal and longitudinal directions, respectively. The third (2.22 Hz) and fifth(4.54 Hz) modes are mainly in the transversal direction, while the fourth mode(3.42 Hz) corresponds to a longitudinal mode. The modal shapes of the five modesfound are shown in Fig. 2.
Fig. 2. Natural modes found experimentally
1348 E. Ramírez et al.

4 Numerical Model and Calibration
4.1 Model Definition
Most of the building was considered in the model, except for the chapel of the HolySacrament that was not modelled. For simplification purposes, it was assumed that theinteraction between the foundation and the structure was ideal, hence translations at thebase of the structure were restricted in all the directions. The adjacent structures weremodeled as uniaxial springs representing the stiffness of the walls. The roofing systemwas simplified and only the trusses of the central and lateral naves were modelled.
Given that the walls have considerable thickness in most of the cases (more than1.00 m), these elements were modelled as volume elements. For this purpose,isoparametric tetrahedron solids (TE12L) from the DIANA library [6] were used. Onthe other hand, the dome and roof over the apse were represented as shell elements dueto their smaller thicknesses (0.20 m and 0.50 m, respectively), in this case three-nodetriangular curved shell (T15SH) elements were used. The trusses located on the centraland lateral nave were represented as beams using L13BE elements.
4.2 Calibration of the Model
In order to calibrate the model, an eigenvalue analysis was carried out to determine thenatural frequencies and modal shapes of the numerical model. Given that the resultsfrom numerical model are highly sensitive to the boundary conditions and materialproperties [7] it is necessary to optimize the model to improve the correlation betweenexperimental and numerical results by modifying selected parameters [8]. To evaluatethe magnitude of the correlation, the Modal Assurance Criterion (MAC) [9] was used,which is defined as Eq. (1):
MACu;d ¼uui
� �Tudi
� �������2
uuið ÞT uu
ið Þ udið ÞT ud
ið Þð1Þ
Here, uui and ud
i correspond to the mode shape vector for the experimental andnumerical results respectively for the vibration mode i. The MAC value can rangebetween 0 and 1, when this parameter is close to 0, it indicates that there is nocorrelation between the experimental and numerical results. However, a value close to1 (usually larger than 0.7 is assumed as acceptable), means that there is good agreementbetween the experimental and numerical modes. To optimize the model and obtain thehighest MAC values possible, the Douglas-Reid algorithm [10] was used.
In order to optimize the numerical model, 7 parameters were defined. Theseparameters were chosen after performing a manual calibration stage, in which severalfactors were evaluated separately. In this stage those variables that did not improved thenumerical model were rejected. Finally, within the calibrated properties the Young’smodulus and density of the bell tower were considered. Also the Young’s modulus ofthe masonry of the nave was taken into consideration. Finally, interfaces between thetower and nave and longitudinal walls and façade were also calibrated. For each
Seismic Assessment of the Matera Cathedral 1349
property lower, upper and an initial value were defined based on values found inliterature (for the Young’s modulus and mass of masonry) or on values determined onthe sensitivity analysis prior the calibration (interfaces).
4.3 Updated Model
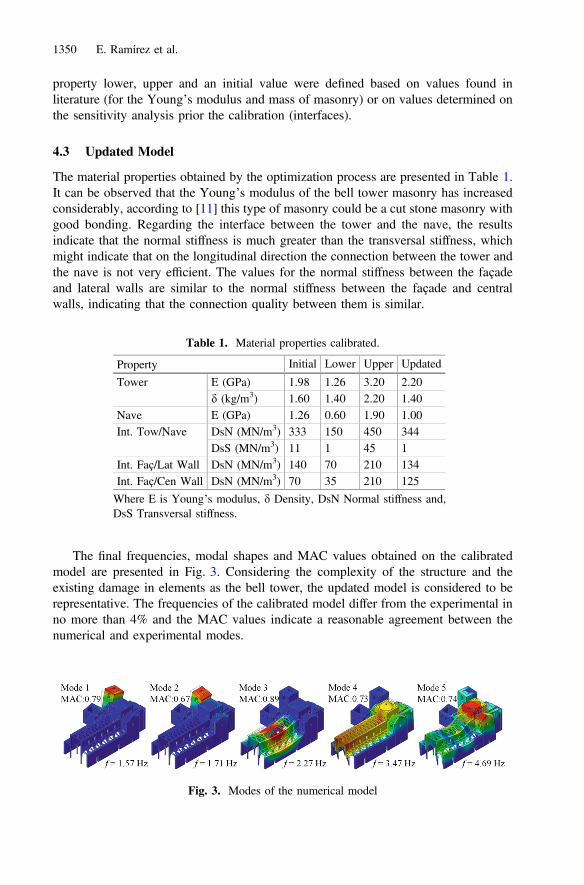
The material properties obtained by the optimization process are presented in Table 1.It can be observed that the Young’s modulus of the bell tower masonry has increasedconsiderably, according to [11] this type of masonry could be a cut stone masonry withgood bonding. Regarding the interface between the tower and the nave, the resultsindicate that the normal stiffness is much greater than the transversal stiffness, whichmight indicate that on the longitudinal direction the connection between the tower andthe nave is not very efficient. The values for the normal stiffness between the façadeand lateral walls are similar to the normal stiffness between the façade and centralwalls, indicating that the connection quality between them is similar.
The final frequencies, modal shapes and MAC values obtained on the calibratedmodel are presented in Fig. 3. Considering the complexity of the structure and theexisting damage in elements as the bell tower, the updated model is considered to berepresentative. The frequencies of the calibrated model differ from the experimental inno more than 4% and the MAC values indicate a reasonable agreement between thenumerical and experimental modes.
Table 1. Material properties calibrated.
Property Initial Lower Upper Updated
Tower E (GPa) 1.98 1.26 3.20 2.20d (kg/m3) 1.60 1.40 2.20 1.40
Nave E (GPa) 1.26 0.60 1.90 1.00Int. Tow/Nave DsN (MN/m3) 333 150 450 344
DsS (MN/m3) 11 1 45 1Int. Faç/Lat Wall DsN (MN/m3) 140 70 210 134Int. Faç/Cen Wall DsN (MN/m3) 70 35 210 125
Where E is Young’s modulus, d Density, DsN Normal stiffness and,DsS Transversal stiffness.
Fig. 3. Modes of the numerical model
1350 E. Ramírez et al.

5 Seismic Assessment
5.1 Definition of Nonlinear Properties
The compressive behavior of the masonry, was represented by a parabolic model, whilefor the tensile behavior an exponential softening model was used. The constitutive lawsmentioned are defined in the material library of the DIANA software [6]. The nonlinearproperties were determined based on expressions found in the literature review and theelastic parameters estimated on the calibration of the model.
The compressive strength of the masonry (fc) was estimated as a fraction of theYoung’s modulus E ¼ afc, considering a value of a within a range of 200 to 1000, andas proposed by [12], a value of 600 was chosen for a. The tensile strength (ft) wasassumed to be a percentage of the compressive strength, and the range between 3 to10% proposed by [13] was considered, for the present case the tensile strength wastaken as the 5% of the compressive strength. The compressive fracture energy (Gc) wascalculated multiplying the compressive strength by a ductility index, which was con-sidered equal to 1.6 mm [14]. The tensile fracture energy was considered equal to50 N/m, similarly to [15]. The nonlinear properties of masonry are summarized inTable 2.
5.2 Variables Considered
The assessment of the cathedral to seismic actions was performed using the pushoveranalysis proportional to the mass in the transversal (+X) and longitudinal (−Y)directions. Given the geometrical configuration of the structure, the positive transversal(+X) and negative longitudinal (−Y), were chosen as the most vulnerable directions. Tocontrol the displacements of the structure, four points of the structure were considered,for the transversal direction one on the tower and one on the wall of the central naveand, for the longitudinal one on the tower and one on the façade.
The analysis chosen was applied to two models of the cathedral. The first one(Model A) is the initial model obtained after the calibration and presented in theprevious section. The second model (Model B) evaluates the influence of the trusses ofthe central and lateral naves. In this case, it was assumed that the trusses would becompletely disconnect from the structure when the same presents a nonlinear behavior,hence they will not contribute to the global behavior and these elements were notmodeled. In Model A, the connection between trusses (beam type elements) and walls(solid type elements) was achieved placing a longitudinal beam on the border of the
Table 2. Nonlinear properties of masonry
Material E (GPa) fc (MPa) Gc (N/m) ft (MPa) Gf (N/m)
Nave masonry 1.00 1.70 2700 0.08 50Tower masonry 2.20 3.70 5900 0.18 50Dome masonry 1.26 2.10 3400 0.11 50Pillars 4.50 7.50 12000 0.38 50
Seismic Assessment of the Matera Cathedral 1351

walls were the trusses were supported. This beam was used to avoid concentration ofstresses and make the node displacements and rotations (between beams and solids)compatible.
5.3 Results of the Analysis
Based on the results of the analyses, the capacity of the structure on the transversaldirection (+X) varies from 0.09 to 0.21 g. Regarding the longitudinal direction (−Y),the capacity varies from 0.23 to 0.25 g (Fig. 4). Compared to the analysis on thetransversal direction, the results of the longitudinal direction do not present muchvariability. Still, the post-peak response is rather different in both models, with a brittle
(a)
(b)
Fig. 4. Capacity curves and cracking pattern on each model analyzed: (a) Model A and(b) Model B
1352 E. Ramírez et al.

behavior on Model B. The analyses indicate that the transversal direction seems to bethe most vulnerable.
The trusses have an enormous influence on the response of the structure especiallyon the transversal direction. The capacity of the structure decreases about 60% on thetransversal direction and also the secant stiffness is reduced. In Model B, only thecentral nave has a nonlinear behavior and collapses. On the longitudinal direction, thecapacity is only reduced about 10%, but the post-peak response is different. Comparedto Model A, on Model B the capacity begins to drop rapidly after reaching the peak ofthe capacity curve.
On the transversal direction the absence of the trusses (Model B) modifiesimportantly the behavior of the structure. Only the walls of the central nave present anonlinear behavior, where diagonal cracks due to the out-of-plane displacement of thewall could be observed. On Model A, a failure of the connection between the longi-tudinal walls and façade was identified, while on Model B the overturning of the centralwalls was observed. Regarding the longitudinal analysis, in both models the façadepresents an out-of-plane behavior during the longitudinal analyses. However, onModel B the walls of the central nave also present a failure mechanism. The crackingpattern of all the models are presented in Fig. 4.
6 Conclusions
The results indicate that the implemented Model B (without trusses on the nave) is themost vulnerable, especially on the transversal direction. The inclusion of the timbertrusses on the central nave seems to have an important influence on the seismicbehavior of the structure. However, these results might represent an extreme case,given that in this case the contribution of these elements to the global stiffness wascompletely neglected.
For the cases analyzed, the capacity of the structure on the transversal directionranges from 0.09 to 0.21 g, and for the longitudinal direction from 0.23 to 0.25 g.Comparing this results with the historical data from past events where the maximumacceleration registered was 0.10 g, only the lower limit of the capacity on thetransversal direction has a safety factor lower than 1, for the other cases this factor ishigher than 2. However, according to the Italian code, an earthquake with an accel-eration of 0.16 g is expected in the worst of the scenarios. This acceleration surpassesthe capacity of Model B on the transversal direction, also the safety factor for Model Ais close to 1, indicating that the structure might exhibit important damage under such anevent.
Further studies about the seismic behavior of the cathedral should consider per-forming a dynamic time-history analysis. This analysis could be especially usefulconsidering that some elements as the bell tower might present an independentbehavior from the rest of the cathedral. For this purpose, also the local seismicity mustbe studied in detail, in order to use a representative input seismic signal from theregion.
Seismic Assessment of the Matera Cathedral 1353

Acknowledgements. The authors would like to acknowledge the University of Minho forsupporting the experimental campaign. Thanks is also extended to Dr. Nuno Mendes, Universityof Minho, for his guidance and help for performing the in-situ tests on the cathedral. The authorswould also like to thank to the ELARCH project number 552129-EM-1-2014-1-IT-ERASMUSMUNDUS-EMA 21 for funding the graduate studies of the first author.
References
1. Morelli M (1970) La cattedrale di Matera ha 700 anni. F.lli Montemurro, Matera2. Calò Mariano MS, Guglielmi Faldi C, Strinati C (2017) La Cattedrale di Matera nel
medioevo e nel rinascimento, Prima edizione digitale ed. Editoria Digitale, Matera3. Ragone A, Ippolito A, Liberatore D, Sorrentino L (2017) Emerging technologies for the
seismic assessment of historical churches: the case of the bell tower of the Cathedral ofMatera, Southern Italy. In: Handbook of research on emerging technologies for architecturaland archaeological heritage, Hershey, PA, USA 17033. IGI Global, pp 159–196
4. Matlab, High-level language and interactive environment for numerical computation.MathWorks, Massachusetts. http://www.mathworks.com/products/matlab
5. SVS (2013) ARTeMIS modal pro user manual. Structural Vibration Solutions, Aalborg6. DIANA - Finite Element Analysis (2017) User’s manual release 10.1. DIANA FEA, Delft7. Friswell MI, Mottershead JE, Ahmadian H (2001) Finite element model updating using
experimental test data: parametrization and regularization. Philos Trans R Soc London AMath Phys Eng Sci 359(1778):169–186
8. Mottershead JE, Friswell MI (1993) Model updating in structural dynamic: a survey.J Sound Vib 167(2):347–375
9. Allemang RJ, Brown DL (1982) A correlation coefficient for modal vector analysis. In:Proceedings of the 1st international modal analysis conference, Orlando
10. Douglas BM, Reid WH (1982) Dynamic tests and system idenfication of bridges. J StructDiv 108
11. CMIT (Circolare del Minitro delle Infrastrutture e dei Trasporti) (2009) Istruzioni perl’applicazione delle “Nuove norme tecniche per le costruzioni” di cui al DM 14 gennaio2008, Gazzetta Ufficiale della Repubblica Italiana
12. Tomazevic M (1999) Earthquake-resistant design of masonry buildings. Imperial CollegePress, London
13. Schubert P (1988) The influence of mortar on the strength of masonry. In: Brick and BlockMasonry (8th IBMAC), London
14. Angelillo M, Lourenço P, Milani G (2014) Masonry behaviour and modelling. In:Mechanics of Masonry Structures. Springer, Vienna, pp 1–26
15. Ramirez R (2016) Structural analysis of the church of the Monastery of São Miguel deRefojos. Master thesis, University of Minho
1354 E. Ramírez et al.
View publication statsView publication stats