report on pathology - mass histology services | histology … comprehensive report... ·...
TRANSCRIPT

1
Mass Histology Service A complete anatomical pathology laboratory
______________________________________________________________________________________
www.masshistology.com Telephone: (877) 286-6004
Report on Pathology
A Time Course Study of the Local Effects of Intramuscular
XXXXXXX Injection in -glucosidase Knockout6neo(-)/6neo(-) Mice
Michael L. Hawes, D.V.M., Diplomate A.C.V.P.
Consulting Pathologist
FINAL REPORT
May 17, 2013
Conclusions: GAA KO mice undergo myocyte regeneration more quickly in response to intramuscular XXXXXXXXXX injection compared to wild type mice, though by Day 14 both strains show comparable regeneration. Necrosis, inflammation and edema are processes that follow a similar time course in both strains, peaking early and largely subsiding by Day 14. Fibrosis in this model is modest but measurable, and occurs earlier in GAA KO mice (Day 5) compared to WT mice (Day 7).
Please note: Should any portion of the pathology data, including photomicrographs, from this report be included in a manuscript or an abstract for a professional meeting presentation (oral or poster), the pathologist of record should be listed as an author and consulted for editorial input.

2
REPORT ON PATHOLOGY Date: May 17, 2013 Study: A Time Course Study of the Local Effects of Intramuscular XXXXXXXX
Injection in -glucosidase Knockout6neo(-)/6neo(-) Mice Pathologist: Michael Hawes, D.V.M., Diplomate A.C.V.P. Conclusions: GAA KO mice undergo myocyte regeneration more quickly in response to intramuscular XXXXXXXX injection compared to wild type mice, though by Day 14 both strains show comparable regeneration. Necrosis, inflammation and edema are processes that follow a similar time course in both strains, peaking early and largely subsiding by Day 14. Fibrosis in this model is modest but measurable, and occurs earlier in GAA KO mice (Day 5) compared to WT mice (Day 7). Study Objective: The objective of this study was to assess the local
histopathological effects of the intramuscular injection of XXXXXXXX in -glucosidase knockout6neo(-)/6neo(-) and wild type mice at different time points out to 14 days.
Study Design: Twelve week old female -glucosidase knockout6neo(-)/6neo(-) (GAA KO) mice were injected with 25 microliters of XXXXXXXX intramuscularly (IM) in each tibialis anterior (TA) muscle on Day 0. Groups of animals were sacrificed on Day 3, 5, 7 and 14 post-injection. Age matched female wild type (WT) B6.129SF2/J mice were similarly injected and sacrificed at matching time points. Untreated controls were also included for each mouse strain. At sacrifice tibialis anterior muscles were harvested. See the study design table below for additional details.

3
Table 1: Study Design
Group Mouse Strain/ No. of Animals
Treatment Sacrifice Time Point
1 GAA KO / 4 None Day 0
2 GAA KO / 8 25 l IM in each TA muscle Day 3
3 GAA KO / 8 25 l IM in each TA muscle Day 5
4 GAA KO / 6 25 l IM in each TA muscle Day 7
5 GAA KO / 6 25 l IM in each TA muscle Day 14
6 B6.129SF2/J / 4 None Day 0
7 B6.129SF2/J / 8 25 l IM in each TA muscle Day 3
8 B6.129SF2/J / 8 25 l IM in each TA muscle Day 5
9 B6.129SF2/J / 6 25 l IM in each TA muscle Day 7
10 B6.129SF2/J / 6 25 l IM in each TA muscle Day 14
Tissues examined: TA muscles were harvested, fixed in 10% neutral buffered formalin, embedded transversely in paraffin, and sectioned at approximately 5 microns. Two serial sections were stained for each sample: one with hematoxylin and eosin (H&E), and one with trichrome. Tissues were analyzed using scoring systems for a number of individual parameters including central nuclei, fiber size reduction, regeneration, necrosis, inflammation, edema, and fibrosis. A sum score was also generated by adding individual parameter scores together for each sample. Individual parameter scoring system details are located at the end of this report in the appendix along with individual animal findings. Slides were read by a board-certified veterinary pathologist blinded to study group designation. Statistical analysis was performed using GraphPad Prizm version 4.03 software, and included a nonparametric Kruskal-Wallis test followed by a Dunn’s test comparing all treatment groups using a confidence level of 95%. Results: Figures 1-8 below are graphical depictions of the data generated for this study. In these figures GAA KO mice are denoted at Pompe and wild type mice are denoted as WT. Individual data points are shown and horizontal bars depict group median scores.

4
Sum Score
WT U
nTx
WT D
3
WT D
5
WT D
7
WT D
14
Pompe
UnTx
Pompe
D3
Pompe
D5
Pompe
D7
Pompe
D14
0
5
10
15
20
25
30
35
Su
m S
co
re (
0-3
5)
p<0.05
Sum Score
WT U
nTx
WT D
3
WT D
5
WT D
7
WT D
14
Pompe
UnTx
Pompe
D3
Pompe
D5
Pompe
D7
Pompe
D14
0
5
10
15
20
25
30
35
Su
m S
co
re (
0-3
5)
p<0.05
Central Nuclei
WT U
nTx
WT D
3
WT D
5
WT D
7
WT D
14
Pompe
UnTx
Pompe
D3
Pompe
D5
Pompe
D7
Pompe
D14
0
1
2
3
4
5
Cen
tral
Nu
cle
Sco
re (
0-5
)
p<0.05p<0.05
Central Nuclei
WT U
nTx
WT D
3
WT D
5
WT D
7
WT D
14
Pompe
UnTx
Pompe
D3
Pompe
D5
Pompe
D7
Pompe
D14
0
1
2
3
4
5
Cen
tral
Nu
cle
Sco
re (
0-5
)
p<0.05p<0.05
Figure 1: The sum score for pathological changes occurring in the tibialis anterior muscle after IM XXXXXXXX injection. While GAA KO mice (denoted as Pompe) trend higher at every timepoint compared to WT mice, there are no statistically significant differences. Only the Day 3 GAA mice differ significantly from the untreated rhGAA mice (p<0.05, Kruskal-Wallis test). Figure 2: The central nuclei score trends higher at every timepoint in GAA KO mice compared to WT mice. Statistical significance is only present between the groups shown (Kruskal-Wallis test).

5
Fiber Size Reduction
WT U
nTx
WT D
3
WT D
5
WT D
7
WT D
14
Pompe
UnTx
Pompe
D3
Pompe
D5
Pompe
D7
Pompe
D14
0
1
2
3
4
5
Fib
er
Siz
e R
ed
ucti
on
Sco
re (
0-5
)p<0.0001
p<0.0001
Fiber Size Reduction
WT U
nTx
WT D
3
WT D
5
WT D
7
WT D
14
Pompe
UnTx
Pompe
D3
Pompe
D5
Pompe
D7
Pompe
D14
0
1
2
3
4
5
Fib
er
Siz
e R
ed
ucti
on
Sco
re (
0-5
)p<0.0001
p<0.0001
Regeneration
WT U
nTx
WT D
3
WT D
5
WT D
7
WT D
14
Pompe
UnTx
Pompe
D3
Pompe
D5
Pompe
D7
Pompe
D14
0
1
2
3
4
5
Reg
en
era
tio
n S
co
re (
0-5
)
p<0.05
p<0.05
Regeneration
WT U
nTx
WT D
3
WT D
5
WT D
7
WT D
14
Pompe
UnTx
Pompe
D3
Pompe
D5
Pompe
D7
Pompe
D14
0
1
2
3
4
5
Reg
en
era
tio
n S
co
re (
0-5
)
p<0.05
p<0.05
Figure 3: There is a statistically greater proportion of smaller muscle fibers in GAA KO mice compared to WT mice at the Day 3 time point (p<0.0001, Kruskal-Wallis test). There is also a greater proportion of smaller muscle fibers at Day 3 in GAA KO mice compared to untreated GAA KO mice (p<0.0001, Kruskal-Wallis test).
Figure 4: Regeneration scores are statistically higher at Day 14 compared to Day 3 in WT mice (p<0.05, Kruskal-Wallis test). In addition, GAA KO mouse regeneration scores at Day 3 are statistically higher than WT mouse scores at Day 3 (p<0.05, Kruskal-Wallis test).

6
Inflammation
WT U
nTx
WT D
3
WT D
5
WT D
7
WT D
14
Pompe
UnTx
Pompe
D3
Pompe
D5
Pompe
D7
Pompe
D14
0
1
2
3
4
5
Infl
am
mati
on
Sco
re (
0-5
)
p<0.01p<0.01
Inflammation
WT U
nTx
WT D
3
WT D
5
WT D
7
WT D
14
Pompe
UnTx
Pompe
D3
Pompe
D5
Pompe
D7
Pompe
D14
0
1
2
3
4
5
Infl
am
mati
on
Sco
re (
0-5
)
p<0.01p<0.01
Edema
WT U
nTx
WT D
3
WT D
5
WT D
7
WT D
14
Pompe
UnTx
Pompe
D3
Pompe
D5
Pompe
D7
Pompe
D14
0
1
2
3
4
5
Ed
em
a S
co
re (
0-5
)
p<0.01p<0.05p<0.05 p<0.01
p<0.05 p<0.01
Edema
WT U
nTx
WT D
3
WT D
5
WT D
7
WT D
14
Pompe
UnTx
Pompe
D3
Pompe
D5
Pompe
D7
Pompe
D14
0
1
2
3
4
5
Ed
em
a S
co
re (
0-5
)
p<0.01p<0.05p<0.05 p<0.01
p<0.05 p<0.01
Figure 5: Inflammation is not statistically different at any of the time points analyzed between GAA KO and WT mice. The only statistical differences are between the Day 3 WT and GAA mice and their respective untreated controls (p<0.01, Kruskal-Wallis test).
Figure 6: Edema is elevated early after XXXXXXXXX injury, but subsides to baseline by Day 14. Edema is not statistically different at any of the time points analyzed between GAA KO and WT mice. Statistical significance is only present between the groups shown (Kruskal-Wallis test).
7
Fibrosis
WT U
nTx
WT D
3
WT D
5
WT D
7
WT D
14
Pompe
UnTx
Pompe
D3
Pompe
D5
Pompe
D7
Pompe
D14
0
1
2
3
4
5
Fib
rosis
Sco
re (
0-5
)
p<0.05
p<0.05
p<0.01
Fibrosis
WT U
nTx
WT D
3
WT D
5
WT D
7
WT D
14
Pompe
UnTx
Pompe
D3
Pompe
D5
Pompe
D7
Pompe
D14
0
1
2
3
4
5
Fib
rosis
Sco
re (
0-5
)
p<0.05
p<0.05
p<0.01
Necrosis
WT U
nTx
WT D
3
WT D
5
WT D
7
WT D
14
Pompe
UnTx
Pompe
D3
Pompe
D5
Pompe
D7
Pompe
D14
0
1
2
3
4
5
Necro
sis
Sco
re (
0-5
)
p<0.01 p<0.01
Necrosis
WT U
nTx
WT D
3
WT D
5
WT D
7
WT D
14
Pompe
UnTx
Pompe
D3
Pompe
D5
Pompe
D7
Pompe
D14
0
1
2
3
4
5
Necro
sis
Sco
re (
0-5
)
p<0.01 p<0.01
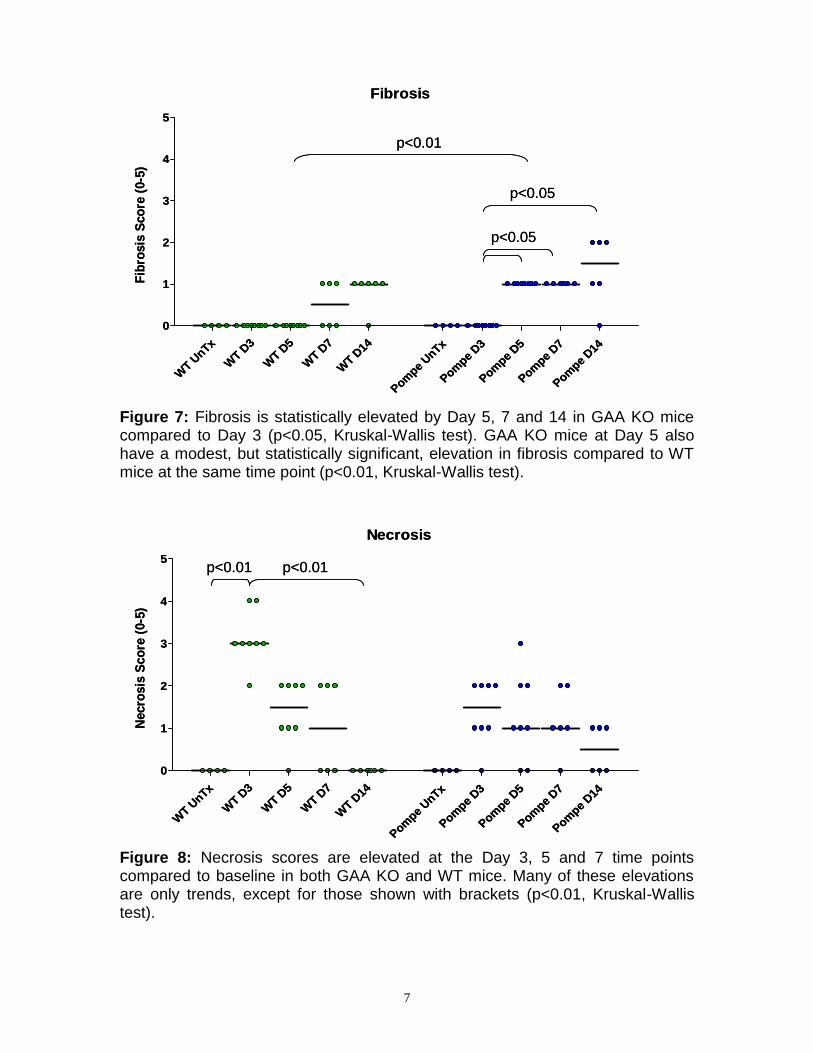
Figure 7: Fibrosis is statistically elevated by Day 5, 7 and 14 in GAA KO mice compared to Day 3 (p<0.05, Kruskal-Wallis test). GAA KO mice at Day 5 also have a modest, but statistically significant, elevation in fibrosis compared to WT mice at the same time point (p<0.01, Kruskal-Wallis test).
Figure 8: Necrosis scores are elevated at the Day 3, 5 and 7 time points compared to baseline in both GAA KO and WT mice. Many of these elevations are only trends, except for those shown with brackets (p<0.01, Kruskal-Wallis test).

8
Histopathological Description and Representative Photomicrographs:
DAY 0: WT Untreated Mice: These samples are within expected limits with no abnormalities (see Figure 9). GAA KO Untreated Mice: These samples are within expected limits for the knockout phenotype. Punctate, clear vacuoles (lysosomal glycogen) are scattered within the sarcoplasm of most myocytes. Two of the four samples have minimal (score 1) regeneration and one sample has minimal (score 1) chronic inflammation. These are expected background alterations in this knockout strain. GAA KO TA muscle has subjectively more myocyte nuclei compared to WT. Most of these myocyte nuclei are also slightly enlarged with prominent magenta nucleoli, and an open chromatin pattern compared to WT myocyte nuclei (see Figure 9).
DAY 3: Cardiotoxin-treated WT Mice: All wild type mice treated with XXXXXX have large contiguous areas of myocyte necrosis. In addition to the typical morphologic features of necrosis, including sarcoplasmic hypereosinophilia, loss of sarcoplasmic cross-striational detail, and nuclear karyorrhexis and karyolysis, trichrome–stained necrotic myocytes stain bluish-purple instead of the usual bright red expected with viable myocytes (see Figure 10). These are bordered by a rim of primarily macrophages and a few neutrophils that separate the necrotic muscle from viable, uninjured muscle (see Figure 11). While some of the cells within the inflammatory zone could be early regenerative myocytes (myoblasts), this cannot be distinguished by H&E or trichrome staining. Additional immunohistochemical (IHC) markers such as F/480 (macrophage marker), fMHC (skeletal myocyte sarcoplasmic marker), and myogenin (skeletal myocyte nuclear marker) could be employed to make more detailed characterizations. Edema (clear space) separates cells within the necrotic and inflammatory zones.
XXXXXX-treated GAA KO Mice: All but one of the cardiotoxin-treated GAA KO mice has areas of contiguous myocyte necrosis (see Figure 10). As in WT mice these areas of necrosis are bordered by a rim of macrophages and neutrophils. Notably, there are numerous skeletal myocytes within this inflammatory rim that have characteristics of regenerative myocytes. These myocytes are smaller than adjacent uninjured myocytes, have central often multiple nuclei, and an increased sarcoplasmic basophilia (see Figure 11). Edema (clear space) separates cells within the necrotic and inflammatory zones.

9
DAY 5: XXXXXX-treated WT Mice: By Day 5 necrotic zones are still present in most muscles, but these areas are typically smaller than that observed at Day 3 (not significant; p>0.05). The degree of inflammation is also reduced compared to Day 3, but again not significantly (p>0.05). Notably, there is now a zone of regenerating myocytes that separates the necrotic and viable muscle tissue, similar to that seen in GAA KO mice at Day 3 (see Figure 12). Edema (clear space) separates cells within the necrotic and inflammatory zones.
XXXXXX-treated GAA KO Mice: Day 5 samples are generally similar to Day 3 samples (see Figure 12). Minimal fibrosis (score 1) is now evident separating regenerating myocytes in many samples.
DAY 7: XXXXXX-treated WT Mice: Three Day 7 samples show no histopathologic changes. Given the consistency and magnitude of many of the changes at the Day 5 time point, it is likely that these samples were mis-injected. These samples were included in the analysis. Exclusion of these samples from the analysis would not yield substantially different results. The other three samples at this time point are very similar to those at the Day 5 time point, except that minimal fibrosis (score 1) is now evident separating regenerating myocytes.
XXXXXX-treated GAA KO Mice: Day 7 samples are generally similar to Day 5 samples.
DAY 14: XXXXXX-treated WT Mice: By Day 14 necrotic zones are not present in any samples. Instead, much of each sample is composed of near normal to slightly smaller skeletal myocytes, most with central nuclei. Inflammation has largely subsided, with only scattered macrophages and lymphocytes often located in fine strands of fibrous connective tissue between myocytes (see Figure 13). Edema is now absent in all samples.
XXXXXX-treated rhGAA Mice: By Day 14 GAA KO mouse samples are quite similar to WT samples (see Figure 13), except that 3/6 still retain small areas of necrosis (score 1).

10
Figure 9: Photomicrographs of H&E-stained untreated TA muscles from WT (A) and GAA KO (B) mice. Note the eccentrically-located myocyte nuclei in each strain (black arrows). Subjectively GAA KO TA muscle contains more myocyte nuclei that are slightly enlarged compared to WT (600x magnification).
A
B

11
Figure 10: Photomicrographs of Day 3 XXXXXX-injected TA muscles from WT (A,C; animal 7-3) and GAA KO (B,D; animal 2-1) mice. The top panels (40x magnification) are trichrome-stained sections showing the large areas of necrosis induced by XXXXXX injection (bluish-purple tissue) part of which is highlighted with the black inset boxes. These areas of necrosis are separated from the bright red-stained viable myocytes by a zone of inflammation and regeneration, part of which is highlighted by the blue inset boxes. The bottom panels (600x magnification) are from areas similar to the black inset boxes in serial H&E-stained sections that demonstrate typical features of necrosis: karyolysis and loss of sarcoplasmal cross-striational detail (black arrows).
A B
C D

12
Figure 11: Photomicrographs of H&E-stained Day 3 XXXXXX-injected TA muscles from WT (A,C; animal 7-5) and GAA KO (B,D; animal 2-4) mice. While both samples have a zone of inflammation (to left of black brackets in A and B), only the GAA KO sample suggests morphologic evidence of myocyte regeneration: myocytes with central and often multiple nuclei along with increased sarcoplasmic basophilia (black arrows in D). A and B: 200x magnification. C and D: 600x magnification photomicrographs from the areas outlined by the black inset boxes in A and B, respectively.
A B
C D

13
Figure 12: Photomicrographs of H&E-stained Day 5 XXXXXX-injected TA muscles from WT (A, animal 8-2) and GAA KO (B, animal 3-5) mice. These images demonstrate the myocyte regeneration now present in both strains (black arrows; 200x magnification).
A
B
14
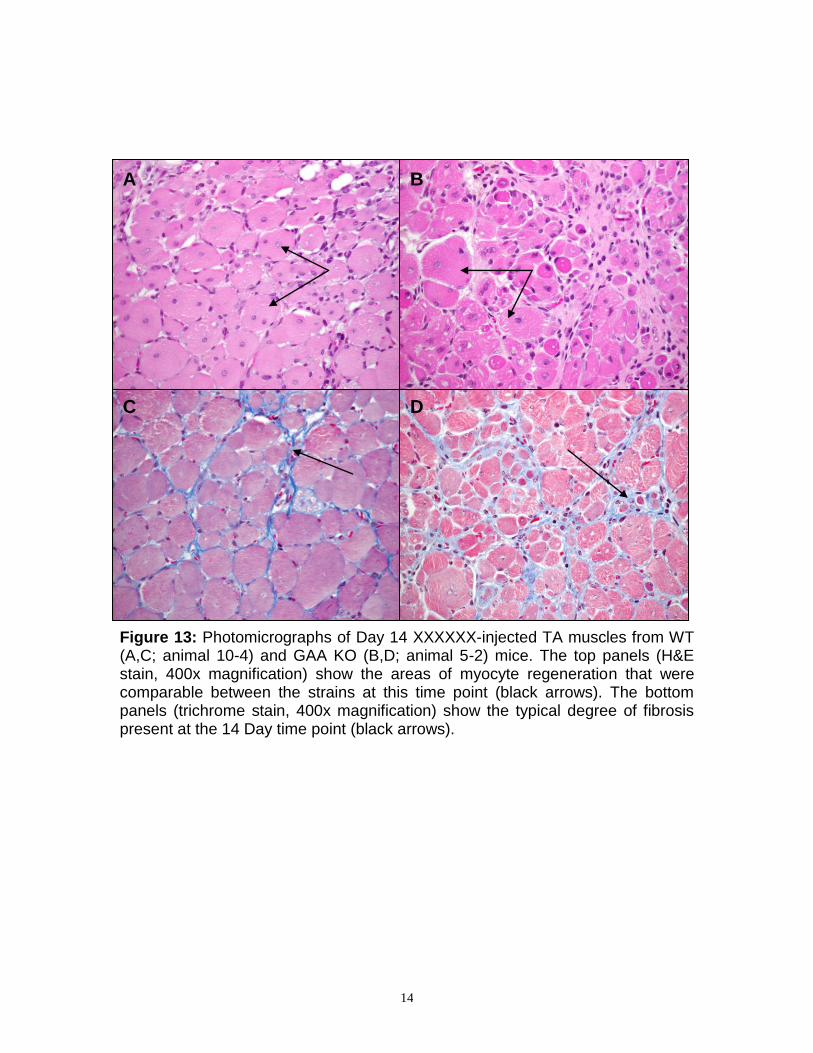
Figure 13: Photomicrographs of Day 14 XXXXXX-injected TA muscles from WT (A,C; animal 10-4) and GAA KO (B,D; animal 5-2) mice. The top panels (H&E stain, 400x magnification) show the areas of myocyte regeneration that were comparable between the strains at this time point (black arrows). The bottom panels (trichrome stain, 400x magnification) show the typical degree of fibrosis present at the 14 Day time point (black arrows).
A B
D C

15
Summary:
Intramuscular injection of XXXXXX into the TA muscle of GAA KO and WT mice results in large contiguous areas of myocyte necrosis by 3 days post-injection. This necrosis largely subsides by day 14 post-injection.
In response to this necrotizing stimulus skeletal myocytes in both strains of mice undergo a regenerative process. GAA KO mice appear to respond more quickly to this stimulus as evidenced by statistically elevated regeneration scores (p<0.05), central nuclei scores (p<0.05), and fiber size reduction scores (p<0.0001) at the Day 3 time point compared to WT mice.
Inflammation and edema are part of the response to XXXXXX injection in both strains. These processes peak at Day 3 and largely subside by Day 14 in both strains.
Fibrosis also occurs after XXXXXX injury in both GAA KO and WT mice. Fibrosis begins earlier after injury in GAA KO mice (Day 5) compared to WT mice (Day 7). Fibrosis progresses in both strains over time and is greatest at Day 14.
Conclusions:
GAA KO mice undergo myocyte regeneration more quickly in response to intramuscular XXXXXX injection compared to wild type mice, though by Day 14 both strains show comparable regeneration. Necrosis, inflammation and edema are processes that follow a similar time course in both strains, peaking early and largely subsiding by Day 14. Fibrosis in this model is modest but measurable, and occurs earlier in GAA KO mice (Day 5) compared to WT mice (Day 7).
Recommendations:
Myocyte regeneration should be confirmed via myogenin immunohistochemistry. Studies to probe the differences in the regenerative and fibrotic responses between the strains could prove insightful. In vitro assays using GAA KO and WT skeletal myocyte cultures to measure proliferation rates and other responses to positive and negative stimuli would be one avenue of investigation. It would be
interesting to see if TGF- is up- or down-regulated in GAA KO mice compared to WT mice at any of the time points examined in this study.

16
Appendix: Central Nuclei Scoring System:
Score Description
0 Central nuclei in myocytes are not present in any part of the tissue
1 Central nuclei in myocytes are present in 1-20% of the tissue
2 Central nuclei in myocytes are present in 21-40% of the tissue
3 Central nuclei in myocytes are present in 41-60% of the tissue
4 Central nuclei in myocytes are present in 61-80% of the tissue
5 Central nuclei in myocytes are present in 81-100% of the tissue
Fiber Size Reduction Scoring System:
Score Description
0 Myocytes are not reduced in size in any part of the tissue
1 Myocytes are reduced in size in 1-20% of the tissue
2 Myocytes are reduced in size in 21-40% of the tissue
3 Myocytes are reduced in size in 41-60% of the tissue
4 Myocytes are reduced in size in 61-80% of the tissue
5 Myocytes are reduced in size in 81-100% of the tissue

17
Myocyte Regeneration Scoring System:
Score Description
0 Evidence of myocytes regeneration* is not present in any part of the tissue
1 Evidence of myocytes regeneration is present in 1-20% of the tissue
2 Central nuclei in myocytes are present in 21-40% of the tissue
3 Central nuclei in myocytes are present in 41-60% of the tissue
4 Central nuclei in myocytes are present in 61-80% of the tissue
5 Central nuclei in myocytes are present in 81-100% of the tissue
* Evidence of myocyte regeneration: myocytes with centralized and/or multiple nuclei, and increased sarcoplasmic basophilia.
Necrosis Scoring System:
Score Description
0 Necrosis is not present in any part of the tissue
1 Necrosis is present in 1-20% of the tissue
2 Necrosis is present in 21-40% of the tissue
3 Necrosis is present in 41-60% of the tissue
4 Necrosis is present in 61-80% of the tissue
5 Necrosis is present in 81-100% of the tissue

18
Inflammation Scoring System:
Score Description
0 Inflammation is not present in any part of the tissue
1 Inflammation is present in 1-20% of the tissue
2 Inflammation is present in 21-40% of the tissue
3 Inflammation is present in 41-60% of the tissue
4 Inflammation is present in 61-80% of the tissue
5 Inflammation is present in 81-100% of the tissue
Edema Scoring System:
Score Description
0 Edema is not present in any part of the tissue
1 Edema is present in 1-20% of the tissue
2 Edema is present in 21-40% of the tissue
3 Edema is present in 41-60% of the tissue
4 Edema is present in 61-80% of the tissue
5 Edema is present in 81-100% of the tissue
Fibrosis Scoring System:
Score Description
0 Fibrosis is not present in any part of the tissue
1 Fibrosis is present in 1-20% of the tissue
2 Fibrosis is present in 21-40% of the tissue
3 Fibrosis is present in 41-60% of the tissue
4 Fibrosis is present in 61-80% of the tissue
5 Fibrosis is present in 81-100% of the tissue

19
Raw Data:
Central Nuclei
Fiber Size Regen* Infl† Edema Fibrosis Necrosis Sum
Group 1
TA 1-1 0 0 0 0 0 0 0 0
TA 1-2 1 0 1 0 0 0 0 2
TA 1-3 1 0 1 0 0 0 0 2
TA 1-4 0 0 0 1 0 0 0 1
Group 2
TA 2-1 2 3 2 3 2 0 2 14
TA 2-2 3 4 3 3 2 0 2 17
TA 2-3 2 2 2 2 1 0 1 10
TA 2-4 3 3 3 3 2 0 2 16
TA 2-5 3 3 3 3 2 0 2 16
TA 2-6 3 3 3 3 2 0 1 15
TA 2-7 2 2 2 2 1 0 0 9
TA 2-8 3 3 3 3 2 0 1 15
Group 3
TA 3-1 2 1 2 1 1 1 0 8
TA 3-2 3 3 3 3 1 1 3 17
TA 3-3 2 1 2 1 1 1 1 9
TA 3-4 2 1 2 1 1 1 0 8
TA 3-5 3 2 3 2 2 1 1 14
TA 3-6 3 2 3 3 2 1 2 16
TA 3-7 3 2 3 2 1 1 1 13
TA 3-8 3 2 3 3 2 1 2 16
Group 4
TA 4-1 3 2 3 2 1 1 1 13
TA 4-2 3 2 3 3 1 1 2 15
TA 4-3 5 1 5 1 1 1 1 15
TA 4-4 3 2 3 2 1 1 1 13
TA 4-5 3 3 3 3 1 1 2 16
TA 4-6 1 1 1 1 1 1 0 6
Group 5
TA 5-1 2 2 2 2 0 2 1 11
TA 5-2 5 2 5 1 0 2 0 15
TA 5-3 2 1 2 1 0 1 0 7
TA 5-4 4 1 4 2 0 2 1 14
TA 5-5 5 1 5 1 0 1 1 14
TA 5-6 3 1 3 0 0 0 0 7
*Regen = Regeneration †Infl = Inflammation

20
Central Nuclei
Fiber Size Regen* Infl† Edema Fibrosis Necrosis Sum
Group 6
TA 6-1 0 0 0 0 0 0 0 0
TA 6-2 0 0 0 0 0 0 0 0
TA 6-3 0 0 0 0 0 0 0 0
TA 6-4 0 0 0 0 0 0 0 0
Group 7
TA 7-1 0 0 0 2 1 0 2 5
TA 7-2 0 0 0 2 2 0 3 7
TA 7-3 0 0 0 3 2 0 3 8
TA 7-4 0 0 0 2 2 0 4 8
TA 7-5 1 1 1 3 1 0 3 10
TA 7-6 1 1 1 3 2 0 3 11
TA 7-7 0 0 0 2 2 0 3 7
TA 7-8 0 0 0 2 2 0 4 8
Group 8
TA 8-1 1 1 1 1 0 0 0 4
TA 8-2 2 1 2 1 2 0 2 10
TA 8-3 2 2 2 1 2 0 2 11
TA 8-4 2 2 2 1 2 0 2 11
TA 8-5 2 2 2 1 2 0 1 10
TA 8-6 2 2 2 1 2 0 2 11
TA 8-7 2 2 2 1 2 0 1 10
TA 8-8 3 2 3 1 2 0 1 12
Group 9
TA 9-1 2 2 2 1 2 1 2 12
TA 9-2 0 0 0 0 0 0 0 0
TA 9-3 3 2 3 2 1 1 2 14
TA 9-4 0 0 0 0 0 0 0 0
TA 9-5 0 0 0 0 0 0 0 0
TA 9-6 2 2 2 1 1 1 2 11
Group 10
TA 10-1 4 1 4 1 0 1 0 11
TA 10-2 3 2 3 2 0 1 0 11
TA 10-3 0 0 0 0 0 0 0 0
TA 10-4 3 1 3 1 0 1 0 9
TA 10-5 3 1 3 1 0 1 0 9
TA 10-6 3 1 3 1 0 1 0 9
*Regen = Regeneration †Infl = Inflammation