report of findings nursing facility staffing survey · report of findings nursing facility staffing...
TRANSCRIPT

REPORT OF FINDINGS
NURSING FACILITY STAFFING SURVEY
2010
October, 2011
ABSTRACT
Approximately 2 million workers were employed at
nursing facilities across the United States in 2010. 1.3
million nursing staff represented 66 percent of the total
nursing facility workforce. Retention rate for nursing
facility employees was 55 percent. Retention rates
among Staff Registered Nurses, Licensed Practical
Nurses and Certified Nurse Assistants ranged from 49
to 56 percent. Turnover rate for all nursing facility
employees was 35 percent. The turnover rate for
Certified Nurse Assistants was higher than other
nursing staff, at 43 percent.
American Health Care Association
1201 L Street, N.W., Washington, DC 20005
Contact William W. Hartung at (202) 898-2841
© Copyright, American Health Care Association, 2011

Table of Contents
Executive Summary ........................................................................................................................ 1
1.0 Introduction ......................................................................................................................... 4
2.0 Retention, Vacancy and Turnover of Nursing Staff ......................................................... 10
3.0 Retention, Vacancy and Turnover of Other Nursing Facility Employees ........................ 13
3.1 Retention, Vacancy and Turnover of Administrative and Management Staff .................. 13
3.2 Retention, Vacancy and Turnover of Therapy Staff ......................................................... 14
3.3 Retention, Vacancy and Turnover of Food Services Staff ............................................... 15
3.4 Retention, Vacancy and Turnover of Housekeeping and Maintenance Staff ................... 16
3.5 Retention, Vacancy and Turnover of Social Services and Activities Staff ...................... 17
4.0 Survey Methodology ......................................................................................................... 19
Appendix A: Tables of Retention, Vacancy and Turnover Rates by Job Category and Position .....
Appendix B: Tables of Retention, Vacancy and Turnover Rates by State .......................................

REPORT OF FINDINGS: 2010 AHCA NURSING FACILITY STAFFING SURVEY
American Health Care Association 2011 ©
1
EXECUTIVE SUMMARY
The American Health Care Association (AHCA) conducted the sixth nursing facility staffing survey that collected 2010 data to estimate the retention, vacancy and turnover of employees working in nursing facilities nationwide. More than 3,700 nursing facilities (NFs) participated in this survey. This study found that more than 1.9 million workers were employed at nursing facilities across the United States in 2010. A total of 1.3 million persons, including Director of Nursing (DON), Registered Nurse with Administrative Duties (ARNs), Staff Registered Nurse (RN), Licensed Practical Nurse (LPN), Certified Nurse Assistant (CNA), and other nursing staff, provided nursing and skilled nursing care to 1.4 million nursing facility residents. Figure 1 Percentage Breakdown of Nursing Facility Employees by Job Category, 2010
The majority of the nursing staff – approximately 742,000 or 58.3 percent of total nursing staff – was Certified Nurse Assistant (CNA).
Retention Rates In 2010, the retention rate for all nursing facility employees was 55.1 percent. As shown in Figure 2, retention rates ranged from 51.4 to 71.9 percent across all the major nursing facility job categories. The overall retention rate of nursing care staff (51.4 percent) was the lowest among all nursing facility employees. Figure 2 Total Nursing Facility Employee Retention Rates by Job Category, 2010
REPORT OF FINDINGS: 2010 AHCA NURSING FACILITY STAFFING SURVEY
American Health Care Association 2011 ©
2
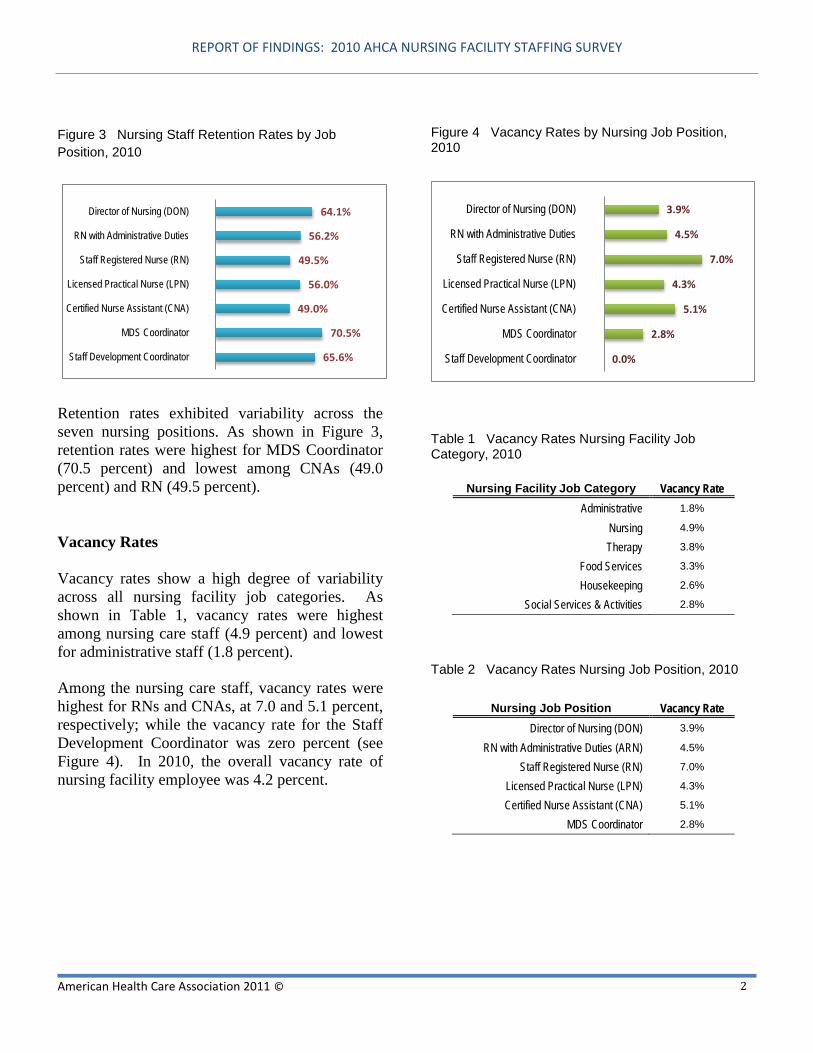
Figure 3 Nursing Staff Retention Rates by Job Position, 2010
64.1%
56.2%
49.5%
56.0%
49.0%
70.5%
65.6%
Director of Nursing (DON)
RN with Administrative Duties
Staff Registered Nurse (RN)
Licensed Practical Nurse (LPN)
Certified Nurse Assistant (CNA)
MDS Coordinator
Staff Development Coordinator
Retention rates exhibited variability across the seven nursing positions. As shown in Figure 3, retention rates were highest for MDS Coordinator (70.5 percent) and lowest among CNAs (49.0 percent) and RN (49.5 percent). Vacancy Rates Vacancy rates show a high degree of variability across all nursing facility job categories. As shown in Table 1, vacancy rates were highest among nursing care staff (4.9 percent) and lowest for administrative staff (1.8 percent). Among the nursing care staff, vacancy rates were highest for RNs and CNAs, at 7.0 and 5.1 percent, respectively; while the vacancy rate for the Staff Development Coordinator was zero percent (see Figure 4). In 2010, the overall vacancy rate of nursing facility employee was 4.2 percent.
Figure 4 Vacancy Rates by Nursing Job Position, 2010
3.9%
4.5%
7.0%
4.3%
5.1%
2.8%
0.0%
Director of Nursing (DON)
RN with Administrative Duties
Staff Registered Nurse (RN)
Licensed Practical Nurse (LPN)
Certified Nurse Assistant (CNA)
MDS Coordinator
Staff Development Coordinator
Table 1 Vacancy Rates Nursing Facility Job Category, 2010
Nursing Facility Job Category Vacancy Rate Administrative 1.8%
Nursing 4.9%
Therapy 3.8%
Food Services 3.3%
Housekeeping 2.6%
Social Services & Activities 2.8%
Table 2 Vacancy Rates Nursing Job Position, 2010
Nursing Job Position Vacancy Rate Director of Nursing (DON) 3.9%
RN with Administrative Duties (ARN) 4.5%
Staff Registered Nurse (RN) 7.0%
Licensed Practical Nurse (LPN) 4.3%
Certified Nurse Assistant (CNA) 5.1%
MDS Coordinator 2.8%

REPORT OF FINDINGS: 2010 AHCA NURSING FACILITY STAFFING SURVEY
American Health Care Association 2011 ©
3
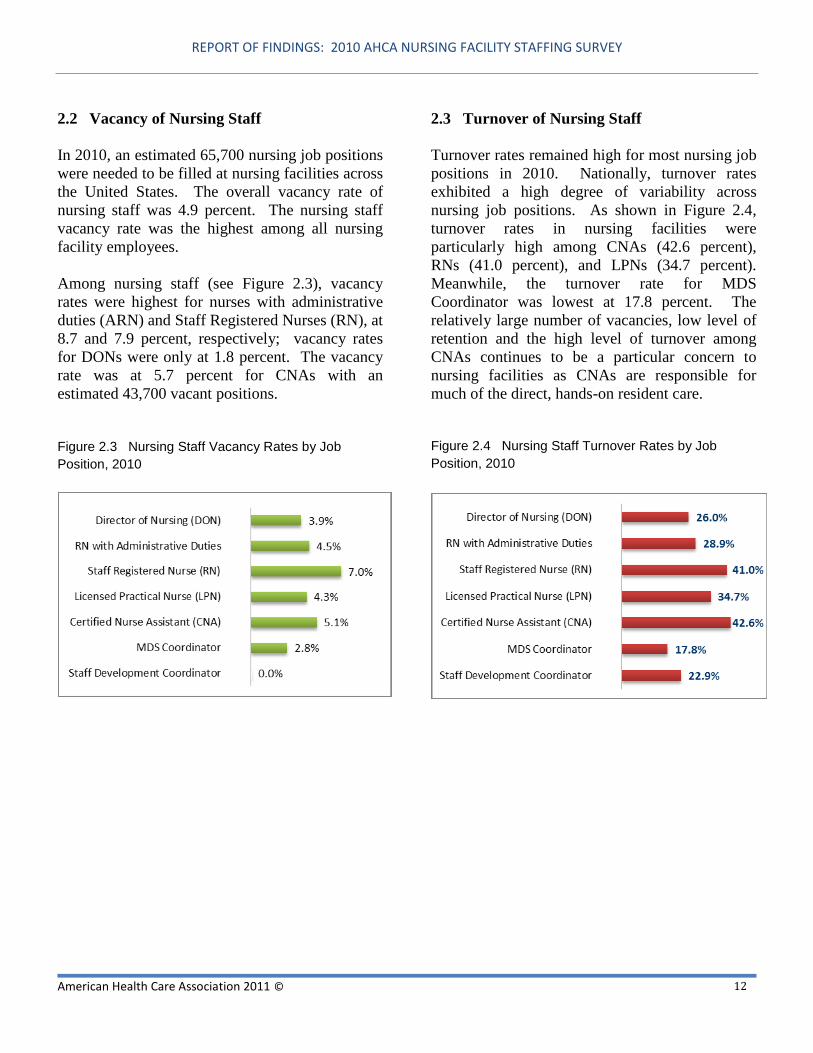
Turnover Rates The turnover rate for all nursing facility employees was 35.1 percent and exhibited a high degree of variability across job categories. As shown in Figure 5, turnover rate was highest among nursing care staff (39.5 percent) and lowest for administrative staff (18.0 percent). As shown in Figure 6, turnover rates for Staff Registered Nurses (RN), Licensed Practical Nurses (LPN), and CNAs ranged from 34.7 to 42.6 percent. Turnover rates for Director of Nursing (DON) and Registered Nurses with Administrative Duties (ARN) were 26.0 and 28.9 percent respectively. Figure 5 Turnover Rates by Nursing Facility Job Category, 2010
Figure 6 Turnover Rates by Nursing Job Position, 2010
26.0%
28.9%
41.0%
34.7%
42.6%
17.8%
22.9%
Director of Nursing (DON)
RN with Administrative Duties
Staff Registered Nurse (RN)
Licensed Practical Nurse (LPN)
Certified Nurse Assistant (CNA)
MDS Coordinator
Staff Development Coordinator
The findings from the 2010 AHCA survey of nursing facility staff indicate that America’s nursing facilities experience high levels of turnover and relatively low retention for nursing facility employees, especially for nursing care staff.

REPORT OF FINDINGS: 2010 AHCA NURSING FACILITY STAFFING SURVEY
American Health Care Association 2011 ©
4
1.0
INTRODUCTION The American Health Care Association (AHCA) conducted the sixth nationwide nursing facility staffing survey, which collected 2010 data to estimate the retention, vacancy and turnover rates of nursing facility employees. In 2002, 2004 and 2007, AHCA conducted three nursing facility staff vacancy and turnover surveys that collected staff information from the six nursing staff positions including Directors of Nursing (DONs), Registered Nurses with administrative responsibilities (ARNs), Staff Registered Nurses (RNs), Licensed Practical and Vocational Nurses (LPNs), Certified Nurse Assistants (CNAs), and non-certified nursing aides. Although nursing staff constitutes the majority of total employees of nursing facilities, other employees, including administrative and management staff, therapy staff, food services staff, housekeeping and maintenance staff, and social services and activities staff also make critical contributions in the provision of services to residents in nursing facilities. Since 2008, AHCA nursing facility staffing survey has collected retention, vacancy and turnover
information for all employees, except contract staff, who worked in nursing facilities nationwide. The survey questionnaire was made available for all eligible nursing facilities in the United States. In 2010, more than 3,700 nursing facilities nationwide participated in this survey. The detailed methodology of this study can be found in Section 4.0. This report presents findings at the national level from data collected from the AHCA 2010 nursing facility staffing survey. In general, retention, vacancy and turnover rates vary across job categories and across states. State level retention, vacancy and turnover rates can be found in Appendix A and Appendix B. Approximately 1.9 million workers were employed at nursing facilities across the United States in 2010. A total of 1.3 million persons, including Directors of Nursing, Registered Nurses with Administrative Duties, Staff Registered Nurses, Licensed Practical Nurses, Certified Nurse Assistants, and other nursing staff, provided nursing care to nursing facility residents. Of these workers, the majority were Certified Nurse Assistants (58 percent of total nursing staff).

REPORT OF FINDINGS: 2010 AHCA NURSING FACILITY STAFFING SURVEY
American Health Care Association 2011 ©
5
Table 1.1 Estimated Number of Nursing Facility Employees by Job Category, 2010
Number of Employees Percentage
Total Nursing Facility Employees 1,940,820 100.0%
Administrative and Management Staff 88,310 4.6%
Nursing Staff 1,272,870 65.6%
Therapy Staff 81,760 4.2%
Food Services Staff 222,550 11.5%
Housekeeping and Maintenance Staff 188,480 9.7%
Social Services and Activities Staff 86,850 4.5%
In 2010, the retention rate for all nursing facility employees was 55.1 percent. As shown in Table 1.2, the retention rates ranged from 51.4 to 71.9 percent for the all six major job categories. The retention rate of nursing staff was the lowest among all nursing facility employees. Vacancy rates also exhibited variability across major nursing facility job categories. As shown in Table 1.2, vacancy rates were highest among nursing staff (4.9 percent) and lowest for administrative staff (1.8 percent). Among nursing staff, vacancy rates were highest for RNs and CNAs, at 7.0 and 5.1 percent, respectively, while vacancy rates for DONs were only at 3.9 percent.
In 2010, the vacancy rate for all nursing facility employees was 4.2 percent. The turnover rate for all nursing facility employees was 35.1 percent. Turnover rates exhibited a high degree of variability across nursing facility job categories. As shown in table 1.2, turnover rates in nursing facilities were particularly high among nursing staff (39.5 percent) and food service staff (33.7 percent), and were lowest for administrative staff (18.0 percent). The findings from the survey indicate that nursing facilities still experienced difficulties in retention of nursing staff in 2010.
Table 1.2 Retention, Turnover, and Vacancy Rates by Nursing Facility Job Category, 2010
Retention Turnover Vacancy Total Nursing Facility Employees 55.1% 35.1% 4.2%
Administrative and Management Staff 71.9% 18.0% 1.8%
Nursing Staff 51.4% 39.5% 4.9%
Therapy Staff 65.7% 25.7% 3.8%
Food Services Staff 55.3% 33.7% 3.3%
Housekeeping and Maintenance Staff 65.2% 24.3% 2.6%
Social Services and Activities Staff 66.5% 22.5% 2.8%

REPORT OF FINDINGS: 2010 AHCA NURSING FACILITY STAFFING SURVEY
American Health Care Association 2011 ©
6
Figure 1.1 Retention Rates of All Nursing Facility Employees by State, 2010
55.1%53.1%
44.5%50.7%
64.0%48.2%
70.9%60.4%
57.2%61.9%
55.2%74.6%
57.0%47.8%
57.2%48.6%
41.4%46.7%
50.5%65.0%
54.4%59.3%
58.7%56.7%
40.5%59.5%
51.1%51.5%
65.2%51.3%
60.1%62.2%
38.2%52.2%
72.9%55.1%
37.6%55.9%56.0%
58.9%54.7%
51.3%55.3%
38.0%45.1%
57.9%49.1%
51.5%56.9%
50.9%50.5%
UNITED STATESALABAMA
ARKANSASARIZONA
CALIFORNIACOLORADO
CONNECTICUTDISTRICT OF COLUMBIA
DELAWAREFLORIDA
GEORGIAHAWAII
IOWAIDAHO
ILLINOISINDIANAKANSAS
KENTUCKYLOUISIANA
MASSACHUSETTSMARYLAND
MAINEMICHIGAN
MINNESOTAMISSOURI
MISSISSIPPIMONTANA
NORTH CAROLINANORTH DAKOTA
NEBRASKANEW HAMPSHIRE
NEW JERSEYNEW MEXICO
NEVADANEW YORK
OHIOOKLAHOMA
OREGONPENNSYLVANIARHODE ISLAND
SOUTH CAROLINASOUTH DAKOTA
TENNESSEETEXASUTAH
VIRGINIAVERMONT
WASHINGTONWISCONSIN
WEST VIRGINIAWYOMING

REPORT OF FINDINGS: 2010 AHCA NURSING FACILITY STAFFING SURVEY
American Health Care Association 2011 ©
7
Figure 1.2 Retention Rates of Nursing Staff by State, 2010
51.4%47.6%
40.5%47.8%
61.6%44.5%
69.6%61.5%
57.4%59.1%
51.5%74.6%
53.7%43.2%
52.2%44.6%
35.8%42.2%
46.4%63.7%
52.2%55.8%
53.5%53.1%
34.6%55.0%
48.8%46.5%
62.0%49.1%
57.0%61.4%
34.7%51.2%
70.7%51.5%
31.9%50.5%
53.5%55.5%
51.4%47.9%
49.6%34.3%
40.5%53.5%
45.9%46.7%
53.5%47.8%
41.6%
UNITED STATESALABAMA
ARKANSASARIZONA
CALIFORNIACOLORADO
CONNECTICUTDISTRICT OF COLUMBIA
DELAWAREFLORIDA
GEORGIAHAWAII
IOWAIDAHO
ILLINOISINDIANAKANSAS
KENTUCKYLOUISIANA
MASSACHUSETTSMARYLAND
MAINEMICHIGAN
MINNESOTAMISSOURI
MISSISSIPPIMONTANA
NORTH CAROLINANORTH DAKOTA
NEBRASKANEW HAMPSHIRE
NEW JERSEYNEW MEXICO
NEVADANEW YORK
OHIOOKLAHOMA
OREGONPENNSYLVANIARHODE ISLAND
SOUTH CAROLINASOUTH DAKOTA
TENNESSEETEXASUTAH
VIRGINIAVERMONT
WASHINGTONWISCONSIN
WEST VIRGINIAWYOMING
Turnover rates of nursing staff across the states could range from a low of 15.4 percent to a high
of 72.0 percent, a difference of 56.6 percentage points (see Figure 1.4).

REPORT OF FINDINGS: 2010 AHCA NURSING FACILITY STAFFING SURVEY
American Health Care Association 2011 ©
8
Figure 1.3 Turnover Rates of All Nursing Facility Employees by State, 2010
35.1%41.0%40.9%
39.7%24.4%
42.0%21.1%
22.8%37.2%
24.8%36.5%
14.4%28.2%
45.0%33.3%
40.8%53.2%
47.5%38.2%
25.5%36.5%
30.7%30.9%31.9%
56.8%25.8%
50.1%36.2%
24.6%38.0%
31.3%27.8%
62.2%45.6%
17.4%32.7%
60.9%33.7%
35.3%33.1%
30.0%36.9%
29.3%63.8%
43.8%31.6%
30.9%45.0%
32.9%49.4%
39.0%
UNITED STATESALABAMA
ARKANSASARIZONA
CALIFORNIACOLORADO
CONNECTICUTDISTRICT OF COLUMBIA
DELAWAREFLORIDA
GEORGIAHAWAII
IOWAIDAHO
ILLINOISINDIANAKANSAS
KENTUCKYLOUISIANA
MASSACHUSETTSMARYLAND
MAINEMICHIGAN
MINNESOTAMISSOURI
MISSISSIPPIMONTANA
NORTH CAROLINANORTH DAKOTA
NEBRASKANEW HAMPSHIRE
NEW JERSEYNEW MEXICO
NEVADANEW YORK
OHIOOKLAHOMA
OREGONPENNSYLVANIARHODE ISLAND
SOUTH CAROLINASOUTH DAKOTA
TENNESSEETEXASUTAH
VIRGINIAVERMONT
WASHINGTONWISCONSIN
WEST VIRGINIAWYOMING

REPORT OF FINDINGS: 2010 AHCA NURSING FACILITY STAFFING SURVEY
American Health Care Association 2011 ©
9
Figure 1.4 Turnover Rates of Nursing Staff by State, 2010
39.5%48.4%
45.3%43.9%
26.5%47.7%
21.7%23.5%
36.8%28.0%
41.6%15.4%
29.5%52.9%
38.0%46.4%
61.0%54.6%
43.0%26.4%
38.1%34.9%
36.8%36.9%
67.2%30.0%
51.2%43.0%
29.2%40.1%
32.5%29.0%
69.7%44.1%
19.7%37.3%
71.2%36.3%
39.3%36.4%
35.6%42.8%
35.9%72.0%
52.8%37.6%
32.6%52.1%
37.3%54.4%
49.7%
UNITED STATESALABAMA
ARKANSASARIZONA
CALIFORNIACOLORADO
CONNECTICUTDISTRICT OF COLUMBIA
DELAWAREFLORIDA
GEORGIAHAWAII
IOWAIDAHO
ILLINOISINDIANAKANSAS
KENTUCKYLOUISIANA
MASSACHUSETTSMARYLAND
MAINEMICHIGAN
MINNESOTAMISSOURI
MISSISSIPPIMONTANA
NORTH CAROLINANORTH DAKOTA
NEBRASKANEW HAMPSHIRE
NEW JERSEYNEW MEXICO
NEVADANEW YORK
OHIOOKLAHOMA
OREGONPENNSYLVANIARHODE ISLAND
SOUTH CAROLINASOUTH DAKOTA
TENNESSEETEXASUTAH
VIRGINIAVERMONT
WASHINGTONWISCONSIN
WEST VIRGINIAWYOMING

REPORT OF FINDINGS: 2010 AHCA NURSING FACILITY STAFFING SURVEY
American Health Care Association 2011 ©
10
2.0
RETENTION, VACANCY AND TURNOVER OF NURSING STAFF
In 2010, an estimated 1.3 million workers were employed as nursing staff in more than 15,000 nursing facilities nationwide. Nursing staff, including Director of Nursing (DON), Registered Nurse with Administrative Duties, Staff Registered Nurse (RN), Licensed Practical Nurse (LPN), Certified Nurse Assistant (CNA), and other nursing staff, represented 66 percent of the total nursing facility workforce. Certified Nurse Assistant constituted the largest portion of entire nursing staff (see Figure 2.1).
Figure 2.1 Percentage Breakdown of Nursing Staff by Job Position, 2010
Dir. of Nursing
1%
Admin. RN3%
Staff RN10%
Lic. Practical
Nurse 20%
Cert. Nurse Assist59%
Other Nursing
Staff7%
Table 2.1 Estimated Number of Nursing Staff by Job Position, 2010
Number of Employees Percentage
All Nursing Staff 1,272,869 100.0%
Director of Nursing (DON) 15,470 1.2%
RN with Administrative Duties (ARN) 36,417 2.9%
Staff Registered Nurse (RN) 121,234 9.5%
Licensed Practical Nurse (LPN) 255,409 20.1%
Certified Nurse Assistant (CNA) 741,752 58.3%
Other Nursing Staff 90,847 7.1%

REPORT OF FINDINGS: 2010 AHCA NURSING FACILITY STAFFING SURVEY
American Health Care Association 2011 ©
11
Table 2.2 Estimated retention, vacancy and turnover rates by Nursing Job Position, 2010
Nursing Job Position Retention Rate Turnover Rate Vacancy Rate
Director of Nursing (DON) 64.1% 26.0% 3.9%
RN with Administrative Duties (ARN) 56.2% 28.9% 4.5%
Staff Registered Nurse (RN) 49.5% 41.0% 7.0%
Licensed Practical Nurse (LPN) 56.0% 34.7% 4.3%
Certified Nurse Assistant (CNA) 49.0% 42.6% 5.1%
MDS Coordinator 70.5% 17.8% 2.8%
Staff Development Coordinator 65.6% 22.9% 0.0%
Table 2.3 Estimated Number of Vacancy by Nursing Job Position, 2010
Vacant Positions All Nursing Staff 65,700
Director of Nursing (DON) 620 RN with Administrative Duties (ARN) 1,800
Staff Registered Nurse (RN) 8,300 Licensed Practical Nurse (LPN) 11,700 Certified Nurse Assistant (CNA) 40,000
Other Nursing Staff 2,500
2.1 Retention of Nursing Staff In 2010, the retention rate for all nursing staff was 51.4 percent. The nursing staff retention rate was the lowest among all nursing facility employees. Retention rates exhibited variability across the nursing positions. As shown in Figure 2.2, retention rates were highest for the MDS coordinators (70.5 percent) and lowest among CNAs (49.0 percent). The low level of retention among RNs, LPNs and CNAs illustrated the difficulty that nursing facilities had in retaining direct care staff, particularly for CNAs.
Figure 2.2 Nursing Staff Retention Rates by Job Position, 2010
REPORT OF FINDINGS: 2010 AHCA NURSING FACILITY STAFFING SURVEY
American Health Care Association 2011 ©
12
2.2 Vacancy of Nursing Staff In 2010, an estimated 65,700 nursing job positions were needed to be filled at nursing facilities across the United States. The overall vacancy rate of nursing staff was 4.9 percent. The nursing staff vacancy rate was the highest among all nursing facility employees. Among nursing staff (see Figure 2.3), vacancy rates were highest for nurses with administrative duties (ARN) and Staff Registered Nurses (RN), at 8.7 and 7.9 percent, respectively; vacancy rates for DONs were only at 1.8 percent. The vacancy rate was at 5.7 percent for CNAs with an estimated 43,700 vacant positions. Figure 2.3 Nursing Staff Vacancy Rates by Job Position, 2010
2.3 Turnover of Nursing Staff Turnover rates remained high for most nursing job positions in 2010. Nationally, turnover rates exhibited a high degree of variability across nursing job positions. As shown in Figure 2.4, turnover rates in nursing facilities were particularly high among CNAs (42.6 percent), RNs (41.0 percent), and LPNs (34.7 percent). Meanwhile, the turnover rate for MDS Coordinator was lowest at 17.8 percent. The relatively large number of vacancies, low level of retention and the high level of turnover among CNAs continues to be a particular concern to nursing facilities as CNAs are responsible for much of the direct, hands-on resident care. Figure 2.4 Nursing Staff Turnover Rates by Job Position, 2010

REPORT OF FINDINGS: 2010 AHCA NURSING FACILITY STAFFING SURVEY
American Health Care Association 2011 ©
13
3.0
RETENTION, VACANCY AND TURNOVER OF OTHER NURSING FACILITY EMPLOYEES
In order to measure the extent of the difficulty that nursing facilities had in retaining their entire nursing facility workforce, the AHCA nursing facility staffing survey has expanded to collect
nationwide retention, vacancy and turnover information among all nursing facility employees since 2008.
3.1
RETENTION, VACANCY AND TURNOVER OF ADMINISTRATIVE AND MANAGEMENT STAFF
In 2010, an estimated 88,000 workers were employed as administrative and management staff, representing 4.6 percent of the total nursing facility workforce. Figure 3.1 Percentage of Administrative and Management Staff by Job Position, 2010
In 2010, the retention rate for all administrative and management staff was 71.9 percent, the highest among all nursing facility employees. Vacancy rates were lowest for administrative and management staff, at 1.8 percent. The overall turnover rate for administrative and management staff was 18.0 percent.

REPORT OF FINDINGS: 2010 AHCA NURSING FACILITY STAFFING SURVEY
American Health Care Association 2011 ©
14
Table 3.1 Administrative and Management Staff Vacancy, Turnover, and Retention Rates, 2010
Retention Rate Turnover Rate Vacancy Rate
All Administrator & Management Staff 71.9% 18.0% 1.8%
Administrator 68.9% 18.9% 2.4%
Office Manager/Controller 77.9% 20.0% 1.1%
Other Office Staff 71.2% 17.2% 1.7%
3.2
RETENTION, VACANCY AND TURNOVER OF THERAPY STAFF In 2010, an estimated 82,000 workers were employed as therapy staff, representing 4.2 percent of the total nursing facility workforce. Employees of outside contractors are widely used as therapy staff at nursing facilities across the nation. However, contract staff was not included in this study. In 2010, the retention rate for therapy staff was 65.7 percent. Vacancy rates were low among most of therapy staff, ranging from 0 to 5.4 percent. The overall turnover rate of therapy staff was 25.7 percent, one of the lowest among all nursing facility employee categories.
Figure 3.2 Percentage Breakdown of Therapy Staff by Job Position, 2010
REPORT OF FINDINGS: 2010 AHCA NURSING FACILITY STAFFING SURVEY
American Health Care Association 2011 ©
15
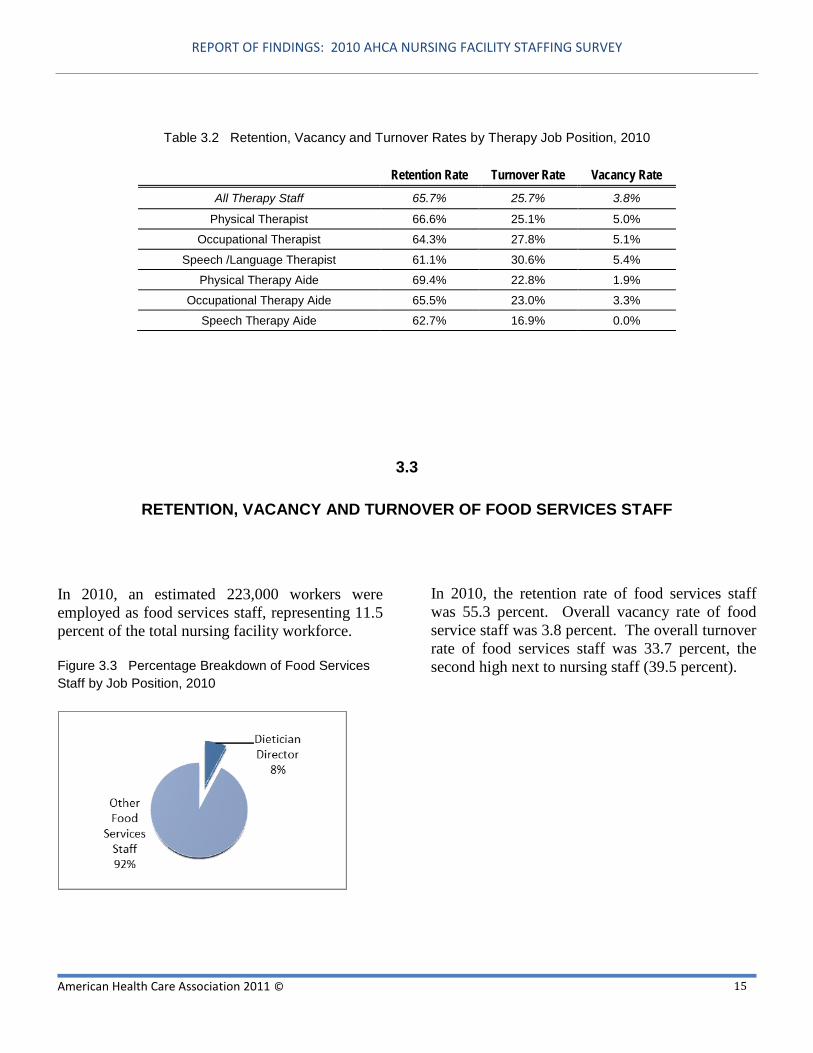
Table 3.2 Retention, Vacancy and Turnover Rates by Therapy Job Position, 2010
Retention Rate Turnover Rate Vacancy Rate
All Therapy Staff 65.7% 25.7% 3.8%
Physical Therapist 66.6% 25.1% 5.0%
Occupational Therapist 64.3% 27.8% 5.1%
Speech /Language Therapist 61.1% 30.6% 5.4%
Physical Therapy Aide 69.4% 22.8% 1.9%
Occupational Therapy Aide 65.5% 23.0% 3.3%
Speech Therapy Aide 62.7% 16.9% 0.0%
3.3
RETENTION, VACANCY AND TURNOVER OF FOOD SERVICES STAFF
In 2010, an estimated 223,000 workers were employed as food services staff, representing 11.5 percent of the total nursing facility workforce. Figure 3.3 Percentage Breakdown of Food Services Staff by Job Position, 2010
In 2010, the retention rate of food services staff was 55.3 percent. Overall vacancy rate of food service staff was 3.8 percent. The overall turnover rate of food services staff was 33.7 percent, the second high next to nursing staff (39.5 percent).

REPORT OF FINDINGS: 2010 AHCA NURSING FACILITY STAFFING SURVEY
American Health Care Association 2011 ©
16
Table 3.3 Retention, Vacancy and Turnover Rates by Food Services Job Position, 2010
Retention Rate Turnover Rate Vacancy Rate All Food Services Staff 55.3% 33.7% 3.3%
Dietician Supervisor 72.7% 16.6% 1.9%
Other food Service Staff 54.1% 35.1% 3.4%
3.4
RETENTION, VACANCY AND TURNOVER OF HOUSEKEEPING AND MAINTENANCE STAFF
In 2010, an estimated 188,000 workers were employed as housekeeping and maintenance staff, representing 9.7 percent of the total nursing facility workforce. Figure 3.4 Percentage Breakdown of Housekeeping and Maintenance Staff by Job Position, 2010
In 2010, the retention rate for housekeeping and maintenance staff was 65.2 percent. Vacancy rates were relatively low among most of housekeeping and maintenance staff, ranging from 2.2 to 2.9 percent. The overall turnover rate of housekeeping and maintenance staff was 24.3 percent.
REPORT OF FINDINGS: 2010 AHCA NURSING FACILITY STAFFING SURVEY
American Health Care Association 2011 ©
17
Table 3.4 Retention, Vacancy and Turnover Rates by Housekeeping and Maintenance Job Position, 2010
Retention Rate Turnover Rate Vacancy Rate
All Housekeeping & Maintenance Staff 65.2% 24.3% 2.6%
Housekeeping Staff 61.9% 27.1% 2.9%
Laundry Staff 68.9% 22.5% 2.3%
Maintenance Staff 71.4% 18.0% 2.4%
3.5
RETENTION, VACANCY AND TURNOVER OF SOCIAL SERVICES AND ACTIVITIES STAFF
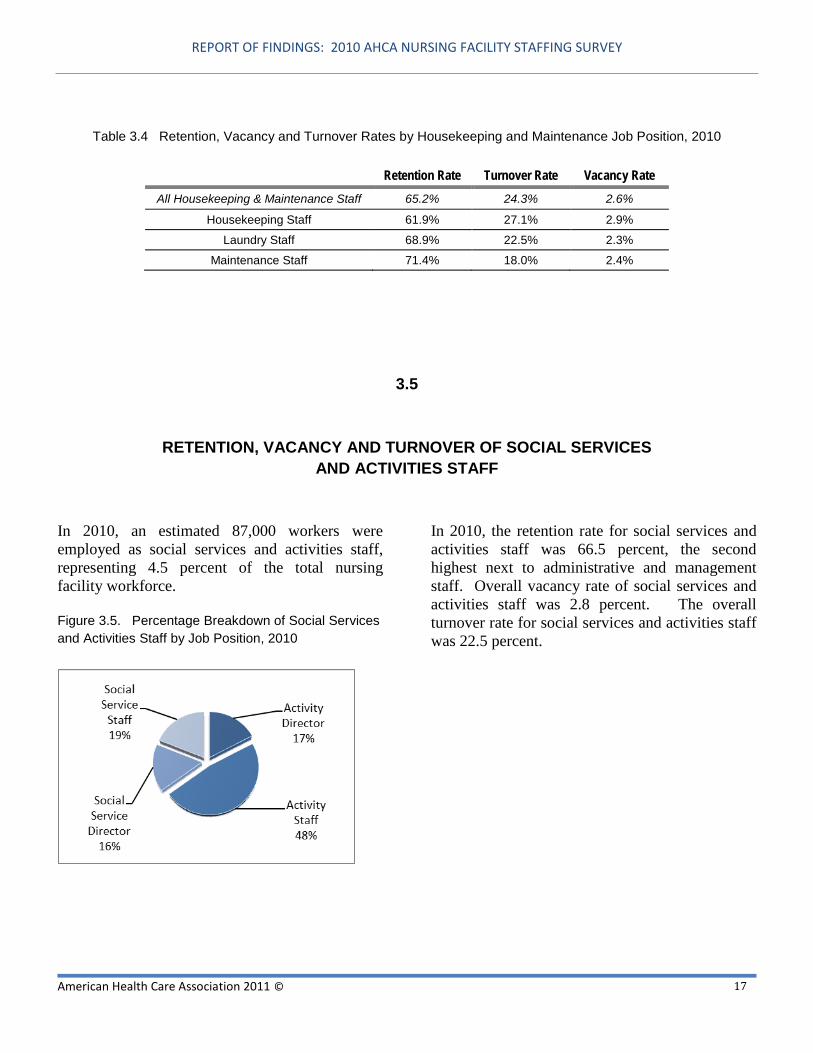
In 2010, an estimated 87,000 workers were employed as social services and activities staff, representing 4.5 percent of the total nursing facility workforce. Figure 3.5. Percentage Breakdown of Social Services and Activities Staff by Job Position, 2010
In 2010, the retention rate for social services and activities staff was 66.5 percent, the second highest next to administrative and management staff. Overall vacancy rate of social services and activities staff was 2.8 percent. The overall turnover rate for social services and activities staff was 22.5 percent.

REPORT OF FINDINGS: 2010 AHCA NURSING FACILITY STAFFING SURVEY
American Health Care Association 2011 ©
18
Table 3.5 Retention, Vacancy and Turnover Rates by Social Services and Activities Job Position, 2010
Retention Rate Turnover Rate Vacancy Rate
All Social Services & Activity Staff 66.5% 22.5% 2.8%
Activity Director 76.0% 14.7% 2.2%
Activity Staff 63.3% 25.6% 3.3%
Social Service Director 70.6% 21.1% 2.2%
Social Service Staff 63.1% 22.8% 2.9%

REPORT OF FINDINGS: 2010 AHCA NURSING FACILITY STAFFING SURVEY
American Health Care Association 2011 ©
19
4.0
SURVEY METHODOLOGY
2010 Nursing Facility Staffing Survey is an AHCA research project to collect nationwide retention, vacancy and turnover information among nursing
facility employees of six major job categories and twenty-seven job positions (see the table below).
Nursing Facility Job Category Nursing Facility Job Position
Administrative & Management Administrator Office Manager/Controller Other Office Staff
Nursing
Director of Nursing (DON) RN with Administrative Duties Staff Registered Nurse (RN) Licensed Practical Nurse (LPN) Certified Nurse Assistant (CNA) Non-Certified Nurse Aide, if applicable MDS Coordinator Staff Development Coordinator Other Nursing Staff
Therapy
Physical Therapist Occupational Therapist Speech Therapist/Language Pathologist Physical Therapy Aide Occupational Therapy Aide Speech Therapy Aide
Food Services Dietician Supervisor Other food Service Staff
Housekeeping & Maintenance Housekeeping Staff Laundry Staff Maintenance Staff
Social Services and Activities
Activity Director Activity Staff Social Service Director Social Service Staff
Other Others

REPORT OF FINDINGS: 2010 AHCA NURSING FACILITY STAFFING SURVEY
American Health Care Association 2011 ©
20
The survey questionnaire was used to collect four pieces of nursing facility staff information:
• Number of total current employees - the total number of persons on the payroll who worked or received pay as of December 31, 2010. All full-time, part-time, permanent, short-term, seasonal, salaried, and hourly employees were included. Employees of temporary help agencies and outside contractors will be excluded because they are counted by their employer of record, not by the nursing facility where they are working.
• Number of total vacant positions - a vacant
position means that: 1) a specific full-time or part-time position exists and there is work available for that position, 2) work could start within 30 days regardless of whether a suitable candidate is found, and 3) the employer is actively recruiting from outside the establishment to fill the position. Jobs to be filled only by internal transfers, promotions, demotions, or recall from layoffs are excluded.
• Total number of employees who had
worked in the facility for 12 months or longer - should not include employee(s) who had changed her/his job position within the same facility in the 12 months. For example, if the facility administrator left during 2010 and was replaced by the individual in the director of nursing position, the number of employees in this column would be reported as 0 for both the administrator and director of nursing positions.
• Total number of employees who had
worked in the facility during calendar year 2010.
In this report, we present aggregated results for the all job categories. We also report results for
selected job positions, particularly for all major nursing staff positions. Data for some job position was insufficient for analysis. Data from Alaska was insufficient to generate state level analysis. To ensure the reliability of the data, frequency distributions were examined and data was omitted from the analysis where individual responses were out of range or a combination of responses were deemed implausible through contingency checks. In cases where implausible or out of range data was detected, responses were omitted from analysis for the specific job position, except where noted otherwise. Results were adjusted to provide estimates representing the universe of nursing facilities eligible to participate in the survey. Population weights were calculated and applied for nursing facilities related to retention, vacancy, and turnover rates. Population adjustment factors were calculated in each job-specific analysis of retention, vacancy and turnover by dividing the number of facilities in the population within each category by the number of responding facilities in the category with usable data. The resulting factors were incorporated into the calculation of retention, vacancy and turnover rate estimates. All retention, vacancy and turnover rates are presented in this report as percentages. Retention rates were calculated by dividing the total number of employees who had worked in the nursing facility for 12 months or longer as of December 31, 2010 by the total number of employees during calendar year 2010. Vacancy rates were calculated by dividing the total number of vacancies as of December 31, 2010 by the total number of established positions as of December 31, 2010. Turnover rates were calculated by dividing the total number of terminations in 2010 by the total number of employees as of December 31, 2010.
REPORT OF FINDINGS 2010 NURSING FACILITY STAFFING SURVEY, APPENDIX A
© 2011, American Health Care Association Appendix A 1
Appendix A
TABLES OF RETENTION, VACANCY AND TURNOVER RATES
BY JOB CATEGORY AND JOB POSITION

REPORT OF FINDINGS 2010 NURSING FACILITY STAFFING SURVEY, APPENDIX A
© 2011, American Health Care Association Appendix A 2
1.
RETENTION, VACANCY AND TURNOVER RATES OF ADMINISTRATIVE
AND MANAGEMENT STAFF
Appendix A Table 1
ADMINISTRATIVE AND MANAGEMENT – ALL
Retention Turnover Vacancy Retention Turnover Vacancy
United States 71.9% 18.0% 1.8% Mississippi 78.9% 12.0% 2.6%
Alaska* Montana 78.3% 23.3% 2.1%
Alabama 78.2% 15.1% 3.2% North Carolina 74.5% 15.7% 1.6%
Arkansas 67.4% 18.1% 0.6% North Dakota 79.8% 6.1% 1.0%
Arizona 64.7% 22.4% 0.6% Nebraska 69.0% 20.6% 3.7%
California 69.8% 20.7% 1.8% New Hampshire 79.4% 22.1% 7.5%
Colorado 62.2% 36.7% 6.2% New Jersey 71.5% 15.7% 1.9%
Connecticut 78.7% 18.5% 0.6% New Mexico 51.3% 42.7% 1.4%
District of Columbia 70.9% 13.2% 0.0% Nevada 60.9% 42.3% 3.7%
Delaware 64.5% 23.0% 3.1% New York 85.4% 7.1% 2.3%
Florida 70.0% 15.9% 1.2% Ohio 72.0% 17.7% 0.9%
Georgia 74.4% 16.2% 1.1% Oklahoma 67.3% 28.9% 1.3%
Hawaii 71.0% 18.0% 3.0% Oregon 72.2% 19.8% 0.8%
Iowa 76.0% 9.4% 1.0% Pennsylvania 71.0% 18.7% 1.7%
Idaho 68.1% 22.2% 0.0% Rhode Island 81.8% 10.4% 0.0%
Illinois 70.3% 16.9% 1.9% South Carolina 81.1% 6.7% 1.8%
Indiana 64.9% 23.1% 1.0% South Dakota 84.1% 4.5% 1.1%
Kansas 68.1% 18.5% 1.4% Tennessee 74.5% 14.2% 1.0%
Kentucky 67.9% 24.6% 1.9% Texas 56.9% 29.3% 3.8%
Louisiana 73.9% 14.1% 2.0% Utah 74.9% 15.1% 1.6%
Massachusetts 72.6% 20.6% 0.6% Virginia 76.1% 13.8% 1.8%
Maryland 65.2% 22.8% 0.9% Vermont 68.4% 5.6% 6.4%
Maine 72.0% 13.2% 1.2% Washington 71.1% 23.5% 6.7%
Michigan 78.8% 12.0% 1.1% Wisconsin 74.7% 15.7% 2.4%
Minnesota 78.5% 12.3% 2.2% West Virginia 70.6% 22.2% 2.8%
Missouri 74.1% 15.2% 0.7% Wyoming 94.5% 2.8% 0.0%
* Data is insufficient for meaningful analysis.

REPORT OF FINDINGS 2010 NURSING FACILITY STAFFING SURVEY, APPENDIX A
© 2011, American Health Care Association Appendix A 3
Appendix A Table 2
ADMINISTRATIVE AND MANAGEMENT – ADMINISTRATOR
Retention Turnover Vacancy Retention Turnover Vacancy
United States 68.9% 18.9% 2.4% Mississippi 68.8% 18.5% 1.7%
Alaska* Montana 66.7% 20.0% 8.3%
Alabama 78.5% 13.4% 2.8% North Carolina 65.6% 18.4% 1.7%
Arkansas 61.3% 23.0% 0.0% North Dakota 88.5% 0.0% 0.0%
Arizona 58.6% 26.1% 0.0% Nebraska 76.6% 16.8% 5.5%
California 73.2% 17.7% 2.4% New Hampshire 78.6% 12.0% 0.0%
Colorado 54.0% 22.0% 4.3% New Jersey 77.1% 12.2% 0.0%
Connecticut 75.5% 10.4% 0.0% New Mexico 51.7% 31.8% 8.3%
District of Columbia 42.9% 16.7% 0.0% Nevada 77.8% 28.6% 0.0%
Delaware 53.3% 36.4% 0.0% New York 79.2% 10.3% 1.4%
Florida 62.5% 24.1% 1.1% Ohio 64.6% 21.8% 3.3%
Georgia 75.1% 14.2% 2.4% Oklahoma 64.5% 24.0% 1.9%
Hawaii 76.9% 18.2% 25.0% Oregon 60.7% 27.1% 0.0%
Iowa 79.3% 8.0% 1.1% Pennsylvania 66.4% 20.5% 2.9%
Idaho 63.2% 5.6% 0.0% Rhode Island 80.0% 7.1% 0.0%
Illinois 73.8% 14.5% 1.1% South Carolina 90.0% 2.6% 0.0%
Indiana 61.5% 22.0% 1.4% South Dakota 80.8% 4.0% 4.2%
Kansas 70.0% 14.3% 0.0% Tennessee 65.5% 17.0% 2.6%
Kentucky 62.7% 23.6% 1.8% Texas 47.7% 43.1% 6.2%
Louisiana 82.3% 10.7% 0.0% Utah 85.3% 6.3% 0.0%
Massachusetts 69.0% 18.4% 2.7% Virginia 84.3% 6.2% 2.4%
Maryland 65.4% 23.8% 0.0% Vermont 83.3% 0.0% 0.0%
Maine 76.1% 12.2% 0.0% Washington 52.9% 41.7% 8.0%
Michigan 70.6% 21.4% 1.9% Wisconsin 73.8% 20.4% 7.0%
Minnesota 70.0% 19.0% 4.4% West Virginia 62.9% 20.7% 8.0%
Missouri 78.1% 12.9% 0.0% Wyoming 100% 0.0% 0.0%
* Data is insufficient for meaningful analysis.

REPORT OF FINDINGS 2010 NURSING FACILITY STAFFING SURVEY, APPENDIX A
© 2011, American Health Care Association Appendix A 4
2.
RETENTION, VACANCY AND TURNOVER RATES OF NURSING STAFF
Appendix A Table 3
NURSING STAFF - ALL
Retention Turnover Vacancy Retention Turnover Vacancy
United States 51.4% 39.5% 4.9% Mississippi 55.0% 30.0% 4.8%
Alaska* Montana 48.8% 51.2% 5.5%
Alabama 47.6% 48.4% 3.7% North Carolina 46.5% 43.0% 3.6%
Arkansas 40.5% 45.3% 4.6% North Dakota 62.0% 29.2% 5.0%
Arizona 47.8% 43.9% 2.2% Nebraska 49.1% 40.1% 5.9%
California 61.6% 26.5% 2.9% New Hampshire 57.0% 32.5% 9.8%
Colorado 44.5% 47.7% 5.8% New Jersey 61.4% 29.0% 4.7%
Connecticut 69.6% 21.7% 4.4% New Mexico 34.7% 69.7% 3.0%
District of Columbia 61.5% 23.5% 9.7% Nevada 51.2% 44.1% 2.6%
Delaware 57.4% 36.8% 6.5% New York 70.7% 19.7% 6.9%
Florida 59.1% 28.0% 3.6% Ohio 51.5% 37.3% 3.5%
Georgia 51.5% 41.6% 4.9% Oklahoma 31.9% 71.2% 5.0%
Hawaii 74.6% 15.4% 3.6% Oregon 50.5% 36.3% 4.1%
Iowa 53.7% 29.5% 5.7% Pennsylvania 53.5% 39.3% 4.8%
Idaho 43.2% 52.9% 2.8% Rhode Island 55.5% 36.4% 5.2%
Illinois 52.2% 38.0% 6.2% South Carolina 51.4% 35.6% 4.4%
Indiana 44.6% 46.4% 3.8% South Dakota 47.9% 42.8% 6.9%
Kansas 35.8% 61.0% 5.0% Tennessee 49.6% 35.9% 3.6%
Kentucky 42.2% 54.6% 5.7% Texas 34.3% 72.0% 9.1%
Louisiana 46.4% 43.0% 6.3% Utah 40.5% 52.8% 1.1%
Massachusetts 63.7% 26.4% 4.8% Virginia 53.5% 37.6% 6.6%
Maryland 52.2% 38.1% 4.1% Vermont 45.9% 32.6% 8.0%
Maine 55.8% 34.9% 7.3% Washington 46.7% 52.1% 6.9%
Michigan 53.5% 36.8% 5.6% Wisconsin 53.5% 37.3% 5.0%
Minnesota 53.1% 36.9% 4.3% West Virginia 47.8% 54.4% 5.2%
Missouri 34.6% 67.2% 4.2% Wyoming 41.6% 49.7% 11.7%
* Data is insufficient for meaningful analysis.

REPORT OF FINDINGS 2010 NURSING FACILITY STAFFING SURVEY, APPENDIX A
© 2011, American Health Care Association Appendix A 5
Appendix A Table 4
NURSING STAFF – DIRECTOR OF NURSING (DON)
Retention Turnover Vacancy Retention Turnover Vacancy
United States 64.1% 26.0% 3.9% Mississippi 66.7% 20.0% 1.8%
Alaska* Montana 60.7% 21.7% 7.1%
Alabama 75.6% 18.0% 3.0% North Carolina 68.6% 24.9% 3.5%
Arkansas 59.4% 25.5% 2.4% North Dakota 79.3% 11.5% 0.0%
Arizona 57.6% 37.5% 0.0% Nebraska 77.0% 16.5% 10.1%
California 67.0% 25.3% 5.6% New Hampshire 64.4% 32.4% 12.5%
Colorado 50.0% 34.9% 7.1% New Jersey 75.9% 11.3% 3.0%
Connecticut 73.6% 20.5% 9.5% New Mexico 53.1% 45.5% 9.1%
District of Columbia 62.5% 33.3% 0.0% Nevada 61.1% 28.6% 0.0%
Delaware 83.3% 9.1% 0.0% New York 76.3% 12.8% 1.7%
Florida 52.5% 35.0% 2.3% Ohio 69.4% 20.3% 1.3%
Georgia 68.4% 23.8% 6.2% Oklahoma 53.8% 28.2% 1.9%
Hawaii 66.7% 25.0% 0.0% Oregon 67.2% 32.6% 3.0%
Iowa 68.1% 21.1% 1.1% Pennsylvania 61.8% 30.1% 5.6%
Idaho 62.1% 26.1% 0.0% Rhode Island 80.6% 10.7% 0.0%
Illinois 57.7% 34.0% 3.4% South Carolina 72.1% 13.2% 0.0%
Indiana 62.0% 27.4% 0.0% South Dakota 70.4% 17.4% 8.7%
Kansas 45.1% 50.0% 1.8% Tennessee 62.1% 24.7% 4.1%
Kentucky 62.6% 29.7% 1.7% Texas 43.2% 56.0% 8.9%
Louisiana 58.4% 37.5% 0.0% Utah 53.8% 18.2% 0.0%
Massachusetts 73.1% 15.6% 7.8% Virginia 88.0% 2.0% 2.4%
Maryland 58.1% 32.3% 0.0% Vermont 61.5% 8.3% 0.0%
Maine 69.6% 15.0% 9.1% Washington 72.5% 25.0% 4.3%
Michigan 68.6% 20.4% 1.8% Wisconsin 62.6% 32.4% 5.6%
Minnesota 62.9% 28.9% 9.1% West Virginia 59.7% 26.3% 0.0%
Missouri 73.4% 16.0% 1.5% Wyoming 87.5% 0.0% 0.0%
* Data is insufficient for meaningful analysis.

REPORT OF FINDINGS 2010 NURSING FACILITY STAFFING SURVEY, APPENDIX A
© 2011, American Health Care Association Appendix A 6
Appendix A Table 5
NURSING STAFF – REGISTERED NURSE WITH ADMINISTRATIVE DUTIES (ARN)
Retention Turnover Vacancy Retention Turnover Vacancy
United States 64.2% 25.7% 4.4% Mississippi 58.8% 41.7% 0.0%
Alaska* Montana 90.0% 42.9% 0.0%
Alabama 78.3% 20.7% 0.0% North Carolina 72.7% 17.9% 2.4%
Arkansas 63.5% 15.6% 2.9% North Dakota 100 % 18.2% 0.0%
Arizona 75.0% 20.0% 0.0% Nebraska 66.7% 17.1% 0.0%
California 70.9% 19.4% 0.0% New Hampshire 83.3% 12.5% 10.0%
Colorado 60.9% 38.1% 12.2% New Jersey 62.7% 19.6% 4.0%
Connecticut 78.9% 5.6% 0.0% New Mexico 52.0% 19.0% 0.0%
District of Columbia 75.0% 33.3% 0.0% Nevada 50.0% 33.3% 0.0%
Delaware 60.0% 25.0% 0.0% New York 88.9% 8.6% 2.3%
Florida 61.4% 28.3% 6.6% Ohio 69.9% 26.5% 6.3%
Georgia 63.9% 25.3% 4.8% Oklahoma 53.2% 27.4% 7.8%
Hawaii 85.7% 16.7% 0.0% Oregon 87.5% 14.3% 14.3%
Iowa 62.7% 27.5% 2.8% Pennsylvania 53.1% 36.4% 3.6%
Idaho 50.0% 33.3% 0.0% Rhode Island 70.6% 13.3% 0.0%
Illinois 67.7% 26.9% 8.7% South Carolina 62.5% 33.3% 12.5%
Indiana 53.3% 30.4% 5.8% South Dakota 42.9% 75.0% 0.0%
Kansas 67.4% 21.1% 0.0% Tennessee 63.0% 21.1% 4.9%
Kentucky 55.1% 24.1% 0.0% Texas 55.6% 39.9% 11.1%
Louisiana 70.1% 16.7% 4.0% Utah 60.0% 36.4% 0.0%
Massachusetts 66.7% 19.2% 3.4% Virginia 60.5% 26.5% 3.2%
Maryland 59.3% 25.5% 7.1% Vermont 100 % 0.0% 0.0%
Maine 66.7% 12.5% 9.1% Washington 73.9% 27.8% 0.0%
Michigan 70.0% 21.2% 4.7% Wisconsin 53.2% 51.2% 0.0%
Minnesota 68.7% 26.4% 2.3% West Virginia 66.7% 22.7% 0.0%
Missouri 72.6% 21.6% 0.0% Wyoming 100 % 0.0% 0.0%
* Data is insufficient for meaningful analysis.

REPORT OF FINDINGS 2010 NURSING FACILITY STAFFING SURVEY, APPENDIX A
© 2011, American Health Care Association Appendix A 7
Appendix A Table 6
NURSING STAFF – STAFF REGISTERED NURSE (RN)
Retention Turnover Vacancy Retention Turnover Vacancy
United States 49.5% 41.0% 7.0% Mississippi 49.6% 28.4% 6.8%
Alaska* Montana 47.3% 39.8% 3.7%
Alabama 39.6% 57.8% 6.1% North Carolina 39.6% 54.9% 2.7%
Arkansas 47.4% 33.1% 3.0% North Dakota 71.8% 20.2% 9.4%
Arizona 39.1% 59.1% 5.5% Nebraska 57.6% 31.9% 9.6%
California 54.2% 31.6% 4.0% New Hampshire 48.3% 46.1% 14.8%
Colorado 37.0% 55.7% 7.0% New Jersey 53.8% 37.7% 4.8%
Connecticut 60.0% 36.7% 5.8% New Mexico 31.3% 58.3% 0.9%
District of Columbia 42.9% 64.7% 8.1% Nevada 48.4% 37.6% 1.5%
Delaware 56.1% 43.8% 10.8% New York 72.6% 15.4% 7.9%
Florida 42.3% 43.9% 8.5% Ohio 46.9% 40.6% 3.2%
Georgia 45.4% 51.4% 6.6% Oklahoma 30.7% 62.2% 12.2%
Hawaii 74.3% 15.6% 4.5% Oregon 52.8% 35.6% 3.3%
Iowa 56.6% 26.1% 6.8% Pennsylvania 49.9% 40.6% 4.7%
Idaho 37.5% 67.3% 0.0% Rhode Island 58.3% 37.5% 7.6%
Illinois 55.3% 35.8% 6.9% South Carolina 46.2% 40.5% 6.0%
Indiana 45.8% 46.1% 7.5% South Dakota 51.7% 45.0% 11.5%
Kansas 42.5% 43.6% 6.9% Tennessee 50.9% 27.6% 5.2%
Kentucky 37.8% 70.2% 12.5% Texas 35.1% 57.1% 21.9%
Louisiana 40.8% 30.7% 13.3% Utah 44.7% 44.8% 0.0%
Massachusetts 57.6% 34.5% 5.9% Virginia 50.9% 39.8% 11.6%
Maryland 44.6% 51.9% 5.3% Vermont 45.2% 28.3% 17.6%
Maine 52.3% 40.8% 10.5% Washington 45.1% 54.6% 5.2%
Michigan 48.1% 46.6% 9.3% Wisconsin 49.3% 39.3% 5.0%
Minnesota 51.0% 40.7% 6.4% West Virginia 35.8% 66.1% 18.4%
Missouri 37.5% 64.3% 5.8% Wyoming 56.7% 26.0% 7.6%
* Data is insufficient for meaningful analysis.
REPORT OF FINDINGS 2010 NURSING FACILITY STAFFING SURVEY, APPENDIX A
© 2011, American Health Care Association Appendix A 8
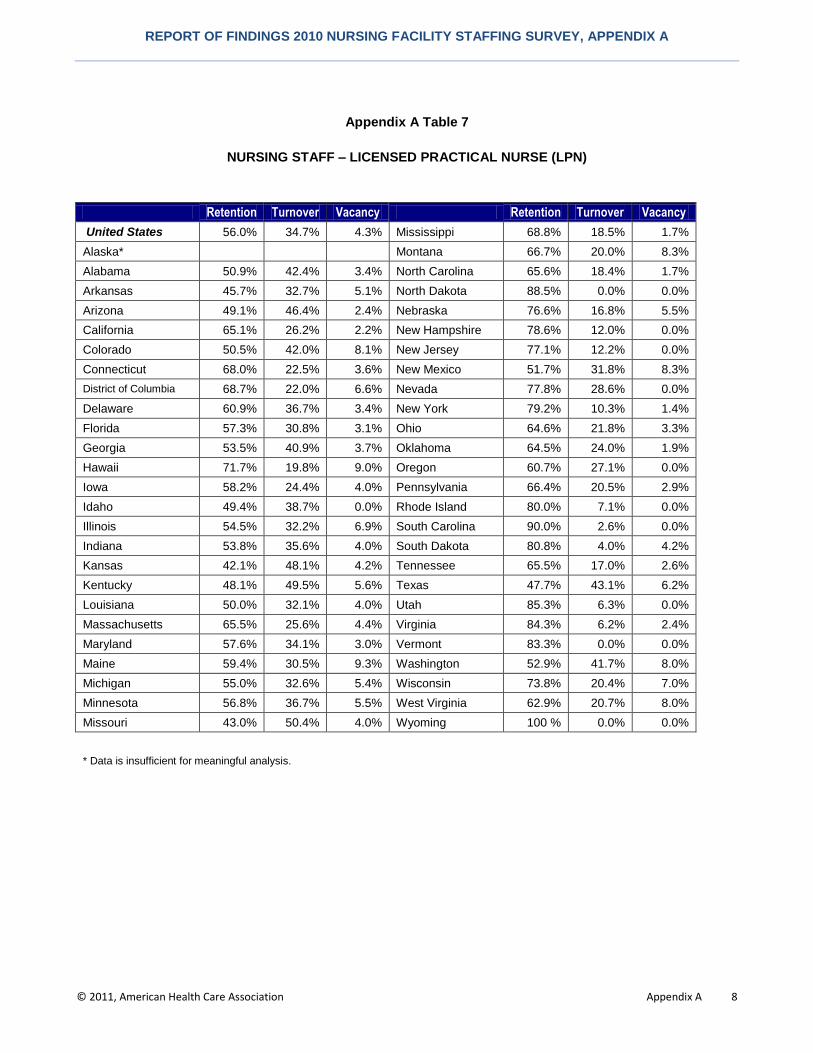
Appendix A Table 7
NURSING STAFF – LICENSED PRACTICAL NURSE (LPN)
Retention Turnover Vacancy Retention Turnover Vacancy
United States 56.0% 34.7% 4.3% Mississippi 68.8% 18.5% 1.7%
Alaska* Montana 66.7% 20.0% 8.3%
Alabama 50.9% 42.4% 3.4% North Carolina 65.6% 18.4% 1.7%
Arkansas 45.7% 32.7% 5.1% North Dakota 88.5% 0.0% 0.0%
Arizona 49.1% 46.4% 2.4% Nebraska 76.6% 16.8% 5.5%
California 65.1% 26.2% 2.2% New Hampshire 78.6% 12.0% 0.0%
Colorado 50.5% 42.0% 8.1% New Jersey 77.1% 12.2% 0.0%
Connecticut 68.0% 22.5% 3.6% New Mexico 51.7% 31.8% 8.3%
District of Columbia 68.7% 22.0% 6.6% Nevada 77.8% 28.6% 0.0%
Delaware 60.9% 36.7% 3.4% New York 79.2% 10.3% 1.4%
Florida 57.3% 30.8% 3.1% Ohio 64.6% 21.8% 3.3%
Georgia 53.5% 40.9% 3.7% Oklahoma 64.5% 24.0% 1.9%
Hawaii 71.7% 19.8% 9.0% Oregon 60.7% 27.1% 0.0%
Iowa 58.2% 24.4% 4.0% Pennsylvania 66.4% 20.5% 2.9%
Idaho 49.4% 38.7% 0.0% Rhode Island 80.0% 7.1% 0.0%
Illinois 54.5% 32.2% 6.9% South Carolina 90.0% 2.6% 0.0%
Indiana 53.8% 35.6% 4.0% South Dakota 80.8% 4.0% 4.2%
Kansas 42.1% 48.1% 4.2% Tennessee 65.5% 17.0% 2.6%
Kentucky 48.1% 49.5% 5.6% Texas 47.7% 43.1% 6.2%
Louisiana 50.0% 32.1% 4.0% Utah 85.3% 6.3% 0.0%
Massachusetts 65.5% 25.6% 4.4% Virginia 84.3% 6.2% 2.4%
Maryland 57.6% 34.1% 3.0% Vermont 83.3% 0.0% 0.0%
Maine 59.4% 30.5% 9.3% Washington 52.9% 41.7% 8.0%
Michigan 55.0% 32.6% 5.4% Wisconsin 73.8% 20.4% 7.0%
Minnesota 56.8% 36.7% 5.5% West Virginia 62.9% 20.7% 8.0%
Missouri 43.0% 50.4% 4.0% Wyoming 100 % 0.0% 0.0%
* Data is insufficient for meaningful analysis.
REPORT OF FINDINGS 2010 NURSING FACILITY STAFFING SURVEY, APPENDIX A
© 2011, American Health Care Association Appendix A 9
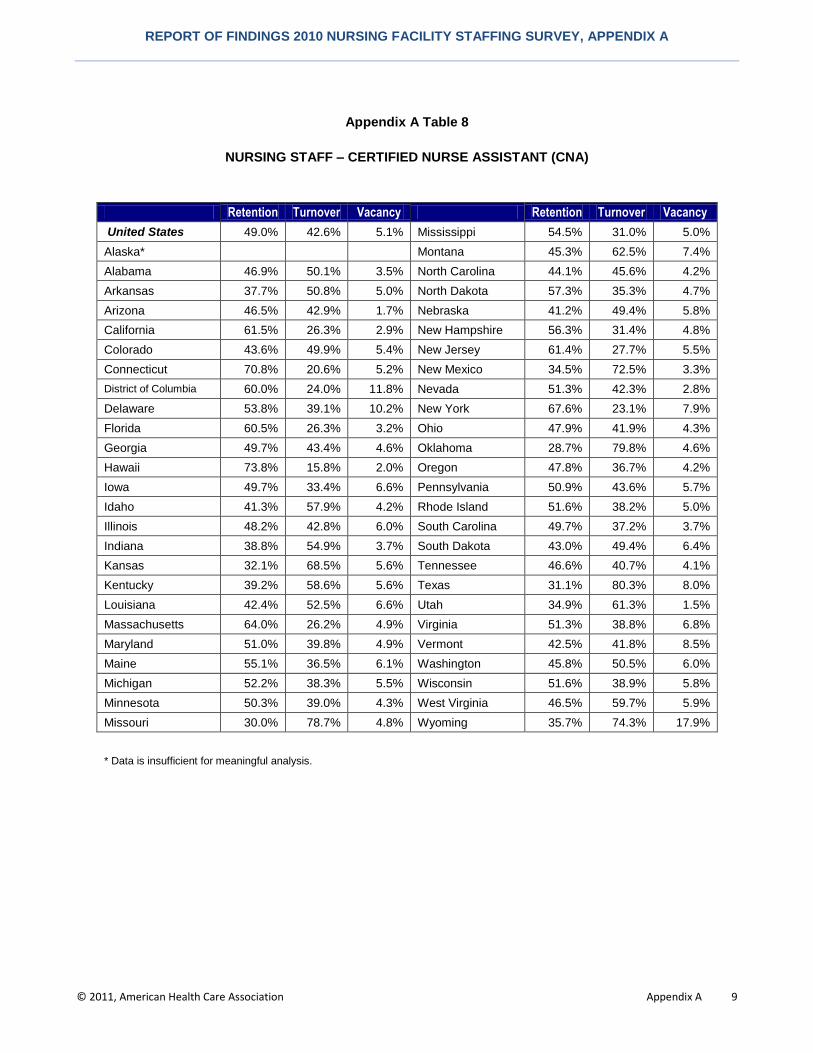
Appendix A Table 8
NURSING STAFF – CERTIFIED NURSE ASSISTANT (CNA)
Retention Turnover Vacancy Retention Turnover Vacancy
United States 49.0% 42.6% 5.1% Mississippi 54.5% 31.0% 5.0%
Alaska* Montana 45.3% 62.5% 7.4%
Alabama 46.9% 50.1% 3.5% North Carolina 44.1% 45.6% 4.2%
Arkansas 37.7% 50.8% 5.0% North Dakota 57.3% 35.3% 4.7%
Arizona 46.5% 42.9% 1.7% Nebraska 41.2% 49.4% 5.8%
California 61.5% 26.3% 2.9% New Hampshire 56.3% 31.4% 4.8%
Colorado 43.6% 49.9% 5.4% New Jersey 61.4% 27.7% 5.5%
Connecticut 70.8% 20.6% 5.2% New Mexico 34.5% 72.5% 3.3%
District of Columbia 60.0% 24.0% 11.8% Nevada 51.3% 42.3% 2.8%
Delaware 53.8% 39.1% 10.2% New York 67.6% 23.1% 7.9%
Florida 60.5% 26.3% 3.2% Ohio 47.9% 41.9% 4.3%
Georgia 49.7% 43.4% 4.6% Oklahoma 28.7% 79.8% 4.6%
Hawaii 73.8% 15.8% 2.0% Oregon 47.8% 36.7% 4.2%
Iowa 49.7% 33.4% 6.6% Pennsylvania 50.9% 43.6% 5.7%
Idaho 41.3% 57.9% 4.2% Rhode Island 51.6% 38.2% 5.0%
Illinois 48.2% 42.8% 6.0% South Carolina 49.7% 37.2% 3.7%
Indiana 38.8% 54.9% 3.7% South Dakota 43.0% 49.4% 6.4%
Kansas 32.1% 68.5% 5.6% Tennessee 46.6% 40.7% 4.1%
Kentucky 39.2% 58.6% 5.6% Texas 31.1% 80.3% 8.0%
Louisiana 42.4% 52.5% 6.6% Utah 34.9% 61.3% 1.5%
Massachusetts 64.0% 26.2% 4.9% Virginia 51.3% 38.8% 6.8%
Maryland 51.0% 39.8% 4.9% Vermont 42.5% 41.8% 8.5%
Maine 55.1% 36.5% 6.1% Washington 45.8% 50.5% 6.0%
Michigan 52.2% 38.3% 5.5% Wisconsin 51.6% 38.9% 5.8%
Minnesota 50.3% 39.0% 4.3% West Virginia 46.5% 59.7% 5.9%
Missouri 30.0% 78.7% 4.8% Wyoming 35.7% 74.3% 17.9%
* Data is insufficient for meaningful analysis.

REPORT OF FINDINGS 2010 NURSING FACILITY STAFFING SURVEY, APPENDIX A
© 2011, American Health Care Association Appendix A 10
3.
RETENTION, VACANCY AND TURNOVER RATES OF THERAPY STAFF
Appendix A Table 9
THERAPY STAFF - ALL
Retention Turnover Vacancy Retention Turnover Vacancy
United States 65.7% 25.7% 3.8% Mississippi 73.1% 3.8% 1.0%
Alaska* Montana 76.5% 23.0% 8.7%
Alabama 69.3% 20.5% 1.0% North Carolina 65.4% 23.4% 2.9%
Arkansas 79.4% 13.0% 2.2% North Dakota 86.0% 9.0% 5.0%
Arizona 69.0% 21.5% 1.1% Nebraska 64.8% 15.4% 2.9%
California 62.2% 20.5% 2.5% New Hampshire 65.5% 47.4% 16.8%
Colorado 32.0% 8.7% 9.6% New Jersey 57.4% 44.7% 2.4%
Connecticut 66.8% 38.4% 6.2% New Mexico 52.0% 29.5% 0.0%
District of Columbia 29.4% 6.3% 23.8% Nevada 51.7% 76.0% 0.0%
Delaware 62.1% 54.3% 0.0% New York 79.6% 13.6% 4.7%
Florida 69.0% 15.0% 6.3% Ohio 68.0% 8.7% 1.1%
Georgia 65.8% 16.9% 6.2% Oklahoma 65.8% 11.3% 5.3%
Hawaii 65.6% 10.3% 13.6% Oregon 62.0% 37.0% 7.7%
Iowa 61.2% 84.7% 3.2% Pennsylvania 61.6% 34.1% 2.1%
Idaho 54.8% 5.8% 4.8% Rhode Island 70.9% 36.2% 1.9%
Illinois 69.2% 41.1% 3.7% South Carolina 51.6% 25.7% 7.9%
Indiana 74.6% 9.2% 1.1% South Dakota 70.4% 0.0% 10.5%
Kansas 70.2% 13.6% 0.5% Tennessee 67.2% 12.0% 3.0%
Kentucky 62.5% 20.0% 8.1% Texas 55.2% 27.4% 7.3%
Louisiana 72.8% 5.8% 5.3% Utah 50.0% 20.9% 2.1%
Massachusetts 73.0% 29.5% 2.7% Virginia 70.2% 21.0% 6.0%
Maryland 52.9% 64.8% 1.6% Vermont 56.4% 27.3% 10.8%
Maine 69.2% 48.8% 3.4% Washington 66.6% 23.4% 8.4%
Michigan 71.7% 4.3% 7.0% Wisconsin 74.6% 11.6% 2.6%
Minnesota 81.2% 14.1% 2.0% West Virginia 48.5% 52.0% 1.0%
Missouri 63.1% 41.6% 1.1% Wyoming n/a n/a n/a
* Data is insufficient for meaningful analysis.

REPORT OF FINDINGS 2010 NURSING FACILITY STAFFING SURVEY, APPENDIX A
© 2011, American Health Care Association Appendix A 11
4.
RETENTION, VACANCY AND TURNOVER RATES OF FOOD SERVICES STAFF
Appendix A Table 10
FOOD SERVICES - ALL
Retention Turnover Vacancy Retention Turnover Vacancy
United States 55.3% 33.7% 3.3% Mississippi 66.3% 19.5% 4.6%
Alaska* Montana 38.6% 72.4% 4.7%
Alabama 59.8% 34.0% 5.7% North Carolina 53.8% 31.1% 1.2%
Arkansas 44.7% 38.9% 5.4% North Dakota 66.2% 19.9% 2.4%
Arizona 43.3% 50.8% 5.0% Nebraska 46.2% 43.5% 5.1%
California 65.0% 25.2% 3.2% New Hampshire 53.8% 34.0% 5.3%
Colorado 51.5% 42.5% 4.6% New Jersey 57.3% 32.6% 3.6%
Connecticut 71.5% 16.1% 1.3% New Mexico 41.2% 63.7% 2.8%
District of Columbia 66.1% 11.7% 1.0% Nevada 50.7% 41.1% 2.4%
Delaware 43.5% 51.5% 9.7% New York 70.7% 19.2% 2.7%
Florida 65.0% 21.3% 2.3% Ohio 55.7% 31.3% 2.5%
Georgia 60.3% 31.1% 3.0% Oklahoma 39.4% 56.7% 2.2%
Hawaii 78.8% 9.7% 2.1% Oregon 60.4% 34.8% 1.5%
Iowa 53.1% 32.2% 4.3% Pennsylvania 52.8% 34.0% 3.1%
Idaho 53.2% 42.1% 0.0% Rhode Island 55.5% 34.7% 2.4%
Illinois 62.0% 26.2% 2.9% South Carolina 54.8% 24.2% 3.6%
Indiana 49.0% 41.2% 4.1% South Dakota 49.9% 34.4% 5.2%
Kansas 41.4% 60.1% 4.0% Tennessee 60.9% 23.1% 2.2%
Kentucky 50.0% 47.1% 3.1% Texas 40.4% 56.3% 3.2%
Louisiana 51.5% 40.7% 6.1% Utah 42.1% 50.6% 2.5%
Massachusetts 57.9% 28.5% 2.5% Virginia 62.2% 23.3% 7.7%
Maryland 52.4% 39.5% 2.6% Vermont 48.7% 44.1% 2.3%
Maine 59.4% 22.3% 5.8% Washington 52.3% 40.5% 2.2%
Michigan 64.6% 26.4% 3.8% Wisconsin 56.2% 32.1% 2.5%
Minnesota 53.7% 31.2% 2.3% West Virginia 51.1% 53.1% 1.9%
Missouri 43.8% 45.8% 2.6% Wyoming 59.6% 23.6% 0.0%
* Data is insufficient for meaningful analysis.

REPORT OF FINDINGS 2010 NURSING FACILITY STAFFING SURVEY, APPENDIX A
© 2011, American Health Care Association Appendix A 12
5.
RETENTION, VACANCY AND TURNOVER RATES OF
HOUSEKEEPING AND MAINTENANCE STAFF
Appendix A Table 11
HOUSEKEEPING AND MAINTENANCE STAFF - ALL
Retention Turnover Vacancy Retention Turnover Vacancy
United States 65.2% 24.3% 2.6% Mississippi 71.6% 16.2% 2.5%
Alaska* Montana 56.9% 43.3% 1.0%
Alabama 68.2% 22.5% 2.4% North Carolina 67.5% 17.4% 1.5%
Arkansas 50.7% 35.8% 4.2% North Dakota 73.3% 16.6% 4.7%
Arizona 60.7% 24.5% 5.8% Nebraska 60.0% 33.3% 5.4%
California 76.5% 13.1% 2.1% New Hampshire 79.2% 15.1% 4.6%
Colorado 63.1% 27.5% 2.4% New Jersey 70.0% 18.3% 3.3%
Connecticut 78.5% 14.0% 0.7% New Mexico 48.1% 39.2% 1.1%
District of Columbia 50.5% 32.1% 2.8% Nevada 72.4% 25.0% 3.1%
Delaware 68.2% 23.8% 3.7% New York 78.4% 10.7% 2.5%
Florida 68.9% 21.1% 2.0% Ohio 65.2% 21.9% 1.7%
Georgia 61.4% 28.8% 2.6% Oklahoma 49.3% 49.9% 1.7%
Hawaii 77.7% 11.4% 2.0% Oregon 71.8% 23.3% 0.0%
Iowa 68.2% 18.7% 2.8% Pennsylvania 66.5% 23.2% 2.0%
Idaho 60.0% 27.4% 1.2% Rhode Island 72.4% 20.5% 3.1%
Illinois 67.3% 25.0% 2.4% South Carolina 68.7% 11.2% 3.3%
Indiana 54.9% 32.8% 2.6% South Dakota 58.7% 26.7% 6.9%
Kansas 50.6% 43.6% 4.8% Tennessee 69.6% 17.2% 2.1%
Kentucky 59.9% 28.1% 4.7% Texas 43.6% 60.3% 2.2%
Louisiana 54.8% 36.2% 5.4% Utah 53.9% 36.6% 0.8%
Massachusetts 75.5% 16.1% 1.8% Virginia 72.0% 16.5% 4.6%
Maryland 65.3% 23.1% 5.1% Vermont 54.8% 23.3% 3.0%
Maine 68.3% 17.3% 0.9% Washington 61.7% 33.6% 2.7%
Michigan 74.4% 18.6% 2.8% Wisconsin 70.1% 19.8% 3.1%
Minnesota 71.1% 14.4% 1.5% West Virginia 63.7% 31.4% 2.0%
Missouri 54.6% 34.7% 1.6% Wyoming 60.9% 34.7% 1.7%
* Data is insufficient for meaningful analysis.

REPORT OF FINDINGS 2010 NURSING FACILITY STAFFING SURVEY, APPENDIX A
© 2011, American Health Care Association Appendix A 13
6.
RETENTION, VACANCY AND TURNOVER RATES OF
SOCIAL SERVICES AND ACTIVITIES STAFF
Appendix A Table 12
SOCIAL SERVICES AND ACTIVITIES STAFF - ALL
Retention Turnover Vacancy Retention Turnover Vacancy
United States 66.5% 22.5% 2.8% Mississippi 72.2% 18.9% 3.5%
Alaska* Montana 56.4% 54.7% 0.0%
Alabama 75.0% 17.7% 0.9% North Carolina 66.7% 20.7% 2.9%
Arkansas 79.6% 13.0% 0.8% North Dakota 74.2% 14.4% 2.9%
Arizona 60.7% 29.0% 3.4% Nebraska 70.8% 21.6% 3.6%
California 68.5% 25.4% 2.9% New Hampshire 63.2% 21.8% 3.6%
Colorado 58.2% 31.0% 4.0% New Jersey 66.3% 18.5% 2.1%
Connecticut 73.0% 19.2% 2.0% New Mexico 44.2% 48.5% 5.0%
District of Columbia* 55.8% 36.8% 10.2% Nevada 43.0% 67.2% 3.5%
Delaware 64.1% 28.0% 3.7% New York 80.2% 8.4% 2.5%
Florida 70.0% 13.9% 1.6% Ohio 67.9% 22.8% 2.8%
Georgia 70.6% 18.3% 3.5% Oklahoma 64.1% 20.4% 2.0%
Hawaii 67.8% 16.0% 1.3% Oregon 71.5% 28.8% 2.7%
Iowa 71.9% 14.2% 2.2% Pennsylvania 64.7% 23.9% 2.3%
Idaho 65.3% 20.8% 0.0% Rhode Island 60.8% 24.5% 5.5%
Illinois 65.1% 20.8% 4.5% South Carolina 68.7% 18.8% 1.0%
Indiana 61.1% 24.6% 2.0% South Dakota 65.6% 23.0% 3.5%
Kansas 61.7% 28.6% 4.3% Tennessee 73.6% 12.4% 1.4%
Kentucky 64.5% 23.6% 2.1% Texas 51.1% 41.2% 1.3%
Louisiana 72.1% 16.2% 1.4% Utah 59.5% 25.5% 0.0%
Massachusetts 67.8% 20.8% 2.7% Virginia 65.4% 21.7% 4.3%
Maryland 61.0% 28.7% 4.7% Vermont 62.1% 12.7% 0.0%
Maine 69.5% 16.2% 3.2% Washington 64.9% 35.1% 2.5%
Michigan 68.9% 20.2% 1.7% Wisconsin 66.4% 23.8% 5.7%
Minnesota 66.1% 21.8% 3.7% West Virginia 54.8% 39.8% 1.6%
Missouri 58.2% 35.9% 2.7% Wyoming 69.0% 22.8% 0.0%
* Data is insufficient for meaningful analysis.

REPORT OF FINDINGS 2010 NURSING FACILITY STAFFING SURVEY, APPEDIX B
ALABAMA
Estimated Number and Percentage* of Nursing Facility Employees
by Job Category and Nursing Job Position, 2010
STATE UNITED STATES
All Nursing Facility Employees 31,501 100.0% 1,940,818 100.0%
Administrative and Management Staff 1,236 3.9% 88,310 4.6%
Nursing Staff 21,733 69.0% 1,272,869 65.6%
Therapy Staff 933 3.0% 81,763 4.2%
Food Services Staff 3,034 9.6% 222,547 11.5%
Housekeeping and Maintenance Staff 3,382 10.7% 188,484 9.7%
Social Services and Activities Staff 1,183 3.8% 86,846 4.5%
Nursing Staff 21,733 100.0% 1,272,869 100.0%
Director of Nursing (DON) 227 1.0% 15,470 1.2%
RN with Administrative Duties (ARN) 756 3.5% 36,417 2.9%
Staff Registered Nurse (RN) 1,024 4.7% 121,234 9.5%
Licensed Practical Nurse (LPN) 4,935 22.7% 255,409 20.1%
Certified Nurse Assistant (CNA) 12,975 59.7% 741,752 58.3%
Other Nursing Staff 1,629 7.5% 90,847 7.1%
Retention, Turnover, and Vacancy Rates of Nursing Facility Employees
by Job Category and Nursing Job Position, 2010
RETENTION RATE TURNOVER RATE VACANCY RATE
STATE U.S. STATE U.S. STATE U.S.
All Nursing Facility Employees 53.1% 55.1% 41.0% 35.1% 3.6% 4.2%
Administrative and Management Staff 78.2% 71.9% 15.1% 18.0% 3.2% 1.8%
Nursing Staff 47.6% 51.4% 48.4% 39.5% 3.7% 4.9%
Therapy Staff 69.3% 65.7% 20.5% 25.7% 1.0% 3.8%
Food Services Staff 59.8% 55.3% 34.0% 33.7% 5.7% 3.3%
Housekeeping and Maintenance Staff 68.2% 65.2% 22.5% 24.3% 2.4% 2.6%
Social Services and Activities Staff 75.0% 66.5% 17.7% 22.5% 0.9% 2.8%
Nursing Staff
Director of Nursing (DON) 75.6% 64.1% 18.0% 26.0% 3.0% 3.9%
RN with Administrative Duties (ARN) 52.1% 56.2% 27.9% 28.9% 6.7% 4.5%
Staff Registered Nurse (RN) 39.6% 49.5% 57.8% 41.0% 6.1% 7.0%
Licensed Practical Nurse (LPN) 50.9% 56.0% 42.4% 34.7% 3.4% 4.3%
Certified Nurse Assistant (CNA) 46.9% 49.0% 50.1% 42.6% 3.5% 5.1%
All retention, turnover and vacancy statistics were produced by AHCA using data from 2010 AHCA Nursing Facility Staffing Survey.
*May not add due to rounding.

REPORT OF FINDINGS 2010 NURSING FACILITY STAFFING SURVEY, APPEDIX B
ARKANSAS
Estimated Number and Percentage* of Nursing Facility Employees
by Job Category and Nursing Job Position, 2010
STATE UNITED STATES
All Nursing Facility Employees 25,012 100.0% 1,940,818 100.0%
Administrative and Management Staff 919 3.7% 88,310 4.6%
Nursing Staff 17,729 70.9% 1,272,869 65.6%
Therapy Staff 658 2.6% 81,763 4.2%
Food Services Staff 2,295 9.2% 222,547 11.5%
Housekeeping and Maintenance Staff 2,711 10.8% 188,484 9.7%
Social Services and Activities Staff 699 2.8% 86,846 4.5%
Nursing Staff 17,729 100.0% 1,272,869 100.0%
Director of Nursing (DON) 225 1.3% 15,470 1.2%
RN with Administrative Duties (ARN) 254 1.4% 36,417 2.9%
Staff Registered Nurse (RN) 542 3.1% 121,234 9.5%
Licensed Practical Nurse (LPN) 3,726 21.0% 255,409 20.1%
Certified Nurse Assistant (CNA) 11,771 66.4% 741,752 58.3%
Other Nursing Staff 1,009 5.7% 90,847 7.1%
Retention, Turnover, and Vacancy Rates of Nursing Facility Employees
by Job Category and Nursing Job Position, 2010
RETENTION RATE TURNOVER RATE VACANCY RATE
STATE U.S. STATE U.S. STATE U.S.
All Nursing Facility Employees 44.5% 55.1% 40.9% 35.1% 4.3% 4.2%
Administrative and Management Staff 67.4% 71.9% 18.1% 18.0% 0.6% 1.8%
Nursing Staff 40.5% 51.4% 45.3% 39.5% 4.6% 4.9%
Therapy Staff 79.4% 65.7% 13.0% 25.7% 2.2% 3.8%
Food Services Staff 44.7% 55.3% 38.9% 33.7% 5.4% 3.3%
Housekeeping and Maintenance Staff 50.7% 65.2% 35.8% 24.3% 4.2% 2.6%
Social Services and Activities Staff 79.6% 66.5% 13.0% 22.5% 0.8% 2.8%
Nursing Staff
Director of Nursing (DON) 59.4% 64.1% 25.5% 26.0% 2.4% 3.9%
RN with Administrative Duties (ARN) 50.0% 56.2% 32.1% 28.9% 2.3% 4.5%
Staff Registered Nurse (RN) 47.4% 49.5% 33.1% 41.0% 3.0% 7.0%
Licensed Practical Nurse (LPN) 45.7% 56.0% 32.7% 34.7% 5.1% 4.3%
Certified Nurse Assistant (CNA) 37.7% 49.0% 50.8% 42.6% 5.0% 5.1%
All retention, turnover and vacancy statistics were produced by AHCA using data from 2010 AHCA Nursing Facility Staffing Survey.
*May not add due to rounding.

REPORT OF FINDINGS 2010 NURSING FACILITY STAFFING SURVEY, APPEDIX B
ARIZONA
Estimated Number and Percentage* of Nursing Facility Employees
by Job Category and Nursing Job Position, 2010
STATE UNITED STATES
All Nursing Facility Employees 19,652 100.0% 1,940,818 100.0%
Administrative and Management Staff 1,365 6.9% 88,310 4.6%
Nursing Staff 12,682 64.5% 1,272,869 65.6%
Therapy Staff 808 4.1% 81,763 4.2%
Food Services Staff 2,085 10.6% 222,547 11.5%
Housekeeping and Maintenance Staff 1,934 9.8% 188,484 9.7%
Social Services and Activities Staff 779 4.0% 86,846 4.5%
Nursing Staff 12,682 100.0% 1,272,869 100.0%
Director of Nursing (DON) 139 1.1% 15,470 1.2%
RN with Administrative Duties (ARN) 114 0.9% 36,417 2.9%
Staff Registered Nurse (RN) 1,360 10.7% 121,234 9.5%
Licensed Practical Nurse (LPN) 2,658 21.0% 255,409 20.1%
Certified Nurse Assistant (CNA) 7,234 57.0% 741,752 58.3%
Other Nursing Staff 1,050 8.3% 90,847 7.1%
Retention, Turnover, and Vacancy Rates of Nursing Facility Employees
by Job Category and Nursing Job Position, 2010
RETENTION RATE TURNOVER RATE VACANCY RATE
STATE U.S. STATE U.S. STATE U.S.
All Nursing Facility Employees 50.7% 55.1% 39.7% 35.1% 2.8% 4.2%
Administrative and Management Staff 64.7% 71.9% 22.4% 18.0% 0.6% 1.8%
Nursing Staff 47.8% 51.4% 43.9% 39.5% 2.2% 4.9%
Therapy Staff 69.0% 65.7% 21.5% 25.7% 1.1% 3.8%
Food Services Staff 43.3% 55.3% 50.8% 33.7% 5.0% 3.3%
Housekeeping and Maintenance Staff 60.7% 65.2% 24.5% 24.3% 5.8% 2.6%
Social Services and Activities Staff 60.7% 66.5% 29.0% 22.5% 3.4% 2.8%
Nursing Staff
Director of Nursing (DON) 57.6% 64.1% 37.5% 26.0% 0.0% 3.9%
RN with Administrative Duties (ARN) 78.6% 56.2% 0.0% 28.9% 0.0% 4.5%
Staff Registered Nurse (RN) 39.1% 49.5% 59.1% 41.0% 5.5% 7.0%
Licensed Practical Nurse (LPN) 49.1% 56.0% 46.4% 34.7% 2.4% 4.3%
Certified Nurse Assistant (CNA) 46.5% 49.0% 42.9% 42.6% 1.7% 5.1%
All retention, turnover and vacancy statistics were produced by AHCA using data from 2010 AHCA Nursing Facility Staffing Survey.
*May not add due to rounding.

REPORT OF FINDINGS 2010 NURSING FACILITY STAFFING SURVEY, APPEDIX B
CALIFORNIA
Estimated Number and Percentage* of Nursing Facility Employees
by Job Category and Nursing Job Position, 2010
STATE UNITED STATES
All Nursing Facility Employees 142,503 100.0% 1,940,818 100.0%
Administrative and Management Staff 7,521 5.3% 88,310 4.6%
Nursing Staff 93,381 65.5% 1,272,869 65.6%
Therapy Staff 7,782 5.5% 81,763 4.2%
Food Services Staff 13,971 9.8% 222,547 11.5%
Housekeeping and Maintenance Staff 13,323 9.3% 188,484 9.7%
Social Services and Activities Staff 6,525 4.6% 86,846 4.5%
Nursing Staff 93,381 100.0% 1,272,869 100.0%
Director of Nursing (DON) 1,179 1.3% 15,470 1.2%
RN with Administrative Duties (ARN) 2,577 2.8% 36,417 2.9%
Staff Registered Nurse (RN) 9,665 10.4% 121,234 9.5%
Licensed Practical Nurse (LPN) 16,695 17.9% 255,409 20.1%
Certified Nurse Assistant (CNA) 55,748 59.7% 741,752 58.3%
Other Nursing Staff 6,874 7.4% 90,847 7.1%
Retention, Turnover, and Vacancy Rates of Nursing Facility Employees
by Job Category and Nursing Job Position, 2010
RETENTION RATE TURNOVER RATE VACANCY RATE
STATE U.S. STATE U.S. STATE U.S.
All Nursing Facility Employees 64.0% 55.1% 24.4% 35.1% 2.8% 4.2%
Administrative and Management Staff 69.8% 71.9% 20.7% 18.0% 1.8% 1.8%
Nursing Staff 61.6% 51.4% 26.5% 39.5% 2.9% 4.9%
Therapy Staff 62.2% 65.7% 20.5% 25.7% 2.5% 3.8%
Food Services Staff 65.0% 55.3% 25.2% 33.7% 3.2% 3.3%
Housekeeping and Maintenance Staff 76.5% 65.2% 13.1% 24.3% 2.1% 2.6%
Social Services and Activities Staff 68.5% 66.5% 25.4% 22.5% 2.9% 2.8%
Nursing Staff
Director of Nursing (DON) 67.0% 64.1% 25.3% 26.0% 5.6% 3.9%
RN with Administrative Duties (ARN) 50.1% 56.2% 26.4% 28.9% 1.4% 4.5%
Staff Registered Nurse (RN) 54.2% 49.5% 31.6% 41.0% 4.0% 7.0%
Licensed Practical Nurse (LPN) 65.1% 56.0% 26.2% 34.7% 2.2% 4.3%
Certified Nurse Assistant (CNA) 61.5% 49.0% 26.3% 42.6% 2.9% 5.1%
All retention, turnover and vacancy statistics were produced by AHCA using data from 2010 AHCA Nursing Facility Staffing Survey.
*May not add due to rounding.
REPORT OF FINDINGS 2010 NURSING FACILITY STAFFING SURVEY, APPEDIX B
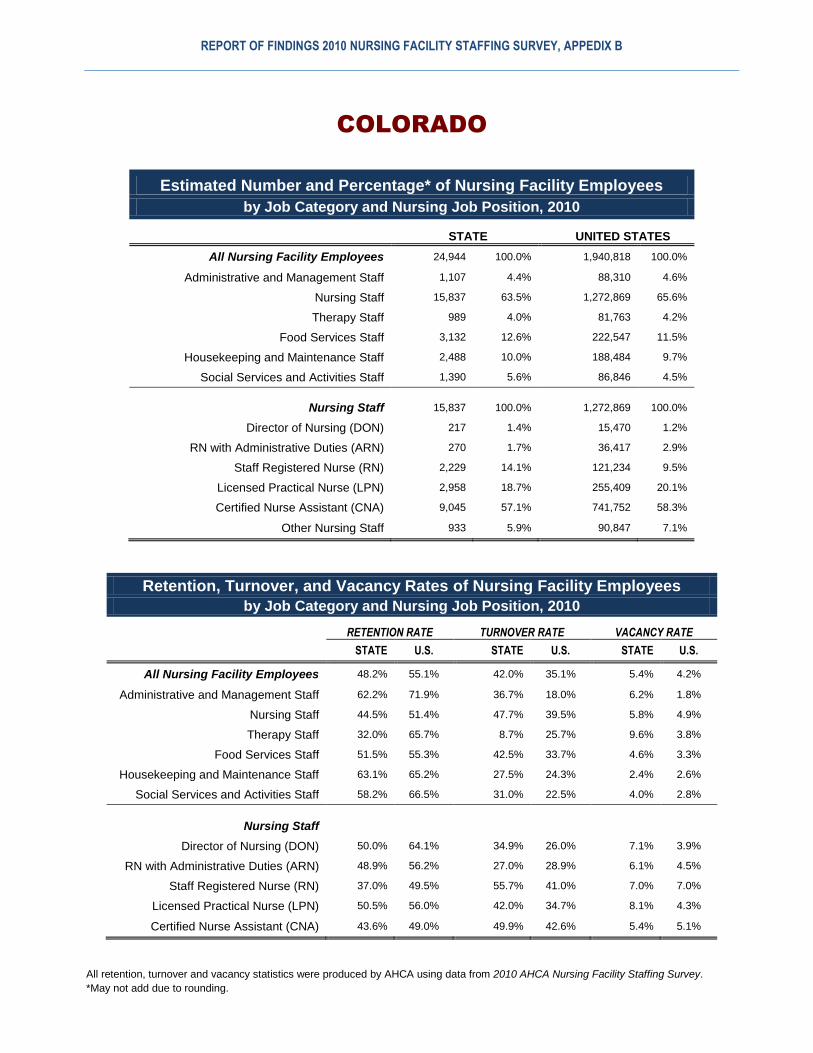
COLORADO
Estimated Number and Percentage* of Nursing Facility Employees
by Job Category and Nursing Job Position, 2010
STATE UNITED STATES
All Nursing Facility Employees 24,944 100.0% 1,940,818 100.0%
Administrative and Management Staff 1,107 4.4% 88,310 4.6%
Nursing Staff 15,837 63.5% 1,272,869 65.6%
Therapy Staff 989 4.0% 81,763 4.2%
Food Services Staff 3,132 12.6% 222,547 11.5%
Housekeeping and Maintenance Staff 2,488 10.0% 188,484 9.7%
Social Services and Activities Staff 1,390 5.6% 86,846 4.5%
Nursing Staff 15,837 100.0% 1,272,869 100.0%
Director of Nursing (DON) 217 1.4% 15,470 1.2%
RN with Administrative Duties (ARN) 270 1.7% 36,417 2.9%
Staff Registered Nurse (RN) 2,229 14.1% 121,234 9.5%
Licensed Practical Nurse (LPN) 2,958 18.7% 255,409 20.1%
Certified Nurse Assistant (CNA) 9,045 57.1% 741,752 58.3%
Other Nursing Staff 933 5.9% 90,847 7.1%
Retention, Turnover, and Vacancy Rates of Nursing Facility Employees
by Job Category and Nursing Job Position, 2010
RETENTION RATE TURNOVER RATE VACANCY RATE
STATE U.S. STATE U.S. STATE U.S.
All Nursing Facility Employees 48.2% 55.1% 42.0% 35.1% 5.4% 4.2%
Administrative and Management Staff 62.2% 71.9% 36.7% 18.0% 6.2% 1.8%
Nursing Staff 44.5% 51.4% 47.7% 39.5% 5.8% 4.9%
Therapy Staff 32.0% 65.7% 8.7% 25.7% 9.6% 3.8%
Food Services Staff 51.5% 55.3% 42.5% 33.7% 4.6% 3.3%
Housekeeping and Maintenance Staff 63.1% 65.2% 27.5% 24.3% 2.4% 2.6%
Social Services and Activities Staff 58.2% 66.5% 31.0% 22.5% 4.0% 2.8%
Nursing Staff
Director of Nursing (DON) 50.0% 64.1% 34.9% 26.0% 7.1% 3.9%
RN with Administrative Duties (ARN) 48.9% 56.2% 27.0% 28.9% 6.1% 4.5%
Staff Registered Nurse (RN) 37.0% 49.5% 55.7% 41.0% 7.0% 7.0%
Licensed Practical Nurse (LPN) 50.5% 56.0% 42.0% 34.7% 8.1% 4.3%
Certified Nurse Assistant (CNA) 43.6% 49.0% 49.9% 42.6% 5.4% 5.1%
All retention, turnover and vacancy statistics were produced by AHCA using data from 2010 AHCA Nursing Facility Staffing Survey.
*May not add due to rounding.

REPORT OF FINDINGS 2010 NURSING FACILITY STAFFING SURVEY, APPEDIX B
CONNECTICUT
Estimated Number and Percentage* of Nursing Facility Employees
by Job Category and Nursing Job Position, 2010
STATE UNITED STATES
All Nursing Facility Employees 41,549 100.0% 1,940,818 100.0%
Administrative and Management Staff 1,976 4.8% 88,310 4.6%
Nursing Staff 27,187 65.4% 1,272,869 65.6%
Therapy Staff 2,302 5.5% 81,763 4.2%
Food Services Staff 4,983 12.0% 222,547 11.5%
Housekeeping and Maintenance Staff 3,464 8.3% 188,484 9.7%
Social Services and Activities Staff 1,637 3.9% 86,846 4.5%
Nursing Staff 27,187 100.0% 1,272,869 100.0%
Director of Nursing (DON) 233 0.9% 15,470 1.2%
RN with Administrative Duties (ARN) 1,031 3.8% 36,417 2.9%
Staff Registered Nurse (RN) 3,275 12.0% 121,234 9.5%
Licensed Practical Nurse (LPN) 5,317 19.6% 255,409 20.1%
Certified Nurse Assistant (CNA) 15,381 56.6% 741,752 58.3%
Other Nursing Staff 1,713 6.3% 90,847 7.1%
Retention, Turnover, and Vacancy Rates of Nursing Facility Employees
by Job Category and Nursing Job Position, 2010
RETENTION RATE TURNOVER RATE VACANCY RATE
STATE U.S. STATE U.S. STATE U.S.
All Nursing Facility Employees 70.9% 55.1% 21.1% 35.1% 3.6% 4.2%
Administrative and Management Staff 78.7% 71.9% 18.5% 18.0% 0.6% 1.8%
Nursing Staff 69.6% 51.4% 21.7% 39.5% 4.4% 4.9%
Therapy Staff 66.8% 65.7% 38.4% 25.7% 6.2% 3.8%
Food Services Staff 71.5% 55.3% 16.1% 33.7% 1.3% 3.3%
Housekeeping and Maintenance Staff 78.5% 65.2% 14.0% 24.3% 0.7% 2.6%
Social Services and Activities Staff 73.0% 66.5% 19.2% 22.5% 2.0% 2.8%
Nursing Staff
Director of Nursing (DON) 73.6% 64.1% 20.5% 26.0% 9.5% 3.9%
RN with Administrative Duties (ARN) 80.8% 56.2% 10.3% 28.9% 3.5% 4.5%
Staff Registered Nurse (RN) 60.0% 49.5% 36.7% 41.0% 5.8% 7.0%
Licensed Practical Nurse (LPN) 68.0% 56.0% 22.5% 34.7% 3.6% 4.3%
Certified Nurse Assistant (CNA) 70.8% 49.0% 20.6% 42.6% 5.2% 5.1%
All retention, turnover and vacancy statistics were produced by AHCA using data from 2010 AHCA Nursing Facility Staffing Survey.
*May not add due to rounding.

REPORT OF FINDINGS 2010 NURSING FACILITY STAFFING SURVEY, APPEDIX B
DISTRICT OF COLUMBIA
Estimated Number and Percentage* of Nursing Facility Employees
by Job Category and Nursing Job Position, 2010
STATE UNITED STATES
All Nursing Facility Employees 4,274 100.0% 1,940,818 100.0%
Administrative and Management Staff 288 6.7% 88,310 4.6%
Nursing Staff 2,880 67.4% 1,272,869 65.6%
Therapy Staff 76 1.8% 81,763 4.2%
Food Services Staff 391 9.2% 222,547 11.5%
Housekeeping and Maintenance Staff 494 11.6% 188,484 9.7%
Social Services and Activities Staff 145 3.4% 86,846 4.5%
Nursing Staff 2,880 100.0% 1,272,869 100.0%
Director of Nursing (DON) 19 0.7% 15,470 1.2%
RN with Administrative Duties (ARN) 43 1.5% 36,417 2.9%
Staff Registered Nurse (RN) 129 4.5% 121,234 9.5%
Licensed Practical Nurse (LPN) 763 26.5% 255,409 20.1%
Certified Nurse Assistant (CNA) 1,678 58.3% 741,752 58.3%
Other Nursing Staff 238 8.3% 90,847 7.1%
Retention, Turnover, and Vacancy Rates of Nursing Facility Employees
by Job Category and Nursing Job Position, 2010
RETENTION RATE TURNOVER RATE VACANCY RATE
STATE U.S. STATE U.S. STATE U.S.
All Nursing Facility Employees 60.4% 55.1% 22.8% 35.1% 7.9% 4.2%
Administrative and Management Staff 70.9% 71.9% 13.2% 18.0% 0.0% 1.8%
Nursing Staff 61.5% 51.4% 23.5% 39.5% 9.7% 4.9%
Therapy Staff 29.4% 65.7% 6.3% 25.7% 23.8% 3.8%
Food Services Staff 66.1% 55.3% 11.7% 33.7% 1.0% 3.3%
Housekeeping and Maintenance Staff 50.5% 65.2% 32.1% 24.3% 2.8% 2.6%
Social Services and Activities Staff 55.8% 66.5% 36.8% 22.5% 10.2% 2.8%
Nursing Staff
Director of Nursing (DON) 62.5% 64.1% 33.3% 26.0% 0.0% 3.9%
RN with Administrative Duties (ARN) 71.0% 56.2% 14.8% 28.9% 18.2% 4.5%
Staff Registered Nurse (RN) 42.9% 49.5% 64.7% 41.0% 8.1% 7.0%
Licensed Practical Nurse (LPN) 68.7% 56.0% 22.0% 34.7% 6.6% 4.3%
Certified Nurse Assistant (CNA) 60.0% 49.0% 24.0% 42.6% 11.8% 5.1%
All retention, turnover and vacancy statistics were produced by AHCA using data from 2010 AHCA Nursing Facility Staffing Survey.
*May not add due to rounding.

REPORT OF FINDINGS 2010 NURSING FACILITY STAFFING SURVEY, APPEDIX B
DELAWARE
Estimated Number and Percentage* of Nursing Facility Employees
by Job Category and Nursing Job Position, 2010
STATE UNITED STATES
All Nursing Facility Employees 7,536 100.0% 1,940,818 100.0%
Administrative and Management Staff 372 4.9% 88,310 4.6%
Nursing Staff 5,043 66.9% 1,272,869 65.6%
Therapy Staff 326 4.3% 81,763 4.2%
Food Services Staff 872 11.6% 222,547 11.5%
Housekeeping and Maintenance Staff 618 8.2% 188,484 9.7%
Social Services and Activities Staff 306 4.1% 86,846 4.5%
Nursing Staff 5,043 100.0% 1,272,869 100.0%
Director of Nursing (DON) 47 0.9% 15,470 1.2%
RN with Administrative Duties (ARN) 129 2.6% 36,417 2.9%
Staff Registered Nurse (RN) 752 14.9% 121,234 9.5%
Licensed Practical Nurse (LPN) 919 18.2% 255,409 20.1%
Certified Nurse Assistant (CNA) 2,688 53.3% 741,752 58.3%
Other Nursing Staff 452 9.0% 90,847 7.1%
Retention, Turnover, and Vacancy Rates of Nursing Facility Employees
by Job Category and Nursing Job Position, 2010
RETENTION RATE TURNOVER RATE VACANCY RATE
STATE U.S. STATE U.S. STATE U.S.
All Nursing Facility Employees 57.2% 55.1% 37.2% 35.1% 6.1% 4.2%
Administrative and Management Staff 64.5% 71.9% 23.0% 18.0% 3.1% 1.8%
Nursing Staff 57.4% 51.4% 36.8% 39.5% 6.5% 4.9%
Therapy Staff 62.1% 65.7% 54.3% 25.7% 0.0% 3.8%
Food Services Staff 43.5% 55.3% 51.5% 33.7% 9.7% 3.3%
Housekeeping and Maintenance Staff 68.2% 65.2% 23.8% 24.3% 3.7% 2.6%
Social Services and Activities Staff 64.1% 66.5% 28.0% 22.5% 3.7% 2.8%
Nursing Staff
Director of Nursing (DON) 83.3% 64.1% 9.1% 26.0% 0.0% 3.9%
RN with Administrative Duties (ARN) 73.3% 56.2% 36.4% 28.9% 0.0% 4.5%
Staff Registered Nurse (RN) 56.1% 49.5% 43.8% 41.0% 10.8% 7.0%
Licensed Practical Nurse (LPN) 60.9% 56.0% 36.7% 34.7% 3.4% 4.3%
Certified Nurse Assistant (CNA) 53.8% 49.0% 39.1% 42.6% 10.2% 5.1%
All retention, turnover and vacancy statistics were produced by AHCA using data from 2010 AHCA Nursing Facility Staffing Survey.
*May not add due to rounding.

REPORT OF FINDINGS 2010 NURSING FACILITY STAFFING SURVEY, APPEDIX B
FLORIDA
Estimated Number and Percentage* of Nursing Facility Employees
by Job Category and Nursing Job Position, 2010
STATE UNITED STATES
All Nursing Facility Employees 112,930 100.0% 1,940,818 100.0%
Administrative and Management Staff 4,922 4.4% 88,310 4.6%
Nursing Staff 75,251 66.6% 1,272,869 65.6%
Therapy Staff 8,426 7.5% 81,763 4.2%
Food Services Staff 10,437 9.2% 222,547 11.5%
Housekeeping and Maintenance Staff 9,993 8.8% 188,484 9.7%
Social Services and Activities Staff 3,901 3.5% 86,846 4.5%
Nursing Staff 75,251 100.0% 1,272,869 100.0%
Director of Nursing (DON) 678 0.9% 15,470 1.2%
RN with Administrative Duties (ARN) 1,213 1.6% 36,417 2.9%
Staff Registered Nurse (RN) 5,293 7.0% 121,234 9.5%
Licensed Practical Nurse (LPN) 16,422 21.8% 255,409 20.1%
Certified Nurse Assistant (CNA) 47,127 62.6% 741,752 58.3%
Other Nursing Staff 3,884 5.2% 90,847 7.1%
Retention, Turnover, and Vacancy Rates of Nursing Facility Employees
by Job Category and Nursing Job Position, 2010
RETENTION RATE TURNOVER RATE VACANCY RATE
STATE U.S. STATE U.S. STATE U.S.
All Nursing Facility Employees 61.9% 55.1% 24.8% 35.1% 3.4% 4.2%
Administrative and Management Staff 70.0% 71.9% 15.9% 18.0% 1.2% 1.8%
Nursing Staff 59.1% 51.4% 28.0% 39.5% 3.6% 4.9%
Therapy Staff 69.0% 65.7% 15.0% 25.7% 6.3% 3.8%
Food Services Staff 65.0% 55.3% 21.3% 33.7% 2.3% 3.3%
Housekeeping and Maintenance Staff 68.9% 65.2% 21.1% 24.3% 2.0% 2.6%
Social Services and Activities Staff 70.0% 66.5% 13.9% 22.5% 1.6% 2.8%
Nursing Staff
Director of Nursing (DON) 52.5% 64.1% 35.0% 26.0% 2.3% 3.9%
RN with Administrative Duties (ARN) 63.6% 56.2% 25.9% 28.9% 2.9% 4.5%
Staff Registered Nurse (RN) 42.3% 49.5% 43.9% 41.0% 8.5% 7.0%
Licensed Practical Nurse (LPN) 57.3% 56.0% 30.8% 34.7% 3.1% 4.3%
Certified Nurse Assistant (CNA) 60.5% 49.0% 26.3% 42.6% 3.2% 5.1%
All retention, turnover and vacancy statistics were produced by AHCA using data from 2010 AHCA Nursing Facility Staffing Survey.
*May not add due to rounding.

REPORT OF FINDINGS 2010 NURSING FACILITY STAFFING SURVEY, APPEDIX B
GEORGIA
Estimated Number and Percentage* of Nursing Facility Employees
by Job Category and Nursing Job Position, 2010
STATE UNITED STATES
All Nursing Facility Employees 38,852 100.0% 1,940,818 100.0%
Administrative and Management Staff 1,663 4.3% 88,310 4.6%
Nursing Staff 26,240 67.5% 1,272,869 65.6%
Therapy Staff 999 2.6% 81,763 4.2%
Food Services Staff 4,224 10.9% 222,547 11.5%
Housekeeping and Maintenance Staff 4,369 11.2% 188,484 9.7%
Social Services and Activities Staff 1,357 3.5% 86,846 4.5%
Nursing Staff 26,240 100.0% 1,272,869 100.0%
Director of Nursing (DON) 347 1.3% 15,470 1.2%
RN with Administrative Duties (ARN) 521 2.0% 36,417 2.9%
Staff Registered Nurse (RN) 1,142 4.4% 121,234 9.5%
Licensed Practical Nurse (LPN) 7,546 28.8% 255,409 20.1%
Certified Nurse Assistant (CNA) 15,269 58.2% 741,752 58.3%
Other Nursing Staff 1,175 4.5% 90,847 7.1%
Retention, Turnover, and Vacancy Rates of Nursing Facility Employees
by Job Category and Nursing Job Position, 2010
RETENTION RATE TURNOVER RATE VACANCY RATE
STATE U.S. STATE U.S. STATE U.S.
All Nursing Facility Employees 55.2% 55.1% 36.5% 35.1% 4.3% 4.2%
Administrative and Management Staff 74.4% 71.9% 16.2% 18.0% 1.1% 1.8%
Nursing Staff 51.5% 51.4% 41.6% 39.5% 4.9% 4.9%
Therapy Staff 65.8% 65.7% 16.9% 25.7% 6.2% 3.8%
Food Services Staff 60.3% 55.3% 31.1% 33.7% 3.0% 3.3%
Housekeeping and Maintenance Staff 61.4% 65.2% 28.8% 24.3% 2.6% 2.6%
Social Services and Activities Staff 70.6% 66.5% 18.3% 22.5% 3.5% 2.8%
Nursing Staff
Director of Nursing (DON) 68.4% 64.1% 23.8% 26.0% 6.2% 3.9%
RN with Administrative Duties (ARN) 45.2% 56.2% 32.6% 28.9% 6.3% 4.5%
Staff Registered Nurse (RN) 45.4% 49.5% 51.4% 41.0% 6.6% 7.0%
Licensed Practical Nurse (LPN) 53.5% 56.0% 40.9% 34.7% 3.7% 4.3%
Certified Nurse Assistant (CNA) 49.7% 49.0% 43.4% 42.6% 4.6% 5.1%
All retention, turnover and vacancy statistics were produced by AHCA using data from 2010 AHCA Nursing Facility Staffing Survey.
*May not add due to rounding.

REPORT OF FINDINGS 2010 NURSING FACILITY STAFFING SURVEY, APPEDIX B
HAWAII
Estimated Number and Percentage* of Nursing Facility Employees
by Job Category and Nursing Job Position, 2010
STATE UNITED STATES
All Nursing Facility Employees 8,090 100.0% 1,940,818 100.0%
Administrative and Management Staff 435 5.4% 88,310 4.6%
Nursing Staff 5,330 65.9% 1,272,869 65.6%
Therapy Staff 170 2.1% 81,763 4.2%
Food Services Staff 861 10.6% 222,547 11.5%
Housekeeping and Maintenance Staff 853 10.5% 188,484 9.7%
Social Services and Activities Staff 441 5.4% 86,846 4.5%
Nursing Staff 5,330 100.0% 1,272,869 100.0%
Director of Nursing (DON) 47 0.9% 15,470 1.2%
RN with Administrative Duties (ARN) 183 3.4% 36,417 2.9%
Staff Registered Nurse (RN) 1,383 25.9% 121,234 9.5%
Licensed Practical Nurse (LPN) 383 7.2% 255,409 20.1%
Certified Nurse Assistant (CNA) 2,961 55.6% 741,752 58.3%
Other Nursing Staff 348 6.5% 90,847 7.1%
Retention, Turnover, and Vacancy Rates of Nursing Facility Employees
by Job Category and Nursing Job Position, 2010
RETENTION RATE TURNOVER RATE VACANCY RATE
STATE U.S. STATE U.S. STATE U.S.
All Nursing Facility Employees 74.6% 55.1% 14.4% 35.1% 3.3% 4.2%
Administrative and Management Staff 71.0% 71.9% 18.0% 18.0% 3.0% 1.8%
Nursing Staff 74.6% 51.4% 15.4% 39.5% 3.6% 4.9%
Therapy Staff 65.6% 65.7% 10.3% 25.7% 13.6% 3.8%
Food Services Staff 78.8% 55.3% 9.7% 33.7% 2.1% 3.3%
Housekeeping and Maintenance Staff 77.7% 65.2% 11.4% 24.3% 2.0% 2.6%
Social Services and Activities Staff 67.8% 66.5% 16.0% 22.5% 1.3% 2.8%
Nursing Staff
Director of Nursing (DON) 66.7% 64.1% 25.0% 26.0% 0.0% 3.9%
RN with Administrative Duties (ARN) 71.4% 56.2% 20.0% 28.9% 5.4% 4.5%
Staff Registered Nurse (RN) 74.3% 49.5% 15.6% 41.0% 4.5% 7.0%
Licensed Practical Nurse (LPN) 71.7% 56.0% 19.8% 34.7% 9.0% 4.3%
Certified Nurse Assistant (CNA) 73.8% 49.0% 15.8% 42.6% 2.0% 5.1%
All retention, turnover and vacancy statistics were produced by AHCA using data from 2010 AHCA Nursing Facility Staffing Survey.
*May not add due to rounding.

REPORT OF FINDINGS 2010 NURSING FACILITY STAFFING SURVEY, APPEDIX B
IOWA
Estimated Number and Percentage* of Nursing Facility Employees
by Job Category and Nursing Job Position, 2010
STATE UNITED STATES
All Nursing Facility Employees 36,801 100.0% 1,940,818 100.0%
Administrative and Management Staff 1,490 4.0% 88,310 4.6%
Nursing Staff 22,745 61.8% 1,272,869 65.6%
Therapy Staff 766 2.1% 81,763 4.2%
Food Services Staff 5,527 15.0% 222,547 11.5%
Housekeeping and Maintenance Staff 4,522 12.3% 188,484 9.7%
Social Services and Activities Staff 1,752 4.8% 86,846 4.5%
Nursing Staff 22,745 100.0% 1,272,869 100.0%
Director of Nursing (DON) 462 2.0% 15,470 1.2%
RN with Administrative Duties (ARN) 324 1.4% 36,417 2.9%
Staff Registered Nurse (RN) 2,665 11.7% 121,234 9.5%
Licensed Practical Nurse (LPN) 3,603 15.8% 255,409 20.1%
Certified Nurse Assistant (CNA) 14,306 62.9% 741,752 58.3%
Other Nursing Staff 1,196 5.3% 90,847 7.1%
Retention, Turnover, and Vacancy Rates of Nursing Facility Employees
by Job Category and Nursing Job Position, 2010
RETENTION RATE TURNOVER RATE VACANCY RATE
STATE U.S. STATE U.S. STATE U.S.
All Nursing Facility Employees 57.0% 55.1% 28.2% 35.1% 4.8% 4.2%
Administrative and Management Staff 76.0% 71.9% 9.4% 18.0% 1.0% 1.8%
Nursing Staff 53.7% 51.4% 29.5% 39.5% 5.7% 4.9%
Therapy Staff 61.2% 65.7% 84.7% 25.7% 3.2% 3.8%
Food Services Staff 53.1% 55.3% 32.2% 33.7% 4.3% 3.3%
Housekeeping and Maintenance Staff 68.2% 65.2% 18.7% 24.3% 2.8% 2.6%
Social Services and Activities Staff 71.9% 66.5% 14.2% 22.5% 2.2% 2.8%
Nursing Staff
Director of Nursing (DON) 68.1% 64.1% 21.1% 26.0% 1.1% 3.9%
RN with Administrative Duties (ARN) 73.6% 56.2% 4.3% 28.9% 4.6% 4.5%
Staff Registered Nurse (RN) 56.6% 49.5% 26.1% 41.0% 6.8% 7.0%
Licensed Practical Nurse (LPN) 58.2% 56.0% 24.4% 34.7% 4.0% 4.3%
Certified Nurse Assistant (CNA) 49.7% 49.0% 33.4% 42.6% 6.6% 5.1%
All retention, turnover and vacancy statistics were produced by AHCA using data from 2010 AHCA Nursing Facility Staffing Survey.
*May not add due to rounding.
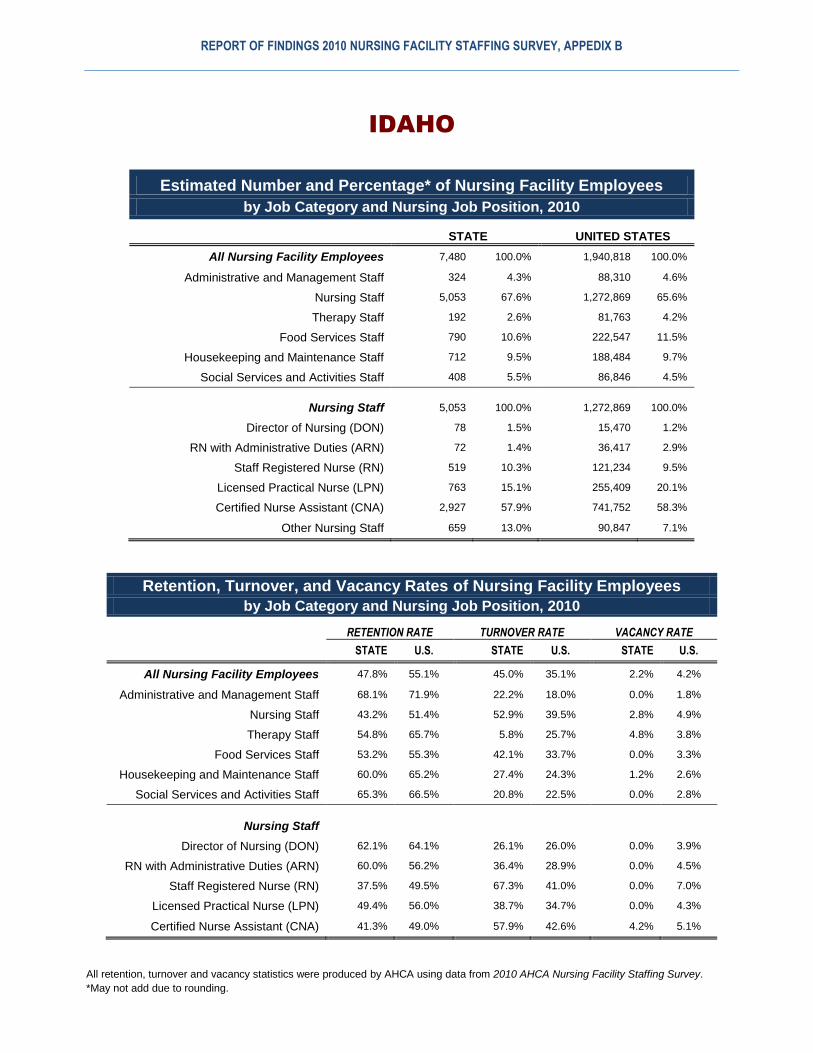
REPORT OF FINDINGS 2010 NURSING FACILITY STAFFING SURVEY, APPEDIX B
IDAHO
Estimated Number and Percentage* of Nursing Facility Employees
by Job Category and Nursing Job Position, 2010
STATE UNITED STATES
All Nursing Facility Employees 7,480 100.0% 1,940,818 100.0%
Administrative and Management Staff 324 4.3% 88,310 4.6%
Nursing Staff 5,053 67.6% 1,272,869 65.6%
Therapy Staff 192 2.6% 81,763 4.2%
Food Services Staff 790 10.6% 222,547 11.5%
Housekeeping and Maintenance Staff 712 9.5% 188,484 9.7%
Social Services and Activities Staff 408 5.5% 86,846 4.5%
Nursing Staff 5,053 100.0% 1,272,869 100.0%
Director of Nursing (DON) 78 1.5% 15,470 1.2%
RN with Administrative Duties (ARN) 72 1.4% 36,417 2.9%
Staff Registered Nurse (RN) 519 10.3% 121,234 9.5%
Licensed Practical Nurse (LPN) 763 15.1% 255,409 20.1%
Certified Nurse Assistant (CNA) 2,927 57.9% 741,752 58.3%
Other Nursing Staff 659 13.0% 90,847 7.1%
Retention, Turnover, and Vacancy Rates of Nursing Facility Employees
by Job Category and Nursing Job Position, 2010
RETENTION RATE TURNOVER RATE VACANCY RATE
STATE U.S. STATE U.S. STATE U.S.
All Nursing Facility Employees 47.8% 55.1% 45.0% 35.1% 2.2% 4.2%
Administrative and Management Staff 68.1% 71.9% 22.2% 18.0% 0.0% 1.8%
Nursing Staff 43.2% 51.4% 52.9% 39.5% 2.8% 4.9%
Therapy Staff 54.8% 65.7% 5.8% 25.7% 4.8% 3.8%
Food Services Staff 53.2% 55.3% 42.1% 33.7% 0.0% 3.3%
Housekeeping and Maintenance Staff 60.0% 65.2% 27.4% 24.3% 1.2% 2.6%
Social Services and Activities Staff 65.3% 66.5% 20.8% 22.5% 0.0% 2.8%
Nursing Staff
Director of Nursing (DON) 62.1% 64.1% 26.1% 26.0% 0.0% 3.9%
RN with Administrative Duties (ARN) 60.0% 56.2% 36.4% 28.9% 0.0% 4.5%
Staff Registered Nurse (RN) 37.5% 49.5% 67.3% 41.0% 0.0% 7.0%
Licensed Practical Nurse (LPN) 49.4% 56.0% 38.7% 34.7% 0.0% 4.3%
Certified Nurse Assistant (CNA) 41.3% 49.0% 57.9% 42.6% 4.2% 5.1%
All retention, turnover and vacancy statistics were produced by AHCA using data from 2010 AHCA Nursing Facility Staffing Survey.
*May not add due to rounding.

REPORT OF FINDINGS 2010 NURSING FACILITY STAFFING SURVEY, APPEDIX B
ILLINOIS
Estimated Number and Percentage* of Nursing Facility Employees
by Job Category and Nursing Job Position, 2010
STATE UNITED STATES
All Nursing Facility Employees 98,242 100.0% 1,940,818 100.0%
Administrative and Management Staff 4,323 4.4% 88,310 4.6%
Nursing Staff 60,164 61.2% 1,272,869 65.6%
Therapy Staff 5,240 5.3% 81,763 4.2%
Food Services Staff 11,812 12.0% 222,547 11.5%
Housekeeping and Maintenance Staff 10,948 11.1% 188,484 9.7%
Social Services and Activities Staff 5,754 5.9% 86,846 4.5%
Nursing Staff 60,164 100.0% 1,272,869 100.0%
Director of Nursing (DON) 785 1.3% 15,470 1.2%
RN with Administrative Duties (ARN) 832 1.4% 36,417 2.9%
Staff Registered Nurse (RN) 8,778 14.6% 121,234 9.5%
Licensed Practical Nurse (LPN) 9,638 16.0% 255,409 20.1%
Certified Nurse Assistant (CNA) 35,825 59.5% 741,752 58.3%
Other Nursing Staff 3,674 6.1% 90,847 7.1%
Retention, Turnover, and Vacancy Rates of Nursing Facility Employees
by Job Category and Nursing Job Position, 2010
RETENTION RATE TURNOVER RATE VACANCY RATE
STATE U.S. STATE U.S. STATE U.S.
All Nursing Facility Employees 57.2% 55.1% 33.3% 35.1% 5.0% 4.2%
Administrative and Management Staff 70.3% 71.9% 16.9% 18.0% 1.9% 1.8%
Nursing Staff 52.2% 51.4% 38.0% 39.5% 6.2% 4.9%
Therapy Staff 69.2% 65.7% 41.1% 25.7% 3.7% 3.8%
Food Services Staff 62.0% 55.3% 26.2% 33.7% 2.9% 3.3%
Housekeeping and Maintenance Staff 67.3% 65.2% 25.0% 24.3% 2.4% 2.6%
Social Services and Activities Staff 65.1% 66.5% 20.8% 22.5% 4.5% 2.8%
Nursing Staff
Director of Nursing (DON) 57.7% 64.1% 34.0% 26.0% 3.4% 3.9%
RN with Administrative Duties (ARN) 87.0% 56.2% 7.5% 28.9% 5.6% 4.5%
Staff Registered Nurse (RN) 55.3% 49.5% 35.8% 41.0% 6.9% 7.0%
Licensed Practical Nurse (LPN) 54.5% 56.0% 32.2% 34.7% 6.9% 4.3%
Certified Nurse Assistant (CNA) 48.2% 49.0% 42.8% 42.6% 6.0% 5.1%
All retention, turnover and vacancy statistics were produced by AHCA using data from 2010 AHCA Nursing Facility Staffing Survey.
*May not add due to rounding.

REPORT OF FINDINGS 2010 NURSING FACILITY STAFFING SURVEY, APPEDIX B
INDIANA
Estimated Number and Percentage* of Nursing Facility Employees
by Job Category and Nursing Job Position, 2010
STATE UNITED STATES
All Nursing Facility Employees 51,970 100.0% 1,940,818 100.0%
Administrative and Management Staff 2,376 4.6% 88,310 4.6%
Nursing Staff 34,705 66.8% 1,272,869 65.6%
Therapy Staff 2,455 4.7% 81,763 4.2%
Food Services Staff 5,173 10.0% 222,547 11.5%
Housekeeping and Maintenance Staff 4,639 8.9% 188,484 9.7%
Social Services and Activities Staff 2,621 5.0% 86,846 4.5%
Nursing Staff 34,705 100.0% 1,272,869 100.0%
Director of Nursing (DON) 497 1.4% 15,470 1.2%
RN with Administrative Duties (ARN) 1,228 3.5% 36,417 2.9%
Staff Registered Nurse (RN) 2,445 7.0% 121,234 9.5%
Licensed Practical Nurse (LPN) 8,388 24.2% 255,409 20.1%
Certified Nurse Assistant (CNA) 19,583 56.4% 741,752 58.3%
Other Nursing Staff 2,165 6.2% 90,847 7.1%
Retention, Turnover, and Vacancy Rates of Nursing Facility Employees
by Job Category and Nursing Job Position, 2010
RETENTION RATE TURNOVER RATE VACANCY RATE
STATE U.S. STATE U.S. STATE U.S.
All Nursing Facility Employees 48.6% 55.1% 40.8% 35.1% 3.4% 4.2%
Administrative and Management Staff 64.9% 71.9% 23.1% 18.0% 1.0% 1.8%
Nursing Staff 44.6% 51.4% 46.4% 39.5% 3.8% 4.9%
Therapy Staff 74.6% 65.7% 9.2% 25.7% 1.1% 3.8%
Food Services Staff 49.0% 55.3% 41.2% 33.7% 4.1% 3.3%
Housekeeping and Maintenance Staff 54.9% 65.2% 32.8% 24.3% 2.6% 2.6%
Social Services and Activities Staff 61.1% 66.5% 24.6% 22.5% 2.0% 2.8%
Nursing Staff
Director of Nursing (DON) 62.0% 64.1% 27.4% 26.0% 0.0% 3.9%
RN with Administrative Duties (ARN) 45.2% 56.2% 41.3% 28.9% 5.8% 4.5%
Staff Registered Nurse (RN) 45.8% 49.5% 46.1% 41.0% 7.5% 7.0%
Licensed Practical Nurse (LPN) 53.8% 56.0% 35.6% 34.7% 4.0% 4.3%
Certified Nurse Assistant (CNA) 38.8% 49.0% 54.9% 42.6% 3.7% 5.1%
All retention, turnover and vacancy statistics were produced by AHCA using data from 2010 AHCA Nursing Facility Staffing Survey.
*May not add due to rounding.

REPORT OF FINDINGS 2010 NURSING FACILITY STAFFING SURVEY, APPEDIX B
KANSAS
Estimated Number and Percentage* of Nursing Facility Employees
by Job Category and Nursing Job Position, 2010
STATE UNITED STATES
All Nursing Facility Employees 26,829 100.0% 1,940,818 100.0%
Administrative and Management Staff 1,357 5.1% 88,310 4.6%
Nursing Staff 16,759 62.5% 1,272,869 65.6%
Therapy Staff 1,398 5.2% 81,763 4.2%
Food Services Staff 3,664 13.7% 222,547 11.5%
Housekeeping and Maintenance Staff 2,407 9.0% 188,484 9.7%
Social Services and Activities Staff 1,244 4.6% 86,846 4.5%
Nursing Staff 16,759 100.0% 1,272,869 100.0%
Director of Nursing (DON) 329 2.0% 15,470 1.2%
RN with Administrative Duties (ARN) 600 3.6% 36,417 2.9%
Staff Registered Nurse (RN) 1,391 8.3% 121,234 9.5%
Licensed Practical Nurse (LPN) 2,678 16.0% 255,409 20.1%
Certified Nurse Assistant (CNA) 10,213 60.9% 741,752 58.3%
Other Nursing Staff 1,347 8.0% 90,847 7.1%
Retention, Turnover, and Vacancy Rates of Nursing Facility Employees
by Job Category and Nursing Job Position, 2010
RETENTION RATE TURNOVER RATE VACANCY RATE
STATE U.S. STATE U.S. STATE U.S.
All Nursing Facility Employees 41.4% 55.1% 53.2% 35.1% 4.4% 4.2%
Administrative and Management Staff 68.1% 71.9% 18.5% 18.0% 1.4% 1.8%
Nursing Staff 35.8% 51.4% 61.0% 39.5% 5.0% 4.9%
Therapy Staff 70.2% 65.7% 13.6% 25.7% 0.5% 3.8%
Food Services Staff 41.4% 55.3% 60.1% 33.7% 4.0% 3.3%
Housekeeping and Maintenance Staff 50.6% 65.2% 43.6% 24.3% 4.8% 2.6%
Social Services and Activities Staff 61.7% 66.5% 28.6% 22.5% 4.3% 2.8%
Nursing Staff
Director of Nursing (DON) 45.1% 64.1% 50.0% 26.0% 1.8% 3.9%
RN with Administrative Duties (ARN) 30.4% 56.2% 66.1% 28.9% 7.6% 4.5%
Staff Registered Nurse (RN) 42.5% 49.5% 43.6% 41.0% 6.9% 7.0%
Licensed Practical Nurse (LPN) 42.1% 56.0% 48.1% 34.7% 4.2% 4.3%
Certified Nurse Assistant (CNA) 32.1% 49.0% 68.5% 42.6% 5.6% 5.1%
All retention, turnover and vacancy statistics were produced by AHCA using data from 2010 AHCA Nursing Facility Staffing Survey.
*May not add due to rounding.

REPORT OF FINDINGS 2010 NURSING FACILITY STAFFING SURVEY, APPEDIX B
KENTUCKY
Estimated Number and Percentage* of Nursing Facility Employees
by Job Category and Nursing Job Position, 2010
STATE UNITED STATES
All Nursing Facility Employees 32,235 100.0% 1,940,818 100.0%
Administrative and Management Staff 1,342 4.2% 88,310 4.6%
Nursing Staff 21,813 67.7% 1,272,869 65.6%
Therapy Staff 1,243 3.9% 81,763 4.2%
Food Services Staff 3,546 11.0% 222,547 11.5%
Housekeeping and Maintenance Staff 3,059 9.5% 188,484 9.7%
Social Services and Activities Staff 1,232 3.8% 86,846 4.5%
Nursing Staff 21,813 100.0% 1,272,869 100.0%
Director of Nursing (DON) 289 1.3% 15,470 1.2%
RN with Administrative Duties (ARN) 846 3.9% 36,417 2.9%
Staff Registered Nurse (RN) 1,510 6.9% 121,234 9.5%
Licensed Practical Nurse (LPN) 4,486 20.6% 255,409 20.1%
Certified Nurse Assistant (CNA) 12,786 58.6% 741,752 58.3%
Other Nursing Staff 1,645 7.5% 90,847 7.1%
Retention, Turnover, and Vacancy Rates of Nursing Facility Employees
by Job Category and Nursing Job Position, 2010
RETENTION RATE TURNOVER RATE VACANCY RATE
STATE U.S. STATE U.S. STATE U.S.
All Nursing Facility Employees 46.7% 55.1% 47.5% 35.1% 5.2% 4.2%
Administrative and Management Staff 67.9% 71.9% 24.6% 18.0% 1.9% 1.8%
Nursing Staff 42.2% 51.4% 54.6% 39.5% 5.7% 4.9%
Therapy Staff 62.5% 65.7% 20.0% 25.7% 8.1% 3.8%
Food Services Staff 50.0% 55.3% 47.1% 33.7% 3.1% 3.3%
Housekeeping and Maintenance Staff 59.9% 65.2% 28.1% 24.3% 4.7% 2.6%
Social Services and Activities Staff 64.5% 66.5% 23.6% 22.5% 2.1% 2.8%
Nursing Staff
Director of Nursing (DON) 62.6% 64.1% 29.7% 26.0% 1.7% 3.9%
RN with Administrative Duties (ARN) 51.9% 56.2% 28.2% 28.9% 4.8% 4.5%
Staff Registered Nurse (RN) 37.8% 49.5% 70.2% 41.0% 12.5% 7.0%
Licensed Practical Nurse (LPN) 48.1% 56.0% 49.5% 34.7% 5.6% 4.3%
Certified Nurse Assistant (CNA) 39.2% 49.0% 58.6% 42.6% 5.6% 5.1%
All retention, turnover and vacancy statistics were produced by AHCA using data from 2010 AHCA Nursing Facility Staffing Survey.
*May not add due to rounding.

REPORT OF FINDINGS 2010 NURSING FACILITY STAFFING SURVEY, APPEDIX B
LOUISIANA
Estimated Number and Percentage* of Nursing Facility Employees
by Job Category and Nursing Job Position, 2010
STATE UNITED STATES
All Nursing Facility Employees 30,916 100.0% 1,940,818 100.0%
Administrative and Management Staff 1,400 4.5% 88,310 4.6%
Nursing Staff 20,395 66.0% 1,272,869 65.6%
Therapy Staff 1,227 4.0% 81,763 4.2%
Food Services Staff 2,958 9.6% 222,547 11.5%
Housekeeping and Maintenance Staff 3,876 12.5% 188,484 9.7%
Social Services and Activities Staff 1,060 3.4% 86,846 4.5%
Nursing Staff 20,395 100.0% 1,272,869 100.0%
Director of Nursing (DON) 286 1.4% 15,470 1.2%
RN with Administrative Duties (ARN) 237 1.2% 36,417 2.9%
Staff Registered Nurse (RN) 786 3.9% 121,234 9.5%
Licensed Practical Nurse (LPN) 5,482 26.9% 255,409 20.1%
Certified Nurse Assistant (CNA) 11,907 58.4% 741,752 58.3%
Other Nursing Staff 1,354 6.6% 90,847 7.1%
Retention, Turnover, and Vacancy Rates of Nursing Facility Employees
by Job Category and Nursing Job Position, 2010
RETENTION RATE TURNOVER RATE VACANCY RATE
STATE U.S. STATE U.S. STATE U.S.
All Nursing Facility Employees 50.5% 55.1% 38.2% 35.1% 5.8% 4.2%
Administrative and Management Staff 73.9% 71.9% 14.1% 18.0% 2.0% 1.8%
Nursing Staff 46.4% 51.4% 43.0% 39.5% 6.3% 4.9%
Therapy Staff 72.8% 65.7% 5.8% 25.7% 5.3% 3.8%
Food Services Staff 51.5% 55.3% 40.7% 33.7% 6.1% 3.3%
Housekeeping and Maintenance Staff 54.8% 65.2% 36.2% 24.3% 5.4% 2.6%
Social Services and Activities Staff 72.1% 66.5% 16.2% 22.5% 1.4% 2.8%
Nursing Staff
Director of Nursing (DON) 58.4% 64.1% 37.5% 26.0% 0.0% 3.9%
RN with Administrative Duties (ARN) 60.0% 56.2% 25.0% 28.9% 0.0% 4.5%
Staff Registered Nurse (RN) 40.8% 49.5% 30.7% 41.0% 13.3% 7.0%
Licensed Practical Nurse (LPN) 50.0% 56.0% 32.1% 34.7% 4.0% 4.3%
Certified Nurse Assistant (CNA) 42.4% 49.0% 52.5% 42.6% 6.6% 5.1%
All retention, turnover and vacancy statistics were produced by AHCA using data from 2010 AHCA Nursing Facility Staffing Survey.
*May not add due to rounding.
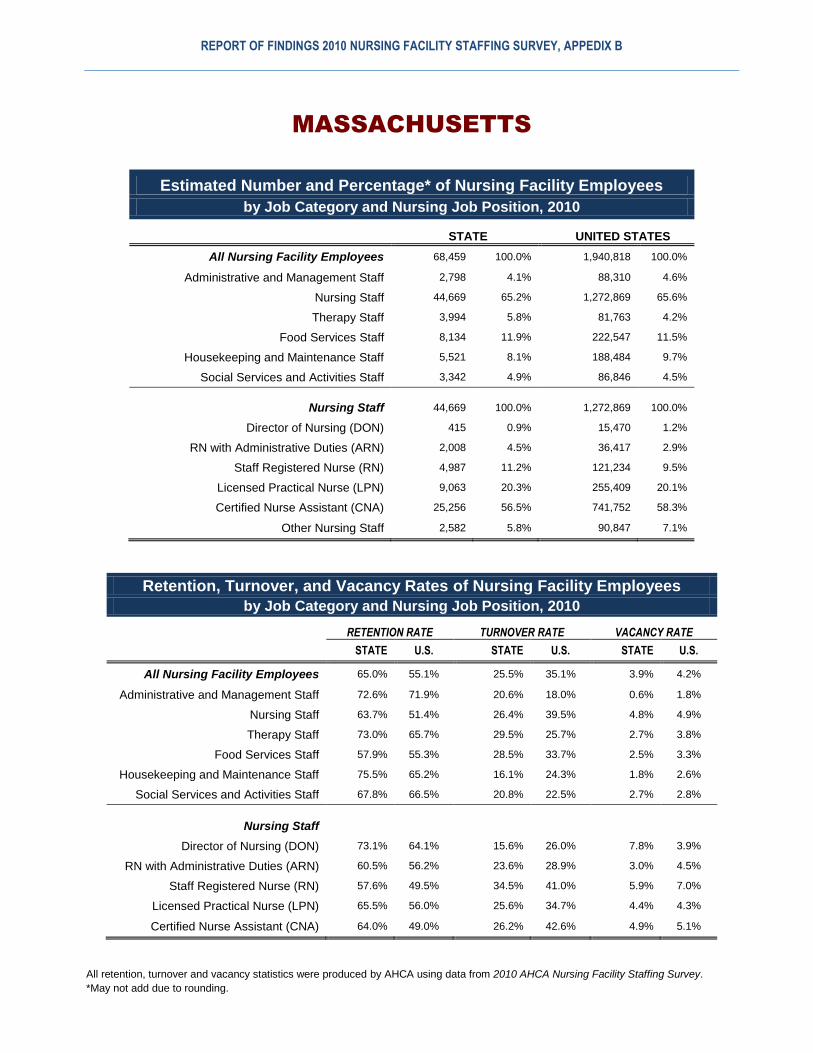
REPORT OF FINDINGS 2010 NURSING FACILITY STAFFING SURVEY, APPEDIX B
MASSACHUSETTS
Estimated Number and Percentage* of Nursing Facility Employees
by Job Category and Nursing Job Position, 2010
STATE UNITED STATES
All Nursing Facility Employees 68,459 100.0% 1,940,818 100.0%
Administrative and Management Staff 2,798 4.1% 88,310 4.6%
Nursing Staff 44,669 65.2% 1,272,869 65.6%
Therapy Staff 3,994 5.8% 81,763 4.2%
Food Services Staff 8,134 11.9% 222,547 11.5%
Housekeeping and Maintenance Staff 5,521 8.1% 188,484 9.7%
Social Services and Activities Staff 3,342 4.9% 86,846 4.5%
Nursing Staff 44,669 100.0% 1,272,869 100.0%
Director of Nursing (DON) 415 0.9% 15,470 1.2%
RN with Administrative Duties (ARN) 2,008 4.5% 36,417 2.9%
Staff Registered Nurse (RN) 4,987 11.2% 121,234 9.5%
Licensed Practical Nurse (LPN) 9,063 20.3% 255,409 20.1%
Certified Nurse Assistant (CNA) 25,256 56.5% 741,752 58.3%
Other Nursing Staff 2,582 5.8% 90,847 7.1%
Retention, Turnover, and Vacancy Rates of Nursing Facility Employees
by Job Category and Nursing Job Position, 2010
RETENTION RATE TURNOVER RATE VACANCY RATE
STATE U.S. STATE U.S. STATE U.S.
All Nursing Facility Employees 65.0% 55.1% 25.5% 35.1% 3.9% 4.2%
Administrative and Management Staff 72.6% 71.9% 20.6% 18.0% 0.6% 1.8%
Nursing Staff 63.7% 51.4% 26.4% 39.5% 4.8% 4.9%
Therapy Staff 73.0% 65.7% 29.5% 25.7% 2.7% 3.8%
Food Services Staff 57.9% 55.3% 28.5% 33.7% 2.5% 3.3%
Housekeeping and Maintenance Staff 75.5% 65.2% 16.1% 24.3% 1.8% 2.6%
Social Services and Activities Staff 67.8% 66.5% 20.8% 22.5% 2.7% 2.8%
Nursing Staff
Director of Nursing (DON) 73.1% 64.1% 15.6% 26.0% 7.8% 3.9%
RN with Administrative Duties (ARN) 60.5% 56.2% 23.6% 28.9% 3.0% 4.5%
Staff Registered Nurse (RN) 57.6% 49.5% 34.5% 41.0% 5.9% 7.0%
Licensed Practical Nurse (LPN) 65.5% 56.0% 25.6% 34.7% 4.4% 4.3%
Certified Nurse Assistant (CNA) 64.0% 49.0% 26.2% 42.6% 4.9% 5.1%
All retention, turnover and vacancy statistics were produced by AHCA using data from 2010 AHCA Nursing Facility Staffing Survey.
*May not add due to rounding.

REPORT OF FINDINGS 2010 NURSING FACILITY STAFFING SURVEY, APPEDIX B
MARYLAND
Estimated Number and Percentage* of Nursing Facility Employees
by Job Category and Nursing Job Position, 2010
STATE UNITED STATES
All Nursing Facility Employees 35,074 100.0% 1,940,818 100.0%
Administrative and Management Staff 1,864 5.3% 88,310 4.6%
Nursing Staff 22,766 64.9% 1,272,869 65.6%
Therapy Staff 1,399 4.0% 81,763 4.2%
Food Services Staff 3,937 11.2% 222,547 11.5%
Housekeeping and Maintenance Staff 3,603 10.3% 188,484 9.7%
Social Services and Activities Staff 1,506 4.3% 86,846 4.5%
Nursing Staff 22,766 100.0% 1,272,869 100.0%
Director of Nursing (DON) 237 1.0% 15,470 1.2%
RN with Administrative Duties (ARN) 649 2.9% 36,417 2.9%
Staff Registered Nurse (RN) 2,788 12.2% 121,234 9.5%
Licensed Practical Nurse (LPN) 4,696 20.6% 255,409 20.1%
Certified Nurse Assistant (CNA) 12,316 54.1% 741,752 58.3%
Other Nursing Staff 1,859 8.2% 90,847 7.1%
Retention, Turnover, and Vacancy Rates of Nursing Facility Employees
by Job Category and Nursing Job Position, 2010
RETENTION RATE TURNOVER RATE VACANCY RATE
STATE U.S. STATE U.S. STATE U.S.
All Nursing Facility Employees 54.4% 55.1% 36.5% 35.1% 3.8% 4.2%
Administrative and Management Staff 65.2% 71.9% 22.8% 18.0% 0.9% 1.8%
Nursing Staff 52.2% 51.4% 38.1% 39.5% 4.1% 4.9%
Therapy Staff 52.9% 65.7% 64.8% 25.7% 1.6% 3.8%
Food Services Staff 52.4% 55.3% 39.5% 33.7% 2.6% 3.3%
Housekeeping and Maintenance Staff 65.3% 65.2% 23.1% 24.3% 5.1% 2.6%
Social Services and Activities Staff 61.0% 66.5% 28.7% 22.5% 4.7% 2.8%
Nursing Staff
Director of Nursing (DON) 58.1% 64.1% 32.3% 26.0% 0.0% 3.9%
RN with Administrative Duties (ARN) 44.9% 56.2% 22.9% 28.9% 1.1% 4.5%
Staff Registered Nurse (RN) 44.6% 49.5% 51.9% 41.0% 5.3% 7.0%
Licensed Practical Nurse (LPN) 57.6% 56.0% 34.1% 34.7% 3.0% 4.3%
Certified Nurse Assistant (CNA) 51.0% 49.0% 39.8% 42.6% 4.9% 5.1%
All retention, turnover and vacancy statistics were produced by AHCA using data from 2010 AHCA Nursing Facility Staffing Survey.
*May not add due to rounding.

REPORT OF FINDINGS 2010 NURSING FACILITY STAFFING SURVEY, APPEDIX B
MAINE
Estimated Number and Percentage* of Nursing Facility Employees
by Job Category and Nursing Job Position, 2010
STATE UNITED STATES
All Nursing Facility Employees 13,982 100.0% 1,940,818 100.0%
Administrative and Management Staff 544 3.9% 88,310 4.6%
Nursing Staff 8,858 63.4% 1,272,869 65.6%
Therapy Staff 823 5.9% 81,763 4.2%
Food Services Staff 1,669 11.9% 222,547 11.5%
Housekeeping and Maintenance Staff 1,499 10.7% 188,484 9.7%
Social Services and Activities Staff 588 4.2% 86,846 4.5%
Nursing Staff 8,858 100.0% 1,272,869 100.0%
Director of Nursing (DON) 109 1.2% 15,470 1.2%
RN with Administrative Duties (ARN) 268 3.0% 36,417 2.9%
Staff Registered Nurse (RN) 1,302 14.7% 121,234 9.5%
Licensed Practical Nurse (LPN) 677 7.6% 255,409 20.1%
Certified Nurse Assistant (CNA) 5,246 59.2% 741,752 58.3%
Other Nursing Staff 1,177 13.3% 90,847 7.1%
Retention, Turnover, and Vacancy Rates of Nursing Facility Employees
by Job Category and Nursing Job Position, 2010
RETENTION RATE TURNOVER RATE VACANCY RATE
STATE U.S. STATE U.S. STATE U.S.
All Nursing Facility Employees 59.3% 55.1% 30.7% 35.1% 5.9% 4.2%
Administrative and Management Staff 72.0% 71.9% 13.2% 18.0% 1.2% 1.8%
Nursing Staff 55.8% 51.4% 34.9% 39.5% 7.3% 4.9%
Therapy Staff 69.2% 65.7% 48.8% 25.7% 3.4% 3.8%
Food Services Staff 59.4% 55.3% 22.3% 33.7% 5.8% 3.3%
Housekeeping and Maintenance Staff 68.3% 65.2% 17.3% 24.3% 0.9% 2.6%
Social Services and Activities Staff 69.5% 66.5% 16.2% 22.5% 3.2% 2.8%
Nursing Staff
Director of Nursing (DON) 69.6% 64.1% 15.0% 26.0% 9.1% 3.9%
RN with Administrative Duties (ARN) 75.3% 56.2% 14.1% 28.9% 7.1% 4.5%
Staff Registered Nurse (RN) 52.3% 49.5% 40.8% 41.0% 10.5% 7.0%
Licensed Practical Nurse (LPN) 59.4% 56.0% 30.5% 34.7% 9.3% 4.3%
Certified Nurse Assistant (CNA) 55.1% 49.0% 36.5% 42.6% 6.1% 5.1%
All retention, turnover and vacancy statistics were produced by AHCA using data from 2010 AHCA Nursing Facility Staffing Survey.
*May not add due to rounding.

REPORT OF FINDINGS 2010 NURSING FACILITY STAFFING SURVEY, APPEDIX B
MICHIGAN
Estimated Number and Percentage* of Nursing Facility Employees
by Job Category and Nursing Job Position, 2010
STATE UNITED STATES
All Nursing Facility Employees 57,270 100.0% 1,940,818 100.0%
Administrative and Management Staff 2,169 3.8% 88,310 4.6%
Nursing Staff 37,842 66.1% 1,272,869 65.6%
Therapy Staff 1,646 2.9% 81,763 4.2%
Food Services Staff 6,422 11.2% 222,547 11.5%
Housekeeping and Maintenance Staff 6,293 11.0% 188,484 9.7%
Social Services and Activities Staff 2,898 5.1% 86,846 4.5%
Nursing Staff 37,842 100.0% 1,272,869 100.0%
Director of Nursing (DON) 422 1.1% 15,470 1.2%
RN with Administrative Duties (ARN) 999 2.6% 36,417 2.9%
Staff Registered Nurse (RN) 3,781 10.0% 121,234 9.5%
Licensed Practical Nurse (LPN) 6,846 18.1% 255,409 20.1%
Certified Nurse Assistant (CNA) 23,043 60.9% 741,752 58.3%
Other Nursing Staff 2,396 6.3% 90,847 7.1%
Retention, Turnover, and Vacancy Rates of Nursing Facility Employees
by Job Category and Nursing Job Position, 2010
RETENTION RATE TURNOVER RATE VACANCY RATE
STATE U.S. STATE U.S. STATE U.S.
All Nursing Facility Employees 58.7% 55.1% 30.9% 35.1% 4.8% 4.2%
Administrative and Management Staff 78.8% 71.9% 12.0% 18.0% 1.1% 1.8%
Nursing Staff 53.5% 51.4% 36.8% 39.5% 5.6% 4.9%
Therapy Staff 71.7% 65.7% 4.3% 25.7% 7.0% 3.8%
Food Services Staff 64.6% 55.3% 26.4% 33.7% 3.8% 3.3%
Housekeeping and Maintenance Staff 74.4% 65.2% 18.6% 24.3% 2.8% 2.6%
Social Services and Activities Staff 68.9% 66.5% 20.2% 22.5% 1.7% 2.8%
Nursing Staff
Director of Nursing (DON) 68.6% 64.1% 20.4% 26.0% 1.8% 3.9%
RN with Administrative Duties (ARN) 64.1% 56.2% 28.0% 28.9% 6.1% 4.5%
Staff Registered Nurse (RN) 48.1% 49.5% 46.6% 41.0% 9.3% 7.0%
Licensed Practical Nurse (LPN) 55.0% 56.0% 32.6% 34.7% 5.4% 4.3%
Certified Nurse Assistant (CNA) 52.2% 49.0% 38.3% 42.6% 5.5% 5.1%
All retention, turnover and vacancy statistics were produced by AHCA using data from 2010 AHCA Nursing Facility Staffing Survey.
*May not add due to rounding.

REPORT OF FINDINGS 2010 NURSING FACILITY STAFFING SURVEY, APPEDIX B
MINNESOTA
Estimated Number and Percentage* of Nursing Facility Employees
by Job Category and Nursing Job Position, 2010
STATE UNITED STATES
All Nursing Facility Employees 46,212 100.0% 1,940,818 100.0%
Administrative and Management Staff 2,181 4.7% 88,310 4.6%
Nursing Staff 30,588 66.2% 1,272,869 65.6%
Therapy Staff 1,034 2.2% 81,763 4.2%
Food Services Staff 6,138 13.3% 222,547 11.5%
Housekeeping and Maintenance Staff 3,605 7.8% 188,484 9.7%
Social Services and Activities Staff 2,666 5.8% 86,846 4.5%
Nursing Staff 30,588 100.0% 1,272,869 100.0%
Director of Nursing (DON) 381 1.2% 15,470 1.2%
RN with Administrative Duties (ARN) 1,350 4.4% 36,417 2.9%
Staff Registered Nurse (RN) 3,208 10.5% 121,234 9.5%
Licensed Practical Nurse (LPN) 5,612 18.3% 255,409 20.1%
Certified Nurse Assistant (CNA) 18,087 59.1% 741,752 58.3%
Other Nursing Staff 1,667 5.5% 90,847 7.1%
Retention, Turnover, and Vacancy Rates of Nursing Facility Employees
by Job Category and Nursing Job Position, 2010
RETENTION RATE TURNOVER RATE VACANCY RATE
STATE U.S. STATE U.S. STATE U.S.
All Nursing Facility Employees 56.7% 55.1% 31.9% 35.1% 3.7% 4.2%
Administrative and Management Staff 78.5% 71.9% 12.3% 18.0% 2.2% 1.8%
Nursing Staff 53.1% 51.4% 36.9% 39.5% 4.3% 4.9%
Therapy Staff 81.2% 65.7% 14.1% 25.7% 2.0% 3.8%
Food Services Staff 53.7% 55.3% 31.2% 33.7% 2.3% 3.3%
Housekeeping and Maintenance Staff 71.1% 65.2% 14.4% 24.3% 1.5% 2.6%
Social Services and Activities Staff 66.1% 66.5% 21.8% 22.5% 3.7% 2.8%
Nursing Staff
Director of Nursing (DON) 62.9% 64.1% 28.9% 26.0% 9.1% 3.9%
RN with Administrative Duties (ARN) 54.9% 56.2% 28.2% 28.9% 2.5% 4.5%
Staff Registered Nurse (RN) 51.0% 49.5% 40.7% 41.0% 6.4% 7.0%
Licensed Practical Nurse (LPN) 56.8% 56.0% 36.7% 34.7% 5.5% 4.3%
Certified Nurse Assistant (CNA) 50.3% 49.0% 39.0% 42.6% 4.3% 5.1%
All retention, turnover and vacancy statistics were produced by AHCA using data from 2010 AHCA Nursing Facility Staffing Survey.
*May not add due to rounding.

REPORT OF FINDINGS 2010 NURSING FACILITY STAFFING SURVEY, APPEDIX B
MISSOURI
Estimated Number and Percentage* of Nursing Facility Employees
by Job Category and Nursing Job Position, 2010
STATE UNITED STATES
All Nursing Facility Employees 47,909 100.0% 1,940,818 100.0%
Administrative and Management Staff 1,999 4.2% 88,310 4.6%
Nursing Staff 31,238 65.2% 1,272,869 65.6%
Therapy Staff 1,768 3.7% 81,763 4.2%
Food Services Staff 5,886 12.3% 222,547 11.5%
Housekeeping and Maintenance Staff 5,022 10.5% 188,484 9.7%
Social Services and Activities Staff 1,996 4.2% 86,846 4.5%
Nursing Staff 31,238 100.0% 1,272,869 100.0%
Director of Nursing (DON) 495 1.6% 15,470 1.2%
RN with Administrative Duties (ARN) 679 2.2% 36,417 2.9%
Staff Registered Nurse (RN) 1,539 4.9% 121,234 9.5%
Licensed Practical Nurse (LPN) 6,308 20.2% 255,409 20.1%
Certified Nurse Assistant (CNA) 17,442 55.8% 741,752 58.3%
Other Nursing Staff 4,460 14.3% 90,847 7.1%
Retention, Turnover, and Vacancy Rates of Nursing Facility Employees
by Job Category and Nursing Job Position, 2010
RETENTION RATE TURNOVER RATE VACANCY RATE
STATE U.S. STATE U.S. STATE U.S.
All Nursing Facility Employees 40.5% 55.1% 56.8% 35.1% 3.4% 4.2%
Administrative and Management Staff 74.1% 71.9% 15.2% 18.0% 0.7% 1.8%
Nursing Staff 34.6% 51.4% 67.2% 39.5% 4.2% 4.9%
Therapy Staff 63.1% 65.7% 41.6% 25.7% 1.1% 3.8%
Food Services Staff 43.8% 55.3% 45.8% 33.7% 2.6% 3.3%
Housekeeping and Maintenance Staff 54.6% 65.2% 34.7% 24.3% 1.6% 2.6%
Social Services and Activities Staff 58.2% 66.5% 35.9% 22.5% 2.7% 2.8%
Nursing Staff
Director of Nursing (DON) 73.4% 64.1% 16.0% 26.0% 1.5% 3.9%
RN with Administrative Duties (ARN) 47.7% 56.2% 34.7% 28.9% 4.4% 4.5%
Staff Registered Nurse (RN) 37.5% 49.5% 64.3% 41.0% 5.8% 7.0%
Licensed Practical Nurse (LPN) 43.0% 56.0% 50.4% 34.7% 4.0% 4.3%
Certified Nurse Assistant (CNA) 30.0% 49.0% 78.7% 42.6% 4.8% 5.1%
All retention, turnover and vacancy statistics were produced by AHCA using data from 2010 AHCA Nursing Facility Staffing Survey.
*May not add due to rounding.

REPORT OF FINDINGS 2010 NURSING FACILITY STAFFING SURVEY, APPEDIX B
MISSISSIPPI
Estimated Number and Percentage* of Nursing Facility Employees
by Job Category and Nursing Job Position, 2010
STATE UNITED STATES
All Nursing Facility Employees 22,020 100.0% 1,940,818 100.0%
Administrative and Management Staff 870 3.9% 88,310 4.6%
Nursing Staff 15,198 69.0% 1,272,869 65.6%
Therapy Staff 465 2.1% 81,763 4.2%
Food Services Staff 2,555 11.6% 222,547 11.5%
Housekeeping and Maintenance Staff 2,075 9.4% 188,484 9.7%
Social Services and Activities Staff 857 3.9% 86,846 4.5%
Nursing Staff 15,198 100.0% 1,272,869 100.0%
Director of Nursing (DON) 196 1.3% 15,470 1.2%
RN with Administrative Duties (ARN) 523 3.4% 36,417 2.9%
Staff Registered Nurse (RN) 963 6.3% 121,234 9.5%
Licensed Practical Nurse (LPN) 3,854 25.4% 255,409 20.1%
Certified Nurse Assistant (CNA) 8,808 58.0% 741,752 58.3%
Other Nursing Staff 764 5.0% 90,847 7.1%
Retention, Turnover, and Vacancy Rates of Nursing Facility Employees
by Job Category and Nursing Job Position, 2010
RETENTION RATE TURNOVER RATE VACANCY RATE
STATE U.S. STATE U.S. STATE U.S.
All Nursing Facility Employees 59.5% 55.1% 25.8% 35.1% 4.3% 4.2%
Administrative and Management Staff 78.9% 71.9% 12.0% 18.0% 2.6% 1.8%
Nursing Staff 55.0% 51.4% 30.0% 39.5% 4.8% 4.9%
Therapy Staff 73.1% 65.7% 3.8% 25.7% 1.0% 3.8%
Food Services Staff 66.3% 55.3% 19.5% 33.7% 4.6% 3.3%
Housekeeping and Maintenance Staff 71.6% 65.2% 16.2% 24.3% 2.5% 2.6%
Social Services and Activities Staff 72.2% 66.5% 18.9% 22.5% 3.5% 2.8%
Nursing Staff
Director of Nursing (DON) 66.7% 64.1% 20.0% 26.0% 1.8% 3.9%
RN with Administrative Duties (ARN) 46.6% 56.2% 35.9% 28.9% 7.2% 4.5%
Staff Registered Nurse (RN) 49.6% 49.5% 28.4% 41.0% 6.8% 7.0%
Licensed Practical Nurse (LPN) 58.2% 56.0% 27.6% 34.7% 5.0% 4.3%
Certified Nurse Assistant (CNA) 54.5% 49.0% 31.0% 42.6% 5.0% 5.1%
All retention, turnover and vacancy statistics were produced by AHCA using data from 2010 AHCA Nursing Facility Staffing Survey.
*May not add due to rounding.

REPORT OF FINDINGS 2010 NURSING FACILITY STAFFING SURVEY, APPEDIX B
MONTANA
Estimated Number and Percentage* of Nursing Facility Employees
by Job Category and Nursing Job Position, 2010
STATE UNITED STATES
All Nursing Facility Employees 7,270 100.0% 1,940,818 100.0%
Administrative and Management Staff 361 5.0% 88,310 4.6%
Nursing Staff 4,449 61.2% 1,272,869 65.6%
Therapy Staff 448 6.2% 81,763 4.2%
Food Services Staff 919 12.6% 222,547 11.5%
Housekeeping and Maintenance Staff 761 10.5% 188,484 9.7%
Social Services and Activities Staff 332 4.6% 86,846 4.5%
Nursing Staff 4,449 100.0% 1,272,869 100.0%
Director of Nursing (DON) 92 2.1% 15,470 1.2%
RN with Administrative Duties (ARN) 60 1.3% 36,417 2.9%
Staff Registered Nurse (RN) 684 15.4% 121,234 9.5%
Licensed Practical Nurse (LPN) 628 14.1% 255,409 20.1%
Certified Nurse Assistant (CNA) 2,701 60.7% 741,752 58.3%
Other Nursing Staff 255 5.7% 90,847 7.1%
Retention, Turnover, and Vacancy Rates of Nursing Facility Employees
by Job Category and Nursing Job Position, 2010
RETENTION RATE TURNOVER RATE VACANCY RATE
STATE U.S. STATE U.S. STATE U.S.
All Nursing Facility Employees 51.1% 55.1% 50.1% 35.1% 4.7% 4.2%
Administrative and Management Staff 78.3% 71.9% 23.3% 18.0% 2.1% 1.8%
Nursing Staff 48.8% 51.4% 51.2% 39.5% 5.5% 4.9%
Therapy Staff 76.5% 65.7% 23.0% 25.7% 8.7% 3.8%
Food Services Staff 38.6% 55.3% 72.4% 33.7% 4.7% 3.3%
Housekeeping and Maintenance Staff 56.9% 65.2% 43.3% 24.3% 1.0% 2.6%
Social Services and Activities Staff 56.4% 66.5% 54.7% 22.5% 0.0% 2.8%
Nursing Staff
Director of Nursing (DON) 60.7% 64.1% 21.7% 26.0% 7.1% 3.9%
RN with Administrative Duties (ARN) 90.9% 56.2% 10.0% 28.9% 0.0% 4.5%
Staff Registered Nurse (RN) 47.3% 49.5% 39.8% 41.0% 3.7% 7.0%
Licensed Practical Nurse (LPN) 59.6% 56.0% 29.3% 34.7% 4.3% 4.3%
Certified Nurse Assistant (CNA) 45.3% 49.0% 62.5% 42.6% 7.4% 5.1%
All retention, turnover and vacancy statistics were produced by AHCA using data from 2010 AHCA Nursing Facility Staffing Survey.
*May not add due to rounding.

REPORT OF FINDINGS 2010 NURSING FACILITY STAFFING SURVEY, APPEDIX B
NORTH CAROLINA
Estimated Number and Percentage* of Nursing Facility Employees
by Job Category and Nursing Job Position, 2010
STATE UNITED STATES
All Nursing Facility Employees 51,559 100.0% 1,940,818 100.0%
Administrative and Management Staff 2,148 4.2% 88,310 4.6%
Nursing Staff 34,293 66.5% 1,272,869 65.6%
Therapy Staff 2,219 4.3% 81,763 4.2%
Food Services Staff 5,737 11.1% 222,547 11.5%
Housekeeping and Maintenance Staff 5,265 10.2% 188,484 9.7%
Social Services and Activities Staff 1,897 3.7% 86,846 4.5%
Nursing Staff 34,293 100.0% 1,272,869 100.0%
Director of Nursing (DON) 402 1.2% 15,470 1.2%
RN with Administrative Duties (ARN) 1,038 3.0% 36,417 2.9%
Staff Registered Nurse (RN) 2,604 7.6% 121,234 9.5%
Licensed Practical Nurse (LPN) 7,065 20.6% 255,409 20.1%
Certified Nurse Assistant (CNA) 20,597 60.1% 741,752 58.3%
Other Nursing Staff 2,259 6.6% 90,847 7.1%
Retention, Turnover, and Vacancy Rates of Nursing Facility Employees
by Job Category and Nursing Job Position, 2010
RETENTION RATE TURNOVER RATE VACANCY RATE
STATE U.S. STATE U.S. STATE U.S.
All Nursing Facility Employees 51.5% 55.1% 36.2% 35.1% 3.0% 4.2%
Administrative and Management Staff 74.5% 71.9% 15.7% 18.0% 1.6% 1.8%
Nursing Staff 46.5% 51.4% 43.0% 39.5% 3.6% 4.9%
Therapy Staff 65.4% 65.7% 23.4% 25.7% 2.9% 3.8%
Food Services Staff 53.8% 55.3% 31.1% 33.7% 1.2% 3.3%
Housekeeping and Maintenance Staff 67.5% 65.2% 17.4% 24.3% 1.5% 2.6%
Social Services and Activities Staff 66.7% 66.5% 20.7% 22.5% 2.9% 2.8%
Nursing Staff
Director of Nursing (DON) 68.6% 64.1% 24.9% 26.0% 3.5% 3.9%
RN with Administrative Duties (ARN) 46.2% 56.2% 34.8% 28.9% 2.7% 4.5%
Staff Registered Nurse (RN) 39.6% 49.5% 54.9% 41.0% 2.7% 7.0%
Licensed Practical Nurse (LPN) 48.9% 56.0% 41.2% 34.7% 3.4% 4.3%
Certified Nurse Assistant (CNA) 44.1% 49.0% 45.6% 42.6% 4.2% 5.1%
All retention, turnover and vacancy statistics were produced by AHCA using data from 2010 AHCA Nursing Facility Staffing Survey.
*May not add due to rounding.

REPORT OF FINDINGS 2010 NURSING FACILITY STAFFING SURVEY, APPEDIX B
NORTH DAKOTA
Estimated Number and Percentage* of Nursing Facility Employees
by Job Category and Nursing Job Position, 2010
STATE UNITED STATES
All Nursing Facility Employees 12,675 100.0% 1,940,818 100.0%
Administrative and Management Staff 435 3.4% 88,310 4.6%
Nursing Staff 8,310 65.6% 1,272,869 65.6%
Therapy Staff 367 2.9% 81,763 4.2%
Food Services Staff 1,796 14.2% 222,547 11.5%
Housekeeping and Maintenance Staff 1,142 9.0% 188,484 9.7%
Social Services and Activities Staff 625 4.9% 86,846 4.5%
Nursing Staff 8,310 100.0% 1,272,869 100.0%
Director of Nursing (DON) 84 1.0% 15,470 1.2%
RN with Administrative Duties (ARN) 164 2.0% 36,417 2.9%
Staff Registered Nurse (RN) 732 8.8% 121,234 9.5%
Licensed Practical Nurse (LPN) 1,029 12.4% 255,409 20.1%
Certified Nurse Assistant (CNA) 5,641 67.9% 741,752 58.3%
Other Nursing Staff 611 7.4% 90,847 7.1%
Retention, Turnover, and Vacancy Rates of Nursing Facility Employees
by Job Category and Nursing Job Position, 2010
RETENTION RATE TURNOVER RATE VACANCY RATE
STATE U.S. STATE U.S. STATE U.S.
All Nursing Facility Employees 65.2% 55.1% 24.6% 35.1% 4.4% 4.2%
Administrative and Management Staff 79.8% 71.9% 6.1% 18.0% 1.0% 1.8%
Nursing Staff 62.0% 51.4% 29.2% 39.5% 5.0% 4.9%
Therapy Staff 86.0% 65.7% 9.0% 25.7% 5.0% 3.8%
Food Services Staff 66.2% 55.3% 19.9% 33.7% 2.4% 3.3%
Housekeeping and Maintenance Staff 73.3% 65.2% 16.6% 24.3% 4.7% 2.6%
Social Services and Activities Staff 74.2% 66.5% 14.4% 22.5% 2.9% 2.8%
Nursing Staff
Director of Nursing (DON) 79.3% 64.1% 11.5% 26.0% 0.0% 3.9%
RN with Administrative Duties (ARN) 67.3% 56.2% 15.6% 28.9% 3.2% 4.5%
Staff Registered Nurse (RN) 71.8% 49.5% 20.2% 41.0% 9.4% 7.0%
Licensed Practical Nurse (LPN) 76.7% 56.0% 12.6% 34.7% 5.3% 4.3%
Certified Nurse Assistant (CNA) 57.3% 49.0% 35.3% 42.6% 4.7% 5.1%
All retention, turnover and vacancy statistics were produced by AHCA using data from 2010 AHCA Nursing Facility Staffing Survey.
*May not add due to rounding.

REPORT OF FINDINGS 2010 NURSING FACILITY STAFFING SURVEY, APPEDIX B
NEBRASKA
Estimated Number and Percentage* of Nursing Facility Employees
by Job Category and Nursing Job Position, 2010
STATE UNITED STATES
All Nursing Facility Employees 21,981 100.0% 1,940,818 100.0%
Administrative and Management Staff 976 4.4% 88,310 4.6%
Nursing Staff 15,034 68.4% 1,272,869 65.6%
Therapy Staff 214 1.0% 81,763 4.2%
Food Services Staff 2,917 13.3% 222,547 11.5%
Housekeeping and Maintenance Staff 1,870 8.5% 188,484 9.7%
Social Services and Activities Staff 968 4.4% 86,846 4.5%
Nursing Staff 15,034 100.0% 1,272,869 100.0%
Director of Nursing (DON) 211 1.4% 15,470 1.2%
RN with Administrative Duties (ARN) 366 2.4% 36,417 2.9%
Staff Registered Nurse (RN) 1,213 8.1% 121,234 9.5%
Licensed Practical Nurse (LPN) 2,723 18.1% 255,409 20.1%
Certified Nurse Assistant (CNA) 8,526 56.7% 741,752 58.3%
Other Nursing Staff 1,901 12.6% 90,847 7.1%
Retention, Turnover, and Vacancy Rates of Nursing Facility Employees
by Job Category and Nursing Job Position, 2010
RETENTION RATE TURNOVER RATE VACANCY RATE
STATE U.S. STATE U.S. STATE U.S.
All Nursing Facility Employees 51.3% 55.1% 38.0% 35.1% 5.5% 4.2%
Administrative and Management Staff 69.0% 71.9% 20.6% 18.0% 3.7% 1.8%
Nursing Staff 49.1% 51.4% 40.1% 39.5% 5.9% 4.9%
Therapy Staff 64.8% 65.7% 15.4% 25.7% 2.9% 3.8%
Food Services Staff 46.2% 55.3% 43.5% 33.7% 5.1% 3.3%
Housekeeping and Maintenance Staff 60.0% 65.2% 33.3% 24.3% 5.4% 2.6%
Social Services and Activities Staff 70.8% 66.5% 21.6% 22.5% 3.6% 2.8%
Nursing Staff
Director of Nursing (DON) 77.0% 64.1% 16.5% 26.0% 10.1% 3.9%
RN with Administrative Duties (ARN) 49.5% 56.2% 32.5% 28.9% 5.9% 4.5%
Staff Registered Nurse (RN) 57.6% 49.5% 31.9% 41.0% 9.6% 7.0%
Licensed Practical Nurse (LPN) 59.7% 56.0% 27.7% 34.7% 6.1% 4.3%
Certified Nurse Assistant (CNA) 41.2% 49.0% 49.4% 42.6% 5.8% 5.1%
All retention, turnover and vacancy statistics were produced by AHCA using data from 2010 AHCA Nursing Facility Staffing Survey.
*May not add due to rounding.
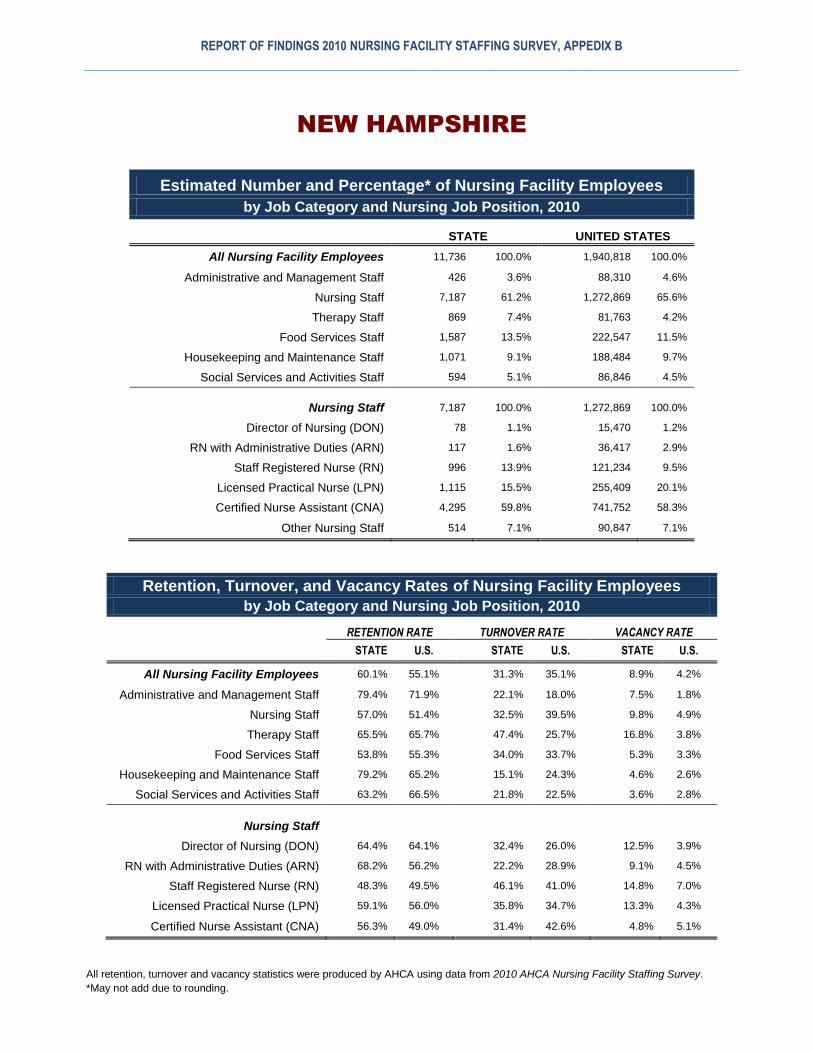
REPORT OF FINDINGS 2010 NURSING FACILITY STAFFING SURVEY, APPEDIX B
NEW HAMPSHIRE
Estimated Number and Percentage* of Nursing Facility Employees
by Job Category and Nursing Job Position, 2010
STATE UNITED STATES
All Nursing Facility Employees 11,736 100.0% 1,940,818 100.0%
Administrative and Management Staff 426 3.6% 88,310 4.6%
Nursing Staff 7,187 61.2% 1,272,869 65.6%
Therapy Staff 869 7.4% 81,763 4.2%
Food Services Staff 1,587 13.5% 222,547 11.5%
Housekeeping and Maintenance Staff 1,071 9.1% 188,484 9.7%
Social Services and Activities Staff 594 5.1% 86,846 4.5%
Nursing Staff 7,187 100.0% 1,272,869 100.0%
Director of Nursing (DON) 78 1.1% 15,470 1.2%
RN with Administrative Duties (ARN) 117 1.6% 36,417 2.9%
Staff Registered Nurse (RN) 996 13.9% 121,234 9.5%
Licensed Practical Nurse (LPN) 1,115 15.5% 255,409 20.1%
Certified Nurse Assistant (CNA) 4,295 59.8% 741,752 58.3%
Other Nursing Staff 514 7.1% 90,847 7.1%
Retention, Turnover, and Vacancy Rates of Nursing Facility Employees
by Job Category and Nursing Job Position, 2010
RETENTION RATE TURNOVER RATE VACANCY RATE
STATE U.S. STATE U.S. STATE U.S.
All Nursing Facility Employees 60.1% 55.1% 31.3% 35.1% 8.9% 4.2%
Administrative and Management Staff 79.4% 71.9% 22.1% 18.0% 7.5% 1.8%
Nursing Staff 57.0% 51.4% 32.5% 39.5% 9.8% 4.9%
Therapy Staff 65.5% 65.7% 47.4% 25.7% 16.8% 3.8%
Food Services Staff 53.8% 55.3% 34.0% 33.7% 5.3% 3.3%
Housekeeping and Maintenance Staff 79.2% 65.2% 15.1% 24.3% 4.6% 2.6%
Social Services and Activities Staff 63.2% 66.5% 21.8% 22.5% 3.6% 2.8%
Nursing Staff
Director of Nursing (DON) 64.4% 64.1% 32.4% 26.0% 12.5% 3.9%
RN with Administrative Duties (ARN) 68.2% 56.2% 22.2% 28.9% 9.1% 4.5%
Staff Registered Nurse (RN) 48.3% 49.5% 46.1% 41.0% 14.8% 7.0%
Licensed Practical Nurse (LPN) 59.1% 56.0% 35.8% 34.7% 13.3% 4.3%
Certified Nurse Assistant (CNA) 56.3% 49.0% 31.4% 42.6% 4.8% 5.1%
All retention, turnover and vacancy statistics were produced by AHCA using data from 2010 AHCA Nursing Facility Staffing Survey.
*May not add due to rounding.

REPORT OF FINDINGS 2010 NURSING FACILITY STAFFING SURVEY, APPEDIX B
NEW JERSEY
Estimated Number and Percentage* of Nursing Facility Employees
by Job Category and Nursing Job Position, 2010
STATE UNITED STATES
All Nursing Facility Employees 71,071 100.0% 1,940,818 100.0%
Administrative and Management Staff 3,720 5.2% 88,310 4.6%
Nursing Staff 44,427 62.5% 1,272,869 65.6%
Therapy Staff 3,186 4.5% 81,763 4.2%
Food Services Staff 8,499 12.0% 222,547 11.5%
Housekeeping and Maintenance Staff 6,962 9.8% 188,484 9.7%
Social Services and Activities Staff 4,276 6.0% 86,846 4.5%
Nursing Staff 44,427 100.0% 1,272,869 100.0%
Director of Nursing (DON) 355 0.8% 15,470 1.2%
RN with Administrative Duties (ARN) 1,485 3.3% 36,417 2.9%
Staff Registered Nurse (RN) 7,180 16.2% 121,234 9.5%
Licensed Practical Nurse (LPN) 8,075 18.2% 255,409 20.1%
Certified Nurse Assistant (CNA) 23,839 53.7% 741,752 58.3%
Other Nursing Staff 3,183 7.2% 90,847 7.1%
Retention, Turnover, and Vacancy Rates of Nursing Facility Employees
by Job Category and Nursing Job Position, 2010
RETENTION RATE TURNOVER RATE VACANCY RATE
STATE U.S. STATE U.S. STATE U.S.
All Nursing Facility Employees 62.2% 55.1% 27.8% 35.1% 4.1% 4.2%
Administrative and Management Staff 71.5% 71.9% 15.7% 18.0% 1.9% 1.8%
Nursing Staff 61.4% 51.4% 29.0% 39.5% 4.7% 4.9%
Therapy Staff 57.4% 65.7% 44.7% 25.7% 2.4% 3.8%
Food Services Staff 57.3% 55.3% 32.6% 33.7% 3.6% 3.3%
Housekeeping and Maintenance Staff 70.0% 65.2% 18.3% 24.3% 3.3% 2.6%
Social Services and Activities Staff 66.3% 66.5% 18.5% 22.5% 2.1% 2.8%
Nursing Staff
Director of Nursing (DON) 75.9% 64.1% 11.3% 26.0% 3.0% 3.9%
RN with Administrative Duties (ARN) 75.4% 56.2% 15.8% 28.9% 5.8% 4.5%
Staff Registered Nurse (RN) 53.8% 49.5% 37.7% 41.0% 4.8% 7.0%
Licensed Practical Nurse (LPN) 71.3% 56.0% 22.7% 34.7% 4.5% 4.3%
Certified Nurse Assistant (CNA) 61.4% 49.0% 27.7% 42.6% 5.5% 5.1%
All retention, turnover and vacancy statistics were produced by AHCA using data from 2010 AHCA Nursing Facility Staffing Survey.
*May not add due to rounding.

REPORT OF FINDINGS 2010 NURSING FACILITY STAFFING SURVEY, APPEDIX B
NEW MEXICO
Estimated Number and Percentage* of Nursing Facility Employees
by Job Category and Nursing Job Position, 2010
STATE UNITED STATES
All Nursing Facility Employees 7,022 100.0% 1,940,818 100.0%
Administrative and Management Staff 403 5.7% 88,310 4.6%
Nursing Staff 4,576 65.2% 1,272,869 65.6%
Therapy Staff 300 4.3% 81,763 4.2%
Food Services Staff 817 11.6% 222,547 11.5%
Housekeeping and Maintenance Staff 578 8.2% 188,484 9.7%
Social Services and Activities Staff 350 5.0% 86,846 4.5%
Nursing Staff 4,576 100.0% 1,272,869 100.0%
Director of Nursing (DON) 59 1.3% 15,470 1.2%
RN with Administrative Duties (ARN) 15 0.3% 36,417 2.9%
Staff Registered Nurse (RN) 579 12.7% 121,234 9.5%
Licensed Practical Nurse (LPN) 661 14.5% 255,409 20.1%
Certified Nurse Assistant (CNA) 2,518 55.0% 741,752 58.3%
Other Nursing Staff 689 15.1% 90,847 7.1%
Retention, Turnover, and Vacancy Rates of Nursing Facility Employees
by Job Category and Nursing Job Position, 2010
RETENTION RATE TURNOVER RATE VACANCY RATE
STATE U.S. STATE U.S. STATE U.S.
All Nursing Facility Employees 38.2% 55.1% 62.2% 35.1% 2.7% 4.2%
Administrative and Management Staff 51.3% 71.9% 42.7% 18.0% 1.4% 1.8%
Nursing Staff 34.7% 51.4% 69.7% 39.5% 3.0% 4.9%
Therapy Staff 52.0% 65.7% 29.5% 25.7% 0.0% 3.8%
Food Services Staff 41.2% 55.3% 63.7% 33.7% 2.8% 3.3%
Housekeeping and Maintenance Staff 48.1% 65.2% 39.2% 24.3% 1.1% 2.6%
Social Services and Activities Staff 44.2% 66.5% 48.5% 22.5% 5.0% 2.8%
Nursing Staff
Director of Nursing (DON) 53.1% 64.1% 45.5% 26.0% 9.1% 3.9%
RN with Administrative Duties (ARN) 16.7% 56.2% 50.0% 28.9% 0.0% 4.5%
Staff Registered Nurse (RN) 31.3% 49.5% 58.3% 41.0% 0.9% 7.0%
Licensed Practical Nurse (LPN) 40.4% 56.0% 54.4% 34.7% 2.6% 4.3%
Certified Nurse Assistant (CNA) 34.5% 49.0% 72.5% 42.6% 3.3% 5.1%
All retention, turnover and vacancy statistics were produced by AHCA using data from 2010 AHCA Nursing Facility Staffing Survey.
*May not add due to rounding.

REPORT OF FINDINGS 2010 NURSING FACILITY STAFFING SURVEY, APPEDIX B
NEVADA
Estimated Number and Percentage* of Nursing Facility Employees
by Job Category and Nursing Job Position, 2010
STATE UNITED STATES
All Nursing Facility Employees 6,441 100.0% 1,940,818 100.0%
Administrative and Management Staff 317 4.9% 88,310 4.6%
Nursing Staff 4,367 67.8% 1,272,869 65.6%
Therapy Staff 377 5.9% 81,763 4.2%
Food Services Staff 665 10.3% 222,547 11.5%
Housekeeping and Maintenance Staff 379 5.9% 188,484 9.7%
Social Services and Activities Staff 337 5.2% 86,846 4.5%
Nursing Staff 4,367 100.0% 1,272,869 100.0%
Director of Nursing (DON) 46 1.0% 15,470 1.2%
RN with Administrative Duties (ARN) 42 1.0% 36,417 2.9%
Staff Registered Nurse (RN) 800 18.3% 121,234 9.5%
Licensed Practical Nurse (LPN) 903 20.7% 255,409 20.1%
Certified Nurse Assistant (CNA) 2,231 51.1% 741,752 58.3%
Other Nursing Staff 324 7.4% 90,847 7.1%
Retention, Turnover, and Vacancy Rates of Nursing Facility Employees
by Job Category and Nursing Job Position, 2010
RETENTION RATE TURNOVER RATE VACANCY RATE
STATE U.S. STATE U.S. STATE U.S.
All Nursing Facility Employees 52.2% 55.1% 45.6% 35.1% 2.6% 4.2%
Administrative and Management Staff 60.9% 71.9% 42.3% 18.0% 3.7% 1.8%
Nursing Staff 51.2% 51.4% 44.1% 39.5% 2.6% 4.9%
Therapy Staff 51.7% 65.7% 76.0% 25.7% 0.0% 3.8%
Food Services Staff 50.7% 55.3% 41.1% 33.7% 2.4% 3.3%
Housekeeping and Maintenance Staff 72.4% 65.2% 25.0% 24.3% 3.1% 2.6%
Social Services and Activities Staff 43.0% 66.5% 67.2% 22.5% 3.5% 2.8%
Nursing Staff
Director of Nursing (DON) 61.1% 64.1% 28.6% 26.0% 0.0% 3.9%
RN with Administrative Duties (ARN) 28.6% 56.2% 61.5% 28.9% 0.0% 4.5%
Staff Registered Nurse (RN) 48.4% 49.5% 37.6% 41.0% 1.5% 7.0%
Licensed Practical Nurse (LPN) 54.6% 56.0% 48.4% 34.7% 4.5% 4.3%
Certified Nurse Assistant (CNA) 51.3% 49.0% 42.3% 42.6% 2.8% 5.1%
All retention, turnover and vacancy statistics were produced by AHCA using data from 2010 AHCA Nursing Facility Staffing Survey.
*May not add due to rounding.
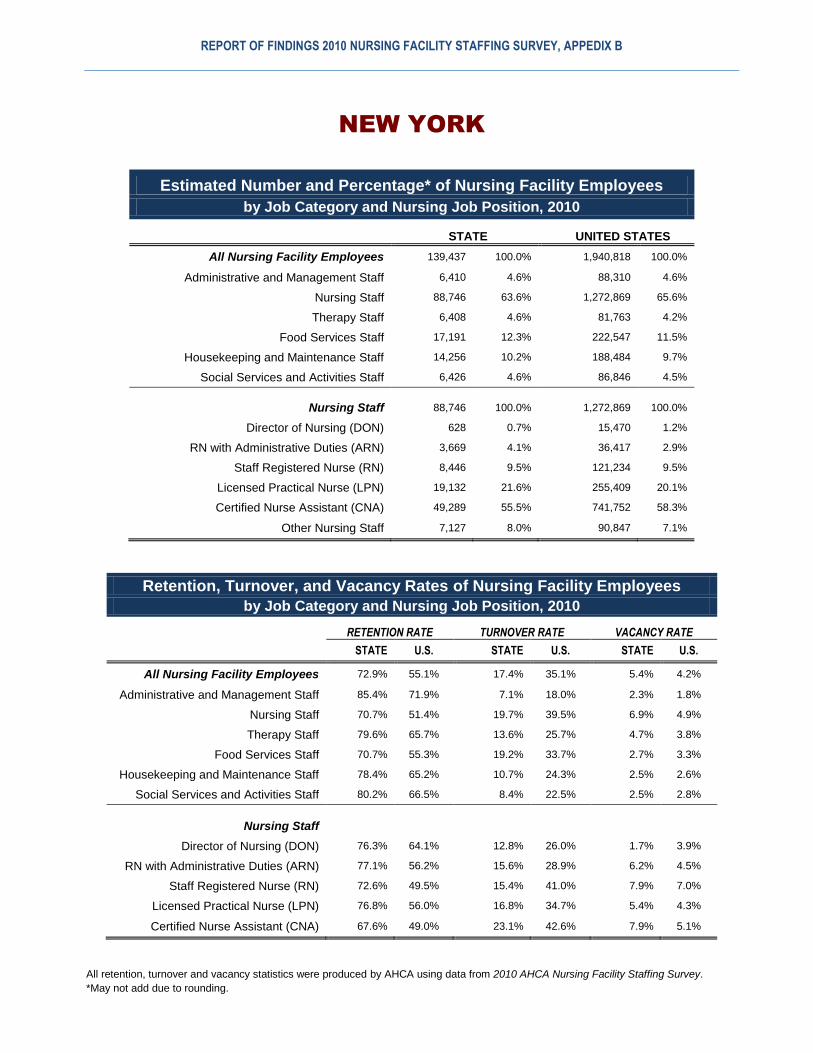
REPORT OF FINDINGS 2010 NURSING FACILITY STAFFING SURVEY, APPEDIX B
NEW YORK
Estimated Number and Percentage* of Nursing Facility Employees
by Job Category and Nursing Job Position, 2010
STATE UNITED STATES
All Nursing Facility Employees 139,437 100.0% 1,940,818 100.0%
Administrative and Management Staff 6,410 4.6% 88,310 4.6%
Nursing Staff 88,746 63.6% 1,272,869 65.6%
Therapy Staff 6,408 4.6% 81,763 4.2%
Food Services Staff 17,191 12.3% 222,547 11.5%
Housekeeping and Maintenance Staff 14,256 10.2% 188,484 9.7%
Social Services and Activities Staff 6,426 4.6% 86,846 4.5%
Nursing Staff 88,746 100.0% 1,272,869 100.0%
Director of Nursing (DON) 628 0.7% 15,470 1.2%
RN with Administrative Duties (ARN) 3,669 4.1% 36,417 2.9%
Staff Registered Nurse (RN) 8,446 9.5% 121,234 9.5%
Licensed Practical Nurse (LPN) 19,132 21.6% 255,409 20.1%
Certified Nurse Assistant (CNA) 49,289 55.5% 741,752 58.3%
Other Nursing Staff 7,127 8.0% 90,847 7.1%
Retention, Turnover, and Vacancy Rates of Nursing Facility Employees
by Job Category and Nursing Job Position, 2010
RETENTION RATE TURNOVER RATE VACANCY RATE
STATE U.S. STATE U.S. STATE U.S.
All Nursing Facility Employees 72.9% 55.1% 17.4% 35.1% 5.4% 4.2%
Administrative and Management Staff 85.4% 71.9% 7.1% 18.0% 2.3% 1.8%
Nursing Staff 70.7% 51.4% 19.7% 39.5% 6.9% 4.9%
Therapy Staff 79.6% 65.7% 13.6% 25.7% 4.7% 3.8%
Food Services Staff 70.7% 55.3% 19.2% 33.7% 2.7% 3.3%
Housekeeping and Maintenance Staff 78.4% 65.2% 10.7% 24.3% 2.5% 2.6%
Social Services and Activities Staff 80.2% 66.5% 8.4% 22.5% 2.5% 2.8%
Nursing Staff
Director of Nursing (DON) 76.3% 64.1% 12.8% 26.0% 1.7% 3.9%
RN with Administrative Duties (ARN) 77.1% 56.2% 15.6% 28.9% 6.2% 4.5%
Staff Registered Nurse (RN) 72.6% 49.5% 15.4% 41.0% 7.9% 7.0%
Licensed Practical Nurse (LPN) 76.8% 56.0% 16.8% 34.7% 5.4% 4.3%
Certified Nurse Assistant (CNA) 67.6% 49.0% 23.1% 42.6% 7.9% 5.1%
All retention, turnover and vacancy statistics were produced by AHCA using data from 2010 AHCA Nursing Facility Staffing Survey.
*May not add due to rounding.
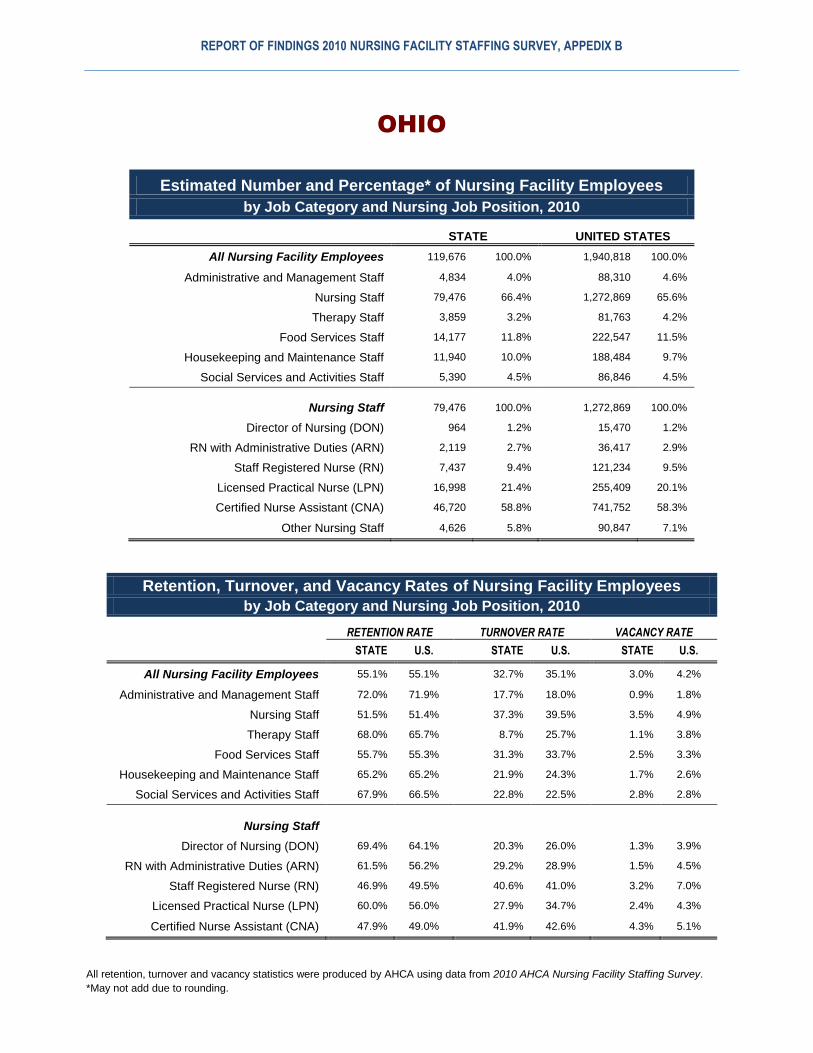
REPORT OF FINDINGS 2010 NURSING FACILITY STAFFING SURVEY, APPEDIX B
OHIO
Estimated Number and Percentage* of Nursing Facility Employees
by Job Category and Nursing Job Position, 2010
STATE UNITED STATES
All Nursing Facility Employees 119,676 100.0% 1,940,818 100.0%
Administrative and Management Staff 4,834 4.0% 88,310 4.6%
Nursing Staff 79,476 66.4% 1,272,869 65.6%
Therapy Staff 3,859 3.2% 81,763 4.2%
Food Services Staff 14,177 11.8% 222,547 11.5%
Housekeeping and Maintenance Staff 11,940 10.0% 188,484 9.7%
Social Services and Activities Staff 5,390 4.5% 86,846 4.5%
Nursing Staff 79,476 100.0% 1,272,869 100.0%
Director of Nursing (DON) 964 1.2% 15,470 1.2%
RN with Administrative Duties (ARN) 2,119 2.7% 36,417 2.9%
Staff Registered Nurse (RN) 7,437 9.4% 121,234 9.5%
Licensed Practical Nurse (LPN) 16,998 21.4% 255,409 20.1%
Certified Nurse Assistant (CNA) 46,720 58.8% 741,752 58.3%
Other Nursing Staff 4,626 5.8% 90,847 7.1%
Retention, Turnover, and Vacancy Rates of Nursing Facility Employees
by Job Category and Nursing Job Position, 2010
RETENTION RATE TURNOVER RATE VACANCY RATE
STATE U.S. STATE U.S. STATE U.S.
All Nursing Facility Employees 55.1% 55.1% 32.7% 35.1% 3.0% 4.2%
Administrative and Management Staff 72.0% 71.9% 17.7% 18.0% 0.9% 1.8%
Nursing Staff 51.5% 51.4% 37.3% 39.5% 3.5% 4.9%
Therapy Staff 68.0% 65.7% 8.7% 25.7% 1.1% 3.8%
Food Services Staff 55.7% 55.3% 31.3% 33.7% 2.5% 3.3%
Housekeeping and Maintenance Staff 65.2% 65.2% 21.9% 24.3% 1.7% 2.6%
Social Services and Activities Staff 67.9% 66.5% 22.8% 22.5% 2.8% 2.8%
Nursing Staff
Director of Nursing (DON) 69.4% 64.1% 20.3% 26.0% 1.3% 3.9%
RN with Administrative Duties (ARN) 61.5% 56.2% 29.2% 28.9% 1.5% 4.5%
Staff Registered Nurse (RN) 46.9% 49.5% 40.6% 41.0% 3.2% 7.0%
Licensed Practical Nurse (LPN) 60.0% 56.0% 27.9% 34.7% 2.4% 4.3%
Certified Nurse Assistant (CNA) 47.9% 49.0% 41.9% 42.6% 4.3% 5.1%
All retention, turnover and vacancy statistics were produced by AHCA using data from 2010 AHCA Nursing Facility Staffing Survey.
*May not add due to rounding.

REPORT OF FINDINGS 2010 NURSING FACILITY STAFFING SURVEY, APPEDIX B
OKLAHOMA
Estimated Number and Percentage* of Nursing Facility Employees
by Job Category and Nursing Job Position, 2010
STATE UNITED STATES
All Nursing Facility Employees 24,783 100.0% 1,940,818 100.0%
Administrative and Management Staff 995 4.0% 88,310 4.6%
Nursing Staff 16,048 64.8% 1,272,869 65.6%
Therapy Staff 1,012 4.1% 81,763 4.2%
Food Services Staff 2,942 11.9% 222,547 11.5%
Housekeeping and Maintenance Staff 2,804 11.3% 188,484 9.7%
Social Services and Activities Staff 982 4.0% 86,846 4.5%
Nursing Staff 16,048 100.0% 1,272,869 100.0%
Director of Nursing (DON) 313 2.0% 15,470 1.2%
RN with Administrative Duties (ARN) 140 0.9% 36,417 2.9%
Staff Registered Nurse (RN) 964 6.0% 121,234 9.5%
Licensed Practical Nurse (LPN) 3,425 21.3% 255,409 20.1%
Certified Nurse Assistant (CNA) 9,694 60.4% 741,752 58.3%
Other Nursing Staff 1,217 7.6% 90,847 7.1%
Retention, Turnover, and Vacancy Rates of Nursing Facility Employees
by Job Category and Nursing Job Position, 2010
RETENTION RATE TURNOVER RATE VACANCY RATE
STATE U.S. STATE U.S. STATE U.S.
All Nursing Facility Employees 37.6% 55.1% 60.9% 35.1% 4.1% 4.2%
Administrative and Management Staff 67.3% 71.9% 28.9% 18.0% 1.3% 1.8%
Nursing Staff 31.9% 51.4% 71.2% 39.5% 5.0% 4.9%
Therapy Staff 65.8% 65.7% 11.3% 25.7% 5.3% 3.8%
Food Services Staff 39.4% 55.3% 56.7% 33.7% 2.2% 3.3%
Housekeeping and Maintenance Staff 49.3% 65.2% 49.9% 24.3% 1.7% 2.6%
Social Services and Activities Staff 64.1% 66.5% 20.4% 22.5% 2.0% 2.8%
Nursing Staff
Director of Nursing (DON) 53.8% 64.1% 28.2% 26.0% 1.9% 3.9%
RN with Administrative Duties (ARN) 51.6% 56.2% 29.2% 28.9% 4.8% 4.5%
Staff Registered Nurse (RN) 30.7% 49.5% 62.2% 41.0% 12.2% 7.0%
Licensed Practical Nurse (LPN) 36.4% 56.0% 54.9% 34.7% 5.6% 4.3%
Certified Nurse Assistant (CNA) 28.7% 49.0% 79.8% 42.6% 4.6% 5.1%
All retention, turnover and vacancy statistics were produced by AHCA using data from 2010 AHCA Nursing Facility Staffing Survey.
*May not add due to rounding.

REPORT OF FINDINGS 2010 NURSING FACILITY STAFFING SURVEY, APPEDIX B
OREGON
Estimated Number and Percentage* of Nursing Facility Employees
by Job Category and Nursing Job Position, 2010
STATE UNITED STATES
All Nursing Facility Employees 10,787 100.0% 1,940,818 100.0%
Administrative and Management Staff 563 5.2% 88,310 4.6%
Nursing Staff 7,081 65.6% 1,272,869 65.6%
Therapy Staff 425 3.9% 81,763 4.2%
Food Services Staff 1,194 11.1% 222,547 11.5%
Housekeeping and Maintenance Staff 1,069 9.9% 188,484 9.7%
Social Services and Activities Staff 455 4.2% 86,846 4.5%
Nursing Staff 7,081 100.0% 1,272,869 100.0%
Director of Nursing (DON) 134 1.9% 15,470 1.2%
RN with Administrative Duties (ARN) 240 3.4% 36,417 2.9%
Staff Registered Nurse (RN) 778 11.0% 121,234 9.5%
Licensed Practical Nurse (LPN) 828 11.7% 255,409 20.1%
Certified Nurse Assistant (CNA) 4,696 66.3% 741,752 58.3%
Other Nursing Staff 382 5.4% 90,847 7.1%
Retention, Turnover, and Vacancy Rates of Nursing Facility Employees
by Job Category and Nursing Job Position, 2010
RETENTION RATE TURNOVER RATE VACANCY RATE
STATE U.S. STATE U.S. STATE U.S.
All Nursing Facility Employees 55.9% 55.1% 33.7% 35.1% 3.4% 4.2%
Administrative and Management Staff 72.2% 71.9% 19.8% 18.0% 0.8% 1.8%
Nursing Staff 50.5% 51.4% 36.3% 39.5% 4.1% 4.9%
Therapy Staff 62.0% 65.7% 37.0% 25.7% 7.7% 3.8%
Food Services Staff 60.4% 55.3% 34.8% 33.7% 1.5% 3.3%
Housekeeping and Maintenance Staff 71.8% 65.2% 23.3% 24.3% 0.0% 2.6%
Social Services and Activities Staff 71.5% 66.5% 28.8% 22.5% 2.7% 2.8%
Nursing Staff
Director of Nursing (DON) 67.2% 64.1% 32.6% 26.0% 3.0% 3.9%
RN with Administrative Duties (ARN) 50.5% 56.2% 32.1% 28.9% 5.2% 4.5%
Staff Registered Nurse (RN) 52.8% 49.5% 35.6% 41.0% 3.3% 7.0%
Licensed Practical Nurse (LPN) 58.8% 56.0% 36.3% 34.7% 4.1% 4.3%
Certified Nurse Assistant (CNA) 47.8% 49.0% 36.7% 42.6% 4.2% 5.1%
All retention, turnover and vacancy statistics were produced by AHCA using data from 2010 AHCA Nursing Facility Staffing Survey.
*May not add due to rounding.

REPORT OF FINDINGS 2010 NURSING FACILITY STAFFING SURVEY, APPEDIX B
PENNSYLVANIA
Estimated Number and Percentage* of Nursing Facility Employees
by Job Category and Nursing Job Position, 2010
STATE UNITED STATES
All Nursing Facility Employees 102,835 100.0% 1,940,818 100.0%
Administrative and Management Staff 4,973 4.8% 88,310 4.6%
Nursing Staff 66,861 65.0% 1,272,869 65.6%
Therapy Staff 3,956 3.8% 81,763 4.2%
Food Services Staff 13,191 12.8% 222,547 11.5%
Housekeeping and Maintenance Staff 8,964 8.7% 188,484 9.7%
Social Services and Activities Staff 4,891 4.8% 86,846 4.5%
Nursing Staff 66,861 100.0% 1,272,869 100.0%
Director of Nursing (DON) 709 1.1% 15,470 1.2%
RN with Administrative Duties (ARN) 3,227 4.8% 36,417 2.9%
Staff Registered Nurse (RN) 7,707 11.5% 121,234 9.5%
Licensed Practical Nurse (LPN) 13,794 20.6% 255,409 20.1%
Certified Nurse Assistant (CNA) 36,540 54.7% 741,752 58.3%
Other Nursing Staff 4,231 6.3% 90,847 7.1%
Retention, Turnover, and Vacancy Rates of Nursing Facility Employees
by Job Category and Nursing Job Position, 2010
RETENTION RATE TURNOVER RATE VACANCY RATE
STATE U.S. STATE U.S. STATE U.S.
All Nursing Facility Employees 56.0% 55.1% 35.3% 35.1% 4.0% 4.2%
Administrative and Management Staff 71.0% 71.9% 18.7% 18.0% 1.7% 1.8%
Nursing Staff 53.5% 51.4% 39.3% 39.5% 4.8% 4.9%
Therapy Staff 61.6% 65.7% 34.1% 25.7% 2.1% 3.8%
Food Services Staff 52.8% 55.3% 34.0% 33.7% 3.1% 3.3%
Housekeeping and Maintenance Staff 66.5% 65.2% 23.2% 24.3% 2.0% 2.6%
Social Services and Activities Staff 64.7% 66.5% 23.9% 22.5% 2.3% 2.8%
Nursing Staff
Director of Nursing (DON) 61.8% 64.1% 30.1% 26.0% 5.6% 3.9%
RN with Administrative Duties (ARN) 49.8% 56.2% 42.3% 28.9% 3.8% 4.5%
Staff Registered Nurse (RN) 49.9% 49.5% 40.6% 41.0% 4.7% 7.0%
Licensed Practical Nurse (LPN) 61.9% 56.0% 30.7% 34.7% 4.0% 4.3%
Certified Nurse Assistant (CNA) 50.9% 49.0% 43.6% 42.6% 5.7% 5.1%
All retention, turnover and vacancy statistics were produced by AHCA using data from 2010 AHCA Nursing Facility Staffing Survey.
*May not add due to rounding.

REPORT OF FINDINGS 2010 NURSING FACILITY STAFFING SURVEY, APPEDIX B
RHODE ISLAND
Estimated Number and Percentage* of Nursing Facility Employees
by Job Category and Nursing Job Position, 2010
STATE UNITED STATES
All Nursing Facility Employees 11,368 100.0% 1,940,818 100.0%
Administrative and Management Staff 500 4.4% 88,310 4.6%
Nursing Staff 7,297 64.2% 1,272,869 65.6%
Therapy Staff 669 5.9% 81,763 4.2%
Food Services Staff 1,317 11.6% 222,547 11.5%
Housekeeping and Maintenance Staff 930 8.2% 188,484 9.7%
Social Services and Activities Staff 655 5.8% 86,846 4.5%
Nursing Staff 7,297 100.0% 1,272,869 100.0%
Director of Nursing (DON) 88 1.2% 15,470 1.2%
RN with Administrative Duties (ARN) 181 2.5% 36,417 2.9%
Staff Registered Nurse (RN) 1,143 15.7% 121,234 9.5%
Licensed Practical Nurse (LPN) 771 10.6% 255,409 20.1%
Certified Nurse Assistant (CNA) 4,624 63.4% 741,752 58.3%
Other Nursing Staff 437 6.0% 90,847 7.1%
Retention, Turnover, and Vacancy Rates of Nursing Facility Employees
by Job Category and Nursing Job Position, 2010
RETENTION RATE TURNOVER RATE VACANCY RATE
STATE U.S. STATE U.S. STATE U.S.
All Nursing Facility Employees 58.9% 55.1% 33.1% 35.1% 4.3% 4.2%
Administrative and Management Staff 81.8% 71.9% 10.4% 18.0% 0.0% 1.8%
Nursing Staff 55.5% 51.4% 36.4% 39.5% 5.2% 4.9%
Therapy Staff 70.9% 65.7% 36.2% 25.7% 1.9% 3.8%
Food Services Staff 55.5% 55.3% 34.7% 33.7% 2.4% 3.3%
Housekeeping and Maintenance Staff 72.4% 65.2% 20.5% 24.3% 3.1% 2.6%
Social Services and Activities Staff 60.8% 66.5% 24.5% 22.5% 5.5% 2.8%
Nursing Staff
Director of Nursing (DON) 80.6% 64.1% 10.7% 26.0% 0.0% 3.9%
RN with Administrative Duties (ARN) 71.4% 56.2% 28.6% 28.9% 0.0% 4.5%
Staff Registered Nurse (RN) 58.3% 49.5% 37.5% 41.0% 7.6% 7.0%
Licensed Practical Nurse (LPN) 58.1% 56.0% 41.2% 34.7% 7.7% 4.3%
Certified Nurse Assistant (CNA) 51.6% 49.0% 38.2% 42.6% 5.0% 5.1%
All retention, turnover and vacancy statistics were produced by AHCA using data from 2010 AHCA Nursing Facility Staffing Survey.
*May not add due to rounding.

REPORT OF FINDINGS 2010 NURSING FACILITY STAFFING SURVEY, APPEDIX B
SOUTH CAROLINA
Estimated Number and Percentage* of Nursing Facility Employees
by Job Category and Nursing Job Position, 2010
STATE UNITED STATES
All Nursing Facility Employees 23,041 100.0% 1,940,818 100.0%
Administrative and Management Staff 968 4.2% 88,310 4.6%
Nursing Staff 15,792 68.5% 1,272,869 65.6%
Therapy Staff 770 3.3% 81,763 4.2%
Food Services Staff 2,596 11.3% 222,547 11.5%
Housekeeping and Maintenance Staff 2,036 8.8% 188,484 9.7%
Social Services and Activities Staff 879 3.8% 86,846 4.5%
Nursing Staff 15,792 100.0% 1,272,869 100.0%
Director of Nursing (DON) 184 1.2% 15,470 1.2%
RN with Administrative Duties (ARN) 292 1.9% 36,417 2.9%
Staff Registered Nurse (RN) 1,237 7.8% 121,234 9.5%
Licensed Practical Nurse (LPN) 3,699 23.4% 255,409 20.1%
Certified Nurse Assistant (CNA) 9,125 57.8% 741,752 58.3%
Other Nursing Staff 1,128 7.1% 90,847 7.1%
Retention, Turnover, and Vacancy Rates of Nursing Facility Employees
by Job Category and Nursing Job Position, 2010
RETENTION RATE TURNOVER RATE VACANCY RATE
STATE U.S. STATE U.S. STATE U.S.
All Nursing Facility Employees 54.7% 55.1% 30.0% 35.1% 4.1% 4.2%
Administrative and Management Staff 81.1% 71.9% 6.7% 18.0% 1.8% 1.8%
Nursing Staff 51.4% 51.4% 35.6% 39.5% 4.4% 4.9%
Therapy Staff 51.6% 65.7% 25.7% 25.7% 7.9% 3.8%
Food Services Staff 54.8% 55.3% 24.2% 33.7% 3.6% 3.3%
Housekeeping and Maintenance Staff 68.7% 65.2% 11.2% 24.3% 3.3% 2.6%
Social Services and Activities Staff 68.7% 66.5% 18.8% 22.5% 1.0% 2.8%
Nursing Staff
Director of Nursing (DON) 72.1% 64.1% 13.2% 26.0% 0.0% 3.9%
RN with Administrative Duties (ARN) 59.4% 56.2% 18.5% 28.9% 7.0% 4.5%
Staff Registered Nurse (RN) 46.2% 49.5% 40.5% 41.0% 6.0% 7.0%
Licensed Practical Nurse (LPN) 52.4% 56.0% 35.1% 34.7% 4.3% 4.3%
Certified Nurse Assistant (CNA) 49.7% 49.0% 37.2% 42.6% 3.7% 5.1%
All retention, turnover and vacancy statistics were produced by AHCA using data from 2010 AHCA Nursing Facility Staffing Survey.
*May not add due to rounding.

REPORT OF FINDINGS 2010 NURSING FACILITY STAFFING SURVEY, APPEDIX B
SOUTH DAKOTA
Estimated Number and Percentage* of Nursing Facility Employees
by Job Category and Nursing Job Position, 2010
STATE UNITED STATES
All Nursing Facility Employees 9,611 100.0% 1,940,818 100.0%
Administrative and Management Staff 432 4.5% 88,310 4.6%
Nursing Staff 6,171 64.2% 1,272,869 65.6%
Therapy Staff 88 0.9% 81,763 4.2%
Food Services Staff 1,562 16.3% 222,547 11.5%
Housekeeping and Maintenance Staff 840 8.7% 188,484 9.7%
Social Services and Activities Staff 517 5.4% 86,846 4.5%
Nursing Staff 6,171 100.0% 1,272,869 100.0%
Director of Nursing (DON) 101 1.6% 15,470 1.2%
RN with Administrative Duties (ARN) 605 9.8% 36,417 2.9%
Staff Registered Nurse (RN) 367 5.9% 121,234 9.5%
Licensed Practical Nurse (LPN) 619 10.0% 255,409 20.1%
Certified Nurse Assistant (CNA) 4,074 66.0% 741,752 58.3%
Other Nursing Staff 387 6.3% 90,847 7.1%
Retention, Turnover, and Vacancy Rates of Nursing Facility Employees
by Job Category and Nursing Job Position, 2010
RETENTION RATE TURNOVER RATE VACANCY RATE
STATE U.S. STATE U.S. STATE U.S.
All Nursing Facility Employees 51.3% 55.1% 36.9% 35.1% 6.2% 4.2%
Administrative and Management Staff 84.1% 71.9% 4.5% 18.0% 1.1% 1.8%
Nursing Staff 47.9% 51.4% 42.8% 39.5% 6.9% 4.9%
Therapy Staff 70.4% 65.7% 0.0% 25.7% 10.5% 3.8%
Food Services Staff 49.9% 55.3% 34.4% 33.7% 5.2% 3.3%
Housekeeping and Maintenance Staff 58.7% 65.2% 26.7% 24.3% 6.9% 2.6%
Social Services and Activities Staff 65.6% 66.5% 23.0% 22.5% 3.5% 2.8%
Nursing Staff
Director of Nursing (DON) 70.4% 64.1% 17.4% 26.0% 8.7% 3.9%
RN with Administrative Duties (ARN) 56.7% 56.2% 21.8% 28.9% 3.5% 4.5%
Staff Registered Nurse (RN) 51.7% 49.5% 45.0% 41.0% 11.5% 7.0%
Licensed Practical Nurse (LPN) 60.7% 56.0% 28.1% 34.7% 6.4% 4.3%
Certified Nurse Assistant (CNA) 43.0% 49.0% 49.4% 42.6% 6.4% 5.1%
All retention, turnover and vacancy statistics were produced by AHCA using data from 2010 AHCA Nursing Facility Staffing Survey.
*May not add due to rounding.

REPORT OF FINDINGS 2010 NURSING FACILITY STAFFING SURVEY, APPEDIX B
TENNESSEE
Estimated Number and Percentage* of Nursing Facility Employees
by Job Category and Nursing Job Position, 2010
STATE UNITED STATES
All Nursing Facility Employees 39,509 100.0% 1,940,818 100.0%
Administrative and Management Staff 1,704 4.3% 88,310 4.6%
Nursing Staff 25,627 64.9% 1,272,869 65.6%
Therapy Staff 2,173 5.5% 81,763 4.2%
Food Services Staff 4,024 10.2% 222,547 11.5%
Housekeeping and Maintenance Staff 4,624 11.7% 188,484 9.7%
Social Services and Activities Staff 1,358 3.4% 86,846 4.5%
Nursing Staff 25,627 100.0% 1,272,869 100.0%
Director of Nursing (DON) 308 1.2% 15,470 1.2%
RN with Administrative Duties (ARN) 520 2.0% 36,417 2.9%
Staff Registered Nurse (RN) 1,360 5.3% 121,234 9.5%
Licensed Practical Nurse (LPN) 6,425 25.1% 255,409 20.1%
Certified Nurse Assistant (CNA) 14,913 58.2% 741,752 58.3%
Other Nursing Staff 1,824 7.1% 90,847 7.1%
Retention, Turnover, and Vacancy Rates of Nursing Facility Employees
by Job Category and Nursing Job Position, 2010
RETENTION RATE TURNOVER RATE VACANCY RATE
STATE U.S. STATE U.S. STATE U.S.
All Nursing Facility Employees 55.3% 55.1% 29.3% 35.1% 3.1% 4.2%
Administrative and Management Staff 74.5% 71.9% 14.2% 18.0% 1.0% 1.8%
Nursing Staff 49.6% 51.4% 35.9% 39.5% 3.6% 4.9%
Therapy Staff 67.2% 65.7% 12.0% 25.7% 3.0% 3.8%
Food Services Staff 60.9% 55.3% 23.1% 33.7% 2.2% 3.3%
Housekeeping and Maintenance Staff 69.6% 65.2% 17.2% 24.3% 2.1% 2.6%
Social Services and Activities Staff 73.6% 66.5% 12.4% 22.5% 1.4% 2.8%
Nursing Staff
Director of Nursing (DON) 62.1% 64.1% 24.7% 26.0% 4.1% 3.9%
RN with Administrative Duties (ARN) 45.5% 56.2% 31.7% 28.9% 5.8% 4.5%
Staff Registered Nurse (RN) 50.9% 49.5% 27.6% 41.0% 5.2% 7.0%
Licensed Practical Nurse (LPN) 55.9% 56.0% 27.1% 34.7% 2.5% 4.3%
Certified Nurse Assistant (CNA) 46.6% 49.0% 40.7% 42.6% 4.1% 5.1%
All retention, turnover and vacancy statistics were produced by AHCA using data from 2010 AHCA Nursing Facility Staffing Survey.
*May not add due to rounding.

REPORT OF FINDINGS 2010 NURSING FACILITY STAFFING SURVEY, APPEDIX B
TEXAS
Estimated Number and Percentage* of Nursing Facility Employees
by Job Category and Nursing Job Position, 2010
STATE UNITED STATES
All Nursing Facility Employees 115,224 100.0% 1,940,818 100.0%
Administrative and Management Staff 6,128 5.3% 88,310 4.6%
Nursing Staff 76,590 66.5% 1,272,869 65.6%
Therapy Staff 5,491 4.8% 81,763 4.2%
Food Services Staff 12,644 11.0% 222,547 11.5%
Housekeeping and Maintenance Staff 10,788 9.4% 188,484 9.7%
Social Services and Activities Staff 3,583 3.1% 86,846 4.5%
Nursing Staff 76,590 100.0% 1,272,869 100.0%
Director of Nursing (DON) 1,140 1.5% 15,470 1.2%
RN with Administrative Duties (ARN) 691 0.9% 36,417 2.9%
Staff Registered Nurse (RN) 4,166 5.4% 121,234 9.5%
Licensed Practical Nurse (LPN) 18,702 24.4% 255,409 20.1%
Certified Nurse Assistant (CNA) 43,717 57.1% 741,752 58.3%
Other Nursing Staff 6,764 8.8% 90,847 7.1%
Retention, Turnover, and Vacancy Rates of Nursing Facility Employees
by Job Category and Nursing Job Position, 2010
RETENTION RATE TURNOVER RATE VACANCY RATE
STATE U.S. STATE U.S. STATE U.S.
All Nursing Facility Employees 38.0% 55.1% 63.8% 35.1% 7.3% 4.2%
Administrative and Management Staff 56.9% 71.9% 29.3% 18.0% 3.8% 1.8%
Nursing Staff 34.3% 51.4% 72.0% 39.5% 9.1% 4.9%
Therapy Staff 55.2% 65.7% 27.4% 25.7% 7.3% 3.8%
Food Services Staff 40.4% 55.3% 56.3% 33.7% 3.2% 3.3%
Housekeeping and Maintenance Staff 43.6% 65.2% 60.3% 24.3% 2.2% 2.6%
Social Services and Activities Staff 51.1% 66.5% 41.2% 22.5% 1.3% 2.8%
Nursing Staff
Director of Nursing (DON) 43.2% 64.1% 56.0% 26.0% 8.9% 3.9%
RN with Administrative Duties (ARN) 47.3% 56.2% 43.6% 28.9% 12.8% 4.5%
Staff Registered Nurse (RN) 35.1% 49.5% 57.1% 41.0% 21.9% 7.0%
Licensed Practical Nurse (LPN) 36.0% 56.0% 63.6% 34.7% 6.1% 4.3%
Certified Nurse Assistant (CNA) 31.1% 49.0% 80.3% 42.6% 8.0% 5.1%
All retention, turnover and vacancy statistics were produced by AHCA using data from 2010 AHCA Nursing Facility Staffing Survey.
*May not add due to rounding.

REPORT OF FINDINGS 2010 NURSING FACILITY STAFFING SURVEY, APPEDIX B
UTAH
Estimated Number and Percentage* of Nursing Facility Employees
by Job Category and Nursing Job Position, 2010
STATE UNITED STATES
All Nursing Facility Employees 10,244 100.0% 1,940,818 100.0%
Administrative and Management Staff 594 5.8% 88,310 4.6%
Nursing Staff 5,975 58.3% 1,272,869 65.6%
Therapy Staff 1,277 12.5% 81,763 4.2%
Food Services Staff 1,061 10.4% 222,547 11.5%
Housekeeping and Maintenance Staff 878 8.6% 188,484 9.7%
Social Services and Activities Staff 459 4.5% 86,846 4.5%
Nursing Staff 5,975 100.0% 1,272,869 100.0%
Director of Nursing (DON) 97 1.6% 15,470 1.2%
RN with Administrative Duties (ARN) 97 1.6% 36,417 2.9%
Staff Registered Nurse (RN) 986 16.5% 121,234 9.5%
Licensed Practical Nurse (LPN) 682 11.4% 255,409 20.1%
Certified Nurse Assistant (CNA) 3,480 58.2% 741,752 58.3%
Other Nursing Staff 580 9.7% 90,847 7.1%
Retention, Turnover, and Vacancy Rates of Nursing Facility Employees
by Job Category and Nursing Job Position, 2010
RETENTION RATE TURNOVER RATE VACANCY RATE
STATE U.S. STATE U.S. STATE U.S.
All Nursing Facility Employees 45.1% 55.1% 43.8% 35.1% 1.3% 4.2%
Administrative and Management Staff 74.9% 71.9% 15.1% 18.0% 1.6% 1.8%
Nursing Staff 40.5% 51.4% 52.8% 39.5% 1.1% 4.9%
Therapy Staff 50.0% 65.7% 20.9% 25.7% 2.1% 3.8%
Food Services Staff 42.1% 55.3% 50.6% 33.7% 2.5% 3.3%
Housekeeping and Maintenance Staff 53.9% 65.2% 36.6% 24.3% 0.8% 2.6%
Social Services and Activities Staff 59.5% 66.5% 25.5% 22.5% 0.0% 2.8%
Nursing Staff
Director of Nursing (DON) 53.8% 64.1% 18.2% 26.0% 0.0% 3.9%
RN with Administrative Duties (ARN) 87.5% 56.2% 6.7% 28.9% 0.0% 4.5%
Staff Registered Nurse (RN) 44.7% 49.5% 44.8% 41.0% 0.0% 7.0%
Licensed Practical Nurse (LPN) 50.5% 56.0% 41.8% 34.7% 2.2% 4.3%
Certified Nurse Assistant (CNA) 34.9% 49.0% 61.3% 42.6% 1.5% 5.1%
All retention, turnover and vacancy statistics were produced by AHCA using data from 2010 AHCA Nursing Facility Staffing Survey.
*May not add due to rounding.

REPORT OF FINDINGS 2010 NURSING FACILITY STAFFING SURVEY, APPEDIX B
VIRGINIA
Estimated Number and Percentage* of Nursing Facility Employees
by Job Category and Nursing Job Position, 2010
STATE UNITED STATES
All Nursing Facility Employees 40,085 100.0% 1,940,818 100.0%
Administrative and Management Staff 2,357 5.9% 88,310 4.6%
Nursing Staff 26,969 67.3% 1,272,869 65.6%
Therapy Staff 1,321 3.3% 81,763 4.2%
Food Services Staff 4,404 11.0% 222,547 11.5%
Housekeeping and Maintenance Staff 3,504 8.7% 188,484 9.7%
Social Services and Activities Staff 1,532 3.8% 86,846 4.5%
Nursing Staff 26,969 100.0% 1,272,869 100.0%
Director of Nursing (DON) 284 1.1% 15,470 1.2%
RN with Administrative Duties (ARN) 1,001 3.7% 36,417 2.9%
Staff Registered Nurse (RN) 1,553 5.8% 121,234 9.5%
Licensed Practical Nurse (LPN) 7,180 26.6% 255,409 20.1%
Certified Nurse Assistant (CNA) 15,294 56.7% 741,752 58.3%
Other Nursing Staff 1,410 5.2% 90,847 7.1%
Retention, Turnover, and Vacancy Rates of Nursing Facility Employees
by Job Category and Nursing Job Position, 2010
RETENTION RATE TURNOVER RATE VACANCY RATE
STATE U.S. STATE U.S. STATE U.S.
All Nursing Facility Employees 57.9% 55.1% 31.6% 35.1% 6.2% 4.2%
Administrative and Management Staff 76.1% 71.9% 13.8% 18.0% 1.8% 1.8%
Nursing Staff 53.5% 51.4% 37.6% 39.5% 6.6% 4.9%
Therapy Staff 70.2% 65.7% 21.0% 25.7% 6.0% 3.8%
Food Services Staff 62.2% 55.3% 23.3% 33.7% 7.7% 3.3%
Housekeeping and Maintenance Staff 72.0% 65.2% 16.5% 24.3% 4.6% 2.6%
Social Services and Activities Staff 65.4% 66.5% 21.7% 22.5% 4.3% 2.8%
Nursing Staff
Director of Nursing (DON) 88.0% 64.1% 2.0% 26.0% 2.4% 3.9%
RN with Administrative Duties (ARN) 50.5% 56.2% 33.8% 28.9% 7.4% 4.5%
Staff Registered Nurse (RN) 50.9% 49.5% 39.8% 41.0% 11.6% 7.0%
Licensed Practical Nurse (LPN) 56.2% 56.0% 37.5% 34.7% 6.1% 4.3%
Certified Nurse Assistant (CNA) 51.3% 49.0% 38.8% 42.6% 6.8% 5.1%
All retention, turnover and vacancy statistics were produced by AHCA using data from 2010 AHCA Nursing Facility Staffing Survey.
*May not add due to rounding.

REPORT OF FINDINGS 2010 NURSING FACILITY STAFFING SURVEY, APPEDIX B
VERMONT
Estimated Number and Percentage* of Nursing Facility Employees
by Job Category and Nursing Job Position, 2010
STATE UNITED STATES
All Nursing Facility Employees 5,089 100.0% 1,940,818 100.0%
Administrative and Management Staff 196 3.9% 88,310 4.6%
Nursing Staff 3,190 62.7% 1,272,869 65.6%
Therapy Staff 247 4.9% 81,763 4.2%
Food Services Staff 684 13.4% 222,547 11.5%
Housekeeping and Maintenance Staff 514 10.1% 188,484 9.7%
Social Services and Activities Staff 257 5.0% 86,846 4.5%
Nursing Staff 3,190 100.0% 1,272,869 100.0%
Director of Nursing (DON) 48 1.5% 15,470 1.2%
RN with Administrative Duties (ARN) 100 3.1% 36,417 2.9%
Staff Registered Nurse (RN) 502 15.7% 121,234 9.5%
Licensed Practical Nurse (LPN) 491 15.4% 255,409 20.1%
Certified Nurse Assistant (CNA) 1,756 55.1% 741,752 58.3%
Other Nursing Staff 280 8.8% 90,847 7.1%
Retention, Turnover, and Vacancy Rates of Nursing Facility Employees
by Job Category and Nursing Job Position, 2010
RETENTION RATE TURNOVER RATE VACANCY RATE
STATE U.S. STATE U.S. STATE U.S.
All Nursing Facility Employees 49.1% 55.1% 30.9% 35.1% 6.5% 4.2%
Administrative and Management Staff 68.4% 71.9% 5.6% 18.0% 6.4% 1.8%
Nursing Staff 45.9% 51.4% 32.6% 39.5% 8.0% 4.9%
Therapy Staff 56.4% 65.7% 27.3% 25.7% 10.8% 3.8%
Food Services Staff 48.7% 55.3% 44.1% 33.7% 2.3% 3.3%
Housekeeping and Maintenance Staff 54.8% 65.2% 23.3% 24.3% 3.0% 2.6%
Social Services and Activities Staff 62.1% 66.5% 12.7% 22.5% 0.0% 2.8%
Nursing Staff
Director of Nursing (DON) 61.5% 64.1% 8.3% 26.0% 0.0% 3.9%
RN with Administrative Duties (ARN) 59.1% 56.2% 10.0% 28.9% 5.3% 4.5%
Staff Registered Nurse (RN) 45.2% 49.5% 28.3% 41.0% 17.6% 7.0%
Licensed Practical Nurse (LPN) 52.9% 56.0% 25.9% 34.7% 4.5% 4.3%
Certified Nurse Assistant (CNA) 42.5% 49.0% 41.8% 42.6% 8.5% 5.1%
All retention, turnover and vacancy statistics were produced by AHCA using data from 2010 AHCA Nursing Facility Staffing Survey.
*May not add due to rounding.

REPORT OF FINDINGS 2010 NURSING FACILITY STAFFING SURVEY, APPEDIX B
WASHINGTON
Estimated Number and Percentage* of Nursing Facility Employees
by Job Category and Nursing Job Position, 2010
STATE UNITED STATES
All Nursing Facility Employees 27,444 100.0% 1,940,818 100.0%
Administrative and Management Staff 1,321 4.8% 88,310 4.6%
Nursing Staff 17,561 64.0% 1,272,869 65.6%
Therapy Staff 1,831 6.7% 81,763 4.2%
Food Services Staff 2,750 10.0% 222,547 11.5%
Housekeeping and Maintenance Staff 2,702 9.8% 188,484 9.7%
Social Services and Activities Staff 1,280 4.7% 86,846 4.5%
Nursing Staff 17,561 100.0% 1,272,869 100.0%
Director of Nursing (DON) 236 1.3% 15,470 1.2%
RN with Administrative Duties (ARN) 385 2.2% 36,417 2.9%
Staff Registered Nurse (RN) 2,309 13.1% 121,234 9.5%
Licensed Practical Nurse (LPN) 3,061 17.4% 255,409 20.1%
Certified Nurse Assistant (CNA) 10,027 57.1% 741,752 58.3%
Other Nursing Staff 1,446 8.2% 90,847 7.1%
Retention, Turnover, and Vacancy Rates of Nursing Facility Employees
by Job Category and Nursing Job Position, 2010
RETENTION RATE TURNOVER RATE VACANCY RATE
STATE U.S. STATE U.S. STATE U.S.
All Nursing Facility Employees 51.5% 55.1% 45.0% 35.1% 6.0% 4.2%
Administrative and Management Staff 71.1% 71.9% 23.5% 18.0% 6.7% 1.8%
Nursing Staff 46.7% 51.4% 52.1% 39.5% 6.9% 4.9%
Therapy Staff 66.6% 65.7% 23.4% 25.7% 8.4% 3.8%
Food Services Staff 52.3% 55.3% 40.5% 33.7% 2.2% 3.3%
Housekeeping and Maintenance Staff 61.7% 65.2% 33.6% 24.3% 2.7% 2.6%
Social Services and Activities Staff 64.9% 66.5% 35.1% 22.5% 2.5% 2.8%
Nursing Staff
Director of Nursing (DON) 72.5% 64.1% 25.0% 26.0% 4.3% 3.9%
RN with Administrative Duties (ARN) 59.4% 56.2% 27.8% 28.9% 10.0% 4.5%
Staff Registered Nurse (RN) 45.1% 49.5% 54.6% 41.0% 5.2% 7.0%
Licensed Practical Nurse (LPN) 54.8% 56.0% 45.6% 34.7% 6.9% 4.3%
Certified Nurse Assistant (CNA) 45.8% 49.0% 50.5% 42.6% 6.0% 5.1%
All retention, turnover and vacancy statistics were produced by AHCA using data from 2010 AHCA Nursing Facility Staffing Survey.
*May not add due to rounding.

REPORT OF FINDINGS 2010 NURSING FACILITY STAFFING SURVEY, APPEDIX B
WISCONSIN
Estimated Number and Percentage* of Nursing Facility Employees
by Job Category and Nursing Job Position, 2010
STATE UNITED STATES
All Nursing Facility Employees 45,453 100.0% 1,940,818 100.0%
Administrative and Management Staff 2,004 4.4% 88,310 4.6%
Nursing Staff 30,690 67.5% 1,272,869 65.6%
Therapy Staff 1,419 3.1% 81,763 4.2%
Food Services Staff 5,672 12.5% 222,547 11.5%
Housekeeping and Maintenance Staff 3,339 7.3% 188,484 9.7%
Social Services and Activities Staff 2,329 5.1% 86,846 4.5%
Nursing Staff 30,690 100.0% 1,272,869 100.0%
Director of Nursing (DON) 385 1.3% 15,470 1.2%
RN with Administrative Duties (ARN) 1,416 4.6% 36,417 2.9%
Staff Registered Nurse (RN) 3,715 12.1% 121,234 9.5%
Licensed Practical Nurse (LPN) 4,349 14.2% 255,409 20.1%
Certified Nurse Assistant (CNA) 18,902 61.6% 741,752 58.3%
Other Nursing Staff 1,720 5.6% 90,847 7.1%
Retention, Turnover, and Vacancy Rates of Nursing Facility Employees
by Job Category and Nursing Job Position, 2010
RETENTION RATE TURNOVER RATE VACANCY RATE
STATE U.S. STATE U.S. STATE U.S.
All Nursing Facility Employees 56.9% 55.1% 32.9% 35.1% 4.4% 4.2%
Administrative and Management Staff 74.7% 71.9% 15.7% 18.0% 2.4% 1.8%
Nursing Staff 53.5% 51.4% 37.3% 39.5% 5.0% 4.9%
Therapy Staff 74.6% 65.7% 11.6% 25.7% 2.6% 3.8%
Food Services Staff 56.2% 55.3% 32.1% 33.7% 2.5% 3.3%
Housekeeping and Maintenance Staff 70.1% 65.2% 19.8% 24.3% 3.1% 2.6%
Social Services and Activities Staff 66.4% 66.5% 23.8% 22.5% 5.7% 2.8%
Nursing Staff
Director of Nursing (DON) 62.6% 64.1% 32.4% 26.0% 5.6% 3.9%
RN with Administrative Duties (ARN) 56.6% 56.2% 30.5% 28.9% 2.3% 4.5%
Staff Registered Nurse (RN) 49.3% 49.5% 39.3% 41.0% 5.0% 7.0%
Licensed Practical Nurse (LPN) 59.1% 56.0% 36.1% 34.7% 3.0% 4.3%
Certified Nurse Assistant (CNA) 51.6% 49.0% 38.9% 42.6% 5.8% 5.1%
All retention, turnover and vacancy statistics were produced by AHCA using data from 2010 AHCA Nursing Facility Staffing Survey.
*May not add due to rounding.

REPORT OF FINDINGS 2010 NURSING FACILITY STAFFING SURVEY, APPEDIX B
WEST VIRGINIA
Estimated Number and Percentage* of Nursing Facility Employees
by Job Category and Nursing Job Position, 2010
STATE UNITED STATES
All Nursing Facility Employees 12,835 100.0% 1,940,818 100.0%
Administrative and Management Staff 535 4.2% 88,310 4.6%
Nursing Staff 8,282 64.5% 1,272,869 65.6%
Therapy Staff 584 4.6% 81,763 4.2%
Food Services Staff 1,312 10.2% 222,547 11.5%
Housekeeping and Maintenance Staff 1,498 11.7% 188,484 9.7%
Social Services and Activities Staff 624 4.9% 86,846 4.5%
Nursing Staff 8,282 100.0% 1,272,869 100.0%
Director of Nursing (DON) 124 1.5% 15,470 1.2%
RN with Administrative Duties (ARN) 191 2.3% 36,417 2.9%
Staff Registered Nurse (RN) 788 9.5% 121,234 9.5%
Licensed Practical Nurse (LPN) 1,641 19.8% 255,409 20.1%
Certified Nurse Assistant (CNA) 4,567 55.2% 741,752 58.3%
Other Nursing Staff 839 10.1% 90,847 7.1%
Retention, Turnover, and Vacancy Rates of Nursing Facility Employees
by Job Category and Nursing Job Position, 2010
RETENTION RATE TURNOVER RATE VACANCY RATE
STATE U.S. STATE U.S. STATE U.S.
All Nursing Facility Employees 50.9% 55.1% 49.4% 35.1% 4.1% 4.2%
Administrative and Management Staff 70.6% 71.9% 22.2% 18.0% 2.8% 1.8%
Nursing Staff 47.8% 51.4% 54.4% 39.5% 5.2% 4.9%
Therapy Staff 48.5% 65.7% 52.0% 25.7% 1.0% 3.8%
Food Services Staff 51.1% 55.3% 53.1% 33.7% 1.9% 3.3%
Housekeeping and Maintenance Staff 63.7% 65.2% 31.4% 24.3% 2.0% 2.6%
Social Services and Activities Staff 54.8% 66.5% 39.8% 22.5% 1.6% 2.8%
Nursing Staff
Director of Nursing (DON) 59.7% 64.1% 26.3% 26.0% 0.0% 3.9%
RN with Administrative Duties (ARN) 44.3% 56.2% 46.3% 28.9% 14.0% 4.5%
Staff Registered Nurse (RN) 35.8% 49.5% 66.1% 41.0% 18.4% 7.0%
Licensed Practical Nurse (LPN) 56.5% 56.0% 43.4% 34.7% 1.9% 4.3%
Certified Nurse Assistant (CNA) 46.5% 49.0% 59.7% 42.6% 5.9% 5.1%
All retention, turnover and vacancy statistics were produced by AHCA using data from 2010 AHCA Nursing Facility Staffing Survey.
*May not add due to rounding.

REPORT OF FINDINGS 2010 NURSING FACILITY STAFFING SURVEY, APPEDIX B
WYOMING
Estimated Number and Percentage* of Nursing Facility Employees
by Job Category and Nursing Job Position, 2010
STATE UNITED STATES
All Nursing Facility Employees 3,243 100.0% 1,940,818 100.0%
Administrative and Management Staff 267 8.2% 88,310 4.6%
Nursing Staff 1,976 60.9% 1,272,869 65.6%
Therapy Staff 0 0.0% 81,763 4.2%
Food Services Staff 456 14.1% 222,547 11.5%
Housekeeping and Maintenance Staff 376 11.6% 188,484 9.7%
Social Services and Activities Staff 168 5.2% 86,846 4.5%
Nursing Staff 1,976 100.0% 1,272,869 100.0%
Director of Nursing (DON) 43 2.2% 15,470 1.2%
RN with Administrative Duties (ARN) 25 1.3% 36,417 2.9%
Staff Registered Nurse (RN) 418 21.2% 121,234 9.5%
Licensed Practical Nurse (LPN) 241 12.2% 255,409 20.1%
Certified Nurse Assistant (CNA) 907 45.9% 741,752 58.3%
Other Nursing Staff 334 16.9% 90,847 7.1%
Retention, Turnover, and Vacancy Rates of Nursing Facility Employees
by Job Category and Nursing Job Position, 2010
RETENTION RATE TURNOVER RATE VACANCY RATE
STATE U.S. STATE U.S. STATE U.S.
All Nursing Facility Employees 50.5% 55.1% 39.0% 35.1% 7.6% 4.2%
Administrative and Management Staff 94.5% 71.9% 2.8% 18.0% 0.0% 1.8%
Nursing Staff 41.6% 51.4% 49.7% 39.5% 11.7% 4.9%
Therapy Staff . 65.7% . 25.7% . 3.8%
Food Services Staff 59.6% 55.3% 23.6% 33.7% 0.0% 3.3%
Housekeeping and Maintenance Staff 60.9% 65.2% 34.7% 24.3% 1.7% 2.6%
Social Services and Activities Staff 69.0% 66.5% 22.8% 22.5% 0.0% 2.8%
Nursing Staff
Director of Nursing (DON) 87.5% 64.1% 0.0% 26.0% 0.0% 3.9%
RN with Administrative Duties (ARN) 100.0% 56.2% 0.0% 28.9% 0.0% 4.5%
Staff Registered Nurse (RN) 56.7% 49.5% 26.0% 41.0% 7.6% 7.0%
Licensed Practical Nurse (LPN) 49.0% 56.0% 28.9% 34.7% 6.1% 4.3%
Certified Nurse Assistant (CNA) 35.7% 49.0% 74.3% 42.6% 17.9% 5.1%
All retention, turnover and vacancy statistics were produced by AHCA using data from 2010 AHCA Nursing Facility Staffing Survey.
*May not add due to rounding.