improving nursing staffing methodology and nursing
TRANSCRIPT

Himmelfarb Health Sciences Library, The George Washington UniversityHealth Sciences Research Commons
Doctor of Nursing Practice Projects Nursing
Spring 2019
Improving Nursing Staffing Methodology andNursing Sensitive Outcomes with the Addition of aPatient Centered Acuity MeasureDouglas C. Howard RN, MS, NE-BCGeorge Washington University
Follow this and additional works at: https://hsrc.himmelfarb.gwu.edu/son_dnp
Part of the Health and Medical Administration Commons, and the Nursing AdministrationCommons
This DNP Project is brought to you for free and open access by the Nursing at Health Sciences Research Commons. It has been accepted for inclusionin Doctor of Nursing Practice Projects by an authorized administrator of Health Sciences Research Commons. For more information, please [email protected].
Recommended CitationHoward, D. C. (2019). Improving Nursing Staffing Methodology and Nursing Sensitive Outcomes with the Addition of a PatientCentered Acuity Measure. , (). Retrieved from https://hsrc.himmelfarb.gwu.edu/son_dnp/43

Running Head: TROUBLED OUTCOME RISK, NURSE STAFFING
Improving Nursing Staffing Methodology and Nursing Sensitive Outcomes with the Addition of
a Patient Centered Acuity Measure
Presented to the Faculty of the School of Nursing
The George Washington University
In partial fulfillment of the
requirements for the degree of
Doctor of Nursing Practice
Douglas C. Howard, RN, MS, NE-BC
DNP Project Team
Pearl Zhou, RN, PhD
Karen Whitt, PhD, FNP-C, AGN-BC
Date of Degree May 2019

2
Abstract
Background: Assigning the correct nursing resources to hospitalized patients positively
impacts patient outcomes. The current process for matching nurses to patients is highly variable
and involves a combination of simple ratios, historical workload data, and expert opinion but
lacks objective measurement of the patient’s condition. Objectives: This project evaluated
change in selected quality indicators and the daily unit-level management of nursing resources
after implementing the Troubled Outcome Risk (TOR) into existing nursing staffing
methodology in a Department of Veterans Affairs hospital. Methods: TOR provides objective
measurement of individual patient allostatic load. Daily calculation of TOR scores for each
patient on the study unit and nursing staffing methodology were used by charge nurses to
determine assignments. Nursing sensitive indicators including length of stay, transfers to
intensive care unit, hospital acquired pressure ulcer (HAPU), 30-day readmissions, and nursing
surveillance indicators including rapid response team activation and cardiac arrests were
compared before and after implementing TOR. Results: There was a reduction of HAPU rates
that exceeded the stated goal after implementation of TOR. Other indicators did not meet project
goals. Prior to implementation of TOR, nurse assignments clustered in specific locations; after
implementation 16.7% were without regard to location. None of the results were statistically
significant; yet we observed a small-medium effect size between intervention and assignment
change. Conclusions: The implementation of TOR did not result in significant differences in
nursing sensitive outcomes, however charge nurses appear to have changed staff nurse
assignments using TOR as an addition to existing methodology. Future study with a larger
sample over a longer period of time may yield different results.
3
Problem Statement and Background
Nursing leadership desires to match nursing resources with patient need in the most
efficient and cost-effective manner while simultaneously providing the highest standard of care.
Nurse staffing has four distinct stages: budgeting, scheduling, rescheduling and assignment
(Acar & Butt, 2016; Punnakitikashem, 2007). Budgeting and scheduling are high level processes
that project nurse resources in the future, and are well understood. In contrast, rescheduling
occurs in real time because of changes in patient load or available staff, and assignment is the
purview of the unit level charge nurse matching patients to specific nursing staff (Acar & Butt,
2016). These two components essentially happen at the point of execution with the least
experienced management level staff, but are arguably the most critical to patient outcomes.
There are multiple methods with high variability used to make these decisions, but most
require the nursing leader to determine which patients are “average,” then assign resources based
on deviations from average using their unique clinical judgement. Similarly, regarding direct
patient care, expert clinicians develop the ability to see a complete picture in which only small
parts are relevant; novices see the complete picture as a series of equally important parts
(Benner, 1984). Gladwell (2005) describes this expert ability as “thin slicing.” When applied to
typical nurse staffing methodologies, expert nurse leaders will make different decisions than
novice leaders creating a disparity depending on the level of experience and adding undesirable
variability. The Department of Veterans Affairs uses a program called the Nurse Staffing
Methodology which uses expert nurses at both the unit and facility level to determine the
budgeting and scheduling components of the nurse staffing process. The outcome of this process
is an average of nurse hours per patient day (NHPPD) which nurse managers use to develop

4 schedules. The process of rescheduling and assignment occurs at the charge nurse level on each
shift, and uses NHPPD as a guideline on how to assign the correct nurse with the correct number
of patients. Missing from the equation is an objective measure of the individual patient’s actual
acuity.
Purpose
The purpose of this project was to assess if implementation of the Troubled Outcome
Risk (TOR) patient acuity measure with existing Nurse Staffing Methodology processes on a
mixed medical surgical unit at a Veterans Health Affairs (VHA) hospital impacted nursing
sensitive indicators.
Quality Improvement Objectives
We monitored quality indicators before and after the addition of the TOR patient acuity measure
to existing Nursing Staffing Methodology processes with the following goals:
• Reduce mixed medical surgical unit length of stay (LOS) by 0.5 days
• Reduce mixed medical surgical unit transfers to intensive care unit (ICU) by 10%
• Reduce mixed medical surgical unit hospital acquired pressure ulcer (HAPU) by
10%
• Reduce all cause 30-day readmissions by 10%
• Increase Rapid Response Team (RRT) mixed medical surgical unit activations by
10%
• Reduce mixed medical surgical unit cardiac arrest (code blue) activations by 10%

5
• Increase mixed medical surgical unit nursing staffing schedule flexibility
(measured by assignment to either room 4 or 8 and room 13 or 14 in the unit)
Significance
Current methods for determining the right supply of nurses to patient demand focus
primarily on the process of scheduling. Patient acuity measures used to help inform scheduling
are determined from historical averages for a particular unit. These averages are translated into a
workload measure such as NHPPD which drives the unit’s schedule and helps forecast
manpower needs and personnel budget. Each shift uses this projection to allocate specific
nursing resources to specific patients. If there are not enough resources projected, or there are
errors in allocating resources on the shift, length of stay, nosocomial infections, pressure ulcers,
and mortality rates all increase (Hill, 2017; Needleman, Buerhaus, Pankratz, Leibson, Stevens
and Harris, 2011; Cho, Ketefian, Barkauskas and Smith, 2003). Needleman et al (2011)
suggested that nurse staffing models that are dynamic enough to align nurses to patient needs and
census rather than static systems are preferable and could reduce unwanted outcomes. Both
Needleman et al (2011) and Hill (2017) suggest that patient acuity was the determining factor in
overall mortality.
This project introduced a patient-centered acuity measure, the Troubled Outcome Risk
(TOR), with the existing staffing methodology process in the Veterans Health Administration
(VHA). The TOR is a clinical decision support (CDS) tool designed to measure individual
patient’s acuity using readily available electronic medical record (EMR) data (Howard, 2016).
Current VHA staffing methodology involves essentially two steps: projections based on both

6 historical precedent, and expert opinion (VHA Directive 1351, 2017). This project added
objective and dynamic measurement of patient-specific acuity to the existing process.
Nurse staffing, specifically registered nurse (RN) hours per patient day, has been
associated with mortality. Needleman et al (2011) found that the risk of death in the hospital
increased for patients that were exposed to shifts that were 8 hours or more below daily target
unit level staffing. Cho et al (2003) found that each additional hour of RN time per patient day
decreased the odds of hospital acquired pneumonia, length of stay and mortality while increasing
the odds of HAPU. This increase in HAPU was thought to be related to an increase in skin
assessments and subsequent improved detection of HAPU by RNs (Cho et al 2003).
Excessive nursing workload has also been implicated as a factor in readmissions. Nurses
are responsible for conducting discharge planning, patient education and assessment of patient’s
knowledge of their disease process and plan of care, care coordination, and complication
surveillance (McHugh, Berez and Small, 2013). Similarly, Giuliano, Danesh and Funk (2016)
found that increased nurse staffing allowed nurses to identify changes in patient conditions that
required intervention, which facilitated transition to outpatient care, and positively impacted the
30-day readmission rate of heart failure patients.
Nursing surveillance combines routine patient monitoring activities with acute
observation, analysis and interpretation of objective data (Giuliano, 2017). Increased nurse
surveillance improves the ability to identify patients at risk for adverse events and intervene to
mitigate the risk (Giuliano, 2017). The use of nursing surveillance versus standard monitoring
showed a large difference in mean time to activation of RRT: 152 minutes for surveillance
versus 443 minutes for monitoring (Giuliano, 2017). When nursing surveillance was performed
7 12 or more times per day, there was a significant decrease in failure to rescue events when
compared to nursing surveillance performed less than 12 times per day (Fasolino and Verdin,
2015). Improvement in nurse resource allocation with the addition of a patient acuity measure
could improve nursing surveillance, leading to improved quality of care.
Literature Review
We conducted comprehensive literature searches to find relevant evidence. CINAHL
search for “nurse staffing” AND “acuity” yielded ninety results. PubMed search using the same
terms yielded 262 results, plus a second search using the terms “nurse scheduling” AND “acuity”
which yielded 159 results. When the exclusion criteria were applied removing obstetrics,
pediatrics, and articles not directly concerned with scheduling nurses to work on a particular shift
or the use of some identified measure of acuity and when duplicates were eliminated, seventeen
articles remained. From these seventeen articles, six contained studies relevant for this project.
An additional search using “nursing surveillance” yielded 41 results in CINAHL and 66,106
results in PubMed. This was refined to “nursing surveillance” AND “staffing” AND “English”
AND “patient outcomes” resulting in 231 results. From this sample, four additional articles were
selected using exclusion criteria from above with relevance to this project. Finally, a search
using PubMed with the search term “nursing surveillance” and “readmission” yielded 609 results
resulting in four additional articles. A total of 14 articles relevant to this project were identified
and reviewed.
In the literature, there are two important concepts regarding different nurse staffing
rubrics: equality and equity. Equality is a situation where everyone gets the same thing in the
same amount. Equity represents fairness and giving everyone what they need to be successful;

8 some require more resources to be on an equal footing with others (Kumar, 2017). In the context
of nurse staffing assignments, nurse to patient ratios are an example of equality, whereas
assignments made based on nurse skill, experience level and individual patient need are
examples of equity.
Efforts to improve safe staffing have primarily focused on mandated nurse to patient
ratios, but these efforts do little to incorporate the dynamic needs of individual patients (Gray
and Kerfoot, 2016). To provide a more accurate measurement for nurse staffing, factors such as
the geography of the unit, access to the EMR and patient acuity are required, however there is a
high level of variability between units making standardization impossible (Gray and Kerfoot,
2016). There is no standard for measuring patient acuity in hospitalized patients. There are also
challenges with patient acuity based staffing because of limitations in reporting tools that would
support staffing modifications throughout the shift (Gray & Kerfoot, 2016).
Myny et al (2012), defined workload as a function of time, complexity and volume of
interventions in a specific timeframe, and found poor consistency in the methods used to
determine nurse workload in their cross-sectional study. Different methods including use of
proxies for nursing workload such as NHPPD, midnight census, and nurse-to-patient ratios were
cited as examples indicating this inconsistency (Myny et al, 2012). When determining which
items most impacted nursing workload, Myny et al first did an integrative review involving focus
groups and found 94 different factors. From this, Myny et al regrouped the data into 28
measurable elements and using a self-administered questionnaire, queried 864 nurses on which
elements impacted staffing the most. Based on results of this questionnaire, interruptions were
found to have the highest impact, and they hypothesized that these interruptions had a serious
9 impact on the mental load of the nurse (Myny et al, 2012). A component of TOR is a measure of
individual patient complexity, which also impacts the mental load of the nurse.
Acar and Butt (2016) studied a 29-bed general medical/oncology unit in a 380-bed
hospital and using a direct observation method and personal digital assistant devices equipped
with work measurement software over a 12-week period. They identified 45 distinct nursing
activities which they analyzed for frequency in the daily workload. They found that when charge
nurses make daily assignments, they attempt to balance the workload by distributing acuity
evenly, and by minimizing the effect of other duties which interrupt workflow. Their system
involved assigning standard acuity scores based on special needs of patients such as isolation,
diabetic ketoacidosis, specialty high risk medication, laboratory trending, and status as a step-
down patient. The study concluded that using a mathematical programming technique could
generate a workload-balanced assignment result that rivaled charge nurse derived assignments
(Acar & Butt, 2016). Although the authors used a standard acuity score as opposed to a more
dynamic score like the TOR, they did find that this model could match skills used by experts
when determining nursing workload.
Garcia (2017) conducted a retrospective analysis of over 28,000 assessments in a 455-bed
hospital to describe variable acuity among a population of patients with heart failure to determine
if nursing assessments could be used for decision support related to staffing. Garcia found that
using a standard acuity measure for all patients and assuming uniform nursing skills (such as
implied by fixed nurse-to-patient ratios) make it difficult to plan for and calculate the cost of
nursing care for individual patients. This ultimately impacts budgeting and resourcing. Acuity
systems based on diagnosis, nursing tasks, etc. which are traditionally gathered manually are

10 both inefficient and subject to artificial increases in acuity scores over time. This study used a
proprietary EMR acuity measure in conjunction with a nursing taxonomy. The author found that
patients with congestive heart failure on general medical units had highly variable acuity, some
which rivaled acuity in critical care in some instances indicating that acuity should be measured
rather than assumed (Garcia, 2017).
Utilizing a combination of proprietary acuity calculation software with a specific set of
indicators, Sir, Dundar, Steege, and Pasupathy (2015) studied 45 staff nurses working in the
inpatient oncology and inpatient surgery units over a four-month period (over 5,000 patients) to
determine how acuity affected workload as perceived by staff nurses. They attempted to identify
associations between the acuity calculation software and perceived workload by individual
nurses, develop a process to characterize the associations, and develop a model using the
combination to generate workload balancing and nursing optimization outputs. Using a survey
in association with the software, they found that the impact of acuity on workload varied widely
between nurses; balancing workload based only on acuity did not actually change nurse’s
perception of a balanced workload, but the combination of acuity measure and survey measure
did effectively balance workload (Sir et al, 2015).
Giuliano, Danesh and Funk (2016) studied the impact of nurse staffing data on 30-day
readmissions for heart failure from 661 cardiology and heart surgery hospitals using a
comparison of the nurse staffing index to readmissions. The nurse staffing index includes both
in- and outpatient nursing full time equivalents divided by the adjusted average daily census.
The median staffing index was 1.5 in the sampled hospitals. The authors considered hospitals
with a staffing index of less than 1.5 as low staffing, and greater than 1.5 as high staffing.

11 Giuliano and colleagues found a significant difference (P=0.021) between the low and high
staffing hospitals, with the low staffing hospitals having a higher excess readmission rate for
patients with heart failure compared to those with high nurse staffing.
Several studies found increased rates of 30-day readmission for both surgical and medical
conditions if the patients were discharged to a nursing home rather than directly home (Ammori,
Navale, Schiltz and Koroukian, 2018; Jacobs, Noyes, Zhao, Gibson, Murphy, Sethi and Ochs-
Balcom, 2018; Ohnuma, Shinjo, Brookhart and Fushimi, 2018). Further, Fernandes-Taylor et al,
(2018) found that postoperative vascular surgery patients discharged to a skilled nursing facility
(SNF) had a higher likelihood of surgical wound infections, respiratory and gastrointestinal
complications and mortality. Fernandes-Taylor et al suggested that SNFs may be able to reduce
these complications through nursing intervention and surveillance activities such as early
identification of wound complications, mobilization, daily weights to assess fluid balance, and
deep breathing and incentive spirometry. They also observed that patients with mobility devices
(a surrogate for frailty) had a lower risk of wound infection and readmission due to the need for
greater nursing resources to accommodate their needs. More appropriate application of nursing
resources using a patient centric staffing methodology in hospitalized patients could identify
those needing additional nursing care and could prevent the need for nursing home transfer.
The literature review revealed several areas needing further study. Fixed ratios do help
ensure baseline staffing requirements, but do not fully address patient and nurse needs. Using
the concept of equity as opposed to equality may be a more accurate way of ensuring the right
staff assigned to the right patient. A standard measure for all patients such as an average acuity
for the ward does not effectively assess requirements because it does not consider how individual

12 patient conditions change over the course of their hospital stay. The process for setting basic
budget and manpower resources is better understood than the actual assignment and
reassignment of nurses by the charge nurse from shift to shift. Charge nurses learn by
experience to balance workload and consider both interruptions and skill level or expertise when
making assignments, but the process varies widely and lacks standardization. There is little
research done in this area. Consideration of how nurses themselves perceive the impact of acuity
on their individual patient assignments better balances workflow. Few if any studies have
evaluated using real-time patient acuity measures to determine nurse staffing, and the effects this
might have on nurse sensitive indicators.
Theoretical Foundation
The American Association of Critical Care Nurses (AACN) Synergy Model describes
characteristics of the patient, nurse, and system and how each contributes to outcomes (AACN,
2013). In describing characteristics of the patient, there are eight categories: resiliency,
vulnerability, stability, complexity, resource availability, participation in care, participation in
decision making, and predictability (Swickland, S. Swickland, W., Reimer, Lindell and
Winkelman, 2014). Characteristics of the nurse include: clinical judgment, advocacy and moral
agency, caring practices, collaboration, systems thinking, responding to diversity, facilitation of
learning, and clinical inquiry (Swickland et al, 2014). Finally, characteristics of the system
include outcomes of recidivism and cost/resource utilization (Swickland et al, 2014).
The AACN Synergy Model outlines a continuum from health to illness and recognizes
that all patients share similar needs across this continuum (AACN, 2013). The assumption in the
model is that the needs of the patient drive nursing practice, and as a result, the nurse is required

13 to have competencies across the dimensions of the whole patient to provide the most effective
patient care (AACN, 2013). Nurse characteristics serve to synergize practice to address the
whole patient (AACN, 2013).
The TOR algorithm was designed using the first four patient characteristics from the
AACN Synergy Model: resiliency, vulnerability, stability, and complexity and includes
evidence-based objective data points for each characteristic. Resiliency is defined as the
capacity to return to higher function after insult; vulnerability is susceptibility to stressors;
stability is the ability to maintain equilibrium; and complexity is the entanglement of two or
more systems (Howard, 2016).
This QI project connected the four characteristics measured by TOR with characteristics
of the nurse and system. Nurse characteristics germane to the study are: clinical judgment,
systems thinking, and clinical inquiry. Clinical judgment can be enhanced with experience or
CDS tools such as TOR. Because the whole patient must be considered when planning and
executing nursing care, TOR was used to measure the patient’s unique allostatic load which is
measured by the four patient characteristics from the AACN Synergy Model. This concept
reinforces the nurse’s ability to use systems thinking. Clinical inquiry results from the
knowledge of these two characteristics allowing the nurse to plan and execute patient-centered
interventions to improve patient outcomes.
The system characteristics of outcomes and resource utilization are both of interest. The
impact of appropriate nursing resources on patient outcomes is well understood (Hill, 2017;
Needleman et al, 2011; Cho et al 2003). The VHA Nurse Staffing Methodology is a resource
allocation strategy designed to provide appropriate nursing staff to the appropriate patients
14 thereby improving patient outcomes. This QI project aimed to enhance this resource allocation
strategy with both patient and nurse characteristics described above.
Methods
The design was a quality improvement (QI) initiative approved by the Veterans
Administration (VA) Center for Innovation under the Spark-Seed-Spread Innovation Investment
program. Historical, retrospective quarterly data on both quality indicators and nursing
surveillance indicators were collected before the implementation of TOR and for the quarter after
TOR implementation. Where possible, quarterly data was collected from a similar time period to
correct for seasonal changes in patient population.
Variables
The variables and clinical characteristics collected for the study are: Mixed medical
surgical unit LOS (number of inpatient days divided by the number of discharged patients for
both medical patients and surgical patients); mixed medical surgical unit transfers to intensive
care unit (ICU) (percent mortality); mixed medical surgical unit HAPU (percent of patients with
2+ greater than 48 hours LOS), all cause 30-day readmissions (percent of patients readmitted).
These data were monitored through the VHA Support Service Center (VSSC) database (Table 1)
comparing similar quarters from the previous and current fiscal year. RRT activations from
mixed medical surgical unit (number per month), and cardiac arrests rates from the mixed
medical surgical unit (number per month) were collected by the facility locally (Table 1). In
addition, daily charge nurse staffing sheets which include details about the patient, room number,
and nurse assigned were collected prior to implementation. These were collected through the
implementation period and retrospectively assessed for increased staffing flexibility. Staffing

15 flexibility was measured by assignment of the nurse to either room 4 or 8 and room 13 or 14 on
the charge nurse staffing sheets.
Sample
This QI initiative used data from all adult patients (>=18 years of age) in a 15-bed adult
inpatient medical/surgical unit at a VHA hospital. Patients with obstetric and psychiatric
admissions were excluded. Quality indicators were aggregated number of events with
timeframes as follows: LOS-quarterly; Transfers to ICU-quarterly; HAPU-quarterly; 30-day
readmissions -quarterly; RRT activations-monthly; Code Blue-monthly; mixed medical surgical
unit staffing sheets-each shift.
Intervention
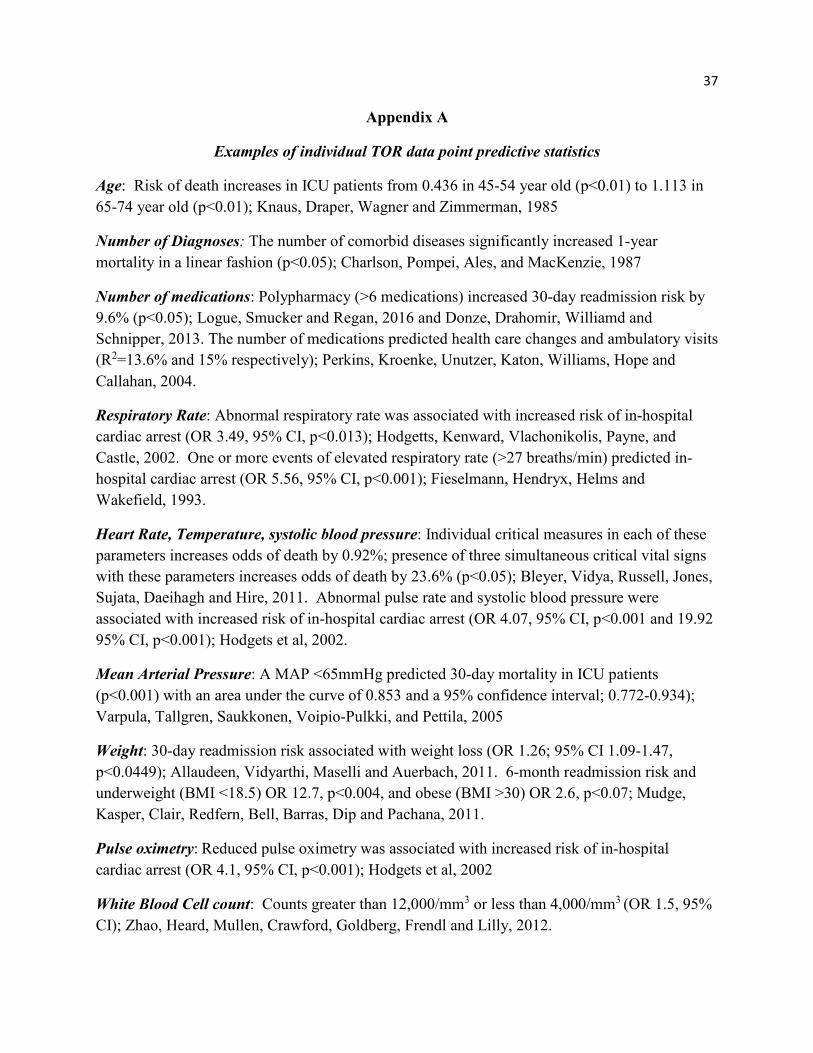
The intervention is TOR, a CDS which uses twenty-four disparate data points from the
electronic medical record (EMR) in adult hospital patients as objective measures for the four
elements of complexity, stability, vulnerability, and resiliency. Each of the data points have been
used in other studies, and a sample of the relevant predictive statistics is in Appendix A.
Homeostasis describes body system’s ability to reduce variability and maintain a steady
environment through homeostatic processes (Logan & Barksdale, 2008). An extension of
homeostasis is allostasis, or the physiological adaptations that occur to maintain stability of the
system in response to challenges to the system (Logan & Barksdale, 2008). Allostatic load is the
point where the system is unable to adapt to the challenges because the load is too great, or
systems are failing (Logan & Barksdale, 2008). Objective measurement of allostatic load
described by Seeman, Singer, Rowe, Horwitz and McEwen, (1997) involves ten individual
indicators representing wear and tear on different systems: cardiovascular activity, adipose

16 deposition, atherosclerotic risk, glucose metabolism, hypothalamic-pituitary-adrenal (HPA) axis,
and sympathetic nervous system activity. Measurement of multisystem functioning using
biomarkers indicating subclinical symptoms instead of clinical diagnoses was more predictive in
mortality and declining physical functioning in elderly patients (Mauss, Li, Schmidt, Angerer
and Jarczok, 2015).
The TOR was developed to provide a measure of the complex interplay between
physiologic systems and their impact on the individual patient. TOR data represent a snapshot of
major metabolic, hematopoietic, and inflammatory processes, plus direct measures of physical
processes and processes indicative of overall wear and tear. TOR measures complexity using 13
separate physiologic measures: Number of diagnoses; number of medications prescribed; serum
sodium; serum potassium; serum creatinine; hemoglobin, hematocrit; white blood cell (WBC)
count; number of immature forms of WBC (“bands”); platelet count; glucose; C-reactive protein;
and lactate. Vulnerability (susceptibility to stressors) is measured using four data points: Age;
fall risk score (in this study, the Morse Fall Scale); weight; and mean arterial pressure. Stability
(the ability to maintain equilibrium) is measured using respiratory rate; heart rate; systolic blood
pressure, temperature; and pulse oximetry. Resiliency, (the capacity to return to higher function
after insult) is measured using two physiologic measures: high density lipoprotein and albumin.
Because of the difference in measurement scales for these physiologic processes, TOR
normalizes each value into a scale from zero (normal value) to three (highly abnormal). Thus, a
serum sodium level of 140 is a TOR score of zero, but serum sodium of 110 or higher than 160
equates to a score of three; a serum potassium of 5.0 is a zero TOR score, but a serum potassium
of 2.4 or 7.0 equates to a TOR score of three.

17 QI Measures of Success
To measure the impact of the addition of TOR to existing Nursing Staffing Methodology,
the QI initiative collected data on HAPU, 30-day readmissions, LOS, ICU transfer rate from
VSSC data, and existing daily staffing sheets, code blue and RRT activation logs from the
facility. Historical measurement of the previously identified QI goals/indicators were compared
to post innovation implementation data.
Data Collection
Data collection consisted of reviewing pre-intervention metrics from retrospective VSSC
data listed above for a quarter pre-innovation intervention phase and a quarter after innovation
implementation.
Procedure
The TOR score for each patient was calculated by the nurse staffing coordinator each
day and posted on the secured local SharePoint site. The nurse staffing coordinator worked on a
separate, VHA supported pilot of the TOR and training on procedures on calculating the score,
use of the different aspects of the score and securely storing information. The local privacy
officer reviewed and approved the process.
Training for the charge nurses on the mixed medical surgical unit on the use and
interpretation of TOR scores was completed in July 2018. After training, charge nurses were
given access to the local SharePoint site to review and incorporate TOR scores in conjunction
with their daily staffing decisions.
18
Training on the use of TOR was provided to the Nursing Staffing Methodology
Coordinator, which involves data mining for 24 measures in the EMR and placing it on the
SharePoint spreadsheet. The initial pilot included a limited number of calculations for 4 patients
over a 5-day period to prove the feasibility of the QI project. Lessons learned were applied to
the process. The next steps involved the integration of the TOR calculations into normal
workflow of the Nursing Staffing Methodology Coordinator. Since the VSSC data access was
already obtained, no additional requests were required. Charge nurses required training on the
use of TOR for daily staffing assignments in conjunction with the existing Nursing Staffing
Methodology data, the use of the total score and implications for significant changes in TOR
scores for individual patients. Charge nurse were given access to the TOR data on a secure
SharePoint site. TOR data was presented for all patients admitted on the SharePoint and also on
the daily staffing sheet. Patients were listed in separate columns to ease comparison.
The TOR algorithm is a Microsoft Excel worksheet located on a secure SharePoint site at
the study hospital. The spreadsheet includes tabs for raw data entry, and a summary page with
scores for each of the four major categories of complexity, stability, vulnerability and resiliency
as well as a total score for each patient. Charge nurses used the summary page TOR data which
included the four-individual component and total scores for each patient, and displays the prior
week’s TOR scores for each patient. At the beginning of their shift they used the TOR scores to
augment the daily nurse assignment process. The TOR was also documented on the daily
staffing sheet for the unit.
Data analysis

19
Changes in rates between pre- and post-intervention were used to determine effectiveness
of the intervention for all goals except nursing staffing schedule flexibility. Descriptive statistics
were used to assess for changes to mixed medical surgical unit nursing staffing schedule
flexibility as shown in Tables 4 and 5. These data were analyzed using SPSS software.
Data were compiled from historical VSSC data prior to implementation including: mixed
medical surgical unit LOS (number of inpatient days divided by the number of discharged
patients); mixed medical surgical unit transfers to intensive care unit (ICU) (percent mortality);
mixed medical surgical unit HAPU (percent per quarter), 30-day readmissions (percent per
quarter).
Data was compared using similar time periods and time of year to correct for seasonality.
There were 32 patients in the pre-intervention period, and 85 in the post intervention period.
These same VSSC data was collected for appropriate time period after implementation of TOR.
RRT activations from the mixed medical surgical unit (number per month), and cardiac arrests
rates from the mixed medical surgical unit (number per month) were collected by the facility
locally for two months pre- and post- TOR implementation. Daily charge nurse staffing sheets
were collected prior to implementation, and through the implementation period to determine
increased staffing flexibility. All patient data were stored on the local SharePoint controlled by
the Nursing Staffing Methodology Coordinator. Data analysis used de-identified data from
VSSC (Table 1).
Timeline
After Institution Review Board review determined the project was QI, active TOR
calculations by the nursing staffing methodology coordinator began in September 2018 and ran

20 for one month. This limited active data collection period was due to the time constraints
presented by manual data collection and entry from the EMR. Retrospective data collection
began in September 2018 as well and continued two months after TOR implementation. An
additional week was added to compile data prior to data analysis (Table 6).
Ethical Considerations
Charge nurses were given the opportunity to use TOR in the context of QI and as the end
users of the tool, and help determine future use. Since none of the individuals conducting the QI
initiative work for the researcher or staffing methodology coordinator, there was no risk for non-
participation for those charge nurses that choose not to participate. Patient safety was a concern.
The study design used TOR as a supplement to existing staffing processes to inform rather than
replace the existing rules and regulations. The use of TOR as a supplemental tool reduced the
risk.
Results
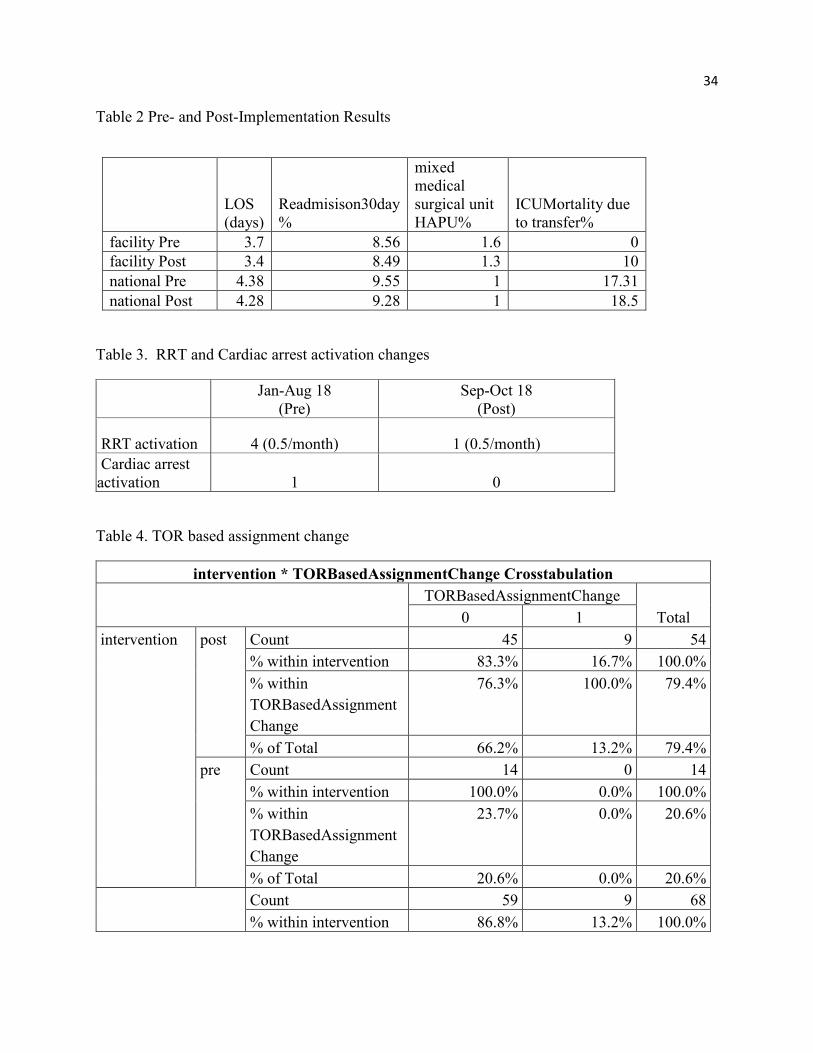
Results from VSSC collected data are in Table 2. Results of RRT activation and code
blue events are in Table 3. Staffing flexibility data are in Tables 4 and 5. After implementation
of TOR, the project demonstrated a reduction of 0.3 days in mixed medical surgical unit LOS,
but did not achieve the goal of a 0.5-day reduction. There was no difference in 30-day all cause
readmission rates before and after implementation of TOR. There was a greater than 10%
reduction in HAPU rate that met the 10% goal, however the sample size was small (n=5
combined) which did not provide ample evidence to determine significance. The total number of
RRT and code blue events decreased after implementation of TOR, the changes were not

21 significant due to small sample size (code blue activations (n=1), RRT activations (n=5)). ICU
transfers (n=1) increased from preintervention, but was not significant due to small sample size.
Prior to TOR implementation, staffing was based on location, clustering nurses in
specific geographic locations on the unit. After the implementation of TOR, 16.7% of
assignments were made without regard to geographic locations to balance patient acuity. This
was measured by assignment of the nurse to either room 4 or 8 and room 13 or 14 on the charge
nurse staffing sheets. There was no statistically significant difference in staffing assignment
changes (assignment of the nurse to either room 4 or 8 and room 13 or 14 on the charge nurse
staffing sheets) before and after implementation of TOR in the data (X2=2.689, p=0.101) (Table
4). However, the phi (effect size) indicated that there is a small-medium effect size when
comparing assignment changes as a result of the intervention. The reason for the non-
significance is probably due to the small sample size (low power). We also examined the
relationship between shifts and geographic assignment post implementation. Assignment of
nurses to room 4 or 8 and room 13 or 14 (increased staffing flexibility) was more likely to occur
on day shift: 20.6% had a variation on morning shift; 5.9% had a variation on evening shift. This
difference between shifts is also not statistically significant and probably due to small sample
size (X2=3.202, p=0.074, phi=0.217). Due to the limited sample size, we could not run a logistic
regression.
Discussion
Upon completion of the project, local leadership was provided the outcomes of the
innovation project, and any lessons learned during implementation. Recommendations were
based on the outcomes. Additionally, the VA Center for Innovation was provided results of the

22 project in accordance with requirements from the Spark-Seed-Spread innovation investment
program.
The VHA Office of Nursing Service (ONS), Nursing Operations requested information
on productivity models and staffing models used in both in- and out-patient settings. In response
to this request, the Program Manager for Nursing Staffing methodology for ONS was briefed
regarding this QI project. There was significant interest in TOR to supplement the existing
process because the current process lacks objective measurement of patient acuity or allostatic
load.
The VHA National Program Director for Pulmonary Critical Care Medicine expressed
interest in the TOR’s capability to predict undesired outcomes. A possible use case in the
intensive care inpatient units was explored and the algorithm was shared to develop a possible
interface with the ICU EMR. Initial work began to develop an interface between the ICU EMR
and the TOR algorithm and is ongoing.
There were several limitations in this study. The unit was a small medical surgical unit,
and the data collection period was short, which limited the sample size. Charge nurses began
using TOR scores in the process of daily nursing assignments in September 2018. TOR data was
placed on the daily charge nurse assignment sheet with the previous day’s TOR score also
displayed. Charge nurses modified nursing staffing to ensure that no nurse had more than one
patient with an increased TOR score of three or more from the previous day.
Prior to TOR implementation, staffing was based on location, clustering nurses in
specific geographic locations on the unit. After the implementation of TOR, 16.7% of
assignments were made without regard to geographic locations. This indicated a small-medium

23 effect size between intervention and assignment change. When we examined the relationship
between shifts and assignment variation, we found that the morning shifts had more variations
(20.6%) than the evening shifts (5.9%). These results are not statistically significant. Further
studies with larger sample sizes are needed to investigate the use of TOR on staffing assignment
while controlling for the shifts.
The project demonstrated a reduction of 0.3 days in mixed medical surgical unit LOS, but
this did not meet the desired reduction stated in the objective. There was no difference in 30-day
all cause readmission. There were changes in HAPU rates that met the 10% goal, however the
sample size was small (n=5 combined), and these data should be evaluated using that
information. The small sample size also impacted the reduction in code blue activations (n=1),
RRT activations (n=5) and ICU transfers (n=1).
Charge nurses and leadership recognized difficulties resulting from manually producing
TOR during the leadership presentation. This resulted in delays posting the TOR on the charge
nurse assignment sheets and limited its’ effectiveness. They indicated that the TOR was a
welcome addition to the process, but it would require automation to be of practical use.
Summary
The use of TOR was related to a decrease in LOS of 0.3 days post-implementation, and a
slight reduction in 30-day readmission, however neither achieved the project objective goals.
Ward transfer increased to 10% from zero, however this represents a difference of one patient in
the small sample size. Total HAPU decreased from 1.6% to 1.3%, did meet the objective of
reducing HAPU by 10%, however the small sample size also limits the generalizability of this
outcome. There was an overall reduction in difference in RRT activations and code blue/cardiac

24 arrest events between pre- and post-intervention timeframes, but these did not reach statistical
significance. The likelihood of a nurse being assigned outside of traditional geographical
boundaries because of the addition of TOR to the staffing methodology increased from 0% pre-
implementation to 16.7% post implementation, but did not achieve statistical significance.
The average TOR scores decreased from day one to day three of admission (average LOS
for the facility) after implementation (pre-intervention TOR increased at discharge by a 0.4; post-
intervention decreased by 0.7 at discharge). Although not one of the stated project objectives,
this may indicate the addition of TOR to existing nursing staffing methods improves nursing
surveillance and reduces patient’s allostatic load. More study will be required to determine if
this continues with a larger sample over a longer period.
25
References
AACN Synergy Model. Retrieved from https://www.aacn.org/nursing-excellence/aacn-
standards/synergy-model. Accessed February 7, 2018.
Acar, I., & Butt, S. (2016). Modeling nurse-patient assignments considering patient acuity and
travel distance metrics. Journal of Biomedical Informatics. 64:192-206. doi:
10.1016/j.jbi.2016.10.006.
Allaudeen, N., Vidyarthi, A., Maselli, J., Auerbach, A. (2011). Redefining readmission risk
factors for general medicine patients. Journal of Hospital Medicine, 6(2), 54-60.
Ammori, J., Navale, S., Schiltz, N., Koroukian, S. (2018). Predictors of 30-day readmissions
after gastrectomy for malignancy. Journal of Surgical Research. Apr; 224:176-184. doi:
10.1016/j.jss.2017.12.004. Epub 2018 Jan 3.
Bartone P, Spinosa T, Robb J, Pastel R. “Hardy-resilient style is associated with high-density
lipoprotein cholesterol levels”. Presentation at the Association of Military Surgeons of the
United States annual meeting. 11 Nov 2008.
Benner, P. (1984). From Novice to Expert: Excellence and Power in Clinical Nursing Practice.
Menlo Park, CA: Addison-Wesley Publishing Company.
Bleyer, A., Vidya, S., Russell, G., Jones, C., Sujata, L., Daeihagh, P., Hire, D. (2011).
Longitudinal analysis of one million vital signs in patients in an academic medical center.
Resuscitation. 82: 1387-1392
Charlson, M., Pompei, P., Ales, K., MacKenzie, R., (1987). A new method of classifying
prognostic comorbidity in longitudinal studies: development and validation. Journal of
26
Chronic Disease. 40(5): 373-383. Retrieved from: http://ac.els-
cdn.com/0021968187901718/1-s2.0-0021968187901718-main.pdf?_tid=edd5fbde-2b52-
11e7-94d2-00000aacb35d&acdnat=1493302263_48b0b18ecbc9d6a3f58a720b5cf9d3c6
Cho, S., Ketefian, S. Barkauskas, V, Smith, D. (2003). The effects of nurse staffing on adverse
events, morbidity, mortality, and medical costs. Nursing Research. 52: 71-79
Currie, L. Fall and Injury Prevention. In Hughes, R, (ed). Patient Safety and Quality: An
Evidence-Based Handbook for Nurses. Rockville, MD: Agency for Healthcare Research and
Quality (US); April 2008 Chapter 10.
Dodge, M. (2010). SIRS: A Systematic Approach for Medical-Surgical Nurses to Stop the
Progression of Sepsis. MEDSURG Nursing 19(1): 11-15.
Donze J, Drahomir A, Williamd D, Schnipper J. “Potentially avoidable 30 day hospital
readmissions in medical patients”. Journal of the American Medical Association Internal
Medicine. 2013;():1-7. Doi: 10.1001/jamainternmed.2013.3023
Dellinger R, Levy M, Rhodes A., Annane D, Gerlach H, Opal S, Sevransky J, Sprung C,
Douglas I, Jaeschke R, Osborn T, Nunnally M, Townsend S, Reinhart K, Kleinpell R, Angus
D, Deutschman C, Machado F, Rubenfeld G, Webb S, Beale R, Vincent J, Moreno R, and the
Surviving Sepsis Campaign Guidelines Committee including the Pediatric Subgroup*.
“Surviving Sepsis Campaign: International Guidelines for Management of Severe Sepsis and
Septic Shock: 2012” www.ccmjournal.org 41(2), pp 580-637, Feb 2013.
Department of Veterans Affairs. VHA Directive 1351 Staffing Methodology for VHA Nursing
Personnel. December 20, 2017.
27 Fasolino, T., Verdin, T. (2015). Nursing Surveillance and Physiological Signs of Deterioration.
Medsurg Nursing. November/December 24(6): 397-402.
Fernandes-Taylor, S., Berg, S., Gunter, R., Bennett, K., Smith, M., Rathouz, P., Greenberg, C.,
Kent, K. (2018). Thirty-day readmission and mortality among Medicare beneficiaries
discharged to skilled nursing facilities after vascular surgery. Journal of Surgical Research.
Jan; 221:196-203. doi: 10.1016/j.jss.2017.08.041. Epub 2017 Sep 26.
Fieselmann, J., Hendryx, M., Helms, C., Wakefield, D. (1993). Respiratory rate predicts
cardiopulmonary arrest for internal medicine inpatients. Journal of General Internal
Medicine. 8(7); 354-360.
Fraser R, Ingram M, Anderson N, Morrison C, Davies E, Connell J. “Cortisol effects on body
mass, blood pressure and cholesterol in the general population”. Hypertension. 1999; 33:
1364-1368.
Fried, L., Shlipak, M., Crump, C., Bleyer, A., Gottdiener, J., Kronmal, R., Kuller, L. Newman,
A. (2003). Renal insufficiency as a predictor of cardiovascular outcomes and mortality in
elderly individuals. Journal of the American College of Cardiology 41(8): 1364-72.
doi:10.1016/S0735-1097(03)00163-3
Garcia, A. (2017). Variability in Acuity in Acute Care. Journal of Nursing Administration.
47(10): 476-83. Doi: 10.1097/NNA.0000000000000518
Giuliano, K. (2017). Improving Patient Safety through the Use of Nursing Surveillance.
Horizons. Spring: 51: 34-43. Doi: 10.2345/0899-8205-51.s2.34

28 Giuliano, K., Danesh, V., Funk, M. (2016). The relationship between nurse staffing and 30-day
readmission for adults with heart failure. Journal of Nursing Administration 46(1): 25-29.
doi: 10.1097/NNA.0000000000000289
Gladwell, M. (2005). Blink. New York, NY: Little, Brown and Company
Gray J., Kerfoot K., (2016). Expanding the Parameters for Excellence in Patient Assignments: Is
Leveraging an Evidence-Data-Based Acuity Methodology Realistic? Nursing Administration
Quarterly. 2016 Jan-Mar;40(1):7-13. doi: 10.1097/NAQ.0000000000000138.
Groenveld, H., Januzzi, J., Damman, K., van Wijngaarden, J., Hillege, H., van Veldhuisen, D.,
van der Meer, P. (2008). Anemia and mortality in heart failure patients: a systematic review
and meta-analysis. Journal of the American College of Cardiology. 52(10): 818-27. doi:
10.1016/j.jacc.2008.04.061
Hertzog, M. (2008). Considerations in determining sample size for pilot studies. Research in
Nursing and Health. 31(2): 180-191. doi: 10.1002/nur.20247
Hill, B. (2017). Do nurse staffing levels affect patient mortality in acute secondary care? British
Journal of Nursing. 26(12): 698-704
Hodgetts, T., Kenward, G., Vlachonikolis, I., Payne, S., Castle, N. (2002). The identification of
risk factors for cardiac arrest and formulation of activation criteria to alert a medical
emergency team. Resuscitation. 54: 125-131.
Howard, D. (2016). Using the military acuity model to guide patient care. Nursing2016
46(1):14-17. doi: 10.1097/01.nurse.0000475493.62149.71

29 Jacobs, D., Noyes, K., Zhao, J., Gibson, W., Murphy, T., Sethi, S., Ochs-Balcom, H. (2018).
Early Hospital Readmissions after an Acute Exacerbation of Chronic Obstructive Pulmonary
Disease in the Nationwide Readmissions Database. Annals of the American Thoracic
Society. Jul;15(7):837-845. doi: 10.1513/AnnalsATS.201712-913OC
Knaus W, Draper E, Wagner D, Zimmerman J. “APACHE II: A severity of disease
classification system” Critical Care Medicine. 1985; 13(10).
Kumar, M. (2017). Difference between equity and equality. Retrieved from:
http://www.differencebetween.net/language/difference-between-equity-and-equality/
Le Gall J, Lemeshow S, Sauilnier F. “A New Simplified Acute Physiology Score (SAPSII)
Based on a European/North American Multicenter Study” Journal of the American Medical
Association. 1993 Dec 22/29; 270(24) pp 2957-63.
Logan, J., Barksdale, D. (2008). Allostasis and allostatic load: expanding the discourse on stress
and cardiovascular disease. Journal of Clinical Nursing. 17(7B): 201-8. Doi:
10.1111/j.1365-
Logue, E., Smucker, W., Regan, C. (2016) Admission Data Predict High Hospital Readmission
Risk. Journal of the American Board of Family Medicine. 29(1): 50-59 doi:
10.3122/jabfm.2016.01.150127 Retrieved from:
http://www.jabfm.org/content/29/1/50.full.pdf+html
Mauss, D., Li, J., Schmidt, B., Angerer, P., Jarczok, M. (2015). Measuring allostatic load in the
workforce: a systematic review. Industrial Health. 53: 5-20. 2702.2008.02347.x

30 McHugh, M., Berez, J., Small, D. (2013). Hospitals with higher nurse staffing had lower odds of
readmissions penalties than hospitals with lower staffing. Health Affairs. 2013 Oct; 32(10):
1740-1747. doi 10.1377/hlthaff.2013.0613
Mudge A, Kasper K, Clair A, Redfern H, Bell J, Barras M, Dip G, Pachana N. “Recurrent
readmissions in medical patients: a prospective study”. Journal of Hospital Medicine. 2011
Feb; 6(2) pp 61-7.
Myny, D., Van Hecke, A., De Bacqure, D., Verhaghe, S., Gobert, M., Defloor, T., Van
Goubergen, D. (2012). Determining a set of measurable and relevant factors affecting
nursing workload in the acute care hospital setting: A cross-sectional study. International
Journal of Nursing Studies. 49: 427-36. Doi 10.1016/j.ijnursstu.2011.10.005
Needleman, J., Buerhaus, P., Pankratz, S., Leibson, C. Stevens, S., Harris, M. (2011). Nurse
Staffing and inpatient hospital mortality. New England Journal of Medicine 364(11): 1037-
1045. Doi: 10.1056/NEJMsa1001025
Ohnuma, T., Shinjo, D., Brookhart, A., Fushimi, K. (2018). Predictors associated with
unplanned hospital readmission of medical and surgical intensive care unit survivors within
30 days of discharge. Journal of Intensive Care. Mar 1; 6:14. doi: 10.1186/s40560-018-
0284-x. eCollection 2018.
Perkins A, Kroenke K, Unutzer J, Katon W, Williams J, Hope C, Callahan C. “Common
comorbidity scales were similar in their ability to predict health care costs and mortality”
Journal of Clinical Epidemiology. 2004; 57 1040-1048. doi: 10.1016/jclinepi.2004.03.002

31 Punnakitikashem, P. Integrated Nurse Staffing and Assignment Under Uncertainty (Doctoral
Dissertation), University of Texas at Arlington, 2007. Retrieved from
http://dspace.uta.edu/bitstream/handle/10106/598/umi-uta-1803.pdf?sequence=1.
Seeman, T., Singer, B., Rowe, J., Horwitz, R., McEwen, B. (1997). Price of Adaptation:
Allostatic Load and Its Health Consequences. Archives of Internal Medicine. 157: 2259-
2268.
Shalaby, A., El-Saed, A., Voigt, A., Albany, C., Saba, S. (2008). Elevated serum creatinine at
baseline predicts poor outcome in patients receiving cardiac resynchronization therapy.
Pacing Clinical Electrophysiology. 31(5): 575-579. Doi: 10.1111/j.1540-8159.2008.0143.x
Sir, M., Dundar, B., Steege, L., Pasupathy, K. (2015). Nurse-patient assignment models
considering patient acuity metrics and nurses’ perceived workload. Journal of Biomedical
Informatics. 55: 237-248. Doi 10.1016/j.jbi.2015.04.005
Sullivan, D., Roberson, P., Johnson, L., Mendiratta, P., Bopp, M., Bishara, O. (2007).
Association between inflammation-associated cytokines, serum albumins, and mortality in
the elderly. Journal of the American Medical Directors Association. 8: 458-463. Doi:
10.1016/j.jamda.2007.04.004
Swickland, S., Swickland, W., Reimer, A., Lindell, D., Winkelman, C. (2014). Adaptation of the
AACN Synergy Model for Patient Care to Critical Care Transport. Critical Care Nurse.
34(1) 16-29. doi: 10.4037/ccn2014573
32 Van den Berge, G., Wilmer, A., Hermans, G., Meersseman, W., Wouters, P., Milants, I.,
Wijngaerden, E., Bobbaers, H., Bouillon, R. (2006). Intensive Insulin Therapy in the
Medical ICU. New England Journal of Medicine. 354(5): 449-461
Varpula, M., Tallgren, M., Saukkonen, K., Voipio-Pulkki, L., Pettila, V. (2005). Hemodynamic
variables related to outcome in septic shock. Intensive Care Medicine. 31:1066-1071. Doi:
10.1007/s00134-005-2688z
Zhao, H., Heard, S., Mullen, M., Crawford, S., Goldberg, R., Frendl, G., Lilly, C. (2012). An
evaluation of the diagnostic accuracy of the 1991 American College of Chest
Physicians/Society of Critical Care Medicine and the 2001 Society of Critical Care
Medicine/European Society of Intensive Care Medicine/American College of Chest
Physicians/American Thoracic Society/Surgical Infection Society sepsis definition. Critical
Care Medicine. 40(6); 1700-1706.

33
Tables, Figures and Appendices
Table 1: Description of variables
QI Objective Data Source Operational Definition Reduce mixed medical surgical unit LOS by 0.5 days
VSSC LOS Number of days number of inpatient days divided by the number of discharged patients; (monthly metric for medical and surgical patients separately and quarterly metrics for total combined on the unit)
Reduce mixed medical surgical unit HAPU by 10%
VSSC HAPU Number of patients with LOS>48 hours with 2+ HAPU divided by number of discharges (quarterly metric)
Reduce mixed medical surgical unit transfers to ICU by 10%
VSSC transfers to ICU Percent mortality of patients transferred from ward to ICU (quarterly metric)
Reduce all cause 30-day readmissions by 10%
VSSC 30-day readmissions Percent readmitted-all cause (quarterly metric)
Increase RRT activations from mixed medical surgical unit by 10%
Local log of RRT activations from mixed medical surgical unit
Number per month (monthly metric)
Reduce mixed medical surgical unit code blue activations by 10%
Local log of code blue activations from the mixed medical surgical unit
Number per month (monthly metric)
Increase mixed medical surgical unit nursing staffing schedule flexibility
Local daily charge nurse staffing sheets
Staff flexibility based TOR; defined as nurse assigned either room 4 or 8 and room 13 or 14
34 Table 2 Pre- and Post-Implementation Results
LOS (days)
Readmisison30day %
mixed medical surgical unit HAPU%
ICUMortality due to transfer%
facility Pre 3.7 8.56 1.6 0 facility Post 3.4 8.49 1.3 10 national Pre 4.38 9.55 1 17.31 national Post 4.28 9.28 1 18.5
Table 3. RRT and Cardiac arrest activation changes
Jan-Aug 18
(Pre) Sep-Oct 18
(Post)
RRT activation 4 (0.5/month) 1 (0.5/month) Cardiac arrest activation 1 0
Table 4. TOR based assignment change
intervention * TORBasedAssignmentChange Crosstabulation
TORBasedAssignmentChange
Total 0 1 intervention post Count 45 9 54
% within intervention 83.3% 16.7% 100.0% % within TORBasedAssignmentChange
76.3% 100.0% 79.4%
% of Total 66.2% 13.2% 79.4% pre Count 14 0 14
% within intervention 100.0% 0.0% 100.0% % within TORBasedAssignmentChange
23.7% 0.0% 20.6%
% of Total 20.6% 0.0% 20.6% Count 59 9 68
% within intervention 86.8% 13.2% 100.0%

35
% within TORBasedAssignmentChange
100.0% 100.0% 100.0%
% of Total 86.8% 13.2% 100.0% X2=2.689, p=0.101, phi=0.199
Table 5. TOR based assignment change by shift
shift * TORBasedAssignmentChange Crosstabulation
TORBasedAssignmentChange
Total 0 1 shift evening Count 32 2 34
% within shift 94.1% 5.9% 100.0% % within TORBasedAssignmentChange
54.2% 22.2% 50.0%
% of Total 47.1% 2.9% 50.0% morning Count 27 7 34
% within shift 79.4% 20.6% 100.0% % within TORBasedAssignmentChange
45.8% 77.8% 50.0%
% of Total 39.7% 10.3% 50.0% Total Count 59 9 68
% within shift 86.8% 13.2% 100.0% % within TORBasedAssignmentChange
100.0% 100.0% 100.0%
% of Total 86.8% 13.2% 100.0% X2=3.202, p=0.074, phi=0.217.

36
Table 6. Timeline
May-July 18 VA QI project approval
Aug-Dec 18 Data
gatheringJan 19 Data
AnalysisJan-Mar 19
Report writing
Apr 19 Submit final
report
37
Appendix A
Examples of individual TOR data point predictive statistics
Age: Risk of death increases in ICU patients from 0.436 in 45-54 year old (p<0.01) to 1.113 in 65-74 year old (p<0.01); Knaus, Draper, Wagner and Zimmerman, 1985
Number of Diagnoses: The number of comorbid diseases significantly increased 1-year mortality in a linear fashion (p<0.05); Charlson, Pompei, Ales, and MacKenzie, 1987
Number of medications: Polypharmacy (>6 medications) increased 30-day readmission risk by 9.6% (p<0.05); Logue, Smucker and Regan, 2016 and Donze, Drahomir, Williamd and Schnipper, 2013. The number of medications predicted health care changes and ambulatory visits (R2=13.6% and 15% respectively); Perkins, Kroenke, Unutzer, Katon, Williams, Hope and Callahan, 2004.
Respiratory Rate: Abnormal respiratory rate was associated with increased risk of in-hospital cardiac arrest (OR 3.49, 95% CI, p<0.013); Hodgetts, Kenward, Vlachonikolis, Payne, and Castle, 2002. One or more events of elevated respiratory rate (>27 breaths/min) predicted in-hospital cardiac arrest (OR 5.56, 95% CI, p<0.001); Fieselmann, Hendryx, Helms and Wakefield, 1993.
Heart Rate, Temperature, systolic blood pressure: Individual critical measures in each of these parameters increases odds of death by 0.92%; presence of three simultaneous critical vital signs with these parameters increases odds of death by 23.6% (p<0.05); Bleyer, Vidya, Russell, Jones, Sujata, Daeihagh and Hire, 2011. Abnormal pulse rate and systolic blood pressure were associated with increased risk of in-hospital cardiac arrest (OR 4.07, 95% CI, p<0.001 and 19.92 95% CI, p<0.001); Hodgets et al, 2002.
Mean Arterial Pressure: A MAP <65mmHg predicted 30-day mortality in ICU patients (p<0.001) with an area under the curve of 0.853 and a 95% confidence interval; 0.772-0.934); Varpula, Tallgren, Saukkonen, Voipio-Pulkki, and Pettila, 2005
Weight: 30-day readmission risk associated with weight loss (OR 1.26; 95% CI 1.09-1.47, p<0.0449); Allaudeen, Vidyarthi, Maselli and Auerbach, 2011. 6-month readmission risk and underweight (BMI <18.5) OR 12.7, p<0.004, and obese (BMI >30) OR 2.6, p<0.07; Mudge, Kasper, Clair, Redfern, Bell, Barras, Dip and Pachana, 2011.
Pulse oximetry: Reduced pulse oximetry was associated with increased risk of in-hospital cardiac arrest (OR 4.1, 95% CI, p<0.001); Hodgets et al, 2002
White Blood Cell count: Counts greater than 12,000/mm3 or less than 4,000/mm3 (OR 1.5, 95% CI); Zhao, Heard, Mullen, Crawford, Goldberg, Frendl and Lilly, 2012.

38 Hemoglobin: Less than 12g/dL increased 30-day readmission (p<0.05); Donze et al, 2013. Anemia (also defined as hgb of less than 12g/dL) independently predicted mortality at six months with an odds ratio of 1.96 (95% confidence interval p<0.001); Groenveld, Januzzi, Damman, van Wijngaarden, Hillege, van Veldhuisen, and van der Meer, 2008
Hematocrit: Anemia (defined as hct range of 36.6% to 42.7%) independently predicted mortality at six months with an odds ratio of 1.96 (95% confidence interval p<0.001); Groenveld et al, 2008
Platelets: Thrombocytopenia identified as a variable in diagnostic criteria for sepsis; Dellinger, Levy, Rhodes, Annane, Gerlach, Opal, Sevransky, Sprung, Douglas, Jaeschke, Osborn, Nunnally, Townsend, Reinhart, Kleinpell, Angus, Deutschman, Machado, Rubenfeld, Webb, Beale, Vincent, Moreno, and the Surviving Sepsis Campaign Guidelines Committee including the Pediatric Subgroup, 2013.
Bands: (Immature WBC) greater than 10% (OR 6.08, CI 95%); Zhao et al, 2012.
Albumin: Decreased albumin identified as an indicator of impending organ dysfunction; Dodge, 2010. Six month mortality was negatively associated with increasing albumin (RR 0.35, OR 0.14-0.86); Sullivan, Roberson, Johnson, Mendiratta, Bopp and Bishara, 2007.
Glucose: Hyperglycemia in absence of diabetes identified as a variable in diagnostic criteria for sepsis; Dellinger, et al, 2013. Glucose control reduced new onset kidney dysfunction, ventilator weaning time, and length of stay in the medical ICU (p<0.04; p<0.03 and p<0.04 respectively); Van den Berge, Wilmer, Hermans, Meersseman, Wouters, Milants, Wijngaerden, Bobbaers and Bouillon, 2006.
Creatinine: Elderly patients (>65 years) with elevated creatinine levels (>1.5mg/dl for males or >1.3 mg/dl for females) had mortality were more likely to develop cardiovascular disease, stroke, congestive heart failure, and symptomatic peripheral vascular disease (p<0.001); Fried, Shlipak, Crump, Bleyer, Gottdiener, Kronmal, Kuller and Newman, 2003. Also, an independent predictor of mortality in cardiac resynchronization therapy patients (p<0.032); Shalaby, El-Saed, Voigt, Albany and Saba, 2008. Also implicated in recognition of sepsis (OR 1.43, CI 95%) Zhao, et al, 2012.
Sodium: Less than 135mEq/L increased 30-day readmission (p<0.05); Donze et al, 2013
Potassium: Identified as indicator of organ dysfunction in APACHE II; Knaus et al, 1985. Also identified as indicator of end organ dysfunction in SAPS; Le Gall, Lemeshow and Sauilnier, 1993.
C-reactive protein: Surviving Sepsis Campaign criteria; Dellinger et al, 2013.
Lactate: Greater than 1 mmol/L (OR 6.68, CI 95%); Zhao et al, 2012.

39 HDL: HDL concentration negatively correlated with cortisol excretion (r2 -0.27 male (p<0.01), -0.22 female (p<0.05); Fraser, Ingram, Anderson, Morrison, Davies and Connell, 1999. Higher HDLC positively correlated with resiliency as measured by a hardiness measure (DRS-15r) r2 0.115, p<0.004; Bartone, Spinosa, Robb and Pastel, 2008
Fall Risk: Fall-related injuries account for up to 15% of hospital readmissions and are the leading cause of accidental death in those older than 65 years; Currie, 2008.