quantitative research methodologies chapter 10 ... methodology (261703... · quantitative research...
TRANSCRIPT

1
Quantitative Research Methodologies
Chapter 10 : Experimental and Ex Post Facto Designs
2
• Progress is relative.• We measure progress by noting the amount of
change b/w what was and what is.• And we attempt to account for the change by
identifying the dynamics that have caused it.• Ideally, we must manipulate one possible causal
factor while keeping all other possible causal factors constant; only in this way can we determine whether the manipulated factor has an effect on the phenomenon we’re studying.
• To the extent that multiple factors all vary simultaneously.
• We learn little about true underlying causes.
3
• In the designs we've discussed up until now we've made no systematic attempt to determine the causes of the phenomena being studied.
• But ultimately we often do want to know what causes what; in other words, we want to identify cause-and-effect relationships.
• Researcher can most convincingly identify cause-and-effect relationships by using an experimental design.
4
• In such a design, researcher considers many possible factors that might cause or influence a particular condition or phenomenon.
• The research then attempts to control for all influential factors except those whose possible effects are the focus of investigation.
• An example can help to clarify the point.

5
• Imagine that we have two groups of people. • We take steps to make sure that these two
groups are, on average, so similar that we can, for all intents and purposes, call them equivalent.
• We give them a pretest to measure a particular characteristic in which we're interested (perhaps blood pressure, academic achievement, or spending habits).
6
• Then we expose only one of the groups to a treatment or intervention of some sort (perhaps a new drug, an instructional method, or an advertising campaign) that we think may have an effect on the characteristic we are studying.
• Afterward, we give both groups a posttest to measure the characteristic once again.
7
• If the characteristic changes for the group that received the intervention but does not change for the other group, and if everything about the two groups has been the same except for the intervention, then we can reasonably conclude that the treatment or intervention brought about the change we observed.
• Because we have not only observed the situation but also manipulated it, we have used an experimental design.
8
• We must clarify the difference b/w an experiment and an experimental design.
• An experiment does not necessarily involve an experimental design.
• As an illustration, consider a problem that arose in Thomas Edison's laboratory in the early days of the incandescent electric lightbulb.
• Edison had given his engineers a lightbulb that was both round and tapering in shape and asked them to calculate its volume

9
• Each engineer drew on a wealth of mathematical knowledge to solve the problem, yet each arrived at a different answer.
• Edison then went into his laboratory, filled a container with water, measured the water's volume, immersed the incandescent bulb into it, and snipped off the pointed glass tip.
10
• Water rushed into the bulb (because it was a vacuum) and filled it completely.
• Edison removed the water-filled bulb from the container and then measured the amount of water that remained.
• The difference b/w the amount of water in the container before and after the lightbulbhad been filled was the volume of the bulb.
11
• That was an experiment. It was not research, nor was it an experimental design.
• The experiment merely determined a fact (the volume of the lightbulb), and for that particular fact there was no further meaning to be derived.
• Had Edison been able to interpret his findings in some additional way, then his experiment would have been a research experiment.
12
• Some of the research designs we describe in this chapter are true experimental designs; as such, they allow us to identify cause-and-effect relationships.
• Other designs in this chapter eliminate some -but not all-alternative explanations of an observed change.
• All of the designs in this chapter have one thing in common: clearly identifiable independent and dependent variables.

13
• In the following sections, we distinguish b/w independent and dependent variables and explore the importance of control for studying cause-and-effect relationships.
• After that, we introduce a variety of research designs that involve an environmental intervention of some sort-either an intervention that a researcher directly manipulates (resulting in an experimental design or one of its relatives) or one that the environment has provided before a research study begins (resulting in an ex post facto design).
14
Independent and Dependent Variables
• A variable is any quality or characteristic in a research investigation that has two or more possible values.
• For instance, variables in studies of how effectively children learn in classrooms might include instructional methods used; teachers' educational backgrounds, emotional warmth, and beliefs about classroom discipline; children's intelligence, personality characteristics, prior learning experiences, reading skills, and study strategies; and of course, how much children actually learn in class.
15
• Variables in studies of how well seeds germinate might include amounts of sun and water, kinds of soil and fertilizer, presence or absence of various parasites and microorganisms, genetic makeup of the seeds, speed of germination, and hardiness of the resulting plants.
16
• When we investigate cause-and-effect relationships, we are, of course, looking at the extent to which one variable (the cause) influences another variable (the effect).
• A variable that the researcher studies as a possible cause of something else-in many cases, this is one that the researcher directly manipulates-is called an independent variable.

17
• A variable that is potentially influenced by the independent variable-that "something else" we just mentioned-is called a dependent variable, b/c it is influenced by, and so to some extent depends on, the independent variable.
• In research in the social sciences and education, the dependent variable is often some form of human behavior.
• In medical research, it might be people's physical health or well-being.
• In agricultural research, it might be quality or quantity of a particular crop.
18
• To illustrate the two kinds of variables, we take a simple situation in the physical world.
• Suppose an investigator connects a potentiometer to a source of electricity and then connects a voltmeter to the potentiometer.
• The potentiometer, a resistor, allows the investigator to control the voltage that reaches the voltmeter: By turning a knob in one direction or the other, the investigator can allow more or less voltage to travel forward, and the voltmeter measures the voltage that reaches it.
19
• In this situation, the voltage that the potentiometer delivers is the independent variable.
• The reading on the voltmeter- where the needle points on the face of the instrument depends on the voltage and so is the dependent variable.
20
• Let's now consider an example in medical research.
• Imagine that we want to compare the relative effectiveness of two different drugs that are used to treat high blood pressure.
• We take a sample of 60 men who have high blood pressure and randomly assign each man to one of two groups: The men in one group take one drug, and the men in the other group take the other drug.

21
• Later, we compare the blood pressure measurements for the men in the two groups.
• In this situation, we are manipulating the particular drug that each person takes; the drug, then, is the independent variable.
• Blood pressure is the variable that is presumably influenced by the drug taken and so is the dependent variable.
22
• As a final example, let's look at a dissertation in educational psychology.
• The researcher wanted to study the effects of three different kinds of lecture material on people's ability to remember information contained in the lecture.
• Working with undergraduate students, she presented different parts of a lecture on an obscure American Civil War battle in one of three ways:
23
1. She described certain historical figures and events in such a manner that they were easy to imagine and visualize (imagery condition)
2. She included attention-grabbing phrases (attention condition),
3. She did neither of these things (control condition).
24
• In the following examples, the underscored phrases illustrate the modifications made for each of the three conditions; other variations in wording made the three lectures equivalent in length:

25 26
• After presenting different parts of the lecture under the three conditions, the researcher measured the students' recall for the lecture in two ways.
• She first gave them blank sheets of paper and asked them to write down as much of the lecture as they could remember (a "free recall" task).
• When they had completed the task, she gave them a multiple-choice test that assessed their memory for specific facts within the lecture.
27
• In this study, the independent variable was the nature of the lecture material: easily visualized, attention-getting, or neutral.
• There were two dependent variables, both of which reflected students’ ability to recall facts within the lecture: performance on the free recall task and scores on the multiple-choice test.
• Thrailkill's hypothesis was confirmed; The students' ability to recall lecture content depended, to some extent, on the way in which the content was presented.
28
Importance of Control• In Chapter 5, we introduced the concept of
internal validity. • The internal validity of a research study is the
extent to which its design and the data it yields allow the researcher to draw accurate conclusions about cause-and-effect and other relationships.
• In experimental designs, internal validity is essential; w/o it, any results the researcher obtains are uninterpretable.

29
• As an example, suppose we have just learned about a new method of teaching science in elementary school.
• We want to conduct an experiment to investigate the method's effect on students‘ science achievement test scores.
• We find two fifth-grade teachers who are willing to participate in the study.
• One teacher agrees to use the new method in the coming school year; in fact, she is quite eager to try it.
• The other teacher wants to continue using the same approach he has always used.
• Both teachers agree, too, that at the end of the school year we can give their students a science achievement test.
30
• Are the two classes the same in every respect except for the experimental intervention?
• If the students taught with the new method obtain higher science achievement test scores at the end of the year, will we know that the method was the cause of the higher scores?
• The answer to both questions is a resounding no!
31
• The teachers are different: One is female and the other male, and they almost certainly have different personalities, educational backgrounds, teaching styles, and so on.
• In addition, the two groups of students may be different; perhaps the students instructed by the new method are, on average, more intelligent or motivated than the other, or perhaps they live in a more affluent school district.
• Other, more subtle differences may be at work as well, including the interpersonal dynamics in the two classes, and the light, temperature, and noise levels within each classroom.
32
• Any one of these factors, and perhaps others that we haven't thought of, may have contributed to the differences in achievement test scores we obtained.
• Whenever we compare two or more groups that are or might be different in ways in addition to the particular treatment or intervention we are studying, we have confounding variables in our study.
• The presence of such variables makes it extremely difficult to draw conclusions about cause-and-effect relationships, b/c we cannot pin down what is the cause of any phenomenon we observe after the intervention.

33
• To maximize internal validity when a researcher wants to identify cause-and-effect relationships, then, the researcher needs to control confounding variables so that these variables are ruled out as explanations for any effects observed.
• Researchers use a variety of strategies to control for confounding variables.
• Following are several common ones:
34
1. Keep some things constant• When a factor is the same for everyone, it
cannot possibly account for any differences that we see.
• Oftentimes researchers ensure that difference treatments are imposed in the same or similar environments.
• They may also seek research participants who share a certain characteristic, such as sex, age, grade level, or socioeconomic status. (Keep in mind, however, that restricting the nature of one's sample may lower the external validity, or generalizability, of any findings obtained)
35
2.Include a Control Group• In Chapter 5, we described a study in which an industrial
psychologist begins playing classical music as employees in a typing pool go about their daily task of typing documents.
• At the end of the month, the psychologist finds that the typists' productivity is 30% higher than it was the preceding month.
• The increase in productivity may or may not be due to the classical music. There are too many possible confounding variables-personnel changes, nature of the documents being typed, numbers of people out sick or on vacation during the 2 months, even just the knowledge that an experiment is being conducted-that may also account for the typists' increased productivity.
36
• To better control for such extraneous variables, researchers frequently include a control group, a group that receives either no intervention or a "neutral" intervention that should have little, if any, effect.
• They then compare the performance of this group to an experimental group (also known as a treatment group) that participates in an intervention.

37
3. Randomly assign people to groups
• The value of selecting people at random to participate in a research study; such random selection enhances the probability that any results obtained for the sample also apply to the population from which the sample has been drawn.
• In experimental studies, researchers use random selection for a different purpose: to assign participants within their sample to various groups.
38
• In any research study involving human beings or other living things, members of the sample are likely to be different from one another in ways that are relevant to the variables under investigation.
• For example, a researcher wants to compare two methods of teaching elementary school science.
• The students in the study will almost certainly differ from one another in intelligence, motivation, educational opportunities at home, and other factors that will affect their performance on the science achievement test given at the end of the school year.
• It would be virtually impossible to control for such variables by having all students in the study have the same intelligence, the same motivation, the same kinds of outside opportunities, and so on.
39
• As an alternative to keeping some characteristics the same for everyone, a researcher can, instead, randomly assign participants to groups.
• When people have been selected for one group or another on a random basis, then the researcher can reasonably assume that on average, the groups are quite similar and that any differences between them are due entirely to chance.
• In fact, many inferential statistical tests-especially those that allow the researcher to make comparisons among two or more groups-are based on the assumption that group membership is randomly determined and that any pretreatment differences b/w the groups result from chance alone.
40
4. Assess equivalence before the treatment with one or more pretest
• Sometimes random assignment to two different groups simply isn't possible; for instance, researchers may have to study groups that already exist (e.g., students in classrooms, participants in different medical treatment programs).
• An alternative in this situation is to assess other variables that might influence the dependent variable and determine whether the groups are similar with respect to these variables.
• If the groups are similar then the researcher reduces or eliminates the possibility that such variables could account for any group differences that are later observed.
41
• Another strategy is to identify matched pairs: pairs of people-one in each of two groups being compared-who are identical or very similar with respect to characteristics that are relevant to the study.
• For instance, a researcher comparing the achievement test scores of students in two different instructional programs might identify pairs of students of the same sex and age who have similar IQ scores.
• Researcher comparing two different treatments for a particular illness might match patients according to sex, age, and duration and intensity of the illness.
• In either case, the researcher does not study the data collected for all people in the two groups, only the people who are part of "matched sets" that he or she has identified.
42
• A researcher who uses this approach will, in the final research report, explain in what way(s) the participants in the study have been matched.
• For example, he or she might say, "pairs were matched on the basis of age, gender, and socioeconomic status.“
• One problem w/ assessing before-treatment equivalence w/ pretests is that the researcher rules out only the variables that he or she bas actually assessed and determined to be equivalent across groups.
• The design does not rule other influential factors that the researcher has not assessed and perhaps not even considered.
43
5. Expose participant to both or all experimental conditions
• Still another strategy for controlling for individual differences is to use participants as their own controls-that is, to have every participant in the study undergo all experimental and control treatments and then assess the effects of each treatment independently.
• Such an approach is known as within-subjects design or repeated measures design.
44
6. Statistically control for confounding variables.
• Sometimes researchers can control for known confounding variables, at least in part, through statistical techniques.
• Such techniques as partial correlation, analysis of covariance (ANCOVA), and structural equation modeling are suitable for this purpose.
• We'll briefly describe each of these in Chapter 11.

45
Overview of Experimental and Ex Post Facto Design
• In true experimental research, researcher manipulates the independent variable and examines its effects on another, dependent variable.
• A variety of research designs have emerged that differ in the extent to which the researcher manipulates the independent variable and controls for confounding variables.
• In the upcoming sections, we will present a number of possibilities, which we've divided into three general categories:
46
• (a) pre-experimental design, (b) true experimental design, and (c) quasi-experimental design
• We will also describe designs in which a researcher studies the possible effects of an environmental factor that has occurred prior to the study itself; such designs are often called ex post facto design.
• Finally, we will consider studies in which the effects of two independent variables are examined simultaneously; such studies involve factorial designs.
• Altogether, we will introduce 16 different designs that illustrate various ways-some more effective than others-of identifying possible cause-and-effect relationships.
47
• We will be illustrating the designs using tables that have this general format:
• Each group in a design will be shown in a separate row, and the things that happen to the group over time will be shown in separate cells within the row. The cells will have one of four notations:
48
• Tx: Indicates that a treatment (reflecting the independent variable) is presented.
• Obs: Indicates that an observation (reflecting the dependent variable) is made.
• − : Indicates that nothing occurs during a particular time period.
• Exp: Indicates a previous experience (an independent variable) that some participants have had and others have not; the experience has not been one that the researcher could control.

49
• As you read about the 16 designs, keep in mind that they are hardly an exhaustive list; researchers may modify or combine them in various ways.
• More generally, the designs we describe here should simply provide a starting point that gets you thinking about how you might best tackle your own research problem.
50
Pre-Experimental Design
• In pre-experimental designs, it is not possible to show cause-and-effect relationships, b/c either (a) the independent "variable" doesn't vary or (b) experimental and control groups are not comprised of equivalent or randomly selected individuals.
• Such designs are helpful only for forming tentative hypotheses that should be followed up w/ more controlled studies.
51
Design 1: One-Shot Experimental Case Study
• One-shot experimental case study is probably the most primitive type of experiment that might conceivably be termed "research."
• An experimental treatment (Tx) is introduced, and then a measurement (Obs)-a posttest of some sort-is administered to determine the effects of the treatment. This design is shown in the following table:
52
• The design has low internal validity b/c it is impossible to determine whether participants‘ performance on the posttest is the result of the experimental treatment per se.
• Many other variables may have influenced participants' performance.
• Perhaps the condition observed after the treatment existed before the treatment as well.
• The reality is that, with a single measurement or observation, we have no way of knowing whether the situation has changed or not, let alone whether it has changed as a result of the intervention.

53
• One-shot experimental case studies may be at the root of many common misconceptions.
• For example, imagine that we see a boy sitting on the damp ground in mid-April. The next day, he has a sore throat and a cold. We conclude that sitting on the damp earth caused him to catch cold.
• Thus, the design of our "research" thinking is something like this:
54
• Such "research" may also "support" such superstitious folk beliefs as these: If you walk under a ladder, you will have bad luck; Friday the 13th is a day of catastrophes; a horseshoe above the door brings good fortune to the house.
• Someone observed an event, then observed a subsequent event, and linked the two together as cause and effect.
• Although the one-shot experimental case study is simple to carry out, its results are, for all intents and purposes, meaningless. At the very least, researchers should use the design described next.
55
Design 2: One-Group Pretest-Posttest Design
• In a one-group pretest-posttest design, a single group (a) has a pre-experimental evaluation, then (b) is administered the experimental treatment, and finally (c) is evaluated after the treatment.
• This design is represented as follows:
56
• Suppose an elementary school teacher wants to know if listening to a story on a tape recorder improves the reading skills of students in her class.
• She gives her students a standardized reading pretest, has them listen to a tape-recorded story every day for 8 weeks, and then tests them w/ an alternate form of the same standardized test.
• If the students' test scores improve over the 8-week period, she might conclude-perhaps accurately, but perhaps not- that listening to the stories was the cause of the improvement.

57
• Suppose an agronomist hybridizes two strains of corn.
• He finds that the hybrid strain is more disease-resistant and has a better yield than either of the two parent types.
• He concludes that the hybridization process has made the difference.
• Once again we have an Obs-Tx-Obs design: The agronomist measures the disease level of the parent strains (Obs), develops a hybrid of the two strains (Tx), and then measures the disease level of the next generation (Obs).
58
• In a one-group pretest-posttest design, we at least know that a change has taken place.
• However, we have not ruled out other possible explanations for the change.
• In the case of the elementary school teacher's experiment, improvement in reading scores may have been due to other activities within the classroom curriculum, to more practice taking the reading test, or simply to the fact that the students were 8 weeks older.
• In the case of the agronomist's experiment, changes in rainfall, temperature, or soil conditions may have been the primary reason for the healthier corn crop.
59
Design 3: Static Group Comparison
• The static group comparison involves both an experimental group and a control group.
• Its design takes the following form:
60
• An experimental group is exposed to a particular experimental treatment; the control group is not.
• After the treatment, both groups are observed and their performance compared.
• In this design, however, no attempt is made to obtain equivalent groups or at least to examine the groups to determine whether they are similar before the treatment.
• Thus, we have no way of knowing if the treatment actually causes any differences we observe b/w the groups.

61
• The three designs just described, though commonly employed in many research projects, leave much to be desired in terms of drawing conclusions about what causes what.
• The experimental designs we describe next are far superior in this respect.
62
True Experimental Design• In contrast with the somewhat simple designs we have
just described, experimental designs offer a greater degree of control and, as a result, greater internal validity.
• The first three designs we discuss here share one thing in common: People or other units of study are randomly assigned to groups.
• Such random assignment guarantees that any differences b/w the group are probably quite small and, in any case, are due entirely to chance.
• The last design in this section involves a different strategy: administering different treatments to a single group.
63
Design 4: Pretest-Posttest Control Group Design
• In a pretest-posttest control group design, an experimental group and a control group are carefully selected through appropriate randomization procedures.
• The experimental group is observed, subjected to the experimental treatment, and observed once again.
• The control group is isolated from any influences of the experimental treatment; it is simply observed both at the beginning and at the end of the experiment.
64
• The paradigm for the pretest-posttest control group design is as follows:
• Such a design, simple as it is, solves two major problems associated with pre-experimental designs.
• We can determine whether a change takes place after the treatment, and, if so, we can eliminate other possible explanations (in the form of confounding variables) as to why the change has taken place.
• Thus, we have a reasonable basis on which to draw a conclusion about a cause-and-effect relationship.

65
Design 5: Solomon Four-Group Design
• One potential problem in the preceding design is that the process of observing or assessing people before administering the experimental treatment may, in and of itself, influence how people respond to the treatment.
• For instance, perhaps the pretest increases people's motivation: It makes them want to benefit from the treatment they receive.
• To address the question, What effect does pretestinghave?, Solomon(1949) proposed an extension of the pretest-posttest control group design that involves four groups, as depicted in the following table;
66
• The addition of two groups who are not pretestedprovides a distinct advantage.
• If the researcher finds that, in the final observation, Groups 3 and 4 differ in much the same way that Groups 1 and 2 do, then the researcher can more easily generalize his or her findings to situations in which no pretest has been given.
• In other words, the Solomon four-group design enhances the external validity of the study.
67
Design 6: Posttest-Only Control Group Design
• Some life situations defy pretesting. • You cannot pretest the forces in a thunderstorm
or a hurricane, nor can you pretest growing crops.
• Additionally, at times you may be unable to locate a suitable pretest, or, as just noted, the very act of pretesting can influence the results of the experimental manipulation.
• In such circumstances, the posttest-only control group design offers a possible solution
68
• The design may be thought of as the last two groups of the Solomon four-group design. The paradigm for the posttest-only approach is as follows:
• Random assignment to groups is, of course, critical in the posttest-only design.
• Without it, the researcher has nothing more than a static group comparison (Design 3), from which, for reasons previously noted, the researcher has a difficult time drawing inferences about cause and effect.

69
Design 7: Within-Subject Design
• Throughout the book we have been using the term participants when referring to people who participate in a research study.
• Some disciplines (e,g., psychology) often use the term subjects instead.
• This term has a broader meaning than participants in that it can be used to refer to a wide variety of populations-perhaps human beings, dogs, pigeons, or laboratory rats.
70
• By within-subjects design, we mean that all participants receive two (or possibly more) different treatments simultaneously, and the potential effects of each treatment are observed.
• If we use the subscripts a and b to designate the different treatments and treatment-specific measures, then, in its simplest form, the design is as follows:
71
• You may also see the term repeated-measures design used for such a study, b/c the dependent variable is measured more than once, w/ the effect of each treatment being assessed separately.
• As an example, imagine that a researcher wants to study the effects of illustrations in teaching science concepts to sixth graders.
• The researcher creates a short textbook that presents, say,20 different concepts.
• In the textbook, all 20 concepts are defined and described w/ similar precision and depth.
• In addition, the text illustrates 10 of those concepts (chosen randomly) w/ pictures or diagrams.
72
• After students read the book, they take a test that assesses their understanding of the 20 concepts, and the researcher computes separate test scores for the illustrated and nonillustrated concepts.
• If the students perform better on test items for illustrated concepts than on items for nonillustrated ones, the researcher can reasonably conclude that, yes, illustrations help students learn science more effectively.
• In other words, the researcher has identified a cause-and-effect relationship.

73
• For a within-subjects design to work, the various forms of treatment must be such that their effects are fairly localized and unlikely to "spread“ beyond specifically targeted behaviors.
• This is the case in the study just described: The illustrations help students learn the particular concepts that have been illustrated but do not help students learn science more generally.
• In contrast, it would not make sense to use a within-subjects design to study the effects of two different psychotherapeutic techniques to reduce adolescents' criminal behaviors: If the same group of adolescents receives both treatments and then shows a significant reduction in juvenile offenses, we might suspect that either treatment could have had a fairly broad impact.
74
• Ideally, too, the two different treatments should be administered repeatedly, one after another, in a balanced, but somewhat random order.
• For example, in the textbook that presents both illustrated and nonillustrated science concepts, we might begin w/ an illustrated concept, the have two nonillustrated ones, then another illustrated one, another nonillustrated one, two illustrated ones, and so on, w/ the presentation of the two conditions being evenly balanced throughout the book.
75
Quasi-Experimental Design• In the preceding discussion of true experimental designs,
we emphasized the importance of randomness, either in the selection of group members in a multiple-groups study or in the presentation of different treatments in a single-group study.
• Sometimes, however, randomness is not possible or practical.
• In such situations, researchers often use quasi-experimental designs.
• When they conduct quasi-experimental studies, they do not control for all confounding variables and so cannot completely rule out some alternative explanations for the results they obtain.
• They must take whatever variables and explanations they have not controlled for into consideration when they interpret their data.
76
Design 8: Nonrandomized Control Group Pretest-Posttest Design
• The nonrandomized control group pretest-posttest design can perhaps best be described as lying somewhere b/w the static group comparison (Design 1) and the pretest-posttest control group design (Design 4).
• Like Design 3, it involves two groups to which participants have not been randomly assigned.
• But it incorporates the pretreatment observations of Design 4.

77
• In sum, the nonrandomized control group pretest-posttest design can be depicted as follows:
• Without random assignment, there is, of course, no guarantee that, prior to the experimental treatment or intervention, the two groups are similar in every respect-that any differences b/w them are due entirely to chance
78
• However, an initial observation (e.g., pretest) can confirm that the two groups are at least similar in terms of the dependent variable under investigation.
• If, after one group has received the experimental treatment, we then find group differences w/ respect to the dependent variable, we might reasonably conclude that the posttreatmentdifferences are probably the result of that treatment.
79
• Identifying matched pairs in the two groups is one way of strengthening the pretest-posttest control group design.
• For instance, if we are studying the effect of a particular preschool program on children's IQ scores, we might find pairs of children-each pair including one child who is enrolled in the preschool program and one who is not-who are the same sex and age and have similar IQ scores before the program begins.
• Although we cannot rule out all other possible explanations in this situation, we can at least rule out some alternative explanations.
80
Design 9: Simple Time-Series Design
• In its simplest form, a time-series design consists of making a series of observations (i.e., measuring the dependent variable on several occasions), introducing an intervention or other new dynamic into the system, and then making additional observations.
• If a substantial change results in the second series of observations, we may reasonably assume that the cause of the change was the factor introduced into the system.

81
• This design thus looks something like the following:
• In such studies, the sequence of observations made prior to the treatment is often referred to as baseline data.
82
• Such a design has been widely used in the physical and biological sciences.
• Sir Alexander Fleming's discovery that Penicilliumnotatum (a mold) could inhibit staphylococci (a type of bacteria) is an example of this type of design.
• Fleming had observed the growth of staphylococci on a culture plate n number of times.
• Then, unexpectedly, a culture plate containing well-developed colonies of staphylococci was contaminated w/ the spores of Penicillium notatum.
• Fleming observed that the colonies near the mold seemed to disappear.
• He repeated the experiment w/ the bacteria and the mold in company w/ each other.
• Each time, his observation was the same: no staphgerms near the mold.
83
• The major weakness of this design is the possibility that some other, unrecognized event may occur at the same time that the experimental treatment does (a confounding variable sometimes known as history).
• If this other event is actually the cause of the change, then any conclusion that the treatment has brought about the change will, of course, be an erroneous one.
84
Design 10: Control Group, Time-Series Design
• In a variation of the time-series design, two groups are observed over a period of time, but one group (a control) does not receive the experimental treatment.
• The design is configured as follows:

85
• This design has greater internal validity than the simple time-series design (Design 8).
• If an outside event is the cause of any changes we observe, then presumably the performance of both groups will be altered after the experimental treatment takes place.
• If, instead, the experimental treatment is the factor that affects performance, then we should see a change only for Group 1.
86
Design 11: Reversal Time-Series Design
• The reversal design uses a within-subjects approach as a way of minimizing (though not entirely eliminating) the probability that outside effects might bring about any changes observed.
• The intervening experimental variable is sometimes present, sometimes absent, and we measure the dependent variable at regular intervals.
87
• Thus, we have the following design:
• To illustrate, suppose we are interested in whether audiovisual materials help students learn astronomy.
• On some days we might include audiovisual materials in a lesson, and on other days we might omit them.
• We can then measure how effectively students learn under both conditions.
• If the audiovisual materials do, in fact, promote student learning, then we should see consistently better student performance on those days.
88
Design 12: Alternating Treatment Design
• A variation on the reversal design involves including two or more different forms of the experimental treatment in the design.
• Referring to the two different forms of treatment w/ the notations Txa and Txb, we can depict such a design in the following manner:
• If such a sequence were pursued over a long enough time span, then we would presumably see different effects for the two different treatments.

89
Design 13: Multiple Baseline Design
• Designs 11 and 12 are based on the assumption that the effects of any single treatment are temporary and limited to the immediate circumstances.
• But what do we do if a treatment is likely to have long-lasting and perhaps more general effects?
• If the treatment is truly apt to be beneficial, then ethical considerations may discourage us from including an untreated control group.
• In such instances, a multiple baseline design provides a good alternative.
• This design requires at least two groups. • Prior to the treatment, baseline data is collected for all groups, and
then the treatment itself is introduced at a different time for each group.
90
• In its simplest form, a multiple baseline design might be configured as follows:
• A study by Heck, Collins, and Peterson (2001) provides an example of this approach.
• The researchers wanted to determine if instruction in playground safety would decrease elementary school children's risky behaviors on the playground.
91
• The treatment in this case involved a 5-day intervention in which a woman visited the classroom to talk about potentially risky behaviors on slides and climbing equipment, as well as about the unpleasant consequences that might result from such behaviors.
• The woman visited four classrooms on different weeks; a random selection process resulted in her visiting the first grade class one week, the second grade class the following week, and the kindergarten and third grade classes (which went to recess at the same time) the week after that.
• Meanwhile, two independent observers simultaneously counted the number of risky behaviors on the playground before, during, and after the intervention.
• The data they collected are depicted in Figure 10.1; number of risky behaviors on the slide are shown with the lighter dots, whereas those on the climbing equipment art shown with the darker dots.
92

93
• Notice how each group has data for three time periods: a pre-intervention baseline period, the 5-day safety-training period, and a post-training follow-up period.
• As you can see, the children showed fairly rapid declines in risky behavior on the slide once safety training began.
• Those groups who used the climbing equipment most frequently (the second and third graders) showed a concurrent decline in risk taking on that equipment.
• B/c the behavior changes occurred at different times for the three groups, and in particular when each group began the safety training, the researchers reasonably concluded that the training itself, rather than something else in the school environment or elsewhere, was probably the reason for the change.
94
Using Design 11, 12, 13 in Single-Subject Studies
• Reversal, alternating treatment, and multiple baseline designs can be used not only w/ groups but also w/ single individuals, in what are collectively known as single-subject designs.
• A study by Deaver, Miltenberger, and Stricker (2001) illustrates how a researcher might use two of these, reversal and multiple baseline, simultaneously.
• A 2-year-old girl named Tina had been referred for treatment b/c she often twirled her hair w/ her fingers so vigorously that she pulled out some of her hair.
• On one occasion she wrapped the hair around a finger so tightly that it began to turn blue and the hair had to be removed with scissors.
95
• Tina engaged in such behavior primarily when she was alone (e.g., at naptime); hence, there was no parent or other adult present to discourage it.
• The researchers identified a simple treatment-putting thin cotton mittens on her hands-and wanted to document its effect.
• They videotaped Tina's behaviors when she was lying down for a nap in either of two settings, her bedroom at home or her daycare center, and two observers independently counted the number of hair twirling incidents as they watched the videotapes.
96
• Initially, the observers collected baseline data. • Then, during separate time periods for the
bedroom and daycare settings, they gave Tina the mittens to wear during naptime.
• After reversing back to baseline in both settings, they had Tina wear the mittens once again.
• The percentages of time that Tina twirled her hair in the two settings over the course of the study are presented in Figure 10.2.

97 98
• In both the bedroom and daycare settings, the researchers alternated b/w baseline and treatment; this is the reversal aspect of the study.
• Furthermore, they initiated, and then later reinitiated the treatment, at different times in the two settings; this is the multiple baseline aspect of the study.
• Figure 10.2 consistently shows dramatic differences in hair twirling during baseline vs. mittens conditions, leading us to conclude that the mittens, rather than some other factor, were almost certainly the reason for the disappearance of hair twirling.
99
Ex Post Facto Design
• In many situations, it is unethical or impossible to manipulate certain variables in order to investigate their potential influence on other variables.
• For example, one cannot introduce a new virus, withhold instruction, ask parents to abuse their children, or modify a person's personality to compare the effects of these factors on the dependent variables in one's research problem.
100
• Ex post facto designs (the term ex post facto literally means "after the fact") provide an alternative means by which a researcher can investigate the extent to which specific independent variables (a virus, a modified curriculum, a history of family violence, or a personality trait) may possibly affect the dependent variable(s) of interest.
• Although experimentation is not feasible, the researcher identifies events that have already occurred or conditions that are already present and then collects data to investigate a possible relationship b/w these factors and subsequent characteristics or behaviors.

101
• After observing that different circumstances have prevailed among two or more groups (e.g., some children are vaccinated against chicken pox, whereas others are not; one preschool provides extensive training in drawing and art, whereas another does not), an astute researcher attempts to determine whether these different circumstances preceded an observed difference on some dependent variable (e.g., reported number of cases of chicken pox, development of artistic skills).
102
• Ex post facto designs are often confused with correlational or experimental designs b/c they have similarities w/ both types of designs.
• Like correlational research, ex post facto research involves looking at existing conditions.
• But like experimental research, it has clearly identifiable independent and dependent variables.
103
• Unlike experimental studies, however, ex post facto designs involve no direct manipulation of the independent variable: The presumed "cause" has already occurred.
• To the extent that such manipulation is not possible, the researcher cannot draw firm conclusions about cause and effect.
• The problem here is that the experimenter cannot control for confounding variables that may provide alternative explanations for any group differences that are observed.
104
• Although an ex post facto study lacks the control element-and so does not allow us to draw definite conclusions about cause and effect-it is nevertheless a legitimate research method that pursues truth and seeks the solution of a problem through the analysis of data.
• Science has no difficulty w/ such a methodology. • Medicine uses it widely in its research activities. • Physicians discover an illness and then inaugurate their
search "after the fact.“• They sleuth into antecedent events and conditions to
discover a possible cause for the illness. • Such was the approach of medical researchers when the
AIDS virus emerged in the 1980s.
105
• Like experimental designs, ex post facto designs may take a variety of forms.
• Here we present one possible design for illustrative purposes.
• We will also present a second ex post facto design in the subsequent section on factorial designs.
106
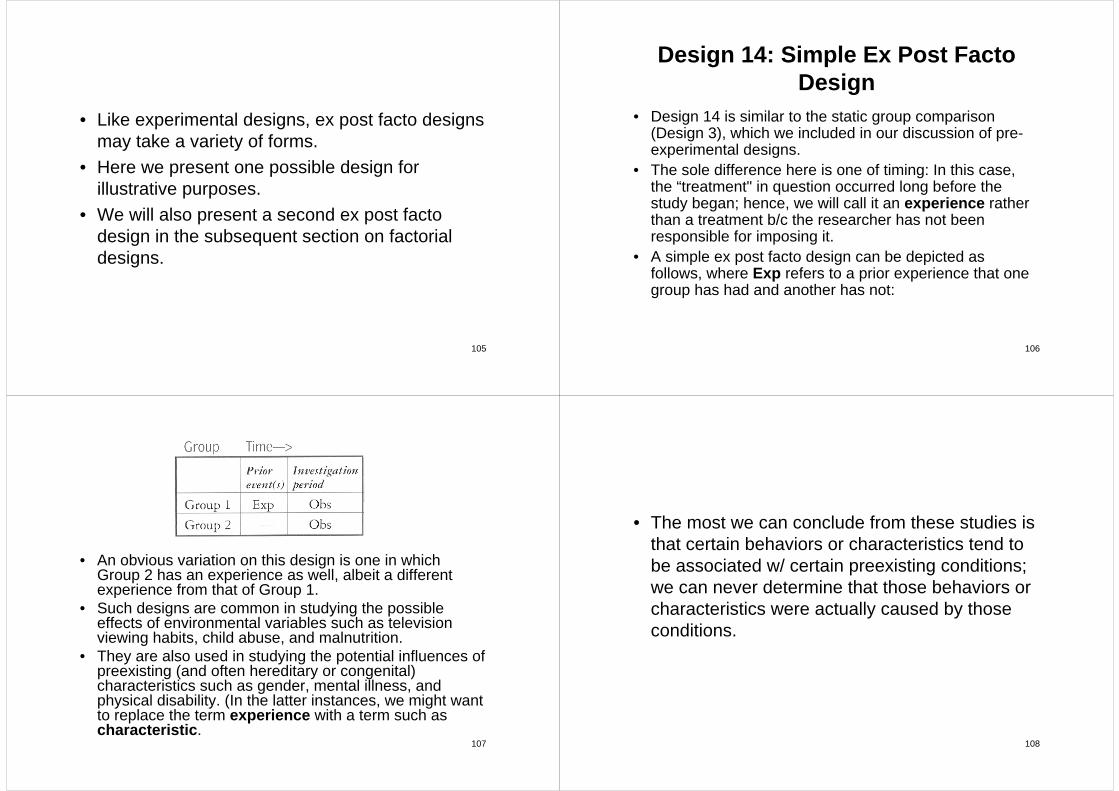
Design 14: Simple Ex Post Facto Design
• Design 14 is similar to the static group comparison (Design 3), which we included in our discussion of pre-experimental designs.
• The sole difference here is one of timing: In this case, the “treatment" in question occurred long before the study began; hence, we will call it an experience rather than a treatment b/c the researcher has not been responsible for imposing it.
• A simple ex post facto design can be depicted as follows, where Exp refers to a prior experience that one group has had and another has not:
107
• An obvious variation on this design is one in which Group 2 has an experience as well, albeit a different experience from that of Group 1.
• Such designs are common in studying the possible effects of environmental variables such as television viewing habits, child abuse, and malnutrition.
• They are also used in studying the potential influences of preexisting (and often hereditary or congenital) characteristics such as gender, mental illness, and physical disability. (In the latter instances, we might want to replace the term experience with a term such as characteristic.
108
• The most we can conclude from these studies is that certain behaviors or characteristics tend to be associated w/ certain preexisting conditions; we can never determine that those behaviors or characteristics were actually caused by those conditions.

109
Factorial Designs
• Thus far, we have been describing designs in which only one independent variable is studied.
• Yet in many situations, a researcher examines the effects of two or more independent variables in a single study; this approach is known as a factorial design.
110
Design 15: Randomized Two-Factor Design
• In its simplest form-one involving two independent variables, which we'll call Variable 1 and Variable 2-such a design might look something like the following:
111 112
• We can determine the effects of the first independent variable by comparing the performance of Groups 1 and 2 w/ that of Groups 3 and 4.
• We can determine the effects of the second independent variable by comparing Groups 1 and 3 w/ Groups 2 and 4.
• If you think you've seen this design before, in a way you have.
• This is simply a more generalized form of the Solomon four-group design (Design 5), but we are no longer limiting ourselves to having the presence or absence of a pretest be one of our independent variables.

113
• Such a design allows us to determine not only the possible effects of two independent variables but also whether those variables interact in some way as they influence the dependent variable.
• For instance, imagine that, after presenting both treatments, we find that Groups 2, 3, and 4 show similar performance but that Group 1 outperforms the other three.
• Such a result may indicate that neither independent variable produces a particular effect on its own-that both variables are necessary to bring about the effect.
114
Design 16: Combined Experimental and Ex Post Facto Design
• In the factorial design just presented, participants are randomly assigned to groups in a true experimental study.
• But it is also possible to combine elements of experimental research and ex post facto research into a single factorial design.
• In its simplest form, such a design might look the following:
115 116
• In this case, the researcher initially divides the sample into two groups based on the participants’ previous experiences or preexisting conditions; this is the ex post facto part of the study.
• Then the researcher randomly assigns members of each group into one of two treatment groups (or perhaps a treatment group and a control group); this is the experimental part of the study.
• The result is four groups that represent all four possible combinations of the previous experience/preexisting characteristic and the treatment variable.
• Such a design enables the researcher to study how an experimental manipulation may influence some dependent variable and how a previous experience or preexisting characteristic may possibly interact w/ that manipulation.

117
• As a variation on such a design, the experimental manipulation might be a within-subjects variable rather than a between-groups variable.
• As an example, one of us authors once joined forces w/ two colleagues and a graduate student to test the hypothesis that people w/ different educational backgrounds interpret and remember maps differently and, more specifically, that only people with a background in geography apply general principles of geography when they interpret maps.
118
• We constructed two maps to test our hypothesis.• One map (see Figure 10.3) was arranged in accordance
with the patterns of a typical city; for instance, a downtown business district was located at a point where it could be easily reached from different directions (this is typical), and factories, a lumberyard, and low-income housing were situated near railroad tracks (also typical).
• The second map (see Figure 10.4) was less "logical" in the sense that it violated basic geographic principles; for instance, a river originated in the plains and ran up into a mountain range, and various transportation networks did not interconnect in the way that they normally do.
• The two different maps reflected one of our independent variables: logic of the spatial arrangement of features within a map.
119 120
121
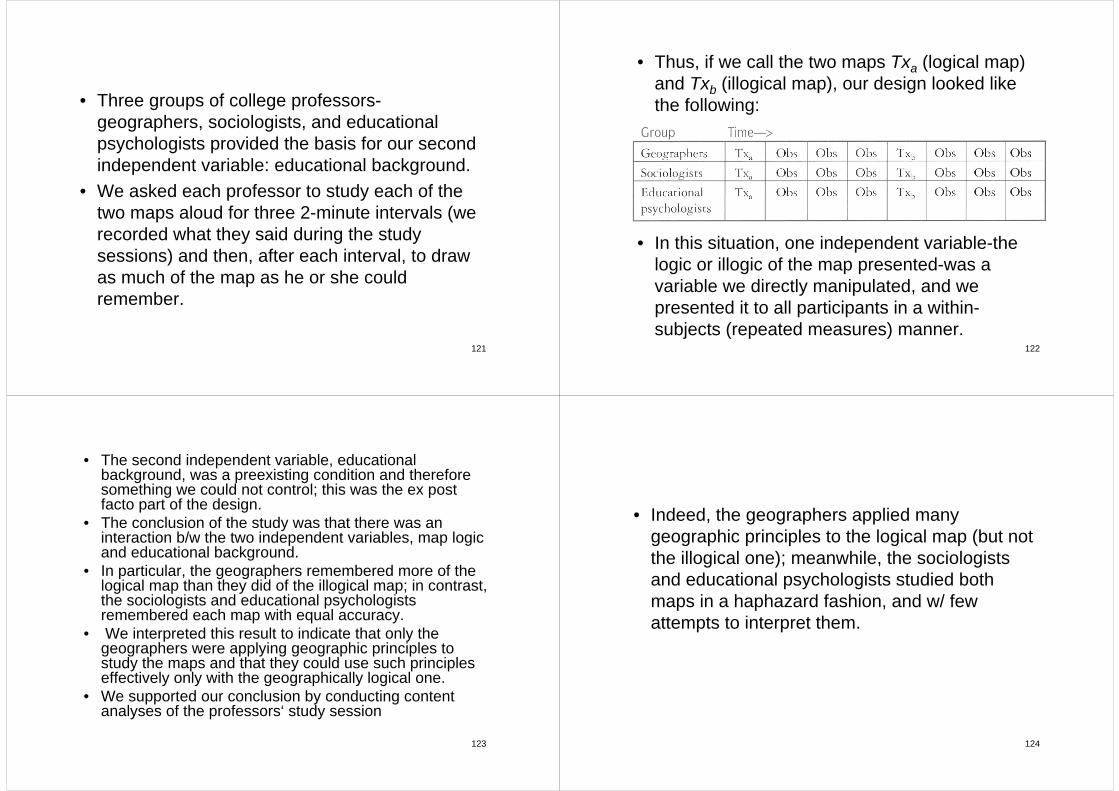
• Three groups of college professors-geographers, sociologists, and educational psychologists provided the basis for our second independent variable: educational background.
• We asked each professor to study each of the two maps aloud for three 2-minute intervals (we recorded what they said during the study sessions) and then, after each interval, to draw as much of the map as he or she could remember.
122
• Thus, if we call the two maps Txa (logical map) and Txb (illogical map), our design looked like the following:
• In this situation, one independent variable-the logic or illogic of the map presented-was a variable we directly manipulated, and we presented it to all participants in a within-subjects (repeated measures) manner.
123
• The second independent variable, educational background, was a preexisting condition and therefore something we could not control; this was the ex post facto part of the design.
• The conclusion of the study was that there was an interaction b/w the two independent variables, map logic and educational background.
• In particular, the geographers remembered more of the logical map than they did of the illogical map; in contrast, the sociologists and educational psychologists remembered each map with equal accuracy.
• We interpreted this result to indicate that only the geographers were applying geographic principles to study the maps and that they could use such principles effectively only with the geographically logical one.
• We supported our conclusion by conducting content analyses of the professors‘ study session
124
• Indeed, the geographers applied many geographic principles to the logical map (but not the illogical one); meanwhile, the sociologists and educational psychologists studied both maps in a haphazard fashion, and w/ few attempts to interpret them.

125
• A summary of the pre-experimental, experimental, quasi-experimental, ex post facto, and factorial designs described in the preceding sections appears in Table 10.1.
• Keep in mind that, as stated earlier, this is not an exhaustive list of experimental and ex post facto designs.
• You can combine and expand on these designs in a number of ways-and perhaps incorporate elements of qualitative or descriptive-quantitative designs (e.g., content analysis or longitudinal data collection) as well-to more effectively address your own research question.