a quantitative examination of title i and non-title i...
TRANSCRIPT

A QUANTITATIVE EXAMINATION OF TITLE I AND NON-TITLE I ELEMENTARY
SCHOOLS IN DISTRICT 8 OF NORTH ALABAMA USING
FOURTH GRADE MATH AND READING
STANDARDIZED TEST RESULTS
by
RENEE ASHLEY HEADEN
DOUGLAS MCKNIGHT, COMMITTEE CHAIR
NATALIE ADAMS
DAVID DAGLEY
ROXANNE MITCHELL
STEPHEN TOMLINSON
PHILIP WESTBROOK
A DISSERTATION
Submitted in partial fulfillment of the requirements
for the degree of Doctor of Education
in the Department of Educational Leadership,
Policy, and Technology Studies
in the Graduate School of
The University of Alabama
TUSCALOOSA, ALABAMA
2014

Copyright Renee Ashley Headen 2014
ALL RIGHTS RESERVED

ii
ABSTRACT
The purpose of this study was to determine if there is a difference over time on
standardized test scores for reading and math between fourth grade students attending Title I and
Non-Title I schools in three select school systems within District 8 of North Alabama. In an
effort to determine if Title I schools are successfully closing the achievement gap of Title I and
Non-Title I schools, a quantitative and ex-post facto design was used to analyze the data. The
study was limited to the aggregated longitudinal school data of fourth grade students on the
Alabama Reading and Math Test (ARMT). Data used were collected from the Alabama State
Department of Education. A Repeated Measures Analysis was conducted to gain an
understanding of the effects federal Title I funding has on the achievement of low socioeconomic
status students. The independent variable was the type of school the student attended (Title I
School vs. Non-Title I School), and the repeated measure over time was the years that these
students were tested (2004, 2008, and 2012). Gender and ethnicity were controlled variables.
Dependent variables were math and reading achievement. Elementary schools served as the unit
of analysis for the study.
The results of the study revealed that during the years of 2004, 2008, and 2012, students
who attended Non-Title I schools performed at a higher achievement level then their Title I
peers. However, Title I schools decreased the achievement gap over time. White students had the
highest performance in each year studied. Black students had the lowest performance in each
year studied; however, of all the groups studied, Black students had the sharpest increase in
performance between 2008 and 2012.

iii
While the performance for both Whites and Blacks improved over time, Whites
outperformed Blacks in every year studied. In fact, Whites were the highest performing subgroup
and Blacks were the lowest performing subgroup. Similarly, Whites outperformed Blacks
regardless of the type of school they attended. Female students outperformed their male
counterparts in all areas. Females outperformed males in every year studied regardless of the
type of school they attended.

iv
DEDICATION
This dissertation is dedicated to my family, who supported me throughout this endeavor.
I want to give a special thanks to my husband and best friend Quinn. I could not have picked a
better person to share my life with. To my two little redheaded angels, Quinn II (Lil’ Quinn) and
Ashley Rose. It is because of you that I continued my education. To my parents, Nathaniel and
Rose Ashley, who were my first and, certainly, my most influential teachers, you taught by
example and I learned from your actions. To my sister, Tammie Cameron, for all the good times
we had growing up. You often believed in me when I failed to believe in myself. To my
handsome nephew, Victor (Trey), and my beautiful niece, Madison, for all the beautiful smiles.
To my gracious cousin, Santrice Turner, thank you so much for your help with my children. Last
but not least, to my gorgeous aunts, Mary, Dorothy, and Lutisha, at New Image Beauty Salon for
always making me feel special.

v
ACKNOWLEDGMENTS
I would like to express my sincere appreciation to my advisory committee members for
their endless support, time, patience, and expertise: Dr. Natalie Adams, Dr. David Dagley, Dr.
Roxanne Mitchell, Dr. Stephen Tomlinson, and Dr. Philip Westbrook. A special thank you to Dr.
Douglas McKnight for serving as chairperson. I would also like to thank Mrs. Sherri Edwards for
her support with editing. Your guidance throughout this process was priceless.

vi
CONTENTS
ABSTRACT .................................................................................................................................... ii
DEDICATION ............................................................................................................................... iv
ACKNOWLEDGMENTS ...............................................................................................................v
LIST OF TABLES ......................................................................................................................... ix
LIST OF FIGURES .........................................................................................................................x
1 INTRODUCTION .....................................................................................................................1
Statement of the Problem .....................................................................................................4
Purpose of the Study ............................................................................................................5
Research Questions ..............................................................................................................6
Definition of Terms..............................................................................................................6
Limitation of Study ............................................................................................................10
2 REVIEW OF LITERATURE ..................................................................................................12
Introduction ........................................................................................................................12
The Beginning of Accountability in Education .................................................................13
Title I ..................................................................................................................................14
No Child Left Behind Act ...................................................................................................17
Components of No Child Left Behind ................................................................................18
Legal Issues ........................................................................................................................20
Title I Funding ...................................................................................................................21
Supplemental Services Funded by Title I ..........................................................................21

vii
Math and Reading Intervention ...................................................................................22
Supplemental Services Provider ..................................................................................23
Students’ Grade and Sex ..............................................................................................24
Race and Ethnicity .......................................................................................................24
Segregation and Racial Issues in Our Schools ...................................................................25
Technology Equality among Schools ................................................................................27
Teaching Techniques .........................................................................................................28
Poverty and Education .......................................................................................................29
The American Recovery and Reinvestment Act of 2009 ..................................................31
Background of Head Start ..................................................................................................32
Special Education...............................................................................................................34
Accountability in Alabama ................................................................................................35
Alabama Reading and Math Test (ARMT) .......................................................................36
High Stakes Testing ...........................................................................................................36
Achievement Gap...............................................................................................................37
Positives of the No Child Left Behind Act .........................................................................39
Negatives of the No Child Left Behind Act ........................................................................39
Recent Studies on Title I/Non-Title I Schools ...................................................................41
Summary ............................................................................................................................44
3 METHODOLOGY ..................................................................................................................47
Introduction ........................................................................................................................47
Statement of the Problem ...................................................................................................48
Research Questions ............................................................................................................48

viii
Research Methodology ......................................................................................................49
Research Design.................................................................................................................49
Population and Sample ......................................................................................................49
Selection Procedures ..........................................................................................................50
Phases of Data Collection ..................................................................................................51
Instrumentation ..................................................................................................................51
Summary ............................................................................................................................52
4 DATA ANALYSIS ..................................................................................................................53
5 SUMMARY OF FINDINGS, CONCLUSIONS, AND RECOMMENDATIONS .................62
Summary of Findings .........................................................................................................62
Implication of the Study.....................................................................................................64
Conclusions ........................................................................................................................65
Significance of the Study ...................................................................................................65
Recommendations for Further Research ............................................................................66
Summary of the Study .......................................................................................................67
REFERENCES ..............................................................................................................................68
APPENDIX:
A IRB EXEMPTION LETTER .............................................................................................73

ix
LIST OF TABLES
1 Repeated Measures Descriptive Statistics ...............................................................................55
2 Repeated Measures Multivariate Tests ....................................................................................56
3 Repeated Measures Test of Between Subjects Effect ..............................................................57
4 Repeated Measures Multiple Comparison Post Hoc ...............................................................57
x
LIST OF FIGURES
1 Estimated marginal means for Title I schools and Non-Title I schools ...................................59
2 Estimated marginal means for each year--2004, 2008, and 2012 ............................................59

1
CHAPTER 1
INTRODUCTION
In April of 1965, President Lyndon B. Johnson, as part of his War on Poverty, signed into
law the Elementary and Secondary Education Act (ESEA). President Johnson’s goal was to
provide federal funding to the states to help improve achievement levels of underprivileged
children (Patterson, 2010). James T. Patterson in his book, Freedom is Not Enough, quotes
President Lyndon B. Johnson stating,
“Freedom is not enough. You do not wipe away the scares of centuries by saying: Now
you are free to go where you want, do as you desire, and choose the leaders you please.
You do not take a person who, for years, has been hobbled by chains and liberate him,
bring up to the starting line of a race then say, “You are free to compete with all the
others,” and still justly believe that you have been completely fair (p.ix).”
In 2002, President George W. Bush began implementation of the reauthorization of
ESEA under a new name. The No Child Left Behind Act (NCLB) is the instrument used for
determining accountability in American schools that accepts any federal funds. The goal of
NCLB is to have all students proficient by 2014, which means each year all schools are required
to make Adequate Yearly Progress (AYP). AYP is based on a specific formula established by the
government under NCLB. The authorized guidelines of NCLB are currently being reviewed by
the United States Congress for reauthorization (USDOE, 2002a). Several states have submitted
letters requesting permission to dismiss portions of the requirements of its regulations. Research
should be conducted to analyze if any parts of NCLB worked. It is important to note that the
requirements of No Child Left Behind are law until redirected by our government. NCLB is the

2
only guidelines our government has to determine if schools are successfully meeting the goals of
accountability or Adequate Yearly Progress (AYP).
This study compared longitudinal data of Title I and Non-Title I schools in the academic
content areas of reading and math in three select North Alabama school systems within District
8. Data were gathered from the Alabama Reading and Math Test (ARMT) to determine if there
is an academic difference based on gender and race in Title and Non-Title I schools. In essence,
the goal of No Child Left Behind and the disbursement of Title I funds is to close the
achievement gap that exists between Title I and Non-Title I schools. The Alabama Reading and
Math Test (ARMT) are used to evaluate Adequate Yearly Progress (AYP) of schools and school
systems throughout the state of Alabama, as determined by the No Child Left Behind Act
(NCLB). The scores are generated and displayed by the State of Alabama Department of
Education and are widely accessible for review.
This study is a replica of a study conducted by Amy Scott in 2005 and again by Bland-
Washington in 2009. Scott’s study focused on Title I and Non-Title I elementary schools in East
Tennessee using Grade 4 math and reading standardized test scores. As in the study conducted
by Scott, Bland-Washington’s study also focused on assessment data of Title I and Non-Title I
elementary schools in West Georgia. Replication of Scott’s and Bland-Washington’s studies
using a different cluster of students under like conditions should endorse the validity of these
previous studies (Gall, Gall, & Borg, 2007). This study goes a bit further by reviewing
aggregated longitudinal Reading and Math data from 2004, 2008, and 2012 of all schools
involved. Subsequently, each of the before mentioned replicated studies was conducted in states
surrounding the state in which this study took place. This adds an additional factor to the
research topic.

3
To measure progress of elementary students, the state of Alabama uses mandatory
standardized testing. The results of the ARMT standardized test scores are merely one element
that determines the AYP status of a school. A minimum student participation rate of 95% is
another requirement of NCLB for schools to make AYP (USDOE, 2002a). NCLB examines
student performance using the subgroups of special education, race, and economic status of Title
I and Non-Title I schools. Schools with a minimum of 40% of their students receiving
free/reduced lunch can obtain the status of Title I. The purpose of Title I is to provide financial
support to students of low-income families. The additional money may be used to hire qualified
staff members or to purchase supplementary services that support the curriculum. Funds may
also be used to support new teaching practices and initiatives (Sunderman, 2006).
Like the Elementary and Secondary Education Act (ESEA), the goal for NCLB is to
improve the academic achievement of deprived students by ensuring they are given a fair, equal,
and significant opportunity to obtain a high-quality education (USDOE, 2004a).The results of
this study may be used to determine if federal funding of Title I schools is in fact leveling the
field for identified subgroups. The purpose of this study is to add to the existing literature and to
provide a better understanding of the academic differences among race and gender subgroups
based on their school setting, thus answering the question, “Do students in these subgroups
identified by NCLB perform better in Non-Title I schools as opposed to Title I schools?”
In 2005, a study was conducted by Amy Scott to determine a difference in Reading and
Math of fourth grade students attending Non-Title I schools and Title I schools. Data collected
from the 2002-2003 Terra Nova Standardized Assessment Test were analyzed to determine the
academic progress of 172 elementary schools located in 21 East Tennessee school systems. As in
the original study conducted by Scott (2005), a quantitative method was used to focus on the

4
following subgroups: race and gender. However, to eliminate the possibility of bias, the
researcher followed the guide given by Bland-Washington (2009). The study conducted by
Bland-Washington used a descriptive and ex-post facto design methodology. Bland-
Washington’s study focused on the following subgroups: gender, economically disadvantaged
students, and students with disabilities.
Statement of the Problem
Research shows that schools of low social economic status face the biggest discrepancy
in academic success (Noguera, 2009). Academic success as measured by No Child Left Behind
is the students’ ability to score proficient or to earn a passing standardized test score. For a
school to be considered successful, students must show Adequate Yearly Progress (AYP) as
determined by preset standards provided by NCLB (USDOE, 2004a). It has been well
documented that certain subgroups, because of the lack of exposure and background knowledge,
tend to be at a disadvantage for succeeding academically (Noguera, 2009). It appears, since
President Johnson delivered his controversial speech encouraging all to realize that “Freedom is
not Enough,” the United States has yet to come close to securing the egalitarian racial goals
Johnson outlined in his speech. In an effort to level the playing field of all students, despite
economic status, Title I funding is provided to schools with high poverty enrollment (Patterson,
2010). Although these additional funds are provided, schools receiving Title I funds are
struggling to decrease the achievement gap. Now with the implementation of No Child Left
Behind, low socioeconomic schools that fail to show adequate yearly progress are at risk of
losing the federal financial support, which they so desperately need (USDOE, 2004a).
Schools receiving federal funds to decrease the gap of students in low social economic
homes are now held accountable for student achievement. It is evident that the test results are

5
lower in Title I elementary schools than the test results of Non-Title I schools (Bland-
Washington, 2009). Student with a minimum of 40% of enrolled students labeled economically
disadvantaged may apply for Title I status. As in Bland-Washington’s study, students receiving
free or reduced lunch are considered economically disadvantaged students. No Child Left Behind
holds schools/school districts accountable by requiring each school to show an increase in
student proficiency levels or Adequate Yearly Progress (AYP) within each subgroup every year
(USDOE, 2002b). All states, including Alabama, have been directed by No Child Left Behind to
devise assessment methods to measure the progress of students. Schools and school districts that
fail to make AYP may lose funding. Consequences are given to schools constantly failing to
achieve AYP status. Consequences may include the creation of school and district-wide
improvement plans, restructuring, and rigorous state monitoring. Failing to achieve AYP status
over time also provides students who attend schools that receive Title I funding the choice of
receiving additional tutoring from an outside provider and/or the option of transferring to another
school (USDE, 2004a).
Purpose of the Study
The purpose of this study was to determine if there is a difference in standardized test
scores in reading and math between fourth grade students in Title I schools and those in Non-
Title I schools. This study focused on the following subgroups: race and gender. The data from
this study will add to the existing body of knowledge concerning the academic achievements of
students based on gender and race in both Title I and Non-Title I schools. The researcher
analyzed aggregated longitudinal data from the Alabama State Department website for evidence
of improvement within a 6-year span in Non-Title I and Title I schools.

6
To analyze the changes in achievement over time a repeated measures ANOVA was
selected as the instrument. The three time points (2004, 2008, and 2012) and the types of school
(Title I or Non-Title) served as independent variables. Gender, and ethnicity were control
variables for this study. Math and Reading assessment results from the Alabama Reading and
Math (ARMT) test served as dependent variables for the study and schools was the unit of
analysis.
Research Questions
1. What is the difference in the academic achievement in Math and Reading between
Title 1 and Non-Title 1 schools in 2004, 2008, and 2012 academic years?
2. Are there differences in the academic achievement based on ethnicity between Title 1
and Non-Title 1 schools in the 2004, 2008, and 2012 academic years?
3. Are there differences in academic performance based on gender between Title 1 and
Non-Title 1 Schools in the 2004, 2008, and 2012 academic years?
4. Have the differences in academic achievement between Title 1 and Non-Title 1 schools
in academic achievement significantly decreased between 2004, 2008, and 2012?
Definition of Terms
Academic achievement: Measured by earning a passing standardized test score. The
progress that students make in school as determined by preset standards (Drake & Burns, 2004,
p. 19).
Accountability. Each state sets academic standards for what every child should know and
learn. Student academic achievement is measured for every child every year. The results of these

7
annual tests are reported to the public. The state identifies those schools requiring improvement
(Drake & Burns, 2004, p. 19).
Achievement gap: The difference between the performance of subgroups of students such
as gender, ethnicity, disability, and social economic status (Glossary of Education, 2011).
Adequate Yearly Progress (AYP): A measurement indicating whether a school, district or
the state met required federal academic goals devised under the Elementary and Secondary
Education Act as mandated by the No Child Left Behind Act (Glossary of Education,
2011USDOE, 2008a).
Assessment: Assessment is a synonym for test. No Child Left Behind (NCLB) requires
tests to be aligned with academic standards (Glossary of Education, 2008).
Black or African American: For the purpose of this study Black or African American is
defined as a person having origins of any of the Black racial groups of Africa.
Corrective action: When a school or school district does not make AYP, the state will
place it under corrective action plan. The plan will include resources to improve teaching,
administration, or curriculum. If a school continue to be identified as in need of improvement,
then the state has increased authority to make any necessary, additional changes to ensure
improvement (USDOE, 2004b).
Disaggregated data: Data broken into segments of the student population. Segments
include economically disadvantaged students may include but are not limited to ethnicity,
disabilities, race, gender, and limited language (Glossary of Education, 2008)
Elementary and Secondary Education Act (ESEA): Federal act devised in 1965 in an
effort to ensure an equal education to all students in Grades K-12 (Glossary of Education. 2011).

8
Economically disadvantaged: Students who qualify for free or reduced lunch based on
national standards (U.S. Department of Education, 2002, p. 16).
Head Start: A federal matching grant program that aims to improve the learning skills,
social skills, and health status of low social economic children (Glossary of Education, 2011).
Highly qualified teacher: a teacher who has obtained full state teacher certification or has
passed the state teacher licensing examination and holds a license to teacher in the state
(Glossary of Education, 2008).
Individualized Education Plan (IEP): A document that outlines the student’s measurable
goals and objectives for children identified with a disability (Daugherty, 2001).
Local Educational Agencies (LEAs): A public board of education, or other public
authority within a state, that maintains administrative control of public elementary or secondary
schools in a city, county, township, school district, or other political subdivision, of a state
(USDOE, 2004b).
National Assessment of Educational Progress (NAEP): An independent benchmark,
NAEP is the only nationally representative and continuing assessment of what American
students know and can do in various subject areas. Since 1969, the National Center for Education
Statistics has conducted NAEP assessments in reading, mathematics, science, writing, U.S.
history, geography, civics and the arts (Glossary of Education, 2011).
No Child Left Behind: The federal law was originally proposed in 2001, which enacts the
theories of standards-based education placing accountability on school districts to provide a
quality education for all students. An assessment of basic skills via standardized test determines
if states have made improvements under the Act’s regulations (USDOE, 2008c).
9
Proficient: Results of an assessment signifying that the student demonstrated mastery of
the skills and knowledge outlined in required standards (Glossary of Education, 2011).
Race/ethnicity: For the purpose of this study, race refers to students who identified
themselves as Black/African American or Caucasian/White (USDOE, 2002, p.16).
Reading First: A federal program dedicated to implementing research based methods of
early reading instruction into the classroom (Glossary of terms, 2011).
Restructuring: A school that fails to make adequate yearly progress (AYP) after 1 year of
corrective action. Such a school has failed to make AYP for 5 consecutive years. (Glossary of
Terms, 2011)
Social capital: Features social relationships, such as interpersonal trust, norms of
reciprocity, and membership in a civic organization, which act as resources individuals and
facilitate collective action for mutual benefit.
School improvement: A school in school improvement status is a school that fails for 2
consecutive years to make adequate yearly progress (AYP). A school can be in school
improvement status for 2 consecutive year: in the year it was first identified (after having failed
to make AYP for 2 consecutive years), and the following year (if AYP is not met for the third
consecutive year).
Socioeconomic status (SES): SES is determined by the student’s family income.
Student with disabilities (SWD): A student who has been evaluated and determined to
have a documented impairment that requires additional educational related service. A student
with a disability will usually have an Individualized Education Plan (IEP) that guides his or her
special education instruction to ensure he/she meets his/her learning goals. Students with
10
disabilities are often referred to as special education students and may be classified by their
school as learning disabled (LD) or emotionally disturbed (ED) (USDOE, 2002, p. 16).
Subgroup: Categories of race, gender, economic status, and disability (Definitions, 2012).
Supplemental Educational Services (SES): Students from low-income families who are
attending schools that have been identified as in need of improvement for two years will be
eligible to receive outside tutoring or academic assistance. Parents can choose the appropriate
services for their child from a list of approved providers. The school district will purchase the
services (USDOE, 2004b).
Targeted Assistance Programs: Schools that are not eligible for (or do not choose to
operate) school-wide programs must use Title I funds to provide targeted services to low-
achieving students (USDOE, 2002, p. 15).
Title I: Title I is a federal assistance program that allocates funds to school districts with
high percentages of students who are economically disadvantaged (U.S. Department of
Education, 2002, p. 13).
Title I schools: Schools that have a high population of students determined to be
economically disadvantaged and that receive funding based on this status. (USDOE, 2002, p.
13).
Unsafe schools: Persistently dangerous public elementary or secondary schools or if the
school has victims of violent crime in schools.
Limitation of Study
This study was limited to the achievement of all fourth grade students attending both
Title I and Non-Title I schools in three select North Alabama school systems of Regional District

11
8. Regional District 8 consists of 14 school districts. The school districts are as follows: Athens
City Schools, Attalla City Schools, Boaz City Schools, Decatur City Schools, Dekalb County
Schools, Etowah City Schools, Fort Payne City Schools, Gadsden City Schools, Huntsville City
Schools, Jackson County Schools, Limestone County Schools, Madison City Schools, Madison
County Schools, and Scottsboro City Schools. The researcher included the system in which she
works in an effort to provide information that may benefit the system. The schools involved
included a mixture of urban, suburban, and rural elementary schools. The school systems
selected consists of 98 elementary school, 31 middle schools, 31 high schools, 5 K-8 schools, 10
K-12 schools, and six 6-12 grade schools. There were no foreseeable risks.
The researcher analyzed data from the Alabama State Department website. The
researcher assumed all information collected from these sources, including subgroups, were
reported accurately using information provided by individual schools. Subgroups are recorded as
gender and race.

12
CHAPTER 2
REVIEW OF LITERATURE
Introduction
With the signing of the No Child Left Behind Act on January 8, 2002, came the
requirements of approved accountability plans devised and carried out by every district and
school receiving federal funding. Districts were required to submit accountability plans for
approval by the United States Department of Education. Plans had to include goals and strategies
directly related to subgroups (gender, ethnicity, special needs, and social economic status) of
learners. In essence, this plan requires states to focus more on the achievement gap. Under
former Presidents Bush’s plan, every child will learn regardless of race, socioeconomic
background, or family status. The success or failure of the No Child Left Behind Act is based on
a yearly test given to students in every state (USDE, 2001).
The scrutiny of accountability came with the adoption of No Child Left Behind. Now
more than ever, schools are being held accountable for the outcome of high-stakes tests. With the
Chicago teachers’ strike in 2012, it is important to understand the extent that accountability plays
in the careers of teachers. Chicago teachers felt the pressure of the national debate over how to
improve failing schools. Eighty percent of Chicago Public School students receive free or
reduced lunch, many of them struggling academically. Chicago leaders began to focus on closing
poor performing schools only to reopen with a new staff (Wisniewski, 2002). Test results are
now being used as a form of evaluating teachers.

13
The Beginning of Accountability in Education
Kessinger (2011) explained the launching of Sputnik by the Soviet Union over 60 years ago
and its impact on American education as one that is still affecting education today. The
launching spurred a movement to improve math and science instruction in America’s schools.
The National Defense Education Act (NDEA) was passed by Congress in 1958 as a direct
result of the launching of Sputnik. Policymakers and civilians alike thought the United States
Education System was losing ground to the Soviets. The NDEA provided money to school
organizations at all levels. The act has two major purposes: (1) provide the country with specific
defense-oriented personnel, to include providing federal assistance to foreign language scholars,
area studies centers, and engineering students; and (2) provide financial assistance through a
government sponsored loan program. The act placed enormous emphasis on math, science, and
foreign language education (Kessinger, 2011).
Since the launching of Sputnik in the 1950s, the United States government has developed
several reforms in an effort to improve the quality of education in the United States. One reform
introduced by President Johnson, a former teacher who had witnessed poverty’s impact on his
students and believed that equal access to education was vital to a child’s ability to lead a
productive life, devised the ESEA as part of the “War on Poverty.”
On April 9, 1965, Congress enacted the Elementary and Secondary Education Act of
1965 (ESEA) (P.L. 89-10), the most expansive federal education bill ever passed to date. The
purpose of ESEA was to provide equal education opportunities to all children. The ESEA had six
original titles: Title I--Financial Assistance To Local Educational Agencies For The Education
Of Children Of Low-Income Families; Title II--School Library Resources, Textbooks, and other
Instructional Materials; Title III--Supplementary Educational Centers and Services; Title IV--

14
Educational Research And Training; Title V--Grants To Strengthen State Departments Of
Education; and Title VI--General Provisions. Title I of the ESEA was the federal government’s
effort to tie funding to a national policy concern such as poverty. In providing funds to the state’s
poorest children, ESEA relied on the states to administer the funds (Spring, 2005).
Title I
The purpose of Title I funding is to improve the academic achievement of the
disadvantaged students by ensuring that these students are given a fair, equal, and significant
opportunity to obtain a high-quality education. The U. S. Department of Education (2004) gives
an outline of how this purpose can be accomplished;
(1) ensuring that high-quality academic assessments, accountability systems, teacher
preparation and training, curriculum, and instructional materials are aligned with
challenging State academic standards so that students, teachers, parents, and
administrators can measure progress against common expectations for student academic
achievement;
(2) meeting the educational needs of low-achieving children in our Nation’s highest-
poverty schools, limited English proficient children, migratory children, children with
disabilities, Indian children, neglected or delinquent children, and young children in need
of reading assistance;
(3) closing the achievement gap between high- and low-performing children, especially
the achievement gaps between minority and nonminority students, and between
disadvantaged children and their more advantaged peers;
(4) holding schools, local educational agencies, and States accountable for improving the
academic achievement of all students, and identifying and turning around low-performing
schools that have failed to provide a high-quality education to their students, while
providing alternatives to students in such schools to enable the students to receive a high-
quality education;
(5) distributing and targeting resources sufficiently to make a difference to local
educational agencies and schools where needs are greatest;
(6) improving and strengthening accountability, teaching, and learning by using State
assessment systems designed to ensure that students are meeting challenging State
academic achievement and content standards and increasing achievement overall, but
especially for the disadvantaged;
(7) providing greater decision making authority and flexibility to schools and teachers in
exchange for greater responsibility for student performance;

15
(8) providing children an enriched and accelerated educational program, including the use
of school wide programs or additional services that increase the amount and quality of
instructional time;
(9) promoting school wide reform and ensuring the access of children to effective,
scientifically based instructional strategies and challenging academic content;
(10) significantly elevating the quality of instruction by providing staff in participating
schools with substantial opportunities for professional development;
(11) coordinating services under all parts of this title with each other, with other
educational services, and, to the extent feasible, with other agencies providing services to
youth, children, and families; and
(12) affording parents substantial and meaningful opportunities to participate in the
education of their children. (p. 1)
Schools with a minimum of 35% of their student population receiving free or reduced lunch can
qualify for Title I support, thus, agreeing to the aforementioned requirements (McCargar, 2003).
In an effort to document the improvement of student achievement and the effectiveness
of Title I funds, the federal government began to look closer at tests as a means to monitor
student progress. The National Assessment of Educational Progress (NAEP) began monitoring
public schools progress in the 1960s. NAEP and the Elementary and Secondary Education Act of
1965 were the first to officially use testing as a means of monitoring student progress (Moon,
2009). The idea was to continuously monitor the progress of America’s school children. It was to
provide patterns of achievement in core subjects such as math, reading, science, and writing.
NAEP is considered the nation’s report card and has monitored students in Grades 4, 8, and 12.
NAEP is the only test that one can use to compare all students based on like material, in the
United States. Federal law states NAEP is a voluntary test for all students, schools, school
districts, and states, and it requires all test takers to remain anonymous. However, federal law
requires all states that receive Title I funding to participate in the assessments for Grades 4 and 8
(Kessinger, 2011).
James Coleman’s report went a little further to assist in the understanding of poverty in
America. The 1966 report issued by James Coleman is viewed as one of the quantitative works
16
completed on social issues in the United States. Coleman used a provision in the 1964 Civil
Rights Act that called for study on equality of educational opportunity based on race, color,
religion, or national origin. Coleman documented racial composition, per-pupil expenditures, the
college degrees teachers had earned, teacher ability (as measured by performance on test), the
number of books in the school library, and family background of the students. According to
Khlenberg (2001), Coleman determined that a student’s economic standing was more detrimental
to his or her educational achievement than school funding and that peer interaction played a part
in student success.
As policymakers began looking at education as a national issue, the Department of
Education was established in 1979 and was elevated to a cabinet level in 1980. Secretary of
Education Terrell H. Bell, in 1981, created the National Commission of Excellence in Education
to study education in the United States. A Nation at Risk: The Imperative for School Reform was
released by the commission in 1983. A Nation at Risk looked at the past and provided an outline
for the future of education in the United States (Cunningham & Gressso, 1993).
A Nation at Risk (ANAR) offered America six findings: (1) the top students graduating
from high school and college were not entering into the teaching profession, (2) more time
should have been spent on teaching the content instead of method classes in the teacher
education programs, (3) salaries for teachers were too low, (4) teacher shortages of certain areas,
(5) shortages in teachers for math and science were at an alarming rate, and (6) teachers that
were being employed were not qualified to teach Math, Science, and English. The findings
issued by A Nation at Risk were followed by recommendations the commission thought would
direct American Education to be the world leader once again (Cunningham & Gressso, 1993).
17
In 1989, America 2000: An Education Strategy was devised by George. H. W. Bush and
the American Governors Association that outlined a 9-year plan to improve education in the
United States. This plan involved changes in public and private schools, as well as changes in the
home and community environment of students. The objective of Goal 2000 was to provide better
and more accountable schools, a new generation of American schools, a nation of students, and
communities where learning takes place (Cunningham & Gressso, 1993).
The Clinton administration amended America 2000 to create Goals 2000: Educate
America. Goals was an attempt to articulate a national curriculum by adopting the goals laid out
by America 2000 and adding two additional goals focused on parent participation: teacher
education and professional development. As Goals 2000 was being passed by Congress, the
Elementary and Secondary Education Act was being reauthorized as the Improving America’s
Schools Act. Improving America’s School’s Act looked to reform local and state education
agencies to meet the national goals set in place by Goals 2000 (Kessinger, 2011). Under the
Clinton plan,
Every eight year old must be able to read, every twelve year old must be able to log onto
the internet, every eighteen year old must be able to go to college, and all students must
be able to keep learning. (Cunningham & Gresso, 1993, p. 14)
This brings us to Bush’s No Child Left Behind Act.
No Child Left Behind Act
The Elementary and Secondary Education Act was reauthorized again in 2002, ushering
in the Bush Administration’s education policy which became known as No Child Left Behind
(NCLB). With the signing of NCLB, requirements for approved accountability plans must be
devised and carried out by every state, district, and school receiving federal funding. Goals and

18
strategies for all learners must be included in the plan before being submitted and approved by
the United States Department of Education. This new law reinforced the most sweeping reform
of the Elementary and Secondary Education Act (ESEA) since it was enacted in 1965
(McCargar, 2003). Accountability plans must be directly related to the performance of all
learners and must be submitted to the U.S. Department of Education in the form of an
Accountability Workbook. Also, as a result of NCLB, states were required to increase standards,
create high stakes tests for accountability, and all teachers were to be highly qualified
(Kessinger, 2011).
No Child Left Behind (NCLB) requires schools to look at individual groups of students as
well as the individual student. NCLB not only holds schools accountable for the overall school
performance but this reform requires schools to identify the performance of students based on
subgroups. It holds schools accountable for student success based on ethnicity, social economic
status, and gender.
Components of No Child Left Behind
The adoption of No Child Left Behind requires teachers to earn the status of Highly
Qualified to teach students in Grades K-12. The requirements of the Highly Qualified Teachers
component of NCLB proved to be harder than anticipated. In October 2005, as the deadline
approached for teachers to have gained the status of highly qualified, Secretary Spellings
announced a policy change that would allow states an extension to meet the highly qualified
teacher requirements. These changes wavered from the original policy designed to insure all
teachers were highly qualified to allowing each state to devise separate plans approved by the
federal government (Wong, 2008).

19
The minimum requirements to earn this status are as follows: Teachers must hold a
bachelor’s degree, obtain a teaching certificate from their state, pass one or more rigorous tests
demonstrating pedagogical competency series of state owned certification examinations, and
demonstrate mastery of their content area either by taken 24 hours of college-level coursework in
their subject area or by passing rigorous subject matter tests (NCLB, 2001).
Another component of NCLB includes provisions that provide choices to parents of
students who attend failing schools. The public school choice and supplemental services
provision of the NCLB allow schools that are classified as low performing; substantial incentives
to improve test scores. Schools that do not make Adequate Yearly Progress for 5 years stand to
lose students to schools that are on academic clear. In essence, students are allowed to transfer
out of schools labeled failing to attend an academically successfully school of their choice.
For every child that transfers the school loses funding for that child. The failing schools
also run the risk of reconstitution under a restructuring plan if they do not improve test scores
(Coulson, 1998). Ideally, the government’s goal is to improve teaching and learning and to
provide the average parent a choice and a chance to seek out and find the best educational
opportunities that the United States has to offer.
Coulson (1998) stated,
For many years, school choice was considered a theory espoused by free-market
enthusiasts and libertarians. Today, the powerful idea that all parents should have the
ability to choose their child’s school is taking hold in neighborhoods throughout the
nation. New supporters are speaking out every day, and some of the strongest voices can
be heard in minority communities. (p. 2)
Weiss (1996) provided a brief, but comprehensive overview of the many plans that fall under the
umbrella of school choice:
Choice plans include magnet schools: public schools with special emphasis and/or
facilities that draw students from across a district, such as technology school or music

20
and art schools. Choice plans include charter schools, authorized by a number of state
legislatures to be free of most local school district regulations; students apply for
admission. There are also within-district public choice schemes that allow students to
apply to any public school in the district. Some of these are “controlled” plans, in the
sense that they seek to maintain racial diversity in each school within the rubric of choice.
Other plans allow parents and students to choose public schools across district lines. A
further set of choice plans allow students to choose private schools as well as public
schools; some of these plans limit the private schools to non-sectarian schools, but some
include religious schools as well. In the most inclusive plans, ‘vouchers’ are issued to
parents to pay for the tuition at private schools (up to some dollar limit) and give them
free rein on where and how they “spend” the vouchers. (pp. vii, 50)
According to USDE (2002a), one of the most critical components of NCLB is Public
School Choice, because it allows students who are zoned for low-performing or failing schools
to transfer to a school that is not performing at such a low standard. The idea is to use school
improvement strategies along with public school choice to insure all students receive a high
quality education. NCLB believes that giving parents the information to make good decisions
affecting the education of their children will increase equality and excellence in schools.
Legal Issues
According to the United States Department of Education (2001),
A Local Education Agency (LEA) may not discriminate on the basis of race, color,
national origin, sex, disability, or age, consistent with Title VI of the Civil Rights Act of
1964, Title IX of the Education Amendments of 1972, Section 504 of the Rehabilitation
Act of 1973, Title II of the Americans Disabilities Act of 1990 (ADA), and the Age
Discrimination Act of 1975. (p. 16)
The United State Department of Education (2001) stated,
The statute requires LEAs to provide public school choice in accordance with 1116
unless such choice is “prohibited by state law.” This simply means that a state has a law
that prohibits public school choice through restrictions on public school assignments or
the transfer of students from one public school to another public school. Other laws, such
as those that mandate specific student-teacher ratios, may make providing choice options
more difficult, but do not constitute a prohibition of school choice. The Title I public
school choice program can also become a part of a State’s open enrollment programs,

21
provided that the requirements in Title I are met. This includes the priority for low-
achieving, low-income students. (p. 16)
Title I Funding
Kantor and Lowe (2006) explained that NCLB continued the trend of reducing the
poverty threshold for schools that receive Title I funds and also limiting the restrictions of what
the funds could be used for. According to Paige (2002), the federal government has spent more
than $321 billion dollars in funding to improve the education of underprivileged students. The
amount of federal support provided to schools is determined by the number of enrolled students
receiving free and reduced lunch. There is a 40% threshold that schools must meet of students
receiving free or reduced lunch in order to qualify for funding to improve teacher quality and
student achievement of low-social economic status schools. Schools with higher percentages of
disadvantaged students receive more funding (McCargar, 2003).
Currently, the federal government supports 50,000 Title I schools. Title I of the ESEA
has been a resilient program, as several Presidents have tried to change its purpose of distributing
funds for a specific reason into one that distributes funds generally. Policymakers are now trying
to change its purpose not by adding on to Title I, but instead trying to dismantle the program
(Kantor & Lowe, 2006).
Supplemental Services Funded by Title I
Since the start of Title I funding, billions of federal dollars have been granted to schools
with large enrollment numbers of high poverty students. The purpose of this funding is to
provide additional support outside of the regular curriculum to students working below grade
level in reading and math.

22
While the overall purpose of Title I funding is to provide additional funding for
supplementary support in reading and math to schools with high poverty rates, these funds may
also go toward improving achievement in other core subjects as well. Funds can also be used to
provide professional development for teachers, hiring of additional teachers, classroom aids, and
tutors. Furthermore, the flexibility of federal funding can be used for any supplementary services
tied to improving student achievement. Services including, but not limited to, enhancing parent
improvement and extended learning time for struggling students. Raising student achievement is
the ultimate goal for the additional supplementary funds (USDOE, 2002a).
Math and Reading Intervention
Title I funding was designed to support schools in core areas such as reading and math. A
review of data in 1996 showed a significant drop in mathematics scores. This brought about a
transformation in math instruction. Title I funding has always encouraged the use of reading
specialists. In an effort to increase student mastery in math, Title I schools were encouraged to
employee math specialists (Ysseldyke, Betts, Thill, & Hannigan, 2004). In the past, math and
reading specialists worked with small groups of students struggling in the areas of math and
reading. This pull-out program allowed students to be removed from the classroom setting to
receive additional support for reading and math instruction. These specialists are now required to
support teachers in planning instruction, modeling/demonstrating lessons, team-teaching/side-by-
side instruction, and providing feedback on lessons taught by the regular classroom teacher
(Dole, 2004).
Using Title I funding, many states such as Massachusetts opt to expand the school day.
Massachusetts established the Expanded Learning Time (ELT) Initiative to help high-poverty

23
students be more successful in schools. ELT looks to add an additional 300 hours to the school
calendar. The effort is to target students in high-poverty areas that need additional academic help
(Reis, 2013). Other supplementary services funded by No Child Left Behind include summer
school, before and after school tutoring programs, the hiring of reading and math
interventionists, and the purchase of research-based programs that support the curriculum.
Supplemental Services Provider
According to the California School Boards Association (2004), in order to be eligible to be a
supplemental service provider under NCLB, the district must provide the following:
1. Have a record of effectiveness in enhancing student academic achievement
2. Use instructional strategies that are high quality, based upon research, and designed to
increase student academic achievement
3. Ensure that instruction and content provided are aligned with the State adopted
curriculum content standards and instructional materials
4. The supplemental services must also be aligned with local and state assessments
5. Be financially sound
6. Meet all applicable federal, state, and local health, safety, and civil rights laws
7. Ensure that supplemental educational services are coordinated with the student’s
school program;
8. Be capable of providing supplemental educational services to eligible students based
on individual needs consistent with the instructional program of the local educational
agency and the State academic standards, frameworks and instructional materials;
9. Provide evidence of recent successful experience in improving student achievement
(If the student population being served by the provider is composed in large part of
English learners, the provider must demonstrate experience in improving the student
achievement of English learners)
11. Ensure that all instruction and content under this subsection are secular, neutral, and
non-ideological.
12. Guarantee that the staff working with students and their parents have undergone
background checks; and abide by the conditions of the contract with the district. (p. 3)
Schools failing to meet AYP may provide supplemental services using corrective actions
plans. However, the faculty and staff or anyone employed by the school itself cannot be the

24
supplemental service providers, but the school district can opt to provide services at the schools
site. Nevertheless, parents still have the right to choose a provider other than the district.
Students’ Grade and Sex
According to Bielick and Chapman (2003),
In 1993, there were few differences in enrollment in types of schools among grade
groups. However, by 1996 and 1999 there were differences in enrollment. In 1996 and
1999, a higher percentage of students in Grades 6 to 8 attended public, assigned schools
than did students in Grades 1 to 5, while a higher percentage of students in Grades 1 to 5
and Grades 9 to 12 attended public, chosen schools than did students in Grades sixth to
eighth. In the private school types, in all survey years, students in Grades 1 to5 were
more likely to attend private, church-related schools than were students in upper Grades,
9-12. There were no differences detected among grade groups and years for students in
private, not church-related schools. (p. 13)
Bielick and Chapman concluded,
Overall, girls and boys followed the same patterns of enrollment in school types as the
overall population with a decrease in public chosen school enrollment. Slightly more girls
attended private, church related schools in 1993 (8 percent vs. 7 percent) and slightly
more boys attended private, not church related schools in 1996 (3 percent vs. 2 percent).
(p. 13)
Race and Ethnicity
Every year, a smaller percentage of Black students than White students attend public,
assigned schools. In 1999, the rate of assigned school enrollment for Black students was 6% less
than the rate of enrollment for White or Hispanic students. In each year, Black students had a
higher rate of enrollment in public, chosen schools than did Hispanic students, and Black and
Hispanic students had higher enrollment rates in public, chosen schools than White students. In
1993, 19% of Black students were enrolled in public, chosen schools and 23% in 1999. Hispanic
students were enrolled at a rate of 14% in 1993 and 18% in 1999. Findings revealed a significant

25
difference with 9% of White students enrolled in 1993 and 11% enrolled in public, chosen
schools in 1999. However, the percentages of White students enrolled in each type of private
school were much larger than that of Black or Hispanic students in all 3 years (Bielick &
Chapman, 2003).
Segregation and Racial Issues in Our Schools
During the Civil Rights era of the 1950s through the 1970s, the plight of equal
opportunity in education was fought in many different arenas. With the landmark Brown v.
Board of Education decision of 1954, education for minorities was trying to give African
American students the same resources as their White counterparts by segregating schools
(Kantor & Lowe, 2006). The passage of NCLB shifted focus from desegregating schools that
sought to level the playing field for African Americans through integration to focusing more on
providing support for low income students. (Kantor & Lowe, 2006).
The National Working Commission (2003) questioned rather school choice in its efforts
to decrease segregation actually increased segregation. The results from existing choice
programs are mixed and confusing. Data involving school choice level is vague. Voucher
programs specifically targeted to low-income families have the potential to improve integration,
but the extent to which this potential is realized in existing programs is unknown. Findings prove
that almost all schools are segregated in most big cities, so choice is unlikely to make it worse.
Even in public schools with mixed student bodies, students often segregate themselves socially.
Moreover, findings report that levels of integration, both between and within schools, are
difficult to measure and scarcely ideal. There is some evidence that positive choice affects
private schools actively recruiting low-income and minority children, and greater contact

26
between White and minority students in private schools. Some private schools appeal to people
of many races, all of whom are attracted to school climate and instructional methods. However, it
is not known whether these private schools phenomena can be reproduced in publicly supported
schools of choice.
Some studies have shown that the single most inconspicuous theme that factors into the
causes for the achievement gap is racism. Racism is at the center of the poverty issue, ability
grouping in schools, stereotyping, cultural differences, teacher expectations and perceptions, and
test bias (William, 2003).
According to Darling-Hammond (1998), the four factors that influence educational
achievement the most are small class size, high quality teachers, smaller school size, and a
challenging curriculum, factors which minority students are far less likely to have at their school.
Darling-Hammond went on to determine whether the prediction stated publically by Dr. W.E. B.
Dubois implying that the color line would serve as the biggest problem of the 20th century would
also hold true as the biggest problem faced in the 21st century?
Williams (2003) alluded to a Gallup poll that was given in 1978 and again in 2001 asking
the question, “Do Black children and other non-Asian minorities have the same educational
opportunities as White children?”
While many may argue the impossibility of all students working on or above grade level,
eliminating No Child Left Behind and accountability would exemplify the belief of failure. The
implementation of No Child Left Behind and the strategic review of the disparities between the
different ethnic groups and low social economic status students have forced American schools to
confront an issue that has long been ignored throughout much of American history. While critics
of NCLB may consider it a failure due to teaching to the test or teaching skills rather than

27
actually learning, they must also admit the mere fact of acknowledging the achievement gap
between the subgroups and holding schools/districts accountable for closing these gaps is a step
in the right direction.
Technology Equality among Schools
According to Yau (1999), no shortage of technology resources is apparent at the
aggregate level, but the distribution of these resources across different populations is a cause for
concern. A report by the Educational Testing Service concluded that Title I funds had been
effective in keeping the poorest schools on par with other schools technologically at some earlier
stage of the technology “boom,” but that they were no longer sufficient as of 1997 (Coley et al.,
1997). Furthermore, data compiled by NCES in 1997 indicated that the level of Internet access is
significantly lower for the poorest schools in comparison with other schools. Specifically, among
public schools with 71% or more of its students eligible for the federal lunch program, only 63%
had access to the Internet C in contrast to the aggregate figure of 78% for all schools across the
United States. The inequalities in technology funding between the poorest schools and other
schools most probably indicate unequal computers-per-student ratios between schools with
predominantly White populations and schools with predominantly Black and/or Latino
populations because significantly higher percentages of Black families and Latino families live at
or below the poverty level as compared with White families.
Yau (1999) also stated that the above statistics are based on a notion of “access” defined
by a ratio of the number of students to the number of computers. Where “technology access” is
defined by frequency of use of a school computer, some data show that traditionally
disadvantaged groups such as Blacks and Latinos are not lagging behind the “mainstream”

28
population. For instance, among fourth graders who took the 1996 National Assessment of
Educational Progress (NAEP) in Mathematics, 41.9% of Black students reported using school
computers at least once a week to learn math, as compared with 33% of Asian students, 32.3% of
Latino students, and 31.7% of White students. Thus, signifying that students of color actually
spend more time working with school computers than White students who are part of the cultural
mainstream (Wenglinsky, 1998). Among eighth graders who took the 1996 NAEP, 33% of Black
students, 30% of Asian students, 28% of White students, and 26% of Latino students reported
using school computers at least once a week to learn math (Wenglinsky, 1998). In this case,
Latino students were at the bottom of the distribution curve, but, as the numbers show, the
differences between groups are relatively small. However, where “access” is defined according
to the types of computer-learning tasks assigned, Black students and Latino students lag
significantly behind in access to tasks involving “simulations and applications”--which exercise
higher-order thinking skills and correlate with higher achievement--as opposed to “drill and
practice” tasks, which do not correlate with higher achievement. Thus, as explained by one
researcher, “[d]isadvantaged groups seem to lag behind in access to those aspects of technology
that do affect educational outcomes, but not in access to those aspects of technology that do not
affect educational outcomes (p. 3).
Teaching Techniques
How students are taught can also affect achievement gains among students. Teaching
techniques used to teach students in a gifted program and not used in classrooms or schools with
high levels of poverty have been found to work just as well with students of low socioeconomic
status as it does with students in gifted programs (Battsitich, & Ham, 1996).

29
A common factor found in high poverty schools was the amount of student interaction
and self-direction. High poverty school teachers tend to have tighter control over student
interactions than their counterparts in low poverty schools (Solomon et al., 1996).
Access to educational resources has been a problem in the United States for some time.
High-poverty and disadvantaged Americans have lacked in resources for many years. African
Americans in the North and South; Latinos in California, Texas, and New York; and poor Whites
in Appalachia have poorly funded schools and little accountability (Carnoy, 2001).
Poverty and Education
Murphy (1971) explained that Title I did not come from a demand by the underprivileged
citizens of America, but it came from reformers in the executive branch of government. School
officials did not believe funds should be allocated based solely on poverty; however, Arvin
(2009) stated that teachers believe in order to meet all children’s needs there must be total equity
and fairness in education. Teachers in high-poverty schools also believe the students attending
these schools have the ability to be as successful as students attending non-poverty schools.
Although their focus is on AYP and grade-level standards, teachers in high-poverty schools
strive to try and reach their students’ individual needs (Arvin, 2009).
According to Bennett (2008), poverty in America is growing due to the decline of wages.
He goes on to explain that while extreme poverty is increasing in children of single-parent homes
some blame can be placed on the changes in the welfare system. Black and Hispanic children
make up a large number of American children in poverty and combined, their population is the
majority of children living in poverty in America, while White children make up the majority of
a singular racial group living in poverty (Bennett, 2008).

30
There are a disproportionate number of minority students referred to special education
programs due to their low socioeconomic status or their poverty status (Skiba, Poloni-Staudinger,
Simmons, Feggins-Azziz, & Chung, 2005). According to Murphy (1971), the purpose of the
Elementary and Secondary Education Act was to promote improvement in education and make
the underprivileged students of America’s schools the top priority. Title I of the ESEA focused
on underprivileged youth with the notion that given the chance to be successful in school these
same students would be productive adults (Murphy, 1971).
There are many factors associated with poverty and achievement in schools. These
factors, such as access to physical and mental health services, healthy food, access to early child
care, how well parents read, and the parents’ educational attainment, play a vital role in a
student’s education outlook. This disadvantage for poverty students makes closing the
achievement gap difficult and leads us to focus on the opportunity gap (Kaufmann & Weiss,
2013).
Kaufmann and Weiss (2013) argued that the second finding of the Coleman report is
reaching an all-time high level. The second finding was that of concentrated school poverty.
Concentrated poverty is when individuals or families that are living at or below the poverty line
are living in the same areas in neighborhoods or regions of the country. As a result of
concentrated poverty, these areas see an increase in crime rates, poor housing, subpar health
conditions, very limited access to job opportunities, and underperforming public schools
(Keneebone & Berube, 2011).
Studies such as the Coleman Report, provide documentation of the effects poverty has on
academic achievement. According to Saporito and Sohoni (2007), poverty has a direct
correlation to a student’s academic performance in school. They go on to state that there are high

31
concentrations of poverty across neighborhoods identifying this as segregated concentrated
poverty. Black students are more likely to attend a school in which most students live below the
poverty line, while White students usually attend school with students who live above the
poverty line (Saporito & Sohoni, 2007).
Policymakers have ignored the staggering research on concentrated poverty and how it
has affected the achievement of thousands of students across America. Over the last several
decades, income for the middle and bottom classes of American society has decreased and the
top 1% of Americans have experienced an enormous growth (Kaufmann & Weiss, 2013).
The American Recovery and Reinvestment Act of 2009
In 2009 the federal government, under Title I Part A of the American Recovery and
Reinvestment Act, made available an additional $10 billion in funds for school districts with
high concentrations of students living in poverty. These funds were to be used for teaching and
learning for students most at risk to fail the state standards and to help decrease the achievement
gap. The federal government added four principles that were to be used to guide the distribution
and use of the ARRA funds. Spending of funds quickly to save and create jobs, use reform and
school improvement to improve student achievement, ensure transparency, reporting and
accountability and use funds on a one time bases to shore up budgets. The funds distributed
under ARRA should be used for short-term goals, because the level of funding decreases in the
coming years (USDOE, 2009).

32
Background of Head Start
Head Start began as a means of leveling the playing field or to condense the achievement
gap of students living in poverty and those living in economically stable homes. In January of
1965 committees assembled by President Johnson, with assistance from Sargent Shriver, met to
devise a plan of action to help children overcome setbacks or obstacles caused by poverty.
Members of this committee included Dr. Robert Cooke, a pediatrician at John Hopkins
University and other specialists in various fields involving children. Project Head Start was
started using funds from the Office of Economic Opportunity. Serving over 560,000 American
students, Project Head Start provided 8 weeks of instruction to upcoming kindergarten students
living in low income communities. Project Head Start continued under President Richard
Nixon’s administration (http://sitemaker.umich.edu/365.bell/background_history).
Head Start later grew into a half-day program available during the school year, and it now
serves more than 900,000 children including over 800,000 between 3 and 5 years of age. The
goal of Head Start, the federal government’s only pre-K program, is to serve children in families
of poverty. Holt (2012) goes on to cite the 2011 report from Head Start and Child Experiences
Survey as it reported the median income of Head Start families to be around $22,000 a year.
Moreover, to qualify for enrollment of their children in Head Start, families must have an income
that places them at or below 100% of the federal poverty level or meet other criteria. For
example, foster parents and families that include children with special needs are provided these
services. Additional funds offered under the American Recovery and Reinvestment Act of 2009
has allowed the government to provide Head Start opportunities to more students. In 2002, the
government spent over $2 billion dollars to fund Head Start. This increased tremendously in
2009 with the government providing over $7 billion dollars to fund Head Start. While funding

33
for Head Start is still significantly more than the amount provided in 2002, it has decreased since
2009. In 2012, the federal government spent over $6 billion on Head Start.
In 1995, Congress approved an extension of Head Start known as Early Head Start. Like
Project Head Start, the purpose of Early Head Start is to serve impoverished children. The
difference is Early Head Start also provides support to mothers and children from birth to age 3.
In 2011, Early Head Start provided support to 114,469 children. In 2012, the program received
$1.28 billion in federal funds (Holt, 2012).
According to Currie and Thomas (1998), Whites and Hispanics performed better on tests
and in school when they attended a Head Start program, while Blacks that attended Head Start
programs did not perform better on tests or in school. White and Black students who attend a
school with a Head Start program seem to leave the program headed in different directions. The
majority of White students leave the Head Start school and go on to schools that are of equal or
better quality than the one attended with the Head Start program; however, Black students tend
to move on to schools of lesser quality than the schools attended under the Head Start program.
This trend leads to the fading out of the progress made by Black students that attended Head
Start programs (Currie & Thomas, 1998).
According to Garces, Thomas, and Currie (2000), students who attended a head start
program were more likely to attend college. However, White participants in Head Start programs
made up the bulk of this finding. African Americans were more likely to graduate high school,
and less likely to commit a violent crime.

34
Special Education
In 1975 the US Congress passed the Education of All Handicapped Children Act which
was later renamed the Individuals with Disability Act (IDEA). This Act was passed to ensure all
handicapped students receive a free and appropriate education. Under the reauthorized of IDEA
in 2004, schools were required to implement policies to protect against the over identification of
minority students for special education services (Russo, Osborne, & Borreca, 2005). Under
IDEA states can receive federal funds to help educate students with disabilities if states comply
with IDEA regulations. (Krahmal, Zirkel, & Kirk, 2004).
According to Zirkel (2009), students with disabilities are protected by the Individuals
with Disability Act, which is legislation that provides funding if certain regulations are followed.
Under the reauthorized IDEA of 2004, schools were required to implement policies to protect
against the over-identification of minority students for special education services (Russo et al.,
2005).
No Child Left Behind requires schools to test at least 95% of its student body including
those who qualify for an Individualized Education Plan (IEP) and/or a 504 plan. In an effort to
close the achievement gap, No Child Left Behind increases the accountability for schools/school
districts of at-risk groups of students.
According to Lefave (2010), NCLB has benefited and hindered special education
students since its inception. The federal government placed more school accountability on
students with disabilities. This was unprecedented, but it also had a negative effect as school
funds are now tied to the achievement of special education students.

35
Accountability in Alabama
According to the Alabama Interpretive Guide 2010, a state law was passed in 1995 that
made it mandatory for all Alabama students in Grades 3-11 to take a nationally normed
achievement test for accountability. The Stanford Achievement Test was the high stakes test
used to determine if a school would be labeled as Alert, Caution, or Clear status.
The passage of The No Child Left Behind Act gave clear instructions for states to use in
assessing school accountability. NCLB required the use of criterion-referenced tests and they
were to be administered in Grades 3-8. The Alabama High School Graduation Examination was
given in high schools. Schools were now being judged based on their adequate yearly progress
(AYP).
Beginning in the 2009-2010, the State of Alabama used several assessments to determine
AYP. Those assessments were as follows: Alabama Reading and Math Test (ARMT), Alabama
High School Graduation Exam (AHSGE--reading, mathematics, science, and social studies
subject areas), Alabama Alternate Assessment (AAA), and ACCESS. The ARMT was given to
students in Grades 3-8, the AHSGE was taken by students in Grade 11, AAA was designed for
special education students whose IEP determined they could not participate in the state
assessments with or without accommodations, and ACCESS was given to students with limited-
English proficiency. Students graded on the assessments were given one of four levels: Level I
means students did not meet academic content standards, Level II means a student partially
meets standards, Level III students were considered proficient, and Level IV students exceeded
academic content standards.

36
Alabama Reading and Math Test (ARMT)
The ARMT, a criterion-referenced test (CRT), was first administered to students in
grades 3-6 in 2004. Its primary purpose is to provide data pertaining to the strengths and
weaknesses of individual student’s performance on grade level content standards over time. Each
year schools are provided with individual student reports that consist of scores that include the
possible points earned (how many possible points for content standard and how many points
possible by question/item type) , the total points earned (total points earned by the student for
each question/item type), the percent correct (percent of total points correct per content
standard), a scaled score (number indicating where the student falls on the scale) and
achievement levels (Four levels that explain if the student does not meet, partially meets, meets,
or exceeds understanding of content standards tested) (ALDOE, 2010).
The ARMT assessment plays a big part in determining the success of a school. Schools
were required to have a certain percent of its students scoring proficient, a level 3 (on grade
level) or a level 4 (exceeding grade level) each year. The use of the ARMT to determine the
status of schools is a form of high stakes testing.
High Stakes Testing
The reauthorization of the Elementary and Secondary School Act of 2001, which became
known as The No Child Left Behind Act by President George W. Bush, established high-stakes
tests as the measurement for school improvement (Baker & Johnston, 2010).
Polnick and Reed (2006) defined high-stakes testing as tests used in academic settings to
determine the health of a school or its students.

37
According to Noguera (2009), high stakes testing has forced schools to focus more on
teaching basic skills that can be evaluated via standardized tests, and students’ performance on
these tests has served as the basis for how schools are judged. Teaching to the test has become a
tireless and harmful phenomenon. Noguera goes on to express the importance of finding a way to
reestablish the proper balance between assessment and instruction and the significance of
developing higher order thinking skills.
Recent changes to No Child Left Behind allow school districts to focus on more college
and career ready standards. Schools are required to be more data driven. Low performing schools
are provided more funds that permit district leaders to provide more support for faculty and staff
including turnaround intervention programs. Schools receiving Title I funding are offered
additional funding to assist in closing the achievement gap.
Donlevy (2003) explained that using high stakes testing in education today has its place
to determine accountability, but testing does more harm than good on students from low
socioeconomic backgrounds.
Achievement Gap
The racial gap among American students is one of the most pressing concerns for
stakeholders today (Bali & Alvarez, 2004). There must be a statically significant difference in
scores between two groups of students for there to be considered an achievement gap if the
difference means larger than the margin of error (NAEP, 2007). According to Bali and Alvarez
(2004), racial gaps among Hispanics and Blacks develop and widen at different rates in the early
grades. Black students are affected more by their family situations than their Hispanic and White

38
counterparts, while Hispanic and White students are affected more by their neighborhood
conditions than Black students (Bali & Alvarez, 2004).
Bali and Alverez (2004) explained the significance of school factors as students move
through school. Their research showed that Black students benefit from having more minority
teachers and Hispanic students benefit from having smaller class sizes.
As policymakers attempt to use policy changes to decrease the achievement gap, it must
be noted that one policy change may have an effect on one group but may not affect another. The
hope for a successful policy may have to address the differences in each racial group (Bali &
Alvarez, 2004). The National Center for Education Statistics in 2007 reported that while
mathematics assessment results for Black and White students in fourth and eighth grades
attending public schools were significantly higher than previous scores since 1990, the results of
White students were much higher than those of Black students. These results were also found to
be true in Reading for fourth grade students on the NAEP assessment in 2007. In fact, test results
in 2005 showed a significant difference in the results of Black and White students to document a
significant achievement gap in both reading and math between Blacks and Whites in the United
States.
State Black-White Achievement Gaps in Mathematics
1. At the state level, gaps in Grade 4 mathematics existed in 2007 in the 46 states for
which results were available.
2. At Grade 8, mathematics gaps existed in 2007 in the 41 states for which results were
available. The gaps were narrower in 2007 than in 1990 in four states: Arkansas,
Colorado, Oklahoma, and Texas. In all four, scores for both Black and White students
increased, but scores for Black student increased more.
3. At Grade 4, five states had mathematics gaps in 2007 that were larger than the
national gap of 26 points, while 10 states had gaps that were smaller.
4. At Grade 8, seven states had mathematics gaps in 2007 that were larger than the
national gap of 3 points, while 12 had gaps that were smaller.
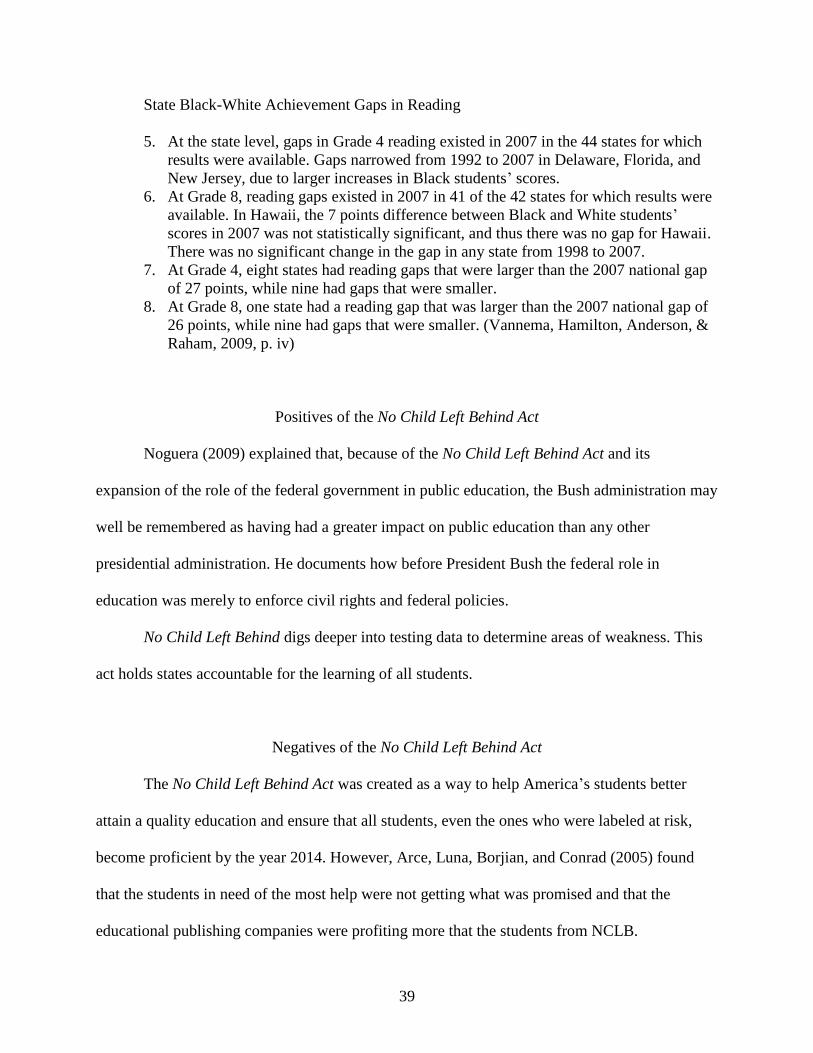
39
State Black-White Achievement Gaps in Reading
5. At the state level, gaps in Grade 4 reading existed in 2007 in the 44 states for which
results were available. Gaps narrowed from 1992 to 2007 in Delaware, Florida, and
New Jersey, due to larger increases in Black students’ scores.
6. At Grade 8, reading gaps existed in 2007 in 41 of the 42 states for which results were
available. In Hawaii, the 7 points difference between Black and White students’
scores in 2007 was not statistically significant, and thus there was no gap for Hawaii.
There was no significant change in the gap in any state from 1998 to 2007.
7. At Grade 4, eight states had reading gaps that were larger than the 2007 national gap
of 27 points, while nine had gaps that were smaller.
8. At Grade 8, one state had a reading gap that was larger than the 2007 national gap of
26 points, while nine had gaps that were smaller. (Vannema, Hamilton, Anderson, &
Raham, 2009, p. iv)
Positives of the No Child Left Behind Act
Noguera (2009) explained that, because of the No Child Left Behind Act and its
expansion of the role of the federal government in public education, the Bush administration may
well be remembered as having had a greater impact on public education than any other
presidential administration. He documents how before President Bush the federal role in
education was merely to enforce civil rights and federal policies.
No Child Left Behind digs deeper into testing data to determine areas of weakness. This
act holds states accountable for the learning of all students.
Negatives of the No Child Left Behind Act
The No Child Left Behind Act was created as a way to help America’s students better
attain a quality education and ensure that all students, even the ones who were labeled at risk,
become proficient by the year 2014. However, Arce, Luna, Borjian, and Conrad (2005) found
that the students in need of the most help were not getting what was promised and that the
educational publishing companies were profiting more that the students from NCLB.
40
According to Noguera (2009), while No Child Left Behind identified the gap in
achievement as a problem it has done little to close this gap. In fact, Noguera stated that it has
taken schools backwards because it provides a misleading definition of achievement and did
nothing to address the problem it identified. Critics question the fact that students classified as
English learners are at a disadvantage under NCLB; they enter a school with limited English, but
are required to take and pass the same high-stakes test as the general student population (Arce et
al., 2005).
According to Hill and Barth (2004), the framers of NCLB failed to see the impact the Act
would have on teachers as they looked to close the achievement gap among minorities, students
with disabilities, and students of low socioeconomic status. The retooled requirement of what
qualifies a teacher to be highly qualified drove many veteran teachers to retirement.
The No Child Left Behind Act requires cohorts of students to meet a set percentage score
to be labeled as proficient of meeting annual yearly progress. However, the core does not
accurately identify some schools (Heck, 2006). According to Heck (2006), it is impractical to
believe that schools can eliminate the disparity among minority students and the achievement
gap. Because the No Child Left Behind Act relies on mean proficiency scores and requires all
subgroups to meet the same goals for accountability, it places high-poverty schools and racially
diverse schools at a disadvantage (Kim & Sunderman, 2005).
Arce et al. (2005) argued that President Bush’s family and friends profited from NCLB,
as companies with direct ties to the Bush family were selling software to improve test scores for
students who were required to take high-stakes tests under NCLB. Most of the software was
being sold to low-income school districts and schools.

41
Recent Studies on Title I/Non-Title I Schools
A recent study conducted by Scott (2005), titled A Quantitative Examination of Title I
and Non-Title I Elementary Schools in East Tennessee Using Fourth-Grade Math and Reading
Standardized Test Scores, focused on determining the difference in standardized test scores in
reading and math between fourth-grade students in Title I schools and those in Non-Title I
schools.
Scott’s (2005) study used gender, economically disadvantaged, and students with
disabilities as variables. Scott analyzed the data of fourth grade students in 172 elementary
schools located in 21 East Tennessee school systems. The Terra Nova Test (a component of the
Tennessee Comprehensive Assessment Program) completed by all students in Grades 1 through
8 served as the instrument for this study. A one-way ANOVA, Tukey post-hoc test, Tamhane’s
T2, and t tests were used to analyze the data. The findings from Scott’s study revealed the
following:
The Tamhanes’s T2 post hoc test was used to test for pair-wise differences. A summary
of these findings indicated that Title I females scored higher than Title I males. This was the only
pair of comparisons that indicated a Title I school out-performed a Non-Title I school in reading.
Non-Title I females out-performed both Title I females and Title I males. Non-Title I males out-
performed both Title I females and Title I males. In comparison of these pairs of gender groups,
Non-Title I students always performed higher than Title I students.
The Tukey HSD post-hoc test was used to further test for significant differences. In the
content area of math, it appeared that Non-Title I students consistently performed better than
Title I students. Female Non-Title I students scored higher than both female and male Title I

42
students. Male Non-Title I students also scored higher than both female and male Title I
students.
The t test for reading showed there was no significant difference between economically
disadvantaged students in Title I schools and economically disadvantaged students in Non-Title I
schools. Some of the research suggested that economically disadvantaged students attending
Non-Title I schools performed higher than did economically disadvantaged students who
attended a Title I school. It appears, based on this study, that there is no relationship between the
Title I status of the school and the reading scores of fourth grade students who are economically
disadvantaged.
The t test for math showed there was no significant difference between economically
disadvantaged students in Title I schools and economically disadvantaged students in Non-Title I
schools. This result indicates that Title I status of the school does not affect the math scores of
fourth-grade students who are economically disadvantaged. It appears that the mastery of math
skills is similar between Title I and Non-Title I schools in the state of Tennessee for students
who are economically disadvantaged. Based on the results of this study, there is not a gap
between Title I schools and Non-Title I schools in the subcategory of economically
disadvantaged students in the content areas of reading or math. Although this outcome is
surprising, it helps validate the efforts made by Title I schools in East Tennessee.
The t test showed there was a significant difference between the reading scores of
students with disabilities in Title I schools and students with disabilities in Non-Title I schools.
Students with disabilities who attended Title I schools had a lower mean in reading than students
with disabilities who attended Non-Title I schools. It appears that fourth-grade students with

43
disabilities who attend Non-Title I schools are performing higher in reading than those students
with disabilities who attend Title I schools.
The t test showed there was no significant difference in the math scores of students with
disabilities who attended Title I schools and Non-Title I schools. It appears, based on this study,
that Title I status of the school does not affect the math scores of fourth grade students with
disabilities. Based on the evaluation of this subcategory, the mastery level of math skills appears
similar in Title I and Non-Title I schools for students with disabilities.
In 2009, Bland-Washington replicated the quantitative study conducted by Amy Scott in
2005. Bland-Washington’s study was titled, Are Title I Schools Helping Students Make the
Grade? A Comparison of Grade 4 Standardized Test Scores in Title I and Non-Title I Schools in
West Georgia. Much like Scott, Bland-Washington completed a quantitative and ex post facto
study that focused on gaining a clearer understanding of the differences between the reading and
math test scores of students attending Title I and Non-Title I schools in Grade 4. While the
population of Bland-Washington’s study consisted of 19 elementary schools that housed
approximately 11,019 students located in a West Georgia school district, the emphasis was
merely on the 1,892 fourth grade students. Bland-Washington used a two-factor analysis of
variance (ANOVA) to analyze the findings of her study. Her subgroups were gender, disability,
and economically disadvantaged.
She reported that her descriptive findings were statistically significant with differences in
all areas. Bland-Washington asserted the gains on the Georgia’ Criterion-Referenced
Competency Tests (CRCT) were expected considering the amount of extra supportive services
provided to Title I schools. The study used passing rates for reading and math on the CRCT to

44
compare five West Georgia Elementary Schools to other elementary schools throughout the
county.
The study showed that the Non-Title I males outperformed the Title I males. The analysis
indicated that the Non-Title I females outperformed Title I females. When comparing the overall
Title I female performance to the Non-Title I schools in the county, the analysis further indicated
that females for the overall school district significantly outperformed females from Title I
schools (z = -3.40, p < .01) with regard to CRCT reading.
The results indicated that the percentage of male students who passed the mathematics
portion of the CRCT was higher for the county than for the Title I schools in most cases. The
county had a higher percentage of males who passed the mathematics portion of the CRCT.
As with the reading results, the percentage of female students who passed the
mathematics portion of the CRCT was higher for the county than for the Title I schools. The
results indicated that when comparing Title I females to the females in the overall county, the
county females had a higher passing rate on the mathematics portion of the CRCT.
The research compared students from five county schools to students in Title I schools,
regardless of gender or disability status. The descriptive statistics indicated that the county
students had a higher passing rate than did the Title I students.
The descriptive statistics indicated that students with disabilities at the county level had a
higher passing rate than did students with disabilities from Title I schools.
Summary
Chapter 2 highlights and outlines the educational accountability movement in the United
States. The No Child Left Behind Act, a reauthorization of the 1960s Elementary and Secondary
45
Act, is reviewed to determine if indeed it is achieving the goal of decreasing the achievement gap
between Title I and Non-Title I schools.
Accountability in the United States came to the forefront with the launching of Sputnik
by the Union of the Soviet Socialist Republic (USSR) over 60 years ago. The U.S. Congress
passed the NDEA to try and combat the perceived lack of educational progress in America at that
time. However, one of the most sweeping legislations by Congress that deals with education
came under Lyndon B. Johnson’s War on Poverty. Coming out of the War on Poverty was the
passage of the Elementary and Secondary Education Act (ESEA). When passed, the ESEA
focused on providing all children, especially those of poverty, an equal opportunity. One of the
most defining Titles of ESEA was its first title. The goal of Title I was to allot money to states
and school districts which would, in essence, improve the academic achievement of
underprivileged students.
During the 1980s, the Department of Education produced a report on America’s schools
called A Nation At Risk (ANAR). ANAR findings were that American schools were mediocre
and in need of improvement. A call for education reform rang out throughout America.
Following ANAR the subsequent presidential administrations produced their ideas of reforming
education in America. George H.W. Bush gave us America 2000; Bill Clinton outlined his
reform strategy in Goals 2000: Educate America; and George W. Bush pushed through the
reauthorization of ESEA and it became known as the No Child Left Behind Act (NCLB). NCLB
used several components to determine how students were being educated and how to keep track
of schools’ performance.
Chapter 2 also gives a cursory look at Title I funding and its use in improving academic
achievement in America. The interventions that attributed to Title I funds, such as those for

46
Reading and Math, were reviewed. Factors that may influence student achievement, for example
type of school attended, gender, and ethnicity, were also examined to show the impact. These are
all causal assumptions to address or explain the achievement gap.
Another factor in achievement discrepancies is poverty. The Coleman Report explained
the connections between poverty and, in particular, concentrated poverty and educational
achievement. The American Recovery and Reinvestment Act of 2009 added $10 billion to help
improve achievement in districts with high concentrations of poverty.
Several programs have been put in place to help students from low socioeconomic
households close the achievement gap. One of the signature programs is Head Start. The purpose
of Head Start is to provide students coming to public schools academically behind an avenue to
catch up with their peers.
Finally, Chapter 2 examines past studies that focused on fourth grade students in both
Title I and Non-Title I schools and their achievement. One study was conducted in Tennessee
and the other in Georgia, each reaching similar results.

47
CHAPTER 3
METHODOLOGY
Introduction
Chapter 3 describes the research design, population, and sample selection procedures.
The instrumentation, data collection planning, and data analysis planning are also explained.
The best method to analyze the numerical data of this study was the quantitative method.
The study analyzed fourth grade aggregated longitudinal ARMT data from information provided
by the Alabama State Department of Education, which are published online for public
availability. Unlike the studies conducted by Scott and Bland-Washington, this study included
aggregated Reading and Math longitudinal test data from 2004, 2008, and 2012 instead of
analyzing disaggregated Reading and Math test data for 1 year. This study was limited to fourth
grade students in the three Madison County Schools Systems of North Alabama’s District 8. The
school systems selected consists of 98 elementary schools, 8 middle schools, and 6 high schools.
However, there was a total of 50 elementary schools in the three selected North Alabama school
districts. There were no foreseeable risks or identifiers in this study. The three school systems
selected from District 8 of North Alabama involved a mixture of urban, suburban, and rural
elementary schools.
The purpose of this study was to determine if there is a difference in the standardized test
scores of reading and math between fourth grade students attending Title I and Non-Title I
schools in three select North Alabama schools within District 8. The researcher gathered ARMT
data dealing with subgroups (gender and race). The data collected showed scores of students

48
meeting, exceeding, and not meeting standards in reading and math. Each research question was
examined and a variety of charts and tables were used to display the results of the data. Ethical
matters were considered. However, as in previous studies, no ethical matters were anticipated
that affected the outcome of this study.
Statement of the Problem
In an effort to level the playing field for all students, despite economic status, Title I
funding is provided to schools with high poverty enrollment. Although these additional funds are
provided, schools receiving Title I funds are struggling to decrease the achievement gap. While
the achievement gap has decreased over time, the gap is still evident.
Research Questions
1. What is the difference in the academic achievement in Math and Reading between
Title 1 and Non-Title 1 schools in 2004, 2008, and 2012 academic years?
2. Are there differences in the academic achievement based on ethnicity between Title 1
and Non-Title 1 schools in the 2004, 2008, and 2012 academic years?
3. Are there differences in academic performance based on gender between Title 1 and
Non-Title 1 Schools in the 2004, 2008, and 2012 academic years?
4. Have the differences in academic achievement between Title 1 and Non-Title 1 schools
in academic achievement significantly decreased between 2004, 2008, and 2012?

49
Research Methodology
The results of the ARMT were interpreted based on numerical scores. The design method
used a quantitative and descriptive ex post facto design. Numerical values gave concrete data on
students, schools, and school districts. Results were available to the United States Board of
Education. The research design retrospectively examined the data on standardized tests.
Research Design
This research was a quantitative study in which the investigator surveyed standardized
data in an ex post facto manner. An ex post facto comparative design was used to gather,
analyze, and interpret existing school data. The data were gathered in this order: school system,
school grade level, subject, and the two focus subcategories of gender and race of economically
disadvantaged versus non-economically disadvantaged schools. Each school was categorized as
Title I or Non-Title I. This study, like that of Bland-Washington, used the two-factor ANOVA
design to analyze data. The analysis of the data allowed the researcher to deduce whether a
difference in academic achievement could be identified between Title I and Non-Title I schools
and each of the subcategories (gender and race). While this study has much in common with both
the studies conducted by Scott and Bland-Washington, the researcher feels the two-way ANOVA
design used by Bland-Washington best analyzed the data collected.
Population and Sample
The population used in this study consisted of 50 elementary schools in three select
school systems of North Alabama’s District 8. This study focused on school aggregate data for
fourth grade students and their performance on the Alabama Reading and Math Test (ARMT) in

50
the content areas of reading and math. The data reflect the past 3 years of academic performance
(2004, 2008, and 2012).
The study focused on three main subgroups: students in Title I schools and students in
Non-Title I schools, race, and gender. Teachers have received training on how to give the
Alabama Reading and Math Test (ARMT) as well as training dealing with various curriculum
programs necessary to ensure student understanding of standards tested.
Selection Procedures
Data for fourth grade students were used from selected schools. The study used the ex
post facto design to analyze data collected from 2004, 2008, and 2012. Data were selected from
approximately 50 elementary schools that had elementary schools operating on a traditional
school year calendar (August-May), using a traditional grading scale (A, B, C, D, F), and were
geographically located in District 8 of North Alabama.
All elementary schools chosen operated on traditional school schedules. They had a
summer break, winter break, and a spring break. These schools shared a similar grading scale for
communicating academic growth to parents. The students at these schools received instruction in
physical education, music, art, and library in some form during the school year. All schools had
at least one computer lab and many had extended services for children before/after school.
Each school was classified as Title I or Non-Title I for the purpose of this study. Title I
schools receive federal funding if the number of students receiving free or reduced-price lunch is
greater than 35%. Non-Title I schools have some students receiving free and reduced price
lunches but they do not have enough to receive or have chosen to not take on the label of Title I
to receive federal financial support from the government.

51
The ARMT test data was analyzed for these students in the content areas of reading and
math. The collected data only represented the learning that took place during 2004, 2008, and
2012 school terms. After each school was coded Title I or Non-Title I, the data were collected on
fourth grade students in the curriculum areas of reading and math. This data were then
aggregated into subcategories. These subcategories (race, gender, and school type) are defined in
No Child Left Behind.
Phases of Data Collection
To ensure validity, the phases of data collection were taken from Amy Scott (2005).
Phase 1: All fourth-grade test results of students present during the first 20 days of a
traditional school year calendar determined the academic status of the school.
Phase 2: All fourth grade students who attended the selected schools had taken the
ARMT within the window of time provided by the Alabama State Department of Education.
Phase 3: The data were reported to the state department of education and desegregated
into content areas and subgroups.
Phase 4: The data were collected by the researcher and entered into the SPSS program
analysis.
Phase 5: The researcher examined the results provided by the SPSS program, and
assessment data provided by the Alabama State Department of Education.
Instrumentation
All students in Grades 3-8 are required to take the Alabama Reading and Math Test
(ARMT) in March. The ARMT is a criterion-referenced test that measures student mastery

52
(proficiency) of content standards devised by the Alabama Department of Education. It consists
of selected items from the Stanford Achievement Test (Stanford 10) that match the Alabama
state content standards in reading and mathematics. Additional test items were developed to be
included so that all content standards were fully covered. The ARMT is the accountability
measure for all public schools in Alabama.
With approval from No Child Left Behind, the Alabama Reading and Math Test has been
labeled as a reliable and valid assessment. Reliability refers to the measure with which constant
measurements will consistently result in the same ending. Validity is the degree to which the
instrument measures what it is supposed to measure.
In 2004, with the piloting of the ARMT assessment to all fourth, sixth, and eighth grade
students, an effort was made to fully assess student achievement of Alabama’s content standards
before the full implementation of the assessment in the spring of 2005.
Summary
In this chapter, the researcher described the research design, population, and sample
selection procedures. The instrumentation, data collection planning, and data analysis planning
are also explained. The unit of analysis for this study was schools. This was chosen as a way to
examine the achievement gains and deficits of fourth grade students in both Title I and Non-Title
I schools in District 8 of North Alabama. Four research questions are being analyzed in this
study. This study anticipates adding to the body of knowledge on achievement in North Alabama
elementary schools.

53
CHAPTER 4
DATA ANALYSIS
There were four research questions that this research attempted to shed light on. The
questions were as follows:
1. What is the difference in academic achievement between Title I and Non-Title I
schools in 2004, 2008, and 2012 academic years?
2. Are there differences in academic achievement based on ethnicity between Title I and
Non-Title I schools in the 2004, 2008, and 2012 academic years?
3. Are there differences in academic performance based on gender between Title I and
Non-Title I Schools in the 2004, 2008, and 2012 academic years?
4. Have the differences in academic achievement between Title I and Non-Title I schools
significantly decreased between 2004, 2008, and 2012?
In an attempt to answer these questions, fourth grade math and reading data was collected
from elementary schools in three select North Alabama school districts. This study focused on
school aggregate data for fourth grade students and their performance on the Alabama Reading
and Math Test (ARMT) in the content areas of reading and math. The data will reflect three
years of academic performance (2004, 2008, and 2012).
The study focused on two main subgroups: students in Title I schools and students in
Non-Title I schools.

54
The ARMT test data were analyzed for students attending Title I and Non-Title I schools
in the content areas of reading and math. The collected data only represented the learning that
took place for three school terms. After each school was coded Title I or Non-Title I, the data
were collected on fourth grade students in the curriculum areas of reading and math. The data
were then disaggregated into subcategories. These subcategories are defined in No Child Left
Behind.
To analyze the data, a Repeated Measures Analysis was conducted. The independent
variable was the type of school the student attended (Title I School vs. Non-Title I School) and
the repeated measure over time was the years that these students were tested: 2004, 2008, and
2012. Gender and ethnicity were the controlled variables for the study. Math and Reading results
from the Alabama Reading and Math (ARMT) test served as dependent variables for the study
and schools was the unit of analysis.
The descriptive statistics in Table 1 suggest that all student groups showed some level of
improvement over time. In other words, students who attended Title I Schools and those who
attended Non-Title I Schools showed improvement over time. That means that, generally
speaking, a higher percentage of students was more proficient in 2008 compared to 2004, and a
higher percentage was proficient in 2012 than in 2008.

55
Table 1
Repeated Measures Descriptive Statistics
Proficiency Year School type N M SD
Female students 2004
2008
2012
Total
Title I
Non-Title I
Title I
Non-Title I
Title 1
Non-Title 1
Title I
Non-Title I
Total
17
24
18
34
18
27
53
85
138
74.00
87.48
88.72
87.04
93.01
93.62
85.46
89.26
87.80
19.08
09.69
06.43
10.92
05.96
05.64
14.27
09.56
11.70
Male students 2004
2008
2012
Total
Title I
Non-Title I
Title I
Non-Title I
Title 1
Non-Title 1
Title I
Non-Title I
Total
17
24
18
34
18
27
53
85
138
73.76
82.22
84.62
87.16
90.12
91.35
83.00
87.09
85.52
12.91
07.70
09.78
10.83
07.03
06.87
12.04
09.46
10.67
Black students 2004
2008
2012
Total
Title I
Non-Title I
Title I
Non-Title I
Title 1
Non-Title 1
Title I
Non-Title I
Total
17
24
18
34
18
27
53
85
138
68.88
72.14
78.89
73.99
87.87
87.33
78.73
77.71
78.10
14.92
13.38
10.01
14.17
10.01
08.36
13.95
13.92
13.89
White students 2004
2008
2012
Total
Title I
Non-Title I
Title I
Non-Title I
Title 1
Non-Title 1
Title I
Non-Title I
Total
17
24
18
34
18
27
53
85
138
79.46
88.99
88.82
92.08
93.86
95.04
87.53
92.43
90.55
14.58
07.25
11.46
07.25
06.39
05.36
12.55
06.94
09.75

56
Also, Black students were, as an ethnic group, the least proficient, regardless of
subgroup, in the study. In fact, the Black student subgroup was the lowest performing regardless
of the type of school they attended. On the contrary, the White student subgroup, as an ethnic
group, was the highest performing group regardless of the type of school they attended.
To determine if these observed differences are statistically significant, each research
question was analyzed using the Repeated Measures Multivariate Tests and Test of Between
Subjects Effect (see Table 2).
Table 2
Repeated Measures Multivariate Tests
Effect Value F df p n2 Power
Proficiency
Pillai’s Trace
Wilks Lamda
Hottelling’s Trace
Roy’s Largest Root
0.57
0.43
1.35
1.35
58.42
58.42
58.42
58.42
130
130
130
130
.000
.000
.000
.000
.574
.574
.574
.574
1.000
1.000
1.000
1.000
Proficiency*YR
Pillai’s Trace
Wilks Lamda
Hottelling’s Trace
Roy’s Largest Root
0.13
0.87
0.14
0.10
3.04
3.04
3.03
4.36
262
262
262
262
.007
.007
.007
.006
.065
.066
.066
.091
.908
.907
.906
.862
Proficiency*School
Pillai’s Trace
Wilks Lamda
Hottelling’s Trace
Roy’s Largest Root
0.80
0.92
0.09
0.09
3.79
3.79
3.79
3.79
130
130
130
130
.012
.012
.012
.012
.080
.080
.080
.080
.805
.805
.805
.805
Proficiency*YR*School
Pillai’s Trace
Wilks Lamda
Hottelling’s Trace
Roy’s Largest Root
0.10
0.90
0.11
0.92
2.32
2.33
2.34
4.02
262
262
262
262
.034
.033
.032
.009
.050
.051
.051
.084
.799
.801
.803
.830
The first research question was, “What is the difference in academic achievement
between Title I and Non-Title I schools in 2004, 2008, and 2012 academic years?”

57
Table 3
Repeated Measures Test of Between Subjects Effect
Source Type III SS df MS F P n2 Power
Intercept 3747078.25 1 3747078.25 12096.98 .000 .989 1.000
Year 14074.28 2 7037.14 22.72 .000 .256 1.000
School 1259.45 1 1259.45 4.07 .046 .030 0.517
Year*School 2124.57 2 1062.28 3.43 .035 .049 0.635
Error 40887.43 132 309.75
There is a statistically significant difference between the performance of students who
attended Title I schools and those who did not, over time (Wilks Lamda = 0.90; F = 2.33; df,
262; p < .05). In fact, the Test of Between Subjects Effects reveals that there is a statistically
significant interaction effect between time and type of school attended--Title I Schools and those
who did not (SS = 2124.57; MS = 1062.28; F = 3.43; df, 2; p < .05).
Table 4
Repeated measures Multiple Comparison Post Hoc
95% CI
(I) YR (J) YR Mean SE p LB UB
Tukey
HSD
04 08
12
-05.88
-12.33
1.84
1.90
.005
.000
-10.24
-16.83
-1.52-
7.83
08 04
12
05.88
-6.45
1.84
1.79
.005
.001
01.52
-10.70
10.23
-2.20
12 04
08
12.33
06.45
1.90
1.79
.000
.001
7.83
2.20
16.83
10.70
Additionally, according to the Repeated Measure Multiple Comparison Post Hoc (see
Table 4), the Estimated Marginal Means for Title I Schools and Non-Title I Schools (see Figure
1), and the Estimated Marginal Means for Each Year--2004, 2008, and 2012 (see Figure 2) all

58
reveal that students who attended Title I schools performed lower than those who did not. Also,
students’ performance consistently improved over time.
The second research question asked whether differences existed in academic achievement
based on ethnicity between Title I and Non-Title I schools in the 2004, 2008, and 2012 academic
years. Based on the descriptive statistics (Black, M = 78.10, SD = 13.89; and White, M = 90.55,
SD = 9.75), it is clear that White students outperformed Black students (see Table 1).
Additionally, the Estimated Marginal Means (see Figure 2) indicate that the performance for
both Whites and Blacks improved over time. However, Whites outperformed Blacks in every
year studied. In fact, Whites were the highest performing subgroup and Blacks were the lowest
performing subgroup. Similarly, Whites outperformed Blacks regardless of the type of school
they attended. Whites who attended Title I schools outperformed Blacks who attended Title I
schools. Also, Whites who attended Non-Title I schools outperformed Blacks who attended Non-
Title I schools. In short, while the type of school attended (Title I School vs. Non-Title I School)
seemed to make a difference for White students, that factor did not seem to make a difference for
Black students (see Figure 1).

59
Figure 1. Estimated marginal means for Title I schools and Non-Title I schools.
Figure 2. Estimated marginal means for each year--2004, 2008, and 2012.
77.5
80.0
82.5
85.0
87.5
90.0
92.5
Title 1 Non Title 1
Esti
mat
ed M
argi
nal
Mea
ns
School_Type
Estimated Marginal Means of MEASURE_1
Females
Males
Blacks
Whites
70
75
80
85
90
95
04 08 12
Esti
mat
ed M
argi
nal
Mea
ns
YR
Estimated Marginal Means of MEASURE_1
Females
Males
Blacks
Whites
60
There was a statistically significant difference in achievement based on the type of school
they attended based on the students’ ethnicity. White students (White, M = 90.55, SD = 9.75)
outperformed their Black counterparts (Black, M = 78.10, SD = 13.89) overtime regardless of the
type of school they attended (see Figure 1). Over time, based on ethnicity, the type of school
students attended--Title I Schools (Whites, M = 86; Blacks, M = 78) and Non-Title I Schools
(Whites, M = 92; Blacks, M = 77) indicated that White students who attended Non-Title I school
performed better than those who attended Title I Schools. However, the type of school had no
effect on the performance of Black students. White students outperformed their Black
counterparts on that metric.
The third research question was concerned with differences in academic performance
based on gender between Title I and Non-Title I Schools in the 2004, 2008, and 2012 academic
years. Based on the descriptive statistics of Females (M = 87.80, SD = 11.70) and Males (M =
85.52, SD = 10.67), it seemed that Female students outperformed their male counterparts (see
Table 1). Additionally, the Estimated Marginal Means (see Figure 2) indicated that the
performance of both females and males improved over time. Females seemed to have
outperformed Males in every year studied. Similarly, Females seemed to have outperformed
Males regardless of the type of school they attended (see Figure 1). Females who attended Non-
Title I schools outperformed their counterparts who attended Title I schools. The type of school
attended seemed to have an effect on performance. Therefore, there was a statistically significant
difference in achievement over time and type of school attended based on the students’ gender.
The fourth research question asked if the differences in academic achievement between
Title I and Non-Title I schools significantly decreased over time--between 2004, 2008, and 2012.
There is a statistically significant increase in performance over time of students who attended

61
Title I schools and those who attended Non-Title I schools (Wilks Lamda = 0.90; F = 2.33; df,
262; p < .05). In fact, the Test of Between Subjects Effects revealed that there is a statistically
significant interaction effect between time and type of school attended--Title I Schools vs. Non-
Title I Schools (SS = 2124.57; MS = 1062.28; F = 3.43; df, 2; p < .05).
In addition, the Repeated Measures Multiple Comparison Post Hoc results (see Table 4
and Figure 2) all indicated that students’ performance improved over time. White students had
the highest performance is each year studied. Black students had the lowest performance in each
year studied. However, of all the groups studied, Black students had the sharpest increase in
performance between 2008 and 2012.

62
CHAPTER 5
SUMMARY OF FINDINGS, CONCLUSIONS, AND RECOMMENDATIONS
The purpose of this study was to determine if there is a difference between fourth grade
students in Title I schools and fourth grade students in Non-Title I schools in three selected
school districts within District 8 of North Alabama. Reading and math data were collected from
50 schools from three school districts in Madison, Alabama. Data dealing with the subgroups of
gender and race were collected to show students meeting, exceeding, and not meeting standards
in both reading and math.
Summary of Findings
During the years of 2004, 2008, and 2012, there was a statistically significant difference
in the achievement of students who attended Title I schools and those who did not. Results
revealed that students who attended Non-Title I schools performed at a higher achievement level
then their Title I peers. However, Title I schools decreased the achievement gap over time. Based
on the descriptive statistics, it is clear that White students outperformed Black students. The
performance for both Whites and Blacks improved over time. However, Whites outperformed
Blacks in every year studied. In fact, Whites were the highest performing subgroup and Blacks
were the lowest performing subgroups. Similarly, Whites outperformed Blacks regardless of the
type of school they attended. Whites who attended Title I schools outperformed Blacks who
attended Title I schools. Also, Whites who attended Non-Title I schools outperformed those who
attended Non-Title I schools. In short, while the type of school attended (Title I School vs.

63
Non-Title I School) seemed to make a difference for White students, that factor did not seem to
make a difference for Black students.
The study also found that female students outperformed their male counterparts;
however, the performance of both females and males improved over time. Females seemed to
have outperformed males in every year studied. Females seemed to have outperformed males
regardless of the type of school they attended. Females who attended Non-Title I schools
outperformed their counterparts who attended Title I schools. The type of school attended
seemed to have an effect on the performance of the students.
Over time, the academic performance of both students who attended Title I schools and
those who attended Non-Title I schools increased significantly. White students had the highest
performance in each year studied. Black students had the lowest performance in each year
studied. However, of all the groups studied, Black students had the sharpest increase in
performance between 2008 and 2012.
As President Johnson stated, freedom is not enough. It is imperative that the
educators/stakeholders of the free world find a way to prepare our young people to be college
and career ready. We have to remember that just a few decades ago it was illegal for people of
color to read. While everyone is now allowed a free and appropriate education, we must now
work to ensure everyone is not just provided an equal education but also find a way to define and
correct the true elephant in the room. The fact that African Americans are now able to compete
in the race is not enough. African Americans have been behind in the race from the beginning,
which is why President Johnson and his staff devised the Elementary and Secondary Act. With
the implementation of the ESEA and the availability of Title I funds, President Johnson’s goal
was to provide support to students in need. He set out to overcome the elephant.

64
Implication of the Study
The study shines further light on the topic of achievement in education and the gap that is
said to be between different ethnic groups. This study focused on the achievement of Title I and
Non-Title I schools using gender and race as variables. The findings of the study reveal to us that
in three school districts in North Alabama’s District 8, there are still achievement disparities
among Blacks and Whites. What are the implications for the state of Alabama as well as the
three school districts in the study?
The data gained gives the state of Alabama a longitudinal look at proficiency levels of
Title I and Non-Title I schools broken down as aggregated data using gender and race as
variables. The data revealed that although not at the pace desired, Title I funding is working to
improve achievement of low socioeconomic students. As found in the study, White students are
still outperforming their Black peers, with White females being the top performers. Alabama can
use this data to determine what Title I programs are working and try to replicate those programs
in areas that have not seen as much growth in their Title I schools.
The implications for the school district’s study should be a charge to continue to seek
growth in its Title I schools and among all students; however, more attention should be placed on
Black males as they were the lowest achievers in the study. As females continue to outpace
males in all categories of this study, some Title I funding should be diverted to help Black and
White males in the areas of math and reading.
Alabama will implement a new assessment in the spring of 2014. The results have the
potential to be mixed with many students performing worse than they had on the previous
assessment. These results should be managed so that stakeholders do not take a negative look at
the achievement of students or the quality of schools and teachers. Before publicizing the results

65
of the new test, it is important to consider the aftermath that may affect the schools, school
districts, teachers, and students. This is indeed a stipulation of implementing a new assessment
for the first time.
Conclusions
All stakeholders, based on the information gathered and analyzed in this study, can
conclude that there are differences within Title I and Non-Title I schools that go beyond the
social economic status of the students that attend the schools. It was the purpose of this study to
inform stakeholders in and around the state of Alabama (specifically the area of North Alabama)
of the results of this study. The results of this study should provide insight in the effectiveness of
the No Child Left Behind Act and the funds used to support Title I schools.
Significance of the Study
The significance of this study is that Title I funding is working, as the achievement is
increasing in both Title I and Non-Title I schools. However, one must consider the possibility of
the achievement increase of both Title I and Non-Title I schools may be due to teachers and
students becoming more familiar with the test, in which case, teaching to the test could have led
to the result of increase achievement. With the adoption of a new test this possibility may be
revealed. If indeed the achievement gap increases between students attending Non-Title I schools
and Title I schools, much consideration must be taken to the effects of test familiarity and
teaching to the test.
Other variables that may affect the outcome of the new assessment, Act Aspire, would be
the implementation of new curriculum standards. Alabama Common Core Standards were

66
adopted and implemented into curriculum in 2012. Teachers are undergoing professional
development to increase their knowledge of these standards. This would permit different
demographics and possibly different subgroups for comparison.
Recommendations for Further Research
While it seems as if Title I funding has helped to close the achievement gap in fourth
grade reading and math, much improvement is still necessary. Blacks in every setting scored
much lower than their counterparts. If replicated, I would suggest that the researcher study
schools in other parts of the United States as well as schools in more affluent and extreme
poverty communities. A replicated study within District 8 of North Alabama that includes more
school districts will add to the research conducted for this area thus providing more insight for
decisions on the use of Title I funds for this area.
This same study could be replicated using different grades, subcategories, and content
areas. This study could also be replicated in other districts across the state of Alabama. The
research in this study consisted of aggregated school data taken from the Alabama Reading and
Math Assessment of three select school districts within District 8 of North Alabama. A future
study can be conducted using the disaggregated data of students, rather than the aggregated data
of schools, using gender and race as variables. This would permit different demographics and
possibly different subgroups for comparison. A replicated study should also be conducted using
gender, race, and/or social economic status variables. Moreover, a future study should go a step
further in comparing the achievement gap of students of low social economic status who attends
Title I schools to those who attend Non-Title I schools. Ideally, a study should be conducted
using a more diverse population of students enrolled in Title I schools.

67
The Alabama Reading and Math Test (ARMT) is no longer the assessment used to
measure student achievement for the state of Alabama. Beginning in May 2014, students across
Alabama will complete the ACT Aspire assessment, which will replace the ARMT assessment.
A replica of this study using data from the ACT Aspire should be conducted to determine the
difference/patterns between the first administered assessment of ARMT and the first
administered assessment of Act Aspire. A longitudinal study should also be conducted to
compare the long-term differences of the two assessments. This should answer the question, “Is
education improving or are we simply teaching to the test?”
Summary of the Study
In conclusion, this study took a closer look at the differences of Title I and Non-Title I
schools. Moreover, it focused on the likelihood of closing the achievement gap of the two types
of schools. It is the hope of the federal government to assist in raising the educational level of
Title I schools by providing additional funding for curriculum resources. One may assume that
the funds provided by the federal government have, in fact, leveled the playing field by closing
the achievement gap between Title I and Non-Title I schools. However, findings of this study
proved different. This study focused on aggregated longitudinal data for reading and math scores
of both gender and ethnicity subgroups within Title I and Non-Title schools. While all of the
schools involved showed improvement in test scores over a period of time, Non-Title I schools
steadily scored better than Title I schools. Blacks consistently performed the worst when
compared to the other groups, regardless of school setting, and females outperformed their male
counterparts regardless of school setting. However, females in Non-Title I schools outperformed
females in Title I schools.

68
REFERENCES
Arce, J., Luna, D., Borjian, A., & Conrad, M. (2005). No child left behind: Who wins? Who
loses? Social Justice, 32(3), 56-71.
Alabama Department of Education. (2010). Alabama interpretive guide. Retrieved August 23,
2011, from http://issuu.com/consolidatedpublishing/docs/2011aypinterpretiveguide
Arvin, L. (2009). Teacher’s perceptions of equity in education in high-poverty schools. (Doctoral
dissertation). Available from ProQuest Dissertations and theses.
Baker, M., & Johnston, P. (2010). The impact of socioeconomic status on high stakes testing
reexamined. Journal of Instructional Psychology, 37(3), 193-199.
Bali, V., & Alvarez, R. (2004). The race gap in student achievement scores: longitudinal
evidence from a racially diverse school district. Policy Studies Journal, 32(3), 393-415.
Bennett, M. (2008). Understanding the students we teach: poverty in the classroom. The
Clearing House, 81(6), 251-256.
Bielick, S., & Chapman, C. (2003). Trends in the use of school choice: 1993 to 1999. Statistical
analysis report ED Pubs, P.O. Box 1398, Jessup, MD 20794-1398. Retrieved from
http://search.proquest.com/docview/62171079?accountid=14472
Bland-Washington, R (2009). Are title I schools helping students make the grade? A comparison
of grade 4 standardized test scores in title I and non-title I schools in west Georgia.
Retrieved from, http://www.brookings.edu/~/media/research/files/reports/
2003/11/education/20031116schoolchoicereport.pdf
California School Boards Association. (2004). Supplemental educational service for NCLB;
School districts and county offices as providers. Retrieved January 16, 2013, from
http://www.cde.ca.gov/ta/ac/ti/supplemental.asp
Carnoy, M. (2001). School choice? Or is it privatization? Educational Research, 29(7), 15-20.
Coulson, A. J. (1998). School choice: the citizen’s guide to education reform. Retrieved from
http://www.heritage.org/Research/Education/Schools/introduction.cfm
Currie, J., & Thomas, D. (1998). School quality and the longer-term effects of head start.
Cambridge, MA: National Bureau of Economic Research.
Cunningham, W. G., & Gresso, D. W. (1993). Cultural leadership: the culture of excellence in
education. (pp. 11-15). Boston, MA: Allyn & Bacon.

69
Definitions. (n.d.). Retrieved from Http://www.ed.gov/race-top/district-competition/definitions.
Dole, J. (2004). The changing role of the reading specialist in school reform. The Reading
Teacher 57, 462-471.
Donlevy, J. (2003). Educational reforms and high-stakes testing: Are public schools still for the
public? International Journal of Instructional Media, 30(3), 225-230.
Executive Summary Accountability. (2003). Retrieved March 21, 2013, from
http://www.ed.gov./nclb/overview/intro/execsumm.html
Garces, E., Thomas, D., & Currie, J. (2000). Longer term effects of head start. Retrieved from
National Bureau of Economic Research website http://www.nber.org/paper/w8054
Gillborn, D. (2008). Coincidence or conspiracy? Whiteness, policy and the persistence of the
black/white achievement gap. Educational Review, 60(3), 229-248.
Glossary of educational terms. (2008). Retrieved from http://pub.school.wisepress.com/dict/
dict.html
Glossary of education terms. (2011). Retrieved from http://www.doe.virginia.gov
Greene, J. P. (2000). The effect of school choice: An evaluation of the charlotte children's
scholarship fund program. civic report no. 12. Retrieved from http://search.proquest.
com/docview/62350306?accountid=14472
Heck, R. (2006). Assessing school achievement progress: comparing alternative approaches.
Educational Administration Quarterly, 42(5), 667-699.
Hill, D., & Barth, M. (2004). NCLB and teacher retention: Who will turn out the lights?.
Education and the Law, 16(2-3), 173-181.
Holt, A. (2012, December). New resources on head start. Retrieved from http://earlyed.
newamerica.net/blogposts/2012/new_resources_on_head_start-75434
Kantor, H., & Lowe, R. (2006). From new deal to no deal: No child left behind and the
devolution of responsibility for equal opportunity. Harvard Educational Review, 76(4),
474-502.
Kaufman, G., & Weiss, E. (2013) Time to take on concentrated poverty and education. The
Nation. Retrieved from http://www.thenation.com
Khlenberg, R. (2001). Learning from James Coleman. Public Interest, 54-128.
Kim, J. S., & Sunderman, G. L. (2005). Measuring academic proficiency under no child left
behind act: Implications for educational equity. Educational Researcher, 34(8), 3-13.

70
Kessinger, T. (2011). Efforts toward educational reform in the united states since 1958 a review
of seven major initiatives. American Educational History Journal, 38(2), 263-276.
Krahmal, A., Zirkel, P., & Kirk, E. (2004). Additional evidence under the individuals with
disabilities education act: the need for rigor. Texas Journal on Civil Liberties & Civil
Rights, Spring(9), 201-232.
Lefave, D. (2010, August 23). No child left behind and special education explained. Retrieved
from http://www.lefave.net/uncategorized/181/
McCargar, J. P. (2003). Stronger accountability testing for results. Retrieved November 11,
2003, from http://www.ed.gov/nclb/accountability/.
Murphy, J. (1971). Title 1 of ESEA: The politics of implementing federal education reform.
Harvard Educational Review, 41(1), 35-63.
National Working Commission on Choice in K-12 Education. (2003). School choice doing it the
right way makes a difference. Retrieved from website: http://www.brookings.edu/
browncenter
Noguera, P. (2009). The achievement gap: Public education in crisis. New Labor Forum, 18(2),
61-69, 127. doi: 237229614
Paige, R. (2002). What to know and where to go parent’s guide to no child left behind a new era
in education. Washington, DC: U.S. Department of Education.
Polnick, B., & Reed, D. (2006). What's really at stake with high-stakes testing? Advancing
Women in Leadership, 22, 1. Retrieved from http://search.proquest.com/docview/
218161633?accountid=14472
Patterson, J. T. (2010). Freedom is not enough. New York, NY: Basic Books.
Russo, C., Osborne, A., & Borreca, E. (2005). The 2004 re-authorization of the individuals with
disabilities education act. Education and the Law, 17(3), 111-117.
Saporito, S., & Sohoni, D. (2007). Mapping educational inequality: concentrations of poverty
among poor and minority students in public schools. Social Forces, 85(3), 1227-1253.
Scott, A. M. (2005). A quantitative examination of title I and nonTitle I elementary schools in
east tennessee using fourth-grade math and reading standardized test scores. (Order No.
3195385, East Tennessee State University). ProQuest Dissertations and Theses, , 78-78
p. Retrieved from http://search.proquest.com/docview/304994883?accountid=14472.
(304994883).
Skiba, R., Poloni-Staudinger, L., Simmons, A., Feggins-Azziz, L., & Chung, C. (2005). Can
poverty explain ethnic disproportionality in special education? The Journal of Special
Education, 39(3), 130-144.

71
Smith, A. (1995). Public school choice and open enrollment: Implications for education,
desegregation, and equity. Journal of Law and Education, 24(2), 147-194.
Solomon, D., Battistich, V., & Ham, A. (2000). Teacher beliefs and practices in schools serving
communities that differ in socioeconomic level. The Journal of Experimental Education,
64(4) 327-347.
Sunderman, G. L. (2006). Do supplemental educational services increase opportunities
for minority students? Phi Delta Kappan, 88(2), 117. Retrieved from Questia
database.
United States Department of Education. (2009). Recovery act. Retrieved from http://www2.
ed.gov
U.S. Department of Education. (2004a). Title I--Improving the academic achievement of the
disadvantaged. Retrieved November 11, 2011, from http://www2.ed.gov/policy/
elsec/leg/esea02/pg1.html
U.S. Department of Education. (2004b). Glossary of Terms. Retrieved January 15, 2014, from
http://www2.ed.gov/nclb/index/az/glossary.html#top
U.S. Department of Education. (2001). Public Law print of PL 107-110, the No Child Left
Behind Act of 2001 Retrieved November 21, 2011, from http://www2.ed.gov/
policy/elsec/leg/esea02/pg1.html
U.S. Department of Education. (2002a, January 7). Executive summary: The no child left behind
act of 2001. Retrieved from http://www2.ed.gov/nclb/overview/intro/execsumm.html
U.S. Department of Education. (2002b). No child left behind: A desktop reference. Washington,
DC: Office of Elementary and Secondary Education.
US Department of Education. (2003). Executive Summary Accountability. Retrieved March 21,
2013, from http://www.ed.gov./nclb/overview/intro/execsumm.html
Vanneman, A., Hamilton, L., Anderson, J., & Rahman, T. (2009). Achievement gaps: How Black
and White students in public schools perform in mathematics and reading on the
National Assessment of Educational Progress. Retrieved from National Center for
Education Statistics website: http://nces.ed.gov
Weiss, C. (1996). Foreword. In B. Fuller, & R. Elmore (Eds.), Who chooses? Who loses?:
Culture, institutions, and the unequal effects of school choice (pp. vii-viii). New York,
NY: Teachers College, Columbia University.
Williams, D. G. (2003). The promise of school choice: Local school control efforts to close the
achievement gap in the federal context of accountability. (Order No. 3086216, University
of Illinois at Urbana-Champaign). ProQuest Dissertations and Theses, 188-188 p.
Retrieved from http://search.proquest.com/docview/305330330?accountid=14472.
(305330330).

72
Wisniewski, M. (2012, September 18). Chicago teachers end strike, school to resume
wednesday. Reuters. Retrieved from http://www.reuters.com/assets/print?aid=
USBRE88EOIV201218
Wong, K. K. (2008). Federalism revised: The promise and challenge of the No Child Left
Behind Act. Public Administration Review, S175-S185.
Yau, R. (1999, Fall/Winter). Technology in k-12 public schools:. Retrieved from http://www.
maec.org/Old/techrev.html
Ysseldyke, J., Betts, J., Thill, T., & Hannigan, E. (2004). Use of an instructional management
system to improve mathematics skills for students in Title I programs. Preventing School
Failure, 48, 10-14.
Zirkel, P. (2009). Legal eligibility of students with learning disabilities: Consider not only RTI
but also 504. Nursing & Allied Health Source, 32(2), 51-53.

73
APPENDIX A
IRB EXEMPTION LETTER

74