presentation vifor pharma/media/files/v/vifor-pharma/documents/en/investors/ir... · o dividend...
TRANSCRIPT

VIFOR PHARMA
INVESTOR PRESENTATION
PRESENTATION
March 2019
© Vifor Pharma March 2019 2
VIFOR PHARMA
OUR VISION
Global leader
in iron deficiency, nephrology
and cardio-renal therapies.
© Vifor Pharma
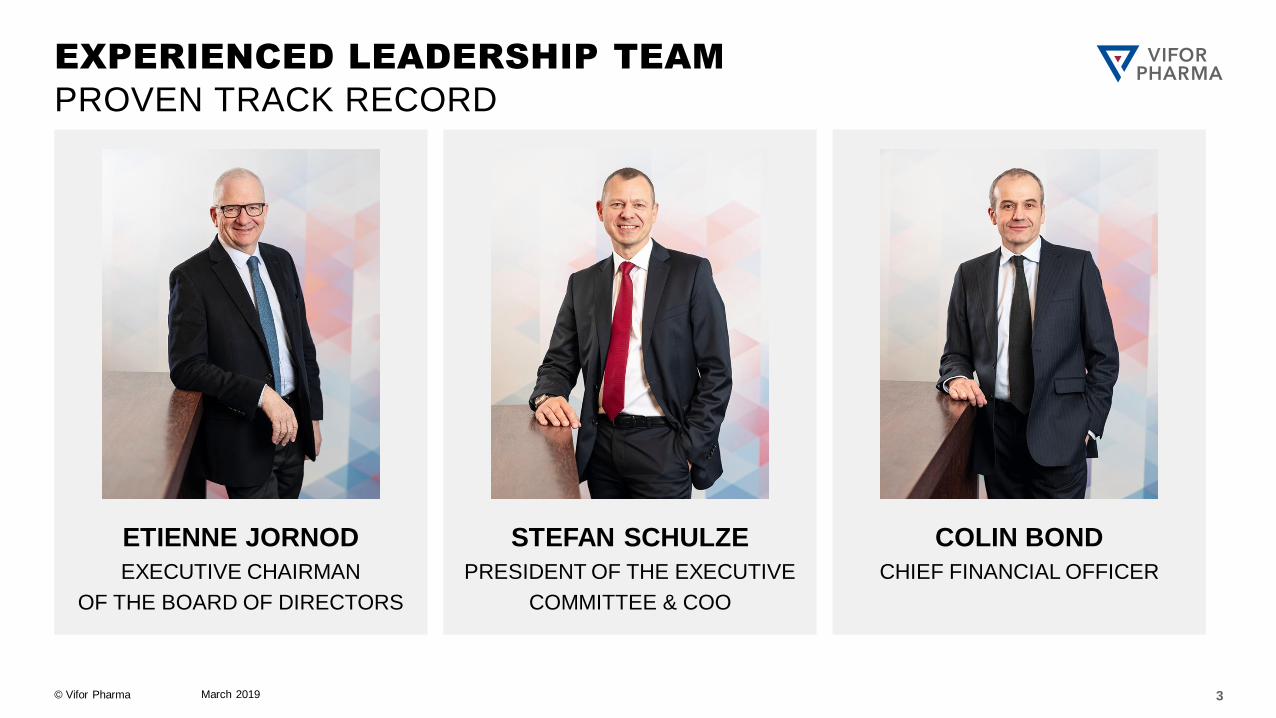
EXPERIENCED LEADERSHIP TEAM
PROVEN TRACK RECORD
March 2019 3
ETIENNE JORNOD
EXECUTIVE CHAIRMAN
OF THE BOARD OF DIRECTORS
STEFAN SCHULZE
PRESIDENT OF THE EXECUTIVE
COMMITTEE & COO
COLIN BOND
CHIEF FINANCIAL OFFICER
© Vifor Pharma
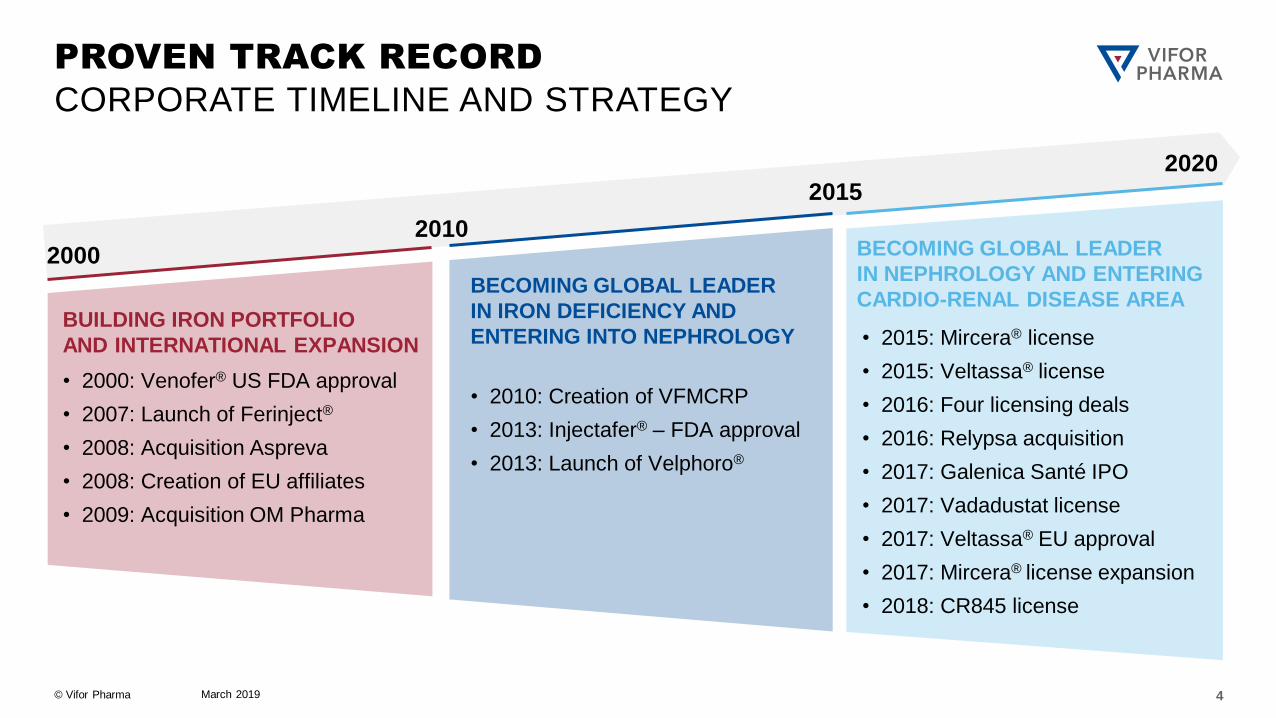
PROVEN TRACK RECORD
CORPORATE TIMELINE AND STRATEGY
2000 2010
2015
2020
BECOMING GLOBAL LEADER
IN IRON DEFICIENCY AND
ENTERING INTO NEPHROLOGY
BECOMING GLOBAL LEADER
IN NEPHROLOGY AND ENTERING
CARDIO-RENAL DISEASE AREA
• 2000: Venofer® US FDA approval
• 2007: Launch of Ferinject®
• 2008: Acquisition Aspreva
• 2008: Creation of EU affiliates
• 2009: Acquisition OM Pharma
• 2010: Creation of VFMCRP
• 2013: Injectafer® – FDA approval
• 2013: Launch of Velphoro®
• 2015: Mircera® license
• 2015: Veltassa® license
• 2016: Four licensing deals
• 2016: Relypsa acquisition
• 2017: Galenica Santé IPO
• 2017: Vadadustat license
• 2017: Veltassa® EU approval
• 2017: Mircera® license expansion
• 2018: CR845 license
BUILDING IRON PORTFOLIO
AND INTERNATIONAL EXPANSION
March 2019 4
© Vifor Pharma
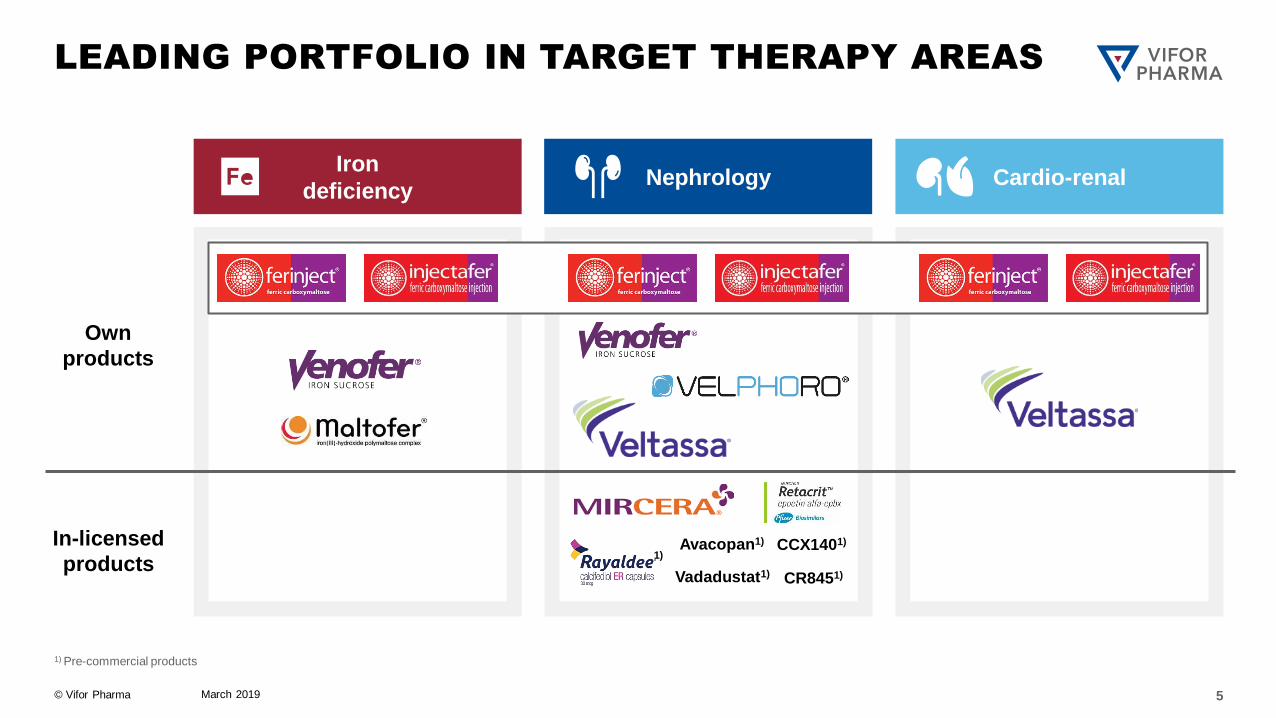
LEADING PORTFOLIO IN TARGET THERAPY AREAS
1) Pre-commercial products
Avacopan1) CCX1401)
1)
Vadadustat1)
March 2019 5
CR8451)
Iron
deficiency Nephrology Cardio-renal
Own
products
In-licensed
products
© Vifor Pharma
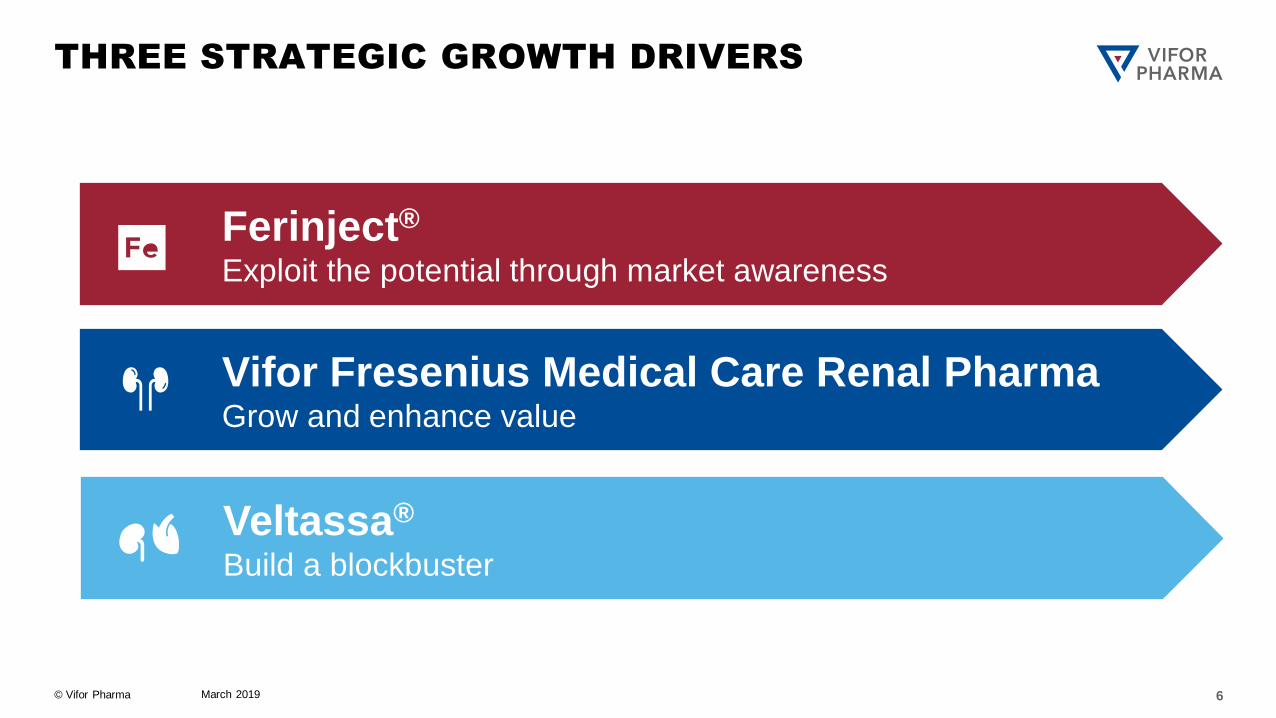
THREE STRATEGIC GROWTH DRIVERS
Ferinject® Exploit the potential through market awareness
Veltassa® Build a blockbuster
Vifor Fresenius Medical Care Renal Pharma Grow and enhance value
March 2019 6
© Vifor Pharma
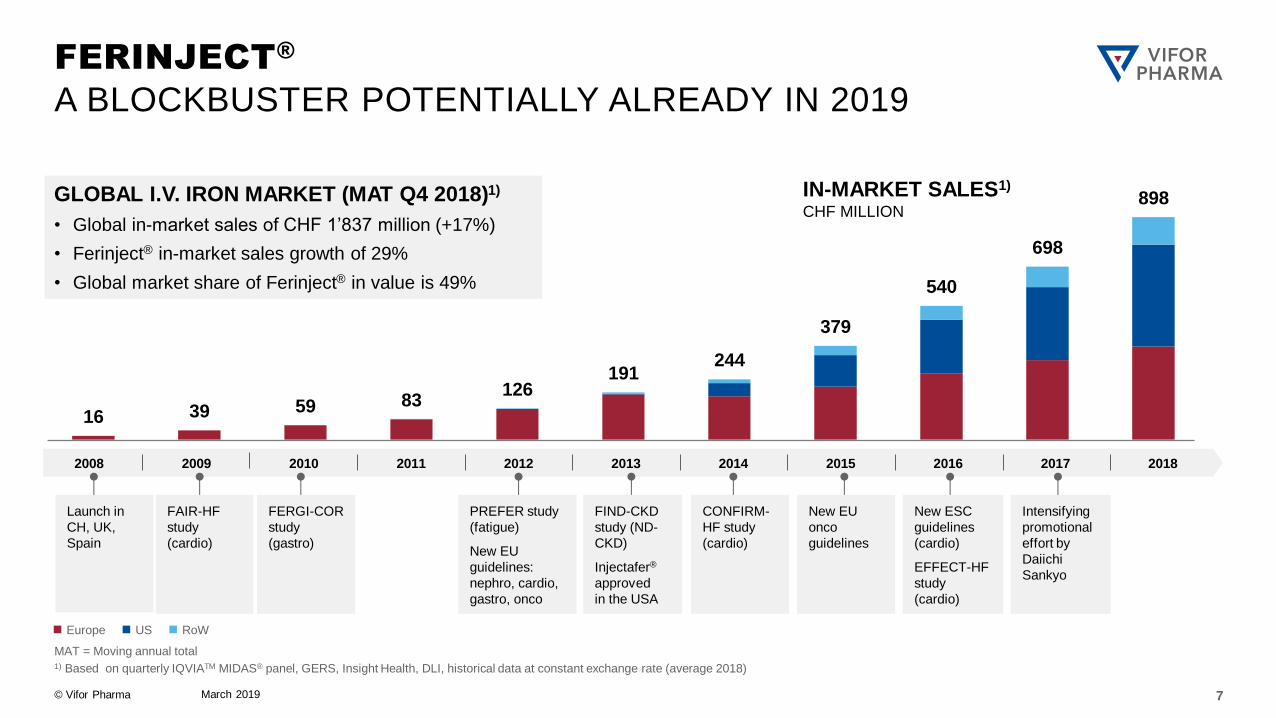
16 39 59 83 126
191 244
379
540
698
898
March 2019
FERINJECT®
A BLOCKBUSTER POTENTIALLY ALREADY IN 2019
Europe US RoW
MAT = Moving annual total
1) Based on quarterly IQVIATM MIDAS® panel, GERS, Insight Health, DLI, historical data at constant exchange rate (average 2018)
7
GLOBAL I.V. IRON MARKET (MAT Q4 2018)1)
• Global in-market sales of CHF 1’837 million (+17%)
• Ferinject® in-market sales growth of 29%
• Global market share of Ferinject® in value is 49%
IN-MARKET SALES1)
CHF MILLION
2008 2009 2010 2011 2012 2013 2014 2015 2016 2017 2018
FAIR-HF
study
(cardio)
FERGI-COR
study
(gastro)
PREFER study
(fatigue)
New EU
guidelines:
nephro, cardio,
gastro, onco
FIND-CKD
study (ND-
CKD)
Injectafer®
approved
in the USA
CONFIRM-
HF study
(cardio)
New ESC
guidelines
(cardio)
EFFECT-HF
study
(cardio)
Intensifying
promotional
effort by
Daiichi
Sankyo
Launch in
CH, UK,
Spain
New EU
onco
guidelines
© Vifor Pharma
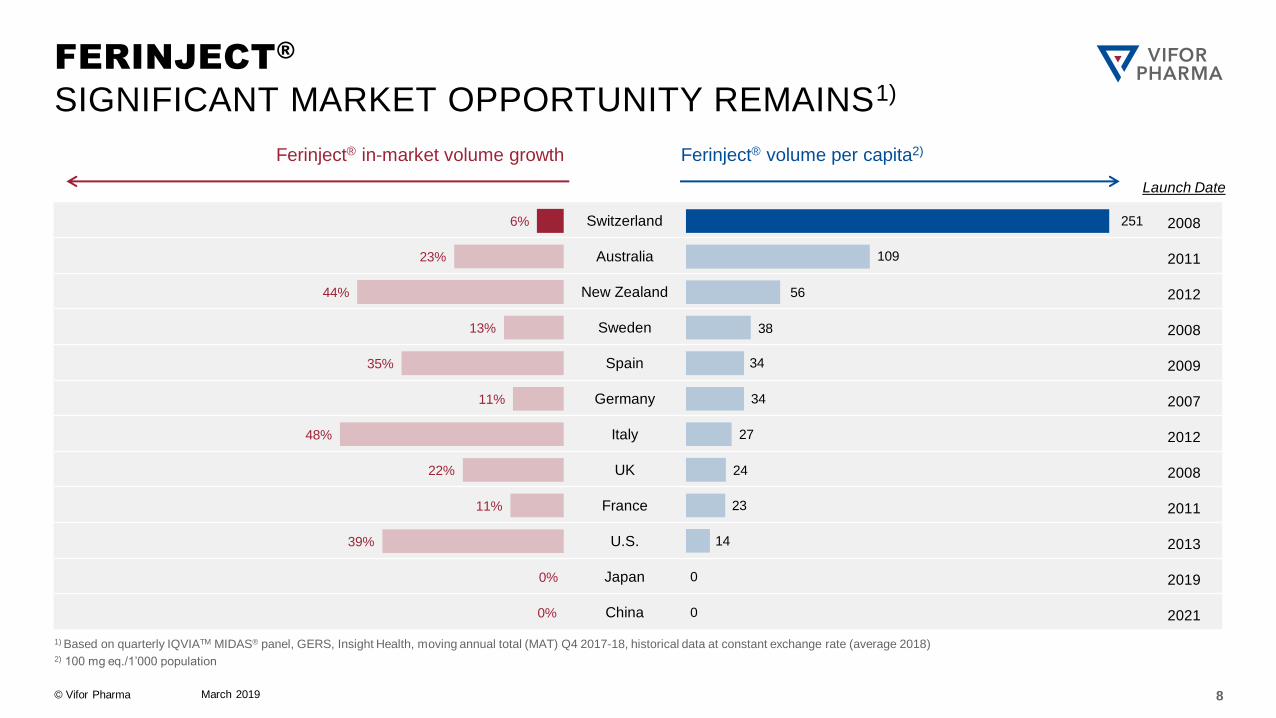
Switzerland
Australia
New Zealand
Sweden
Spain
Germany
Italy
UK
France
U.S.
Japan
China
6%
23%
44%
13%
35%
11%
48%
22%
11%
39%
0%
0%
March 2019 8
FERINJECT®
SIGNIFICANT MARKET OPPORTUNITY REMAINS1)
1) Based on quarterly IQVIATM MIDAS® panel, GERS, Insight Health, moving annual total (MAT) Q4 2017-18, historical data at constant exchange rate (average 2018) 2) 100 mg eq./1’000 population
Launch Date
2008
2011
2012
2008
2009
2007
2012
2008
2011
2013
2019
2021
Ferinject® volume per capita2) Ferinject® in-market volume growth
251
109
56
38
34
34
27
24
23
14
0
0
© Vifor Pharma March 2019 9
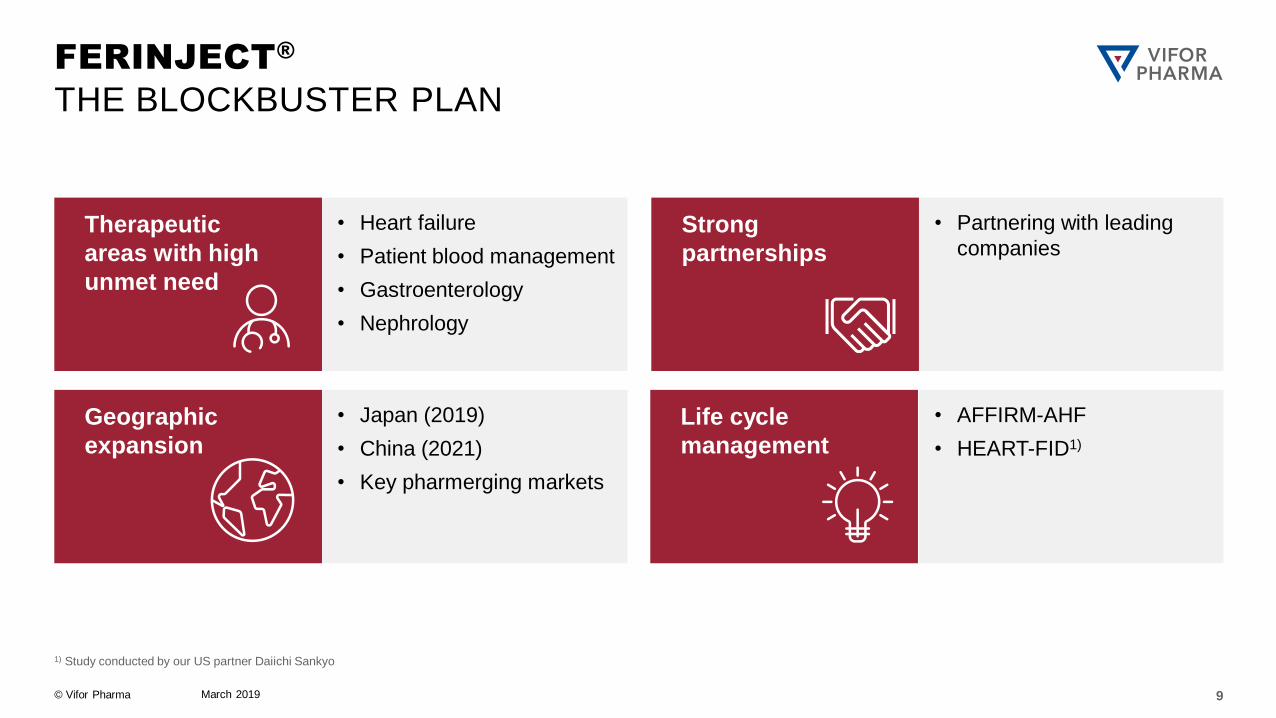
FERINJECT®
THE BLOCKBUSTER PLAN
1) Study conducted by our US partner Daiichi Sankyo
Therapeutic
areas with high
unmet need
• Heart failure
• Patient blood management
• Gastroenterology
• Nephrology
Strong
partnerships
• Partnering with leading
companies
Geographic
expansion
• Japan (2019)
• China (2021)
• Key pharmerging markets
Life cycle
management
• AFFIRM-AHF
• HEART-FID1)
© Vifor Pharma
2020 2021 2022 2023 2024
March 2019 10
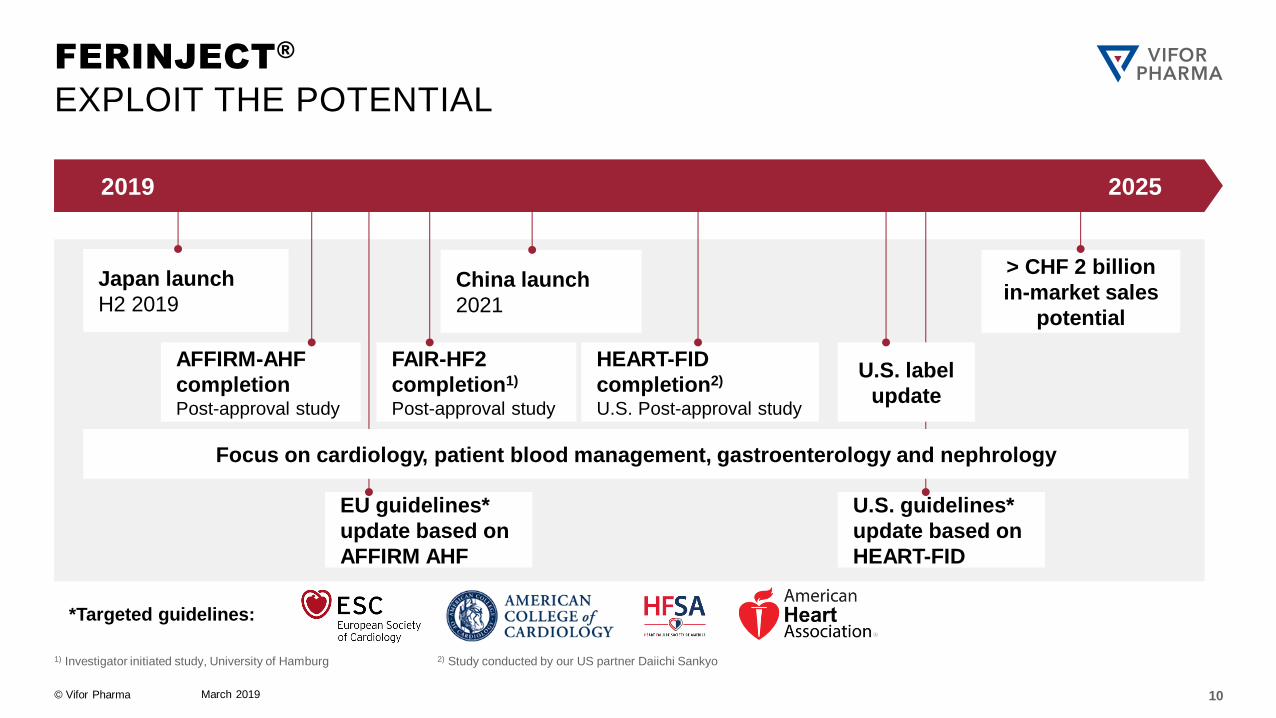
1) Investigator initiated study, University of Hamburg 2) Study conducted by our US partner Daiichi Sankyo
FERINJECT®
EXPLOIT THE POTENTIAL
2019 2025
HEART-FID
completion2) U.S. Post-approval study
FAIR-HF2
completion1) Post-approval study
China launch
2021
AFFIRM-AHF
completion Post-approval study
EU guidelines*
update based on
AFFIRM AHF
U.S. guidelines*
update based on
HEART-FID
*Targeted guidelines:
Focus on cardiology, patient blood management, gastroenterology and nephrology
> CHF 2 billion
in-market sales
potential
Japan launch
H2 2019
U.S. label
update
© Vifor Pharma March 2019 11
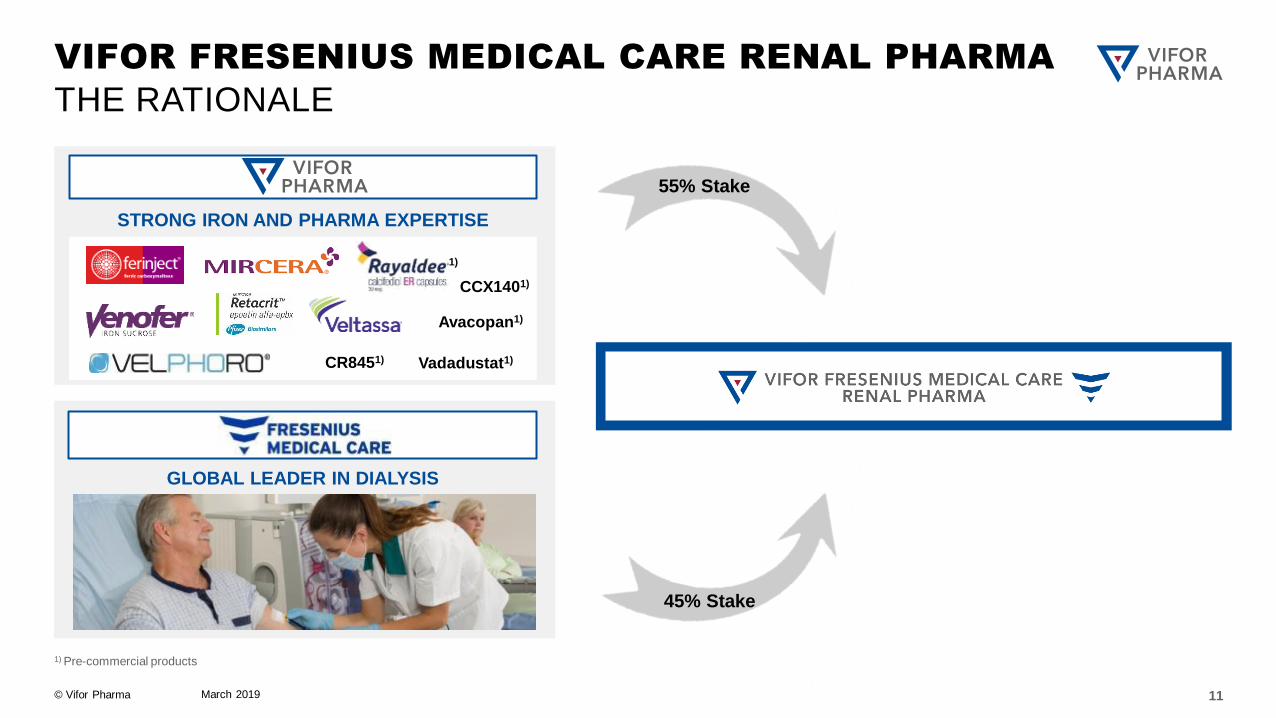
1) Pre-commercial products
VIFOR FRESENIUS MEDICAL CARE RENAL PHARMA
THE RATIONALE
STRONG IRON AND PHARMA EXPERTISE
GLOBAL LEADER IN DIALYSIS
Avacopan1)
CCX1401)
55% Stake
45% Stake
Vadadustat1) CR8451)
1)
© Vifor Pharma
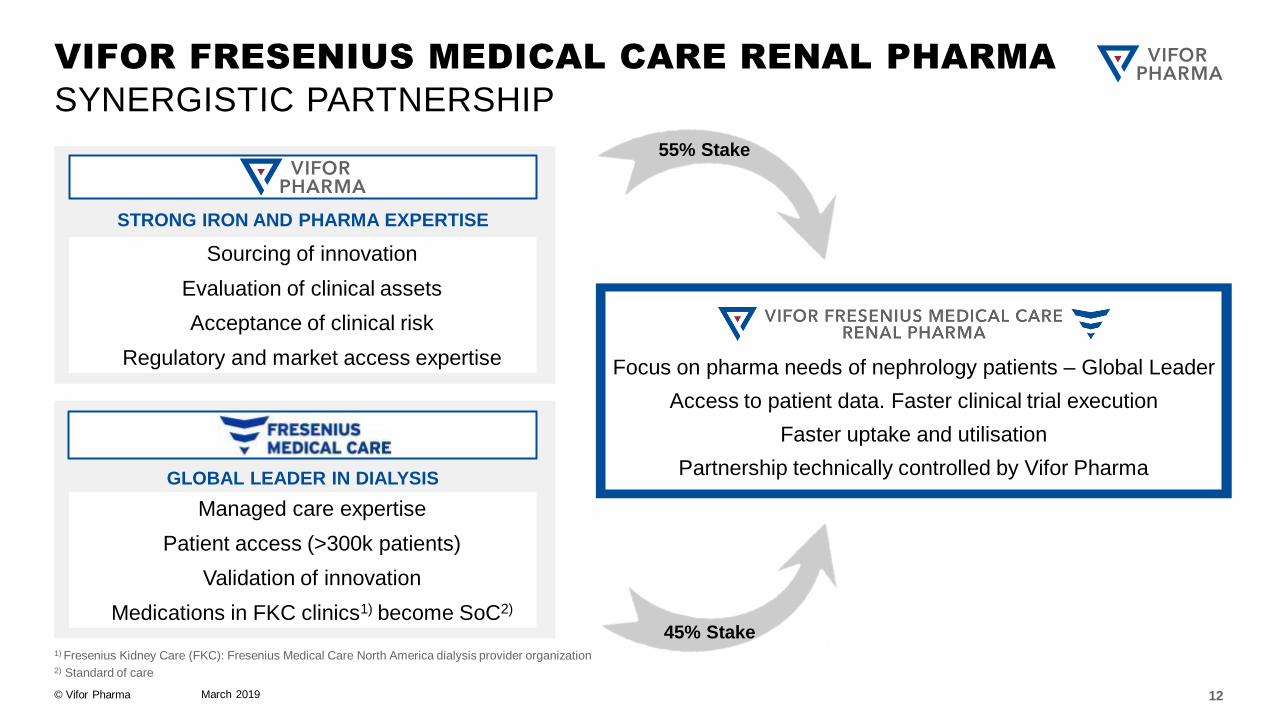
Managed care expertise
Patient access (>300k patients)
Validation of innovation
Medications in FKC clinics1) become SoC2)
Sourcing of innovation
Evaluation of clinical assets
Acceptance of clinical risk
Regulatory and market access expertise
55% Stake
45% Stake
March 2019 12
VIFOR FRESENIUS MEDICAL CARE RENAL PHARMA
SYNERGISTIC PARTNERSHIP
Focus on pharma needs of nephrology patients – Global Leader
Access to patient data. Faster clinical trial execution
Faster uptake and utilisation
Partnership technically controlled by Vifor Pharma
1) Fresenius Kidney Care (FKC): Fresenius Medical Care North America dialysis provider organization 2) Standard of care
STRONG IRON AND PHARMA EXPERTISE
GLOBAL LEADER IN DIALYSIS
© Vifor Pharma
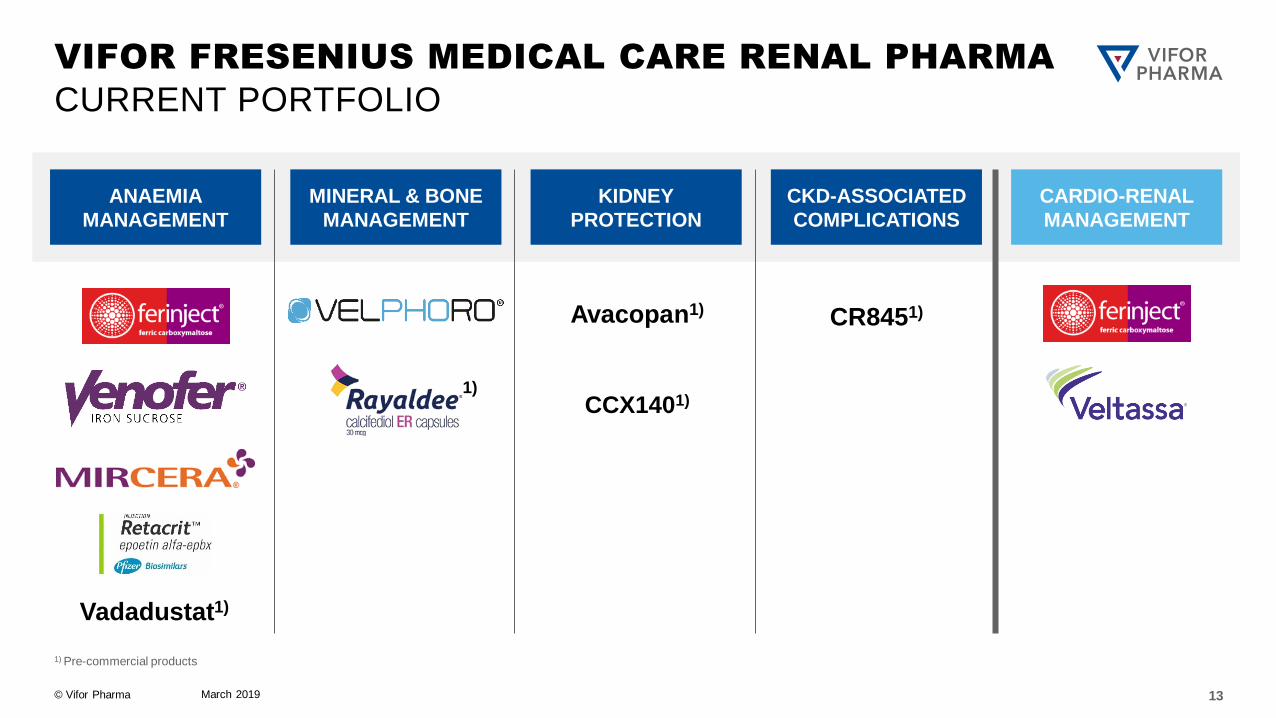
VIFOR FRESENIUS MEDICAL CARE RENAL PHARMA
CURRENT PORTFOLIO
March 2019 13
1) Pre-commercial products
CARDIO-RENAL
MANAGEMENT
MINERAL & BONE
MANAGEMENT
ANAEMIA
MANAGEMENT
KIDNEY
PROTECTION
Avacopan1)
1)
Vadadustat1)
CR8451)
CCX1401)
CKD-ASSOCIATED
COMPLICATIONS
© Vifor Pharma
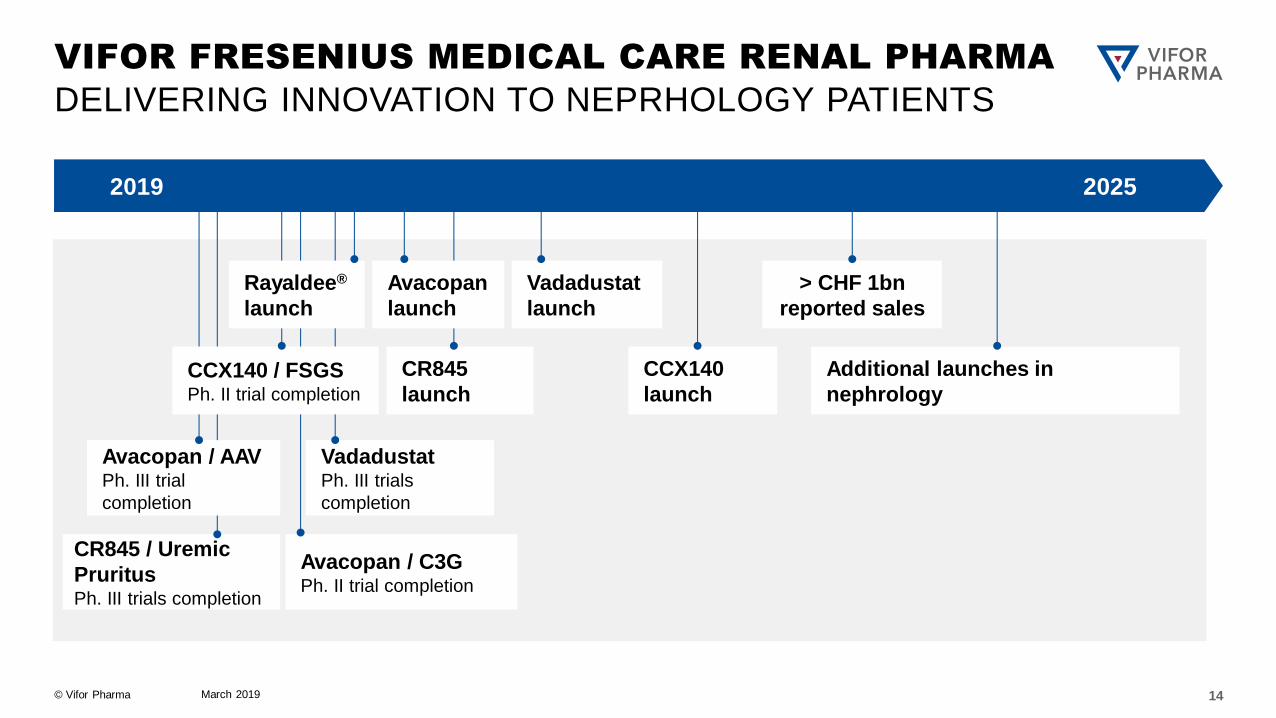
2020 2021 2022 2023 2024
March 2019 14
VIFOR FRESENIUS MEDICAL CARE RENAL PHARMA
DELIVERING INNOVATION TO NEPRHOLOGY PATIENTS
2019 2025
Additional launches in
nephrology
CR845
launch
Vadadustat
launch
CCX140
launch
Avacopan / C3G Ph. II trial completion
CR845 / Uremic
Pruritus Ph. III trials completion
Vadadustat Ph. III trials
completion
> CHF 1bn
reported sales
Avacopan
launch
Avacopan / AAV Ph. III trial
completion
CCX140 / FSGS Ph. II trial completion
Rayaldee®
launch
© Vifor Pharma
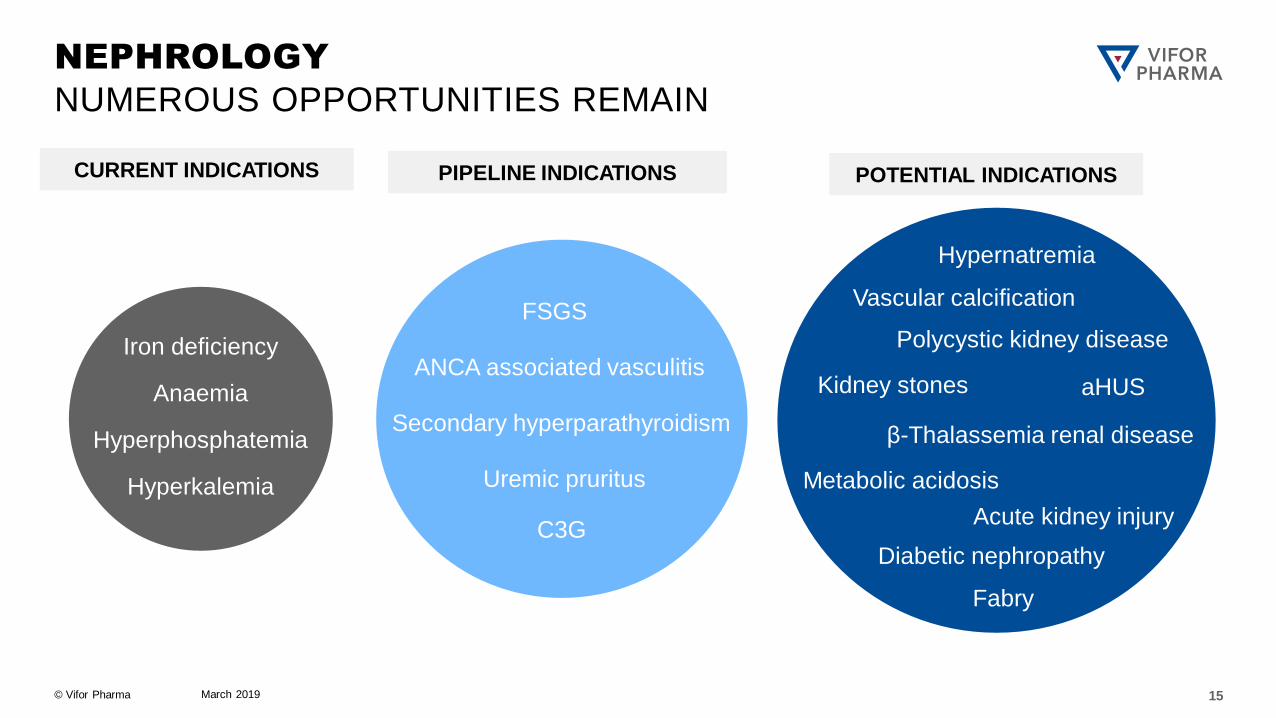
CURRENT INDICATIONS
March 2019
NEPHROLOGY
NUMEROUS OPPORTUNITIES REMAIN
Polycystic kidney disease
Metabolic acidosis
Vascular calcification
Kidney stones
Hypernatremia
Fabry
aHUS
Diabetic nephropathy
Acute kidney injury
β-Thalassemia renal disease
FSGS
ANCA associated vasculitis
Uremic pruritus
C3G
Secondary hyperparathyroidism Hyperphosphatemia
Hyperkalemia
Anaemia
Iron deficiency
PIPELINE INDICATIONS POTENTIAL INDICATIONS
15
© Vifor Pharma March 2019 16
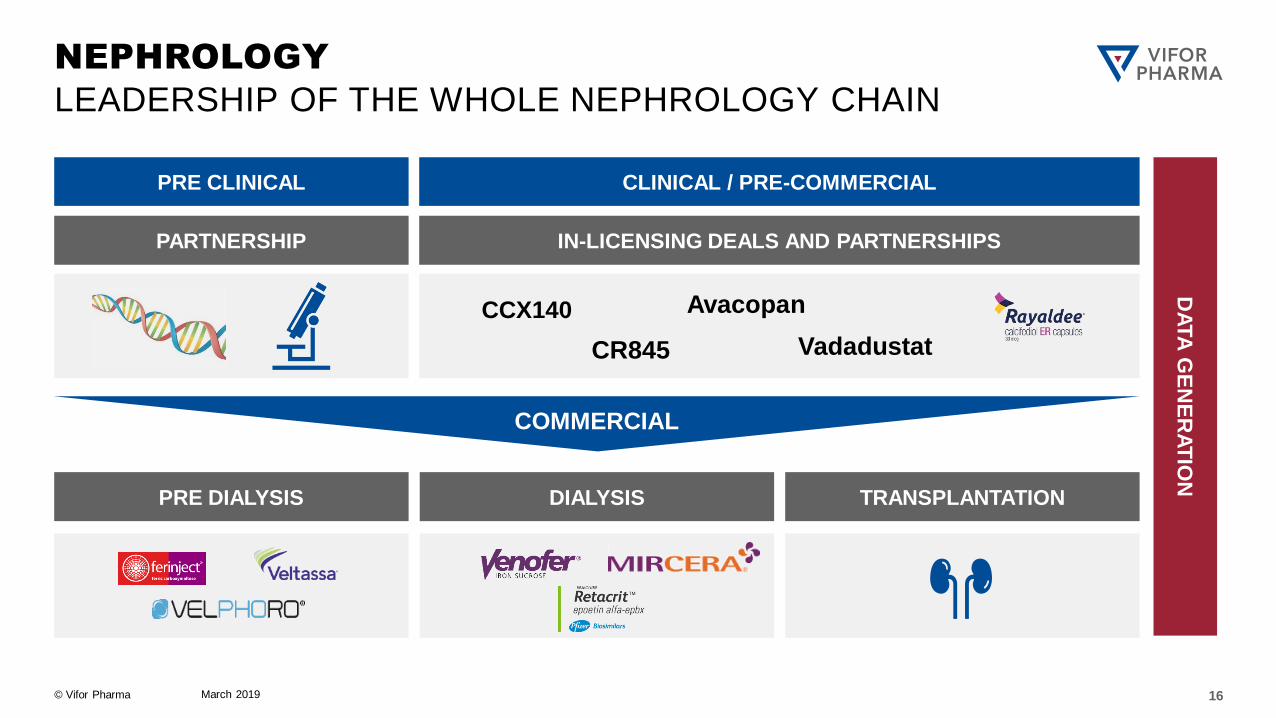
NEPHROLOGY
LEADERSHIP OF THE WHOLE NEPHROLOGY CHAIN
CLINICAL / PRE-COMMERCIAL
IN-LICENSING DEALS AND PARTNERSHIPS
Avacopan
Vadadustat CR845
CCX140
PRE CLINICAL
DA
TA
GE
NE
RA
TIO
N
PARTNERSHIP
TRANSPLANTATION
COMMERCIAL
PRE DIALYSIS DIALYSIS
© Vifor Pharma March 2019 17
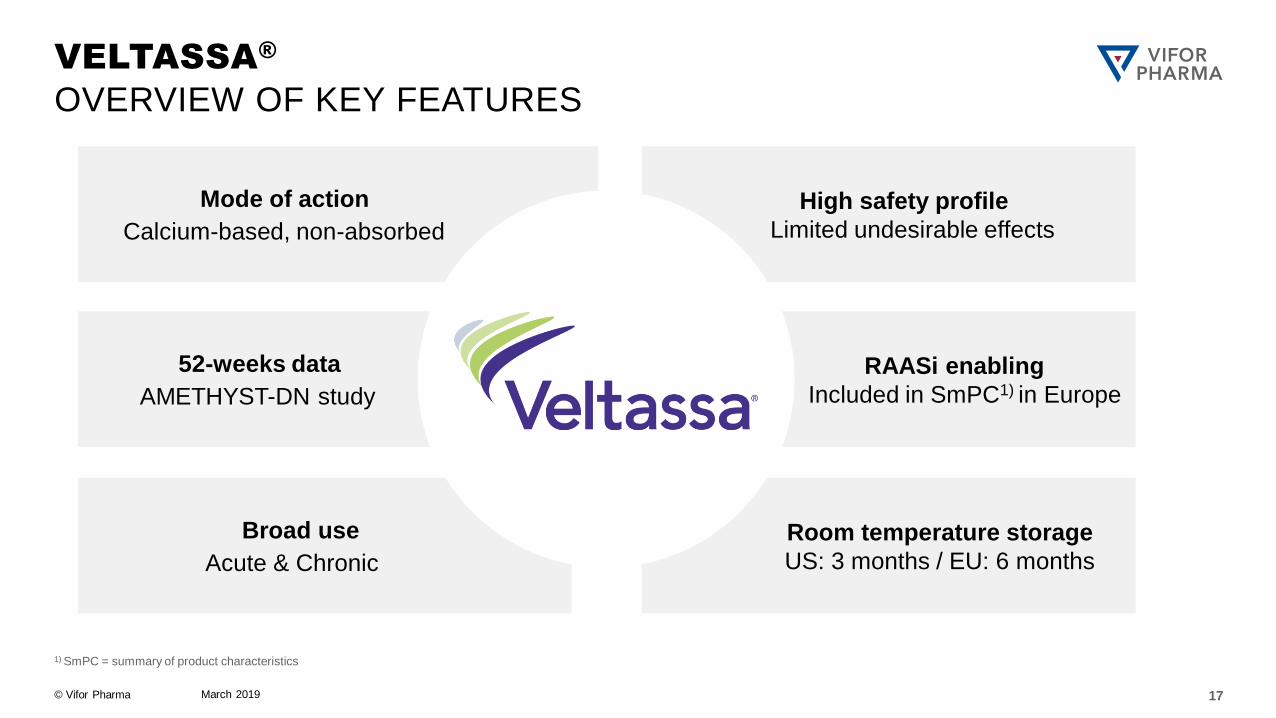
VELTASSA®
OVERVIEW OF KEY FEATURES
1) SmPC = summary of product characteristics
RAASi enabling
Included in SmPC1) in Europe
Room temperature storage
US: 3 months / EU: 6 months
High safety profile
Limited undesirable effects
Mode of action
Calcium-based, non-absorbed
Broad use
Acute & Chronic
52-weeks data
AMETHYST-DN study
© Vifor Pharma
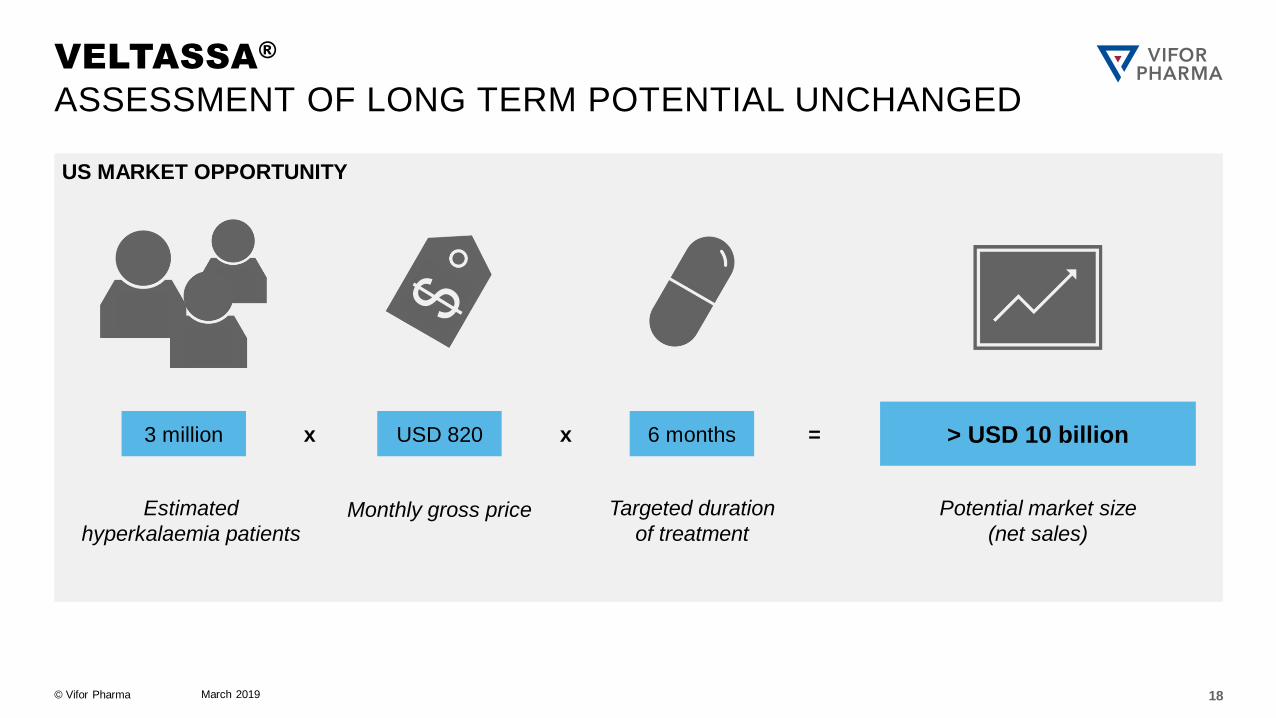
US MARKET OPPORTUNITY
March 2019 18
VELTASSA®
ASSESSMENT OF LONG TERM POTENTIAL UNCHANGED
3 million USD 820
Monthly gross price Estimated
hyperkalaemia patients
6 months
Targeted duration
of treatment
x x > USD 10 billion =
Potential market size
(net sales)
© Vifor Pharma
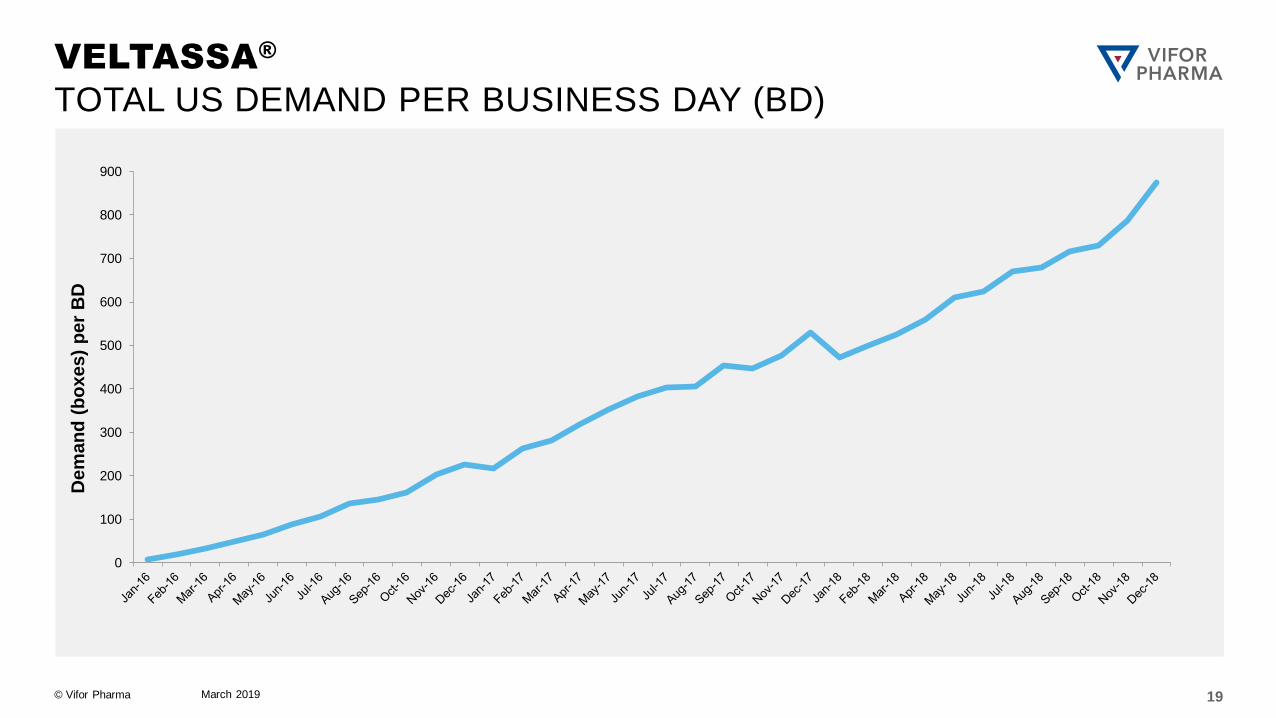
VELTASSA®
TOTAL US DEMAND PER BUSINESS DAY (BD)
19 March 2019
Dem
an
d (
bo
xes)
per
BD
0
100
200
300
400
500
600
700
800
900
© Vifor Pharma
2020 2021 2022 2023 2024
March 2019 20
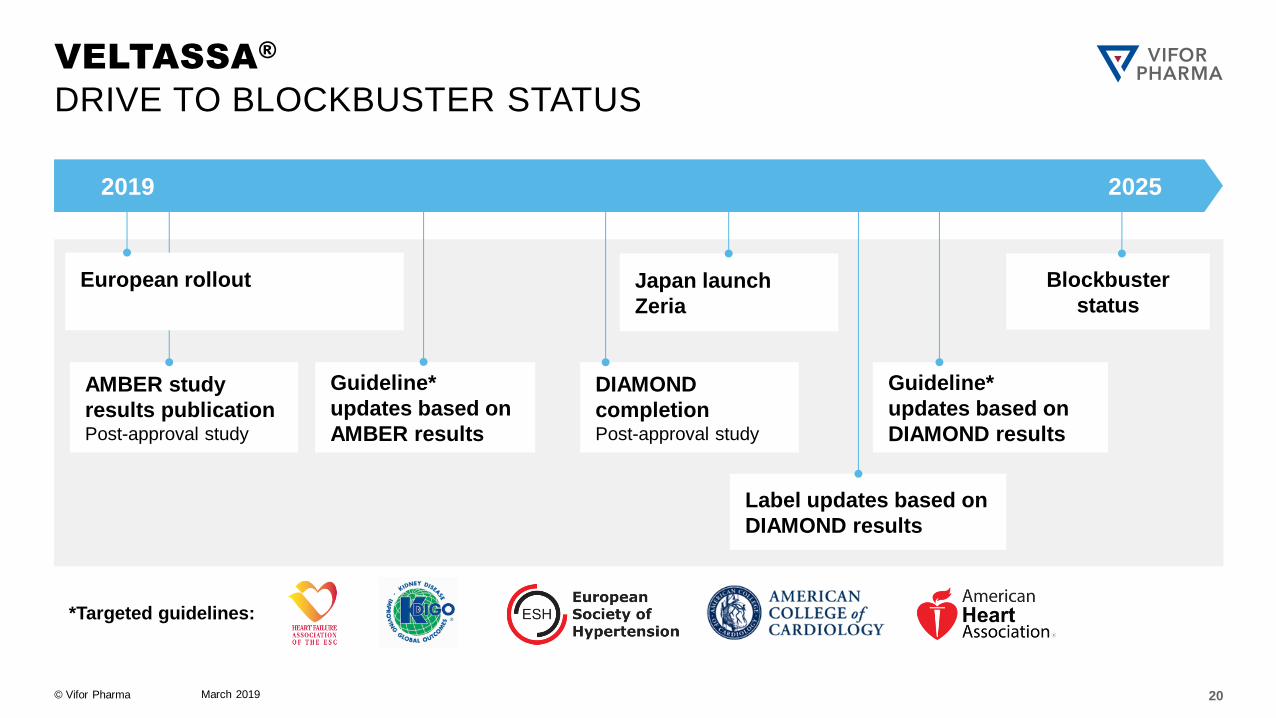
VELTASSA®
DRIVE TO BLOCKBUSTER STATUS
2019 2025
DIAMOND
completion Post-approval study
AMBER study
results publication Post-approval study
Label updates based on
DIAMOND results
Blockbuster
status
Guideline*
updates based on
AMBER results
Guideline*
updates based on
DIAMOND results
*Targeted guidelines:
European rollout
Japan launch
Zeria
© Vifor Pharma March 2019
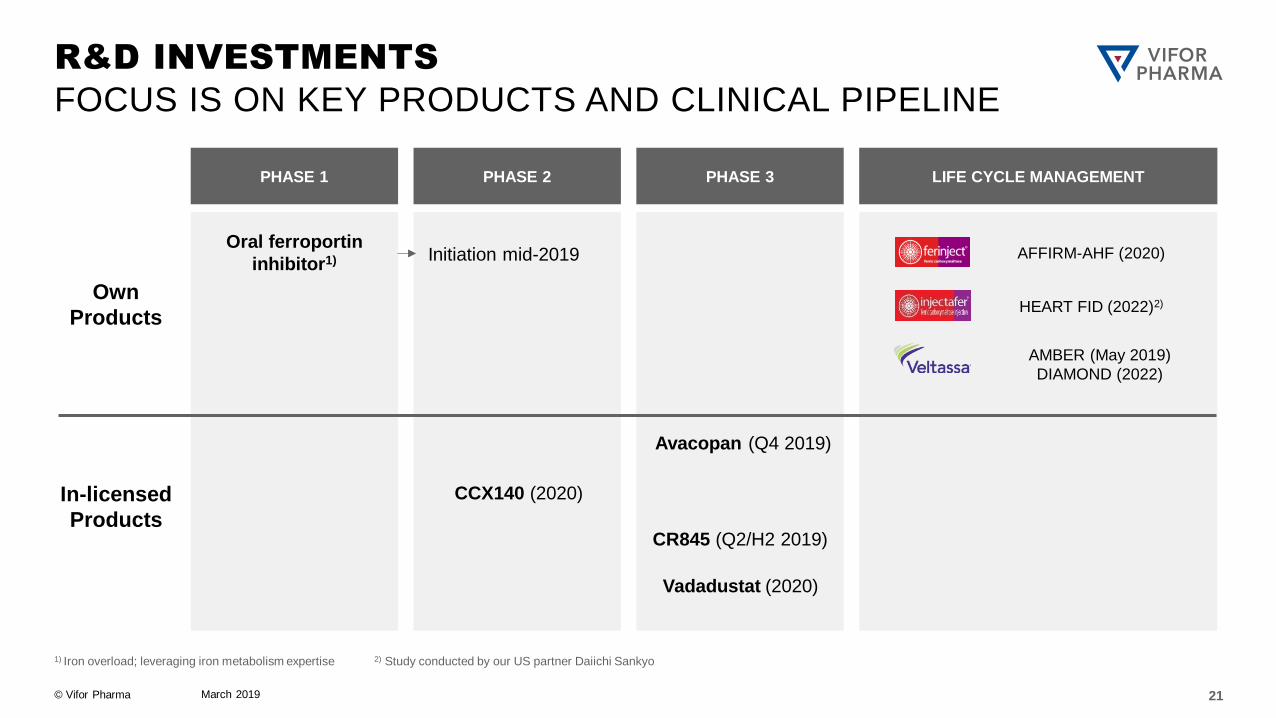
R&D INVESTMENTS
FOCUS IS ON KEY PRODUCTS AND CLINICAL PIPELINE
1) Iron overload; leveraging iron metabolism expertise 2) Study conducted by our US partner Daiichi Sankyo
PHASE 1 PHASE 2 PHASE 3 LIFE CYCLE MANAGEMENT
Own
Products
In-licensed
Products
Oral ferroportin
inhibitor1)
Avacopan (Q4 2019)
CCX140 (2020)
AFFIRM-AHF (2020)
AMBER (May 2019)
DIAMOND (2022)
Vadadustat (2020)
21
CR845 (Q2/H2 2019)
Initiation mid-2019
HEART FID (2022)2)
© Vifor Pharma
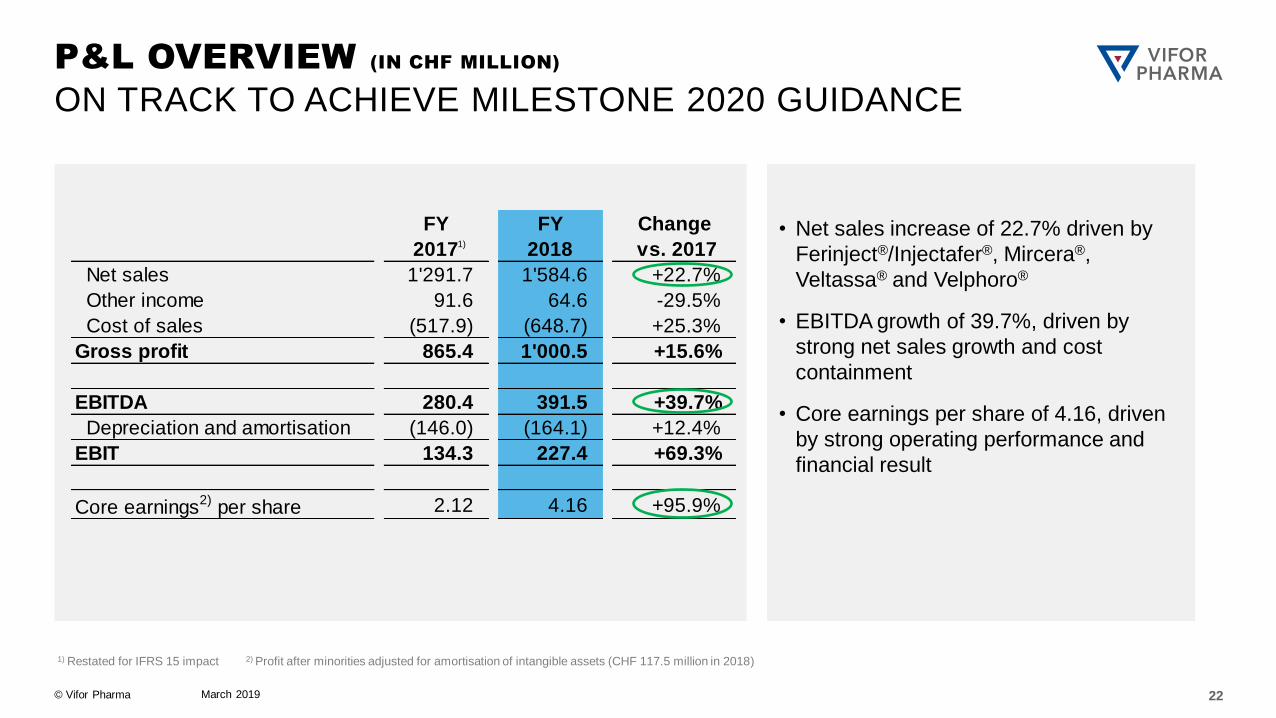
FY
2017
FY
2018
Change
vs. 2017
Net sales 1'291.7 1'584.6 +22.7%
Other income 91.6 64.6 -29.5%
Cost of sales (517.9) (648.7) +25.3%
Gross profit 865.4 1'000.5 +15.6%
EBITDA 280.4 391.5 +39.7%
Depreciation and amortisation (146.0) (164.1) +12.4%
EBIT 134.3 227.4 +69.3%
Core earnings2)
per share 2.12 4.16 +95.9%
March 2019 22
P&L OVERVIEW (IN CHF MILLION)
ON TRACK TO ACHIEVE MILESTONE 2020 GUIDANCE
1) Restated for IFRS 15 impact 2) Profit after minorities adjusted for amortisation of intangible assets (CHF 117.5 million in 2018)
• Net sales increase of 22.7% driven by
Ferinject®/Injectafer®, Mircera®,
Veltassa® and Velphoro®
• EBITDA growth of 39.7%, driven by
strong net sales growth and cost
containment
• Core earnings per share of 4.16, driven
by strong operating performance and
financial result
1)
© Vifor Pharma
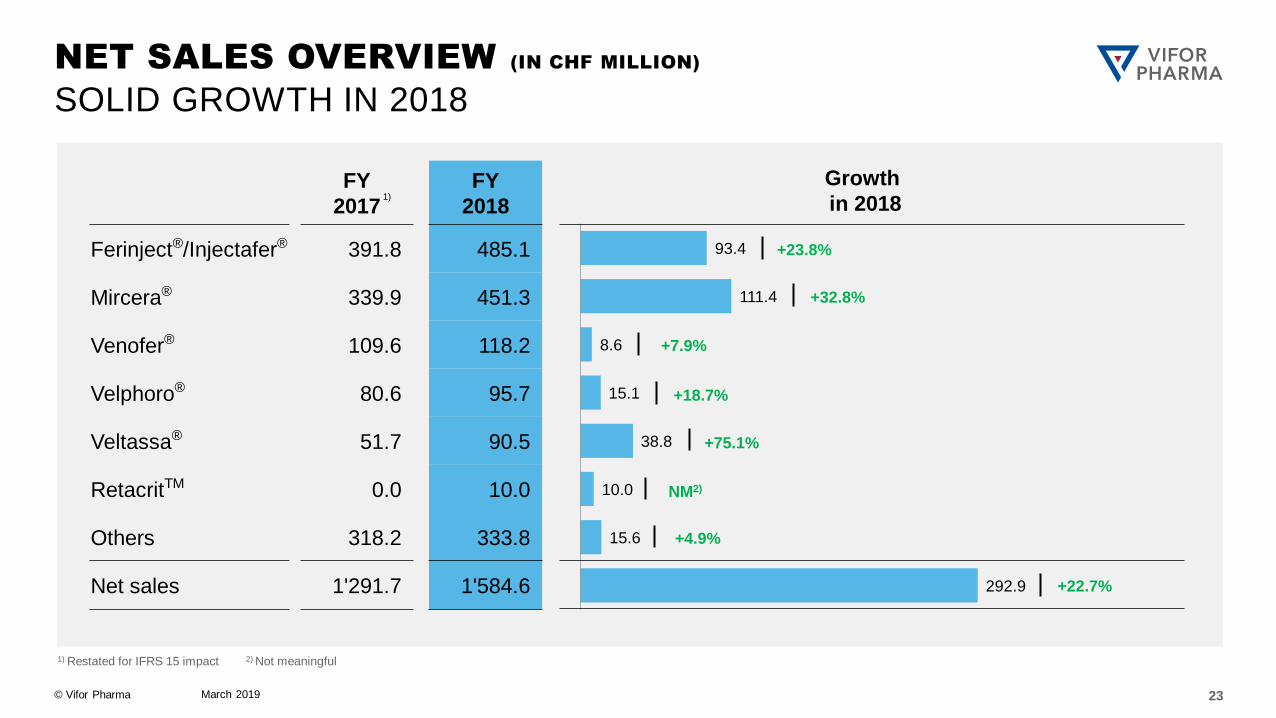
93.4
111.4
8.6
15.1
38.8
10.0
15.6
292.9
+23.8%
+32.8%
NM2)
+7.9%
+18.7%
+75.1%
+4.9%
+22.7%
March 2019 23
NET SALES OVERVIEW (IN CHF MILLION)
SOLID GROWTH IN 2018
FY
2017
FY
2018
Ferinject®/Injectafer® 391.8 485.1
Mircera® 339.9 451.3
Venofer® 109.6 118.2
Velphoro® 80.6 95.7
Veltassa® 51.7 90.5
RetacritTM 0.0 10.0
Others 318.2 333.8
Net sales 1'291.7 1'584.6
Growth
in 2018
1) Restated for IFRS 15 impact 2) Not meaningful
1)
© Vifor Pharma
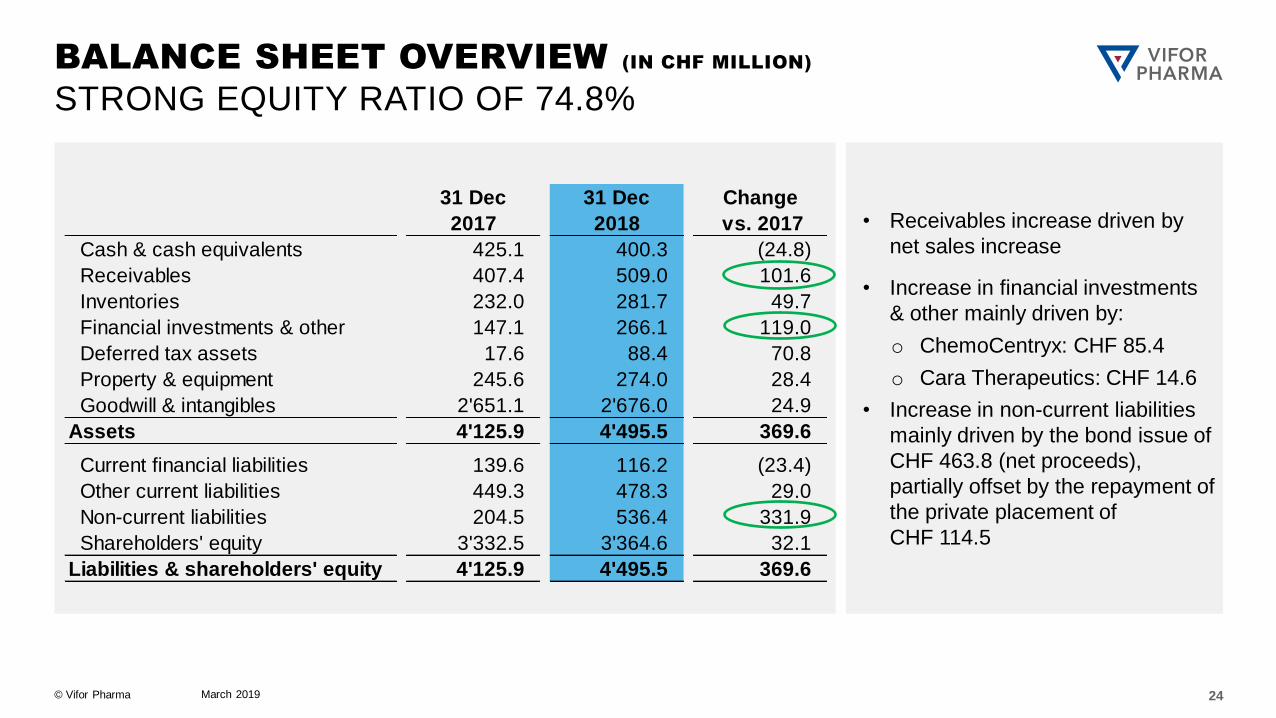
31 Dec
2017
31 Dec
2018
Change
vs. 2017
Cash & cash equivalents 425.1 400.3 (24.8)
Receivables 407.4 509.0 101.6
Inventories 232.0 281.7 49.7
Financial investments & other 147.1 266.1 119.0
Deferred tax assets 17.6 88.4 70.8
Property & equipment 245.6 274.0 28.4
Goodwill & intangibles 2'651.1 2'676.0 24.9
Assets 4'125.9 4'495.5 369.6
Current financial liabilities 139.6 116.2 (23.4)
Other current liabilities 449.3 478.3 29.0
Non-current liabilities 204.5 536.4 331.9
Shareholders' equity 3'332.5 3'364.6 32.1
Liabilities & shareholders' equity 4'125.9 4'495.5 369.6
• Receivables increase driven by
net sales increase
• Increase in financial investments
& other mainly driven by:
o ChemoCentryx: CHF 85.4
o Cara Therapeutics: CHF 14.6
• Increase in non-current liabilities
mainly driven by the bond issue of
CHF 463.8 (net proceeds),
partially offset by the repayment of
the private placement of
CHF 114.5
March 2019 24
BALANCE SHEET OVERVIEW (IN CHF MILLION)
STRONG EQUITY RATIO OF 74.8%
© Vifor Pharma
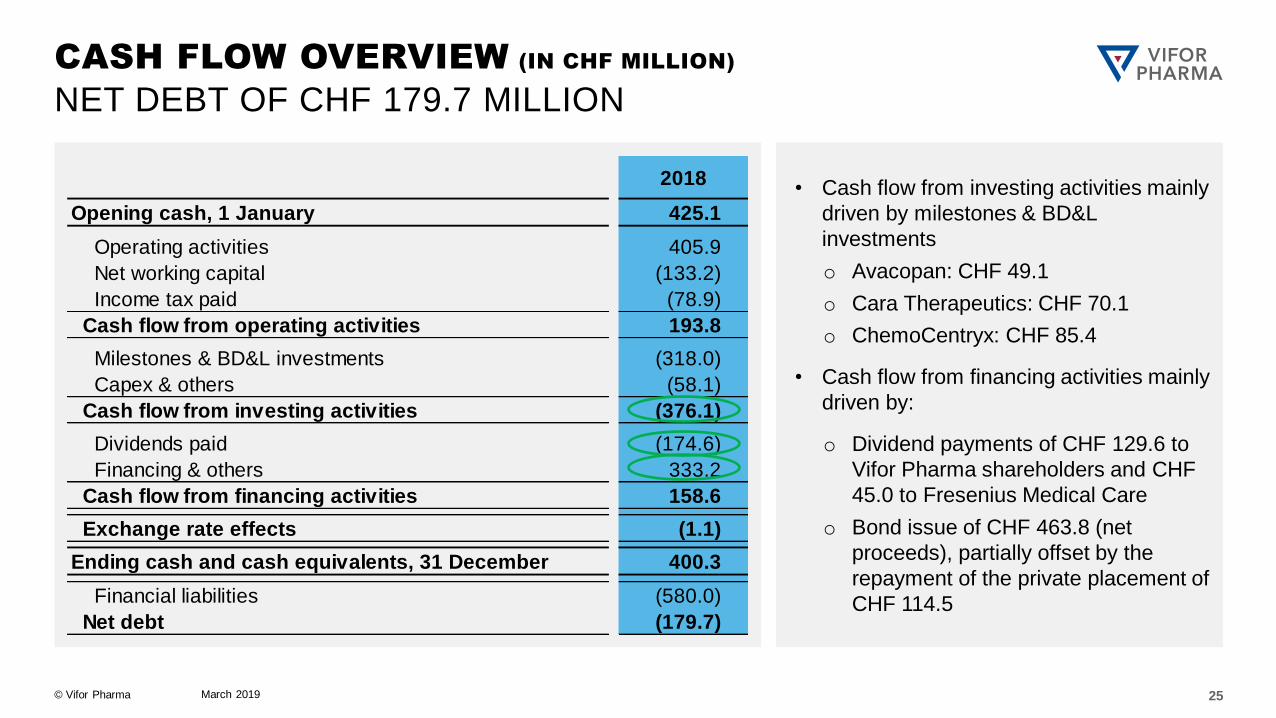
2018
Opening cash, 1 January 425.1
Operating activities 405.9
Net working capital (133.2)
Income tax paid (78.9)
Cash flow from operating activities 193.8
Milestones & BD&L investments (318.0)
Capex & others (58.1)
Cash flow from investing activities (376.1)
Dividends paid (174.6)
Financing & others 333.2
Cash flow from financing activities 158.6
Exchange rate effects (1.1)
Ending cash and cash equivalents, 31 December 400.3
Financial liabilities (580.0)
Net debt (179.7)
• Cash flow from investing activities mainly
driven by milestones & BD&L
investments
o Avacopan: CHF 49.1
o Cara Therapeutics: CHF 70.1
o ChemoCentryx: CHF 85.4
• Cash flow from financing activities mainly
driven by:
o Dividend payments of CHF 129.6 to
Vifor Pharma shareholders and CHF
45.0 to Fresenius Medical Care
o Bond issue of CHF 463.8 (net
proceeds), partially offset by the
repayment of the private placement of
CHF 114.5
CASH FLOW OVERVIEW (IN CHF MILLION)
NET DEBT OF CHF 179.7 MILLION
25 March 2019
© Vifor Pharma
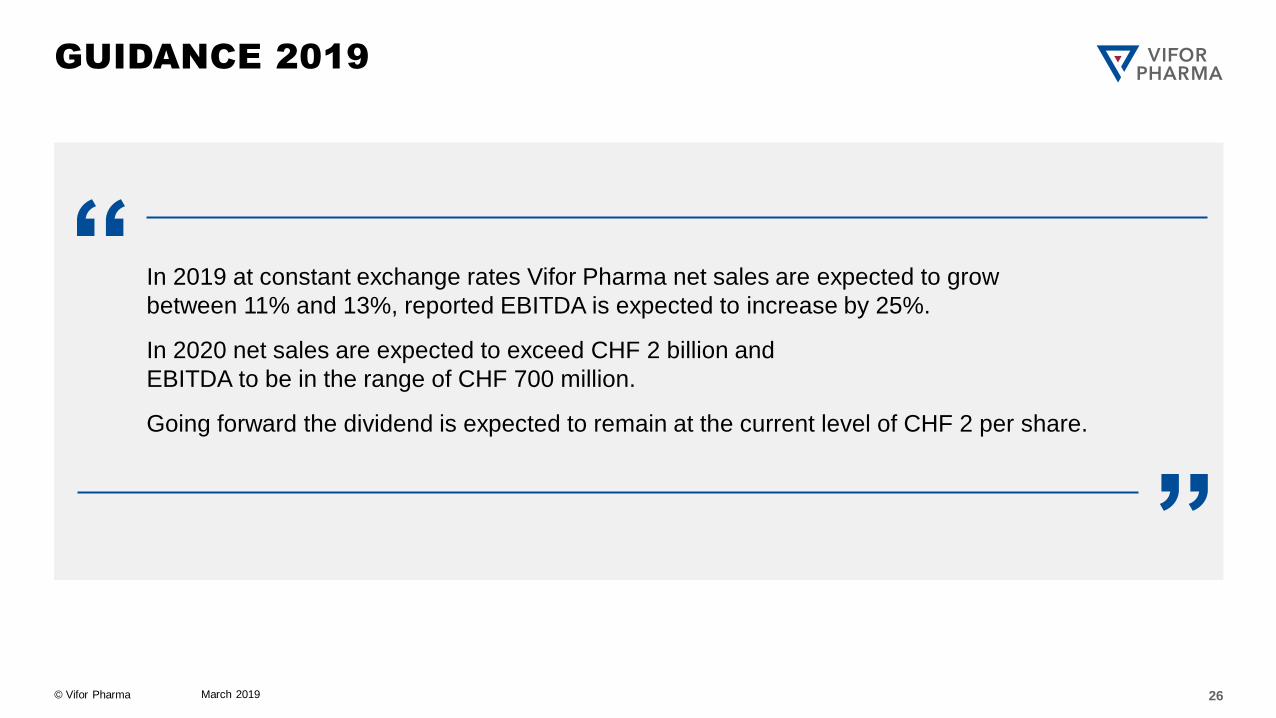
GUIDANCE 2019
In 2019 at constant exchange rates Vifor Pharma net sales are expected to grow
between 11% and 13%, reported EBITDA is expected to increase by 25%.
In 2020 net sales are expected to exceed CHF 2 billion and
EBITDA to be in the range of CHF 700 million.
Going forward the dividend is expected to remain at the current level of CHF 2 per share.
26 March 2019
© Vifor Pharma
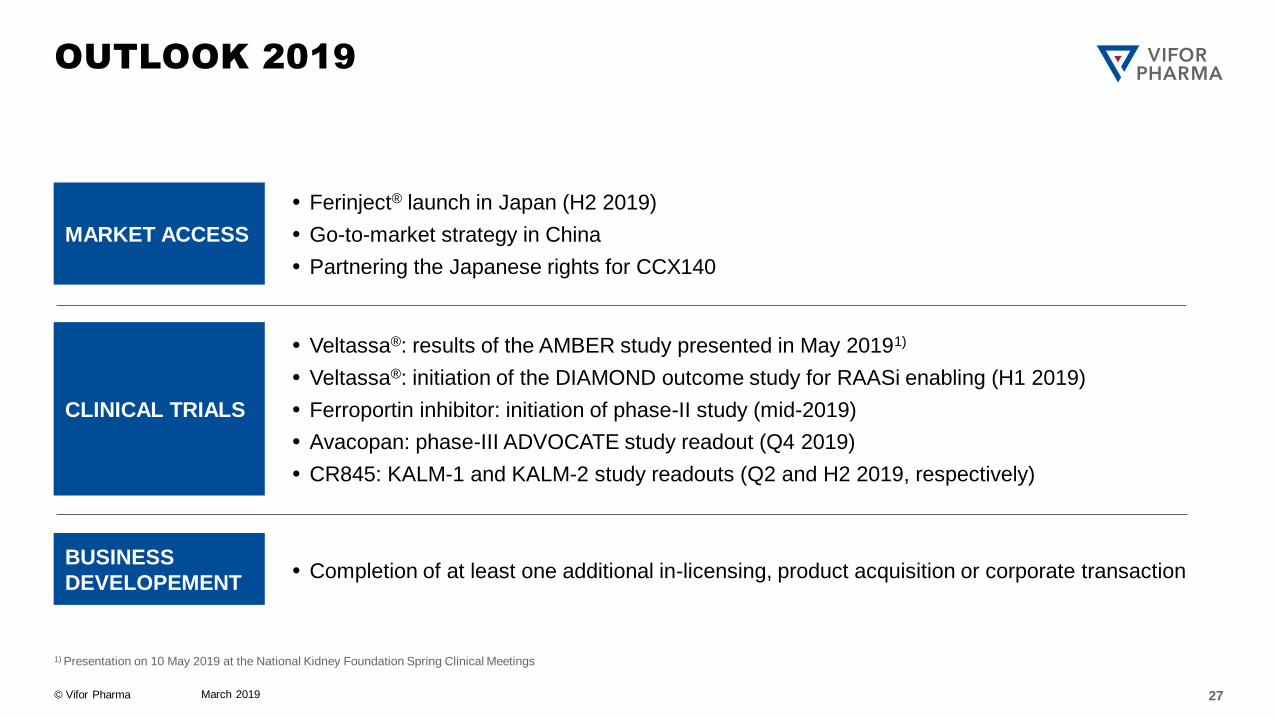
OUTLOOK 2019
1) Presentation on 10 May 2019 at the National Kidney Foundation Spring Clinical Meetings
CLINICAL TRIALS
MARKET ACCESS
Veltassa®: results of the AMBER study presented in May 20191)
Veltassa®: initiation of the DIAMOND outcome study for RAASi enabling (H1 2019)
Ferroportin inhibitor: initiation of phase-II study (mid-2019)
Avacopan: phase-III ADVOCATE study readout (Q4 2019)
CR845: KALM-1 and KALM-2 study readouts (Q2 and H2 2019, respectively)
Ferinject® launch in Japan (H2 2019)
Go-to-market strategy in China
Partnering the Japanese rights for CCX140
BUSINESS
DEVELOPEMENT Completion of at least one additional in-licensing, product acquisition or corporate transaction
March 2019 27
© Vifor Pharma
CONTACT INFORMATION
Colin Bond – CFO
Phone: +41 58 851 83 53
Email: [email protected]
INVESTOR RELATIONS
Julien Vignot – Head of Investor Relations
Phone: +41 58 851 66 90
Email: [email protected]
Laurent de Weck – Investor Relations Manager
Phone: +41 58 851 80 95
Email: [email protected]
March 2019 28
© Vifor Pharma
DISCLAIMER
Certain statements, beliefs and opinions in this presentation are forward-looking, which reflect the Company’s or, as
appropriate, the Company’s directors’ current expectations and projections about future events. By their nature, forward-
looking statements involve a number of risks, uncertainties and assumptions that could cause actual results or events to
differ materially from those expressed or implied by the forward-looking statements. These risks, uncertainties and
assumptions could adversely affect the outcome and financial effects of the plans and events described herein. A multitude
of factors including, but not limited to, changes in demand, competition and technology, can cause actual events,
performance or results to differ significantly from any anticipated development. Forward-looking statements contained
in this presentation regarding past trends or activities should not be taken as a representation that such trends or activities
will continue in the future. As a result, the Company expressly disclaims any obligation or undertaking to release any update
or revisions to any forward-looking statements in this presentation as a result of any change in expectations or any change
in events, conditions, assumptions or circumstances on which these forward-looking statements are based. Neither the
Company nor its advisers or representatives nor any of its of their parent or subsidiary undertakings or any such person’s
officers or employees guarantees that the assumptions underlying such forward-looking statements are free from errors
nor does either accept any responsibility for the future accuracy of the forward-looking statements contained in this
presentation or the actual occurrence of the forecasted developments. You should not place undue reliance on forward-
looking statements, which speak only as of the date of this presentation.
March 2019 29